

Structural Performance of Waste Plastic Bottles Modified Asphalt: A Review
 , ,
, ,  , and
, and
Abstract
:1. Introduction
2. Plastics
- Thermosetting polymers
- Thermoplastics
2.1. Methods of Mixing
- Wet Process (addition of latex polymers).
- Dry Process (addition of solid polymers).
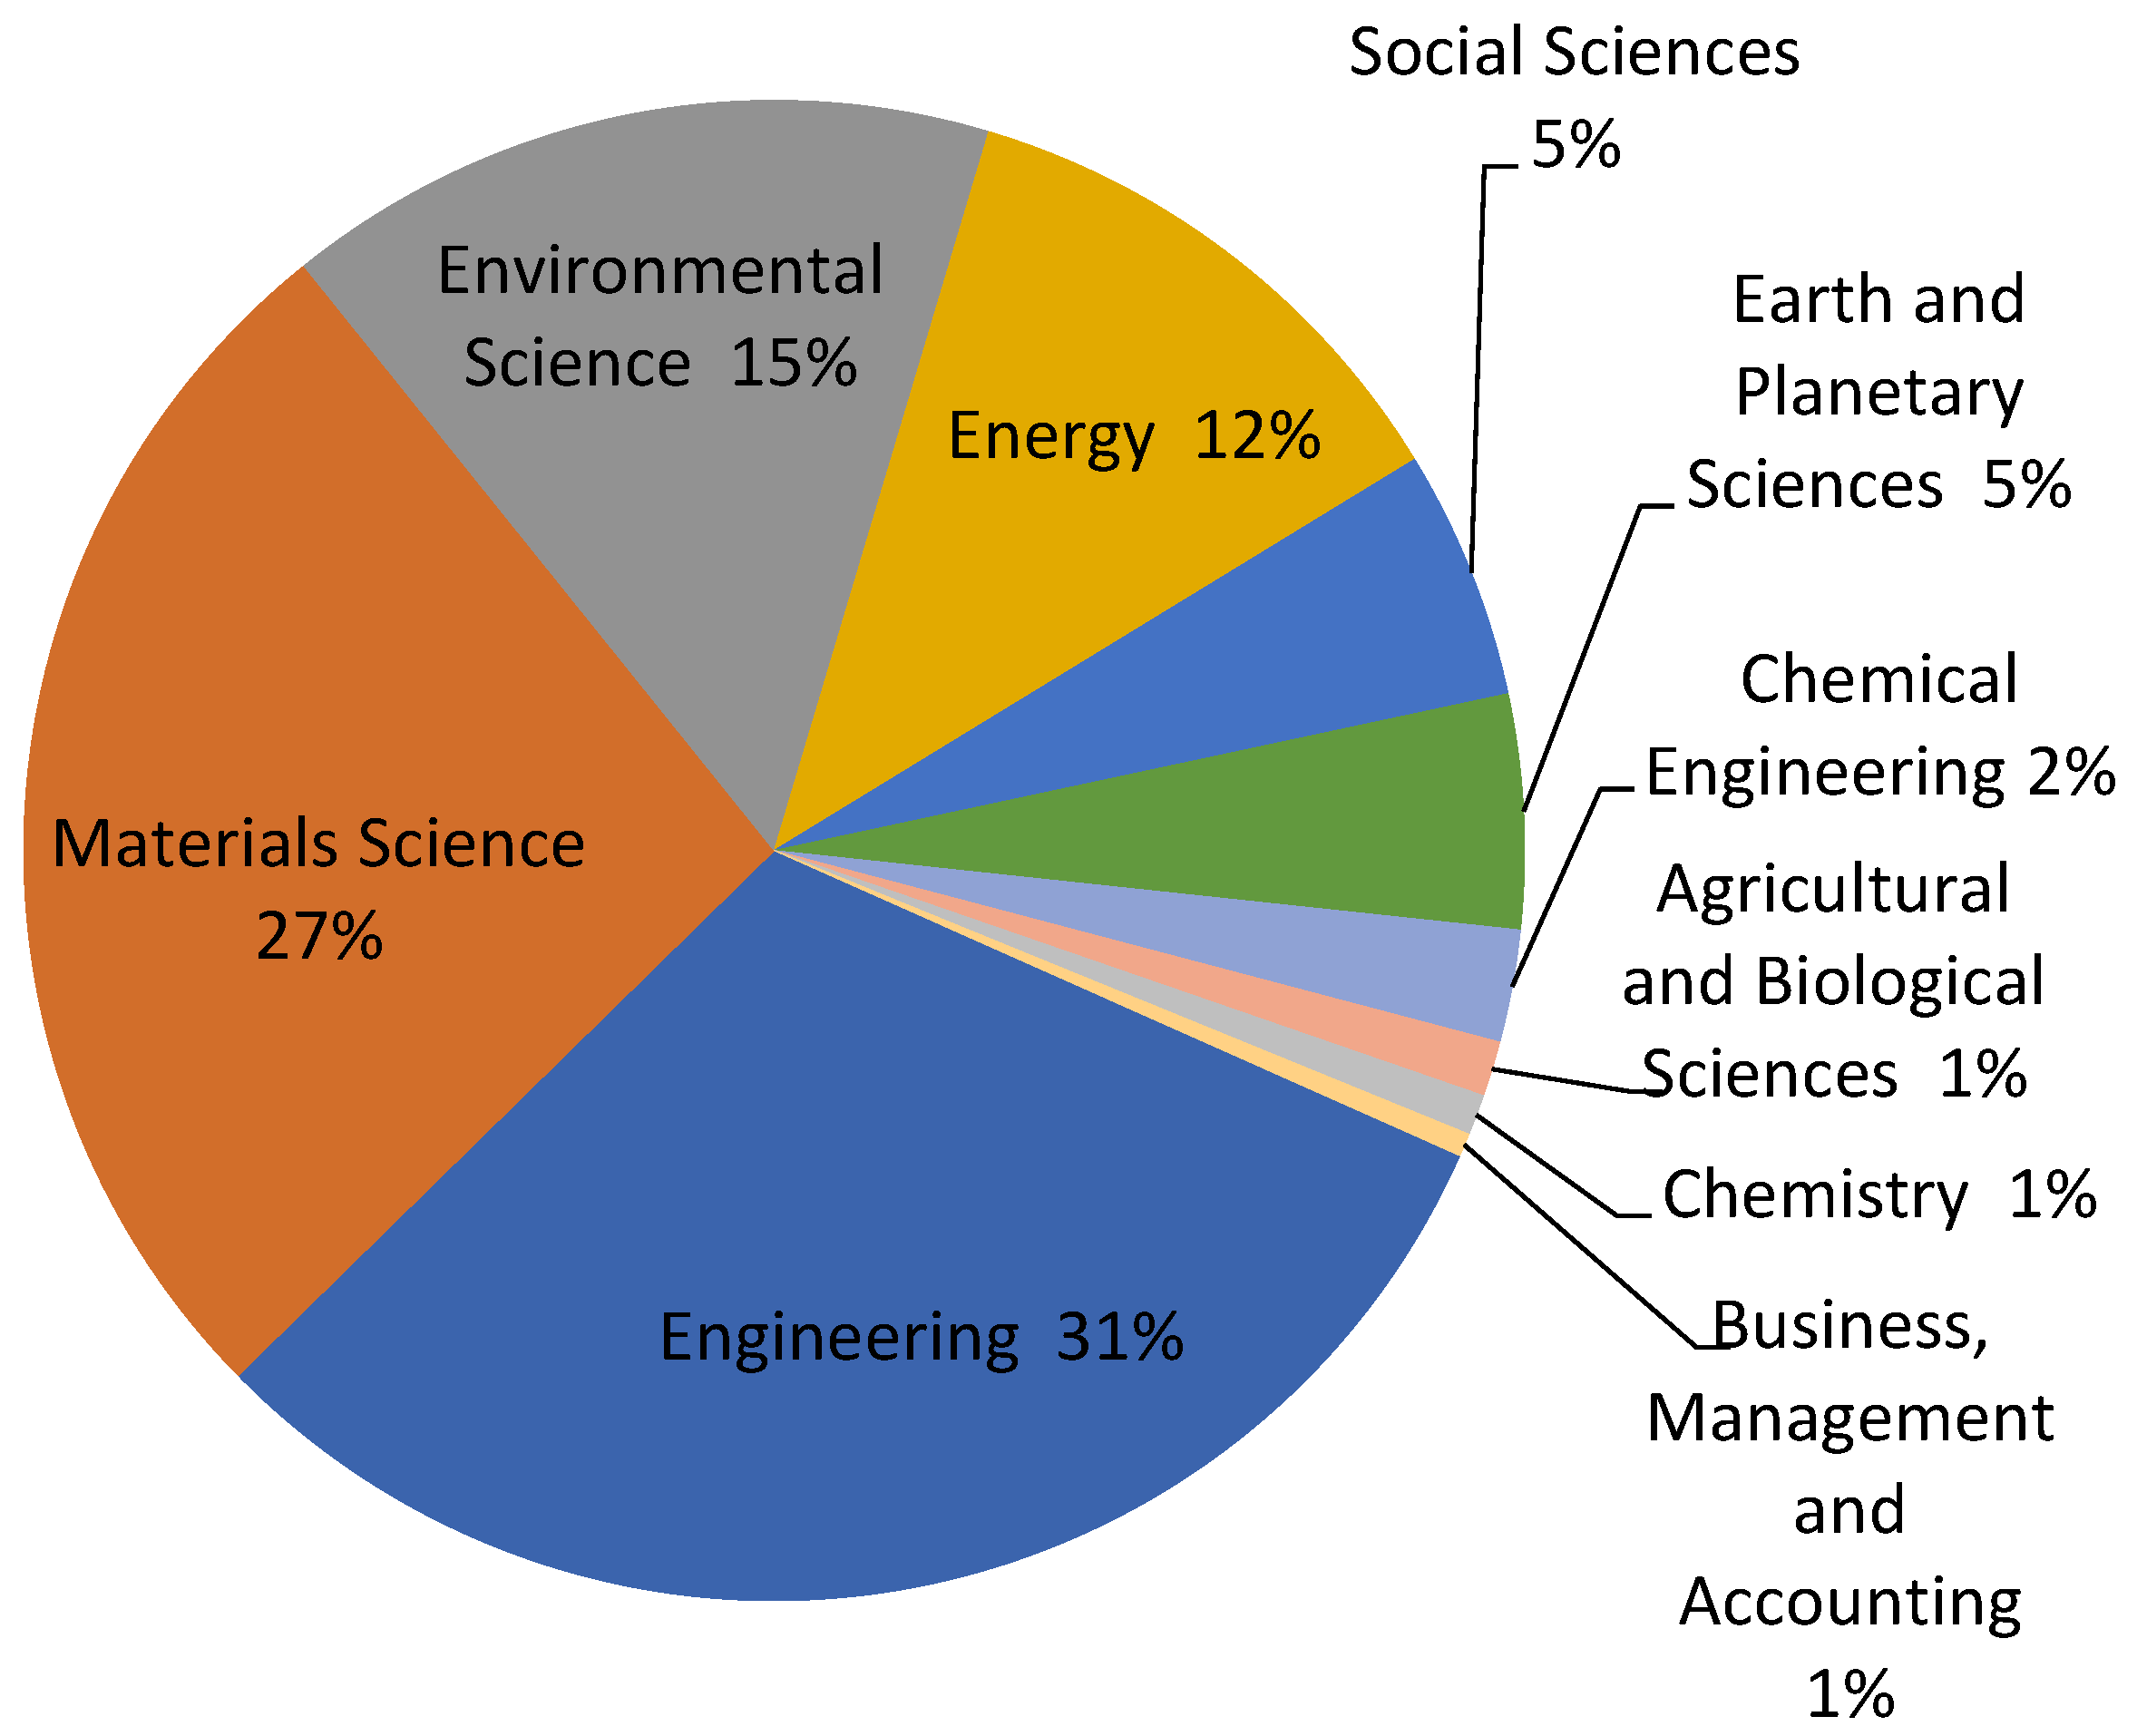
2.2. Publications and Subject Areas
3. Tests for PET Asphalt
- Tests for Bituminous Mix
- Marshall Stability;
- Marshall Flow;
- Marshall Quotient;
- Bulk Specific Gravity;
- Stiffness;
- Air Voids;
- Indirect Tensile Strength (ITS);
- Wheel Track Test;
- Resilient Modulus (MR);
- Drain Down Test;
- Density;
- Dynamic Creep;
- Fatigue.
- Tests for Aggregate
- Aggregate Impact Value Test;
- Aggregate Crushing Value;
- Water Absorption;
- Stripping Value;
- LOS Angeles Abrasion Test;
- Specific Gravity;
- Voids in Mineral Aggregate (VMA);
- Voids Filled with Bitumen (VFA);
- Voids in Total Mix (VTM).
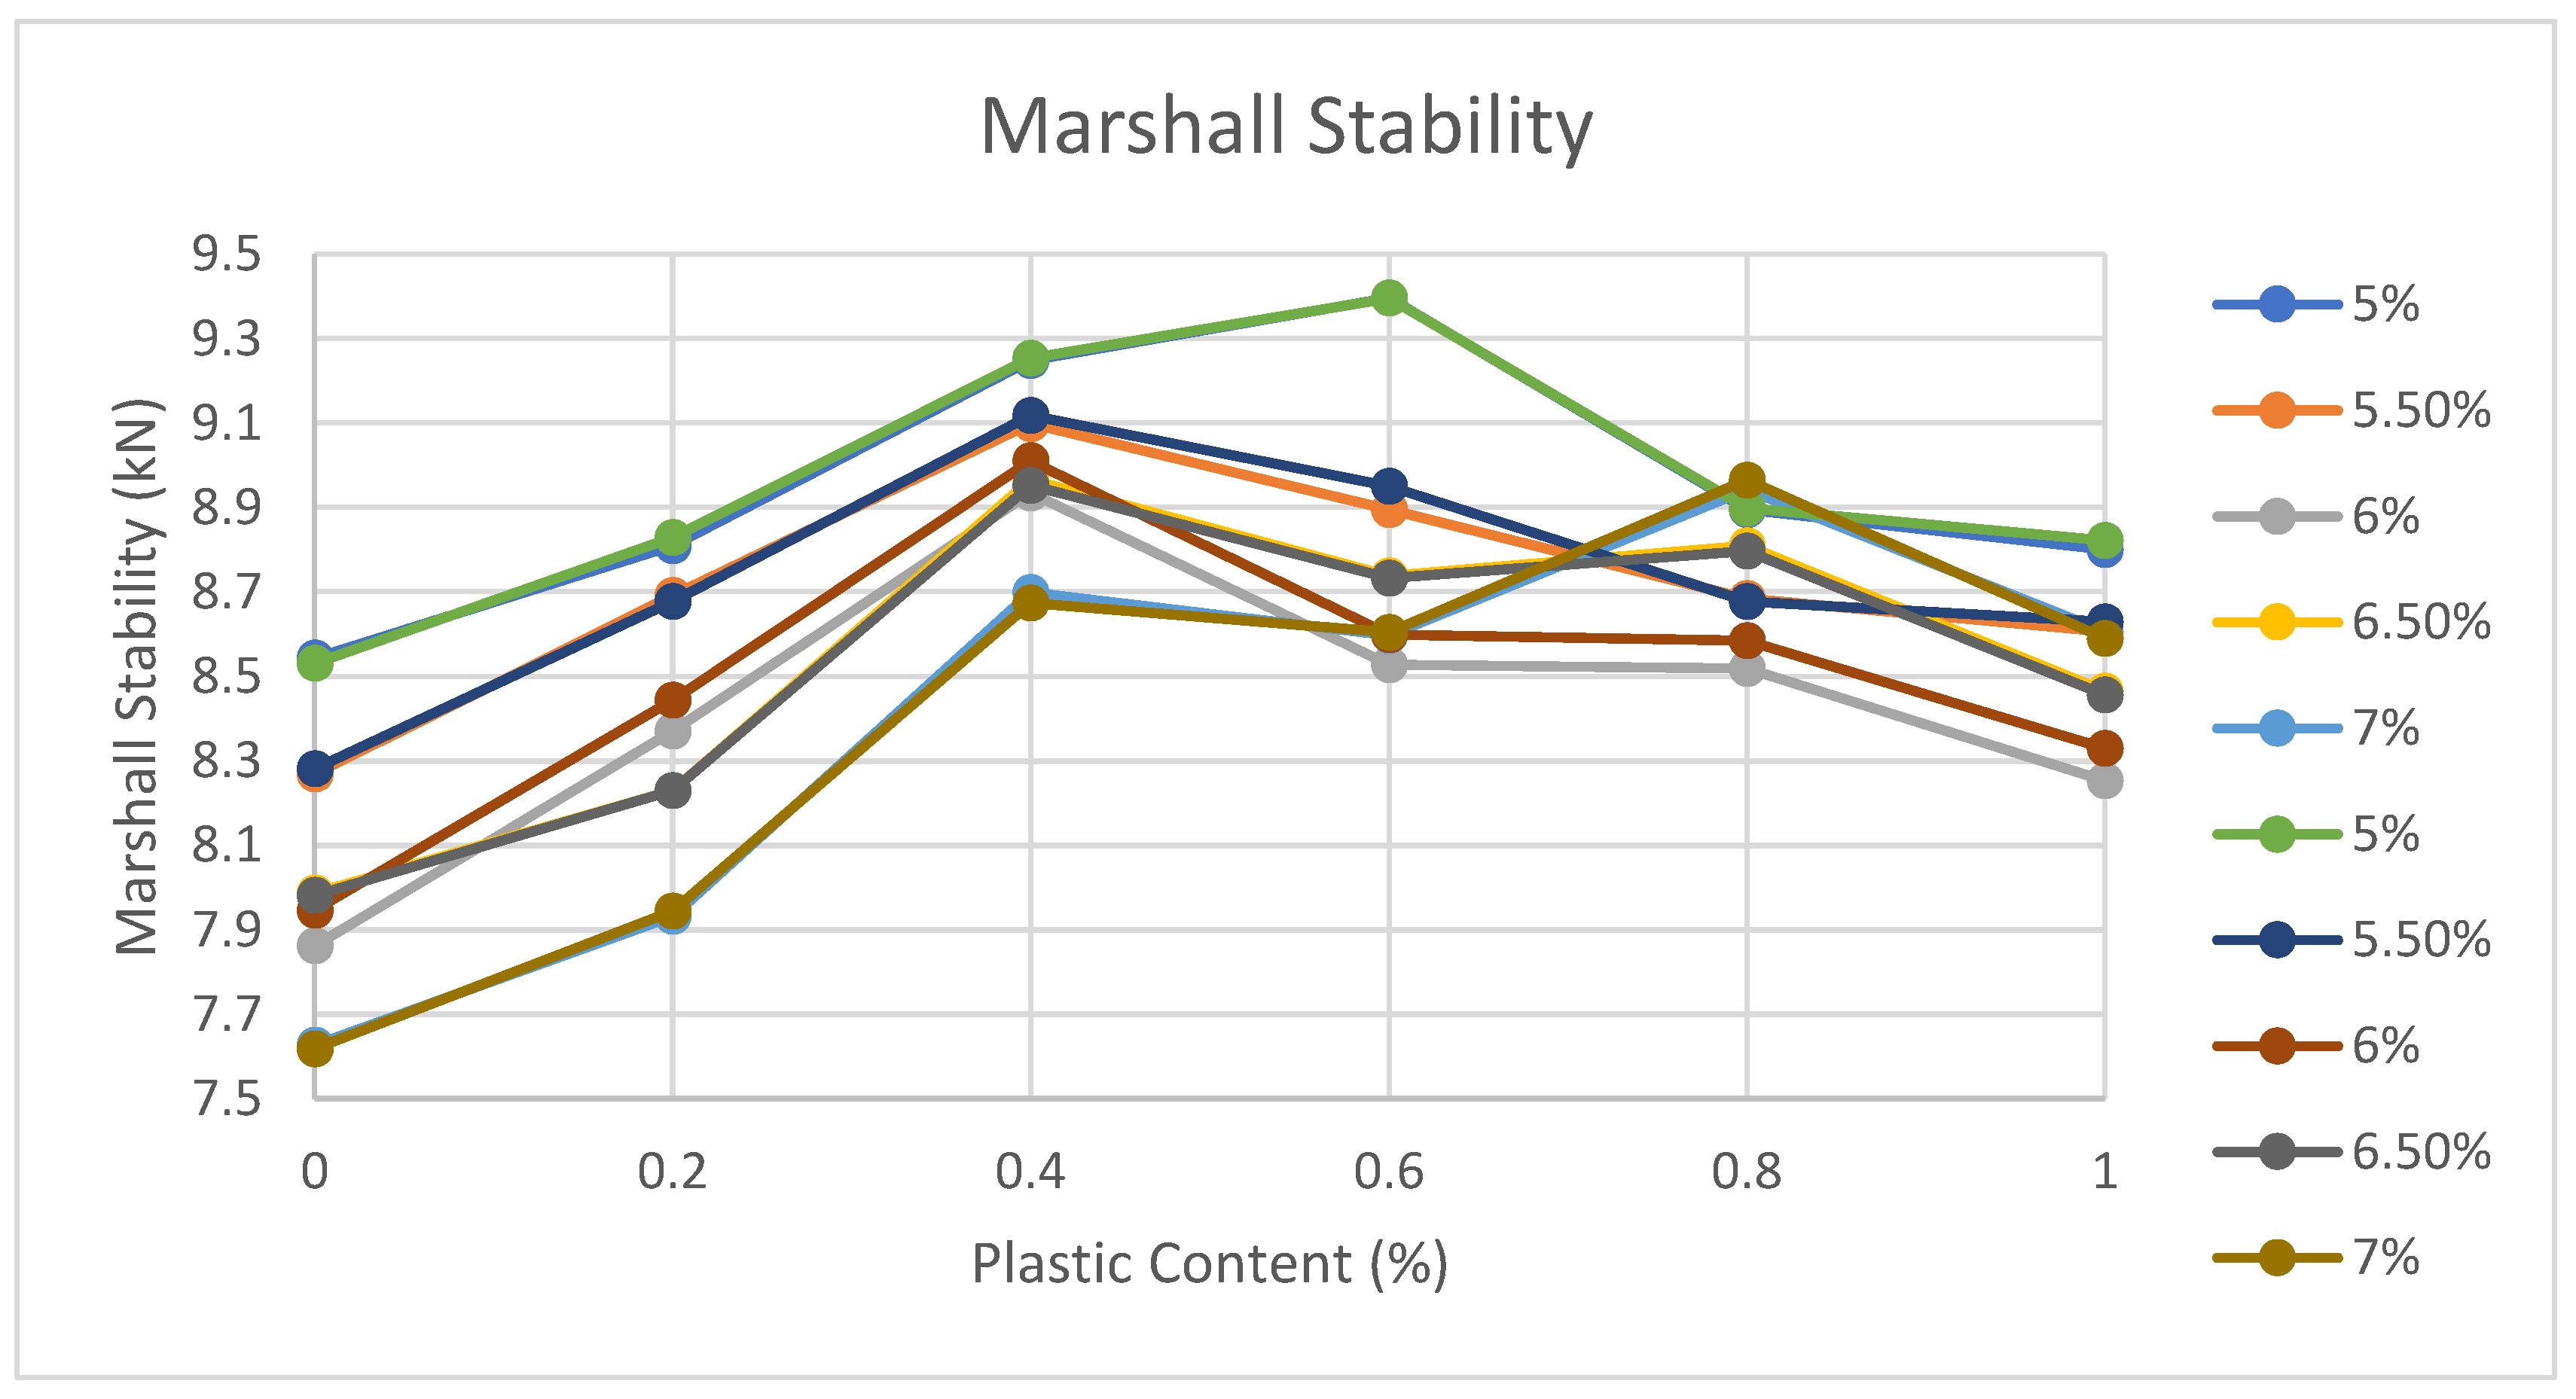
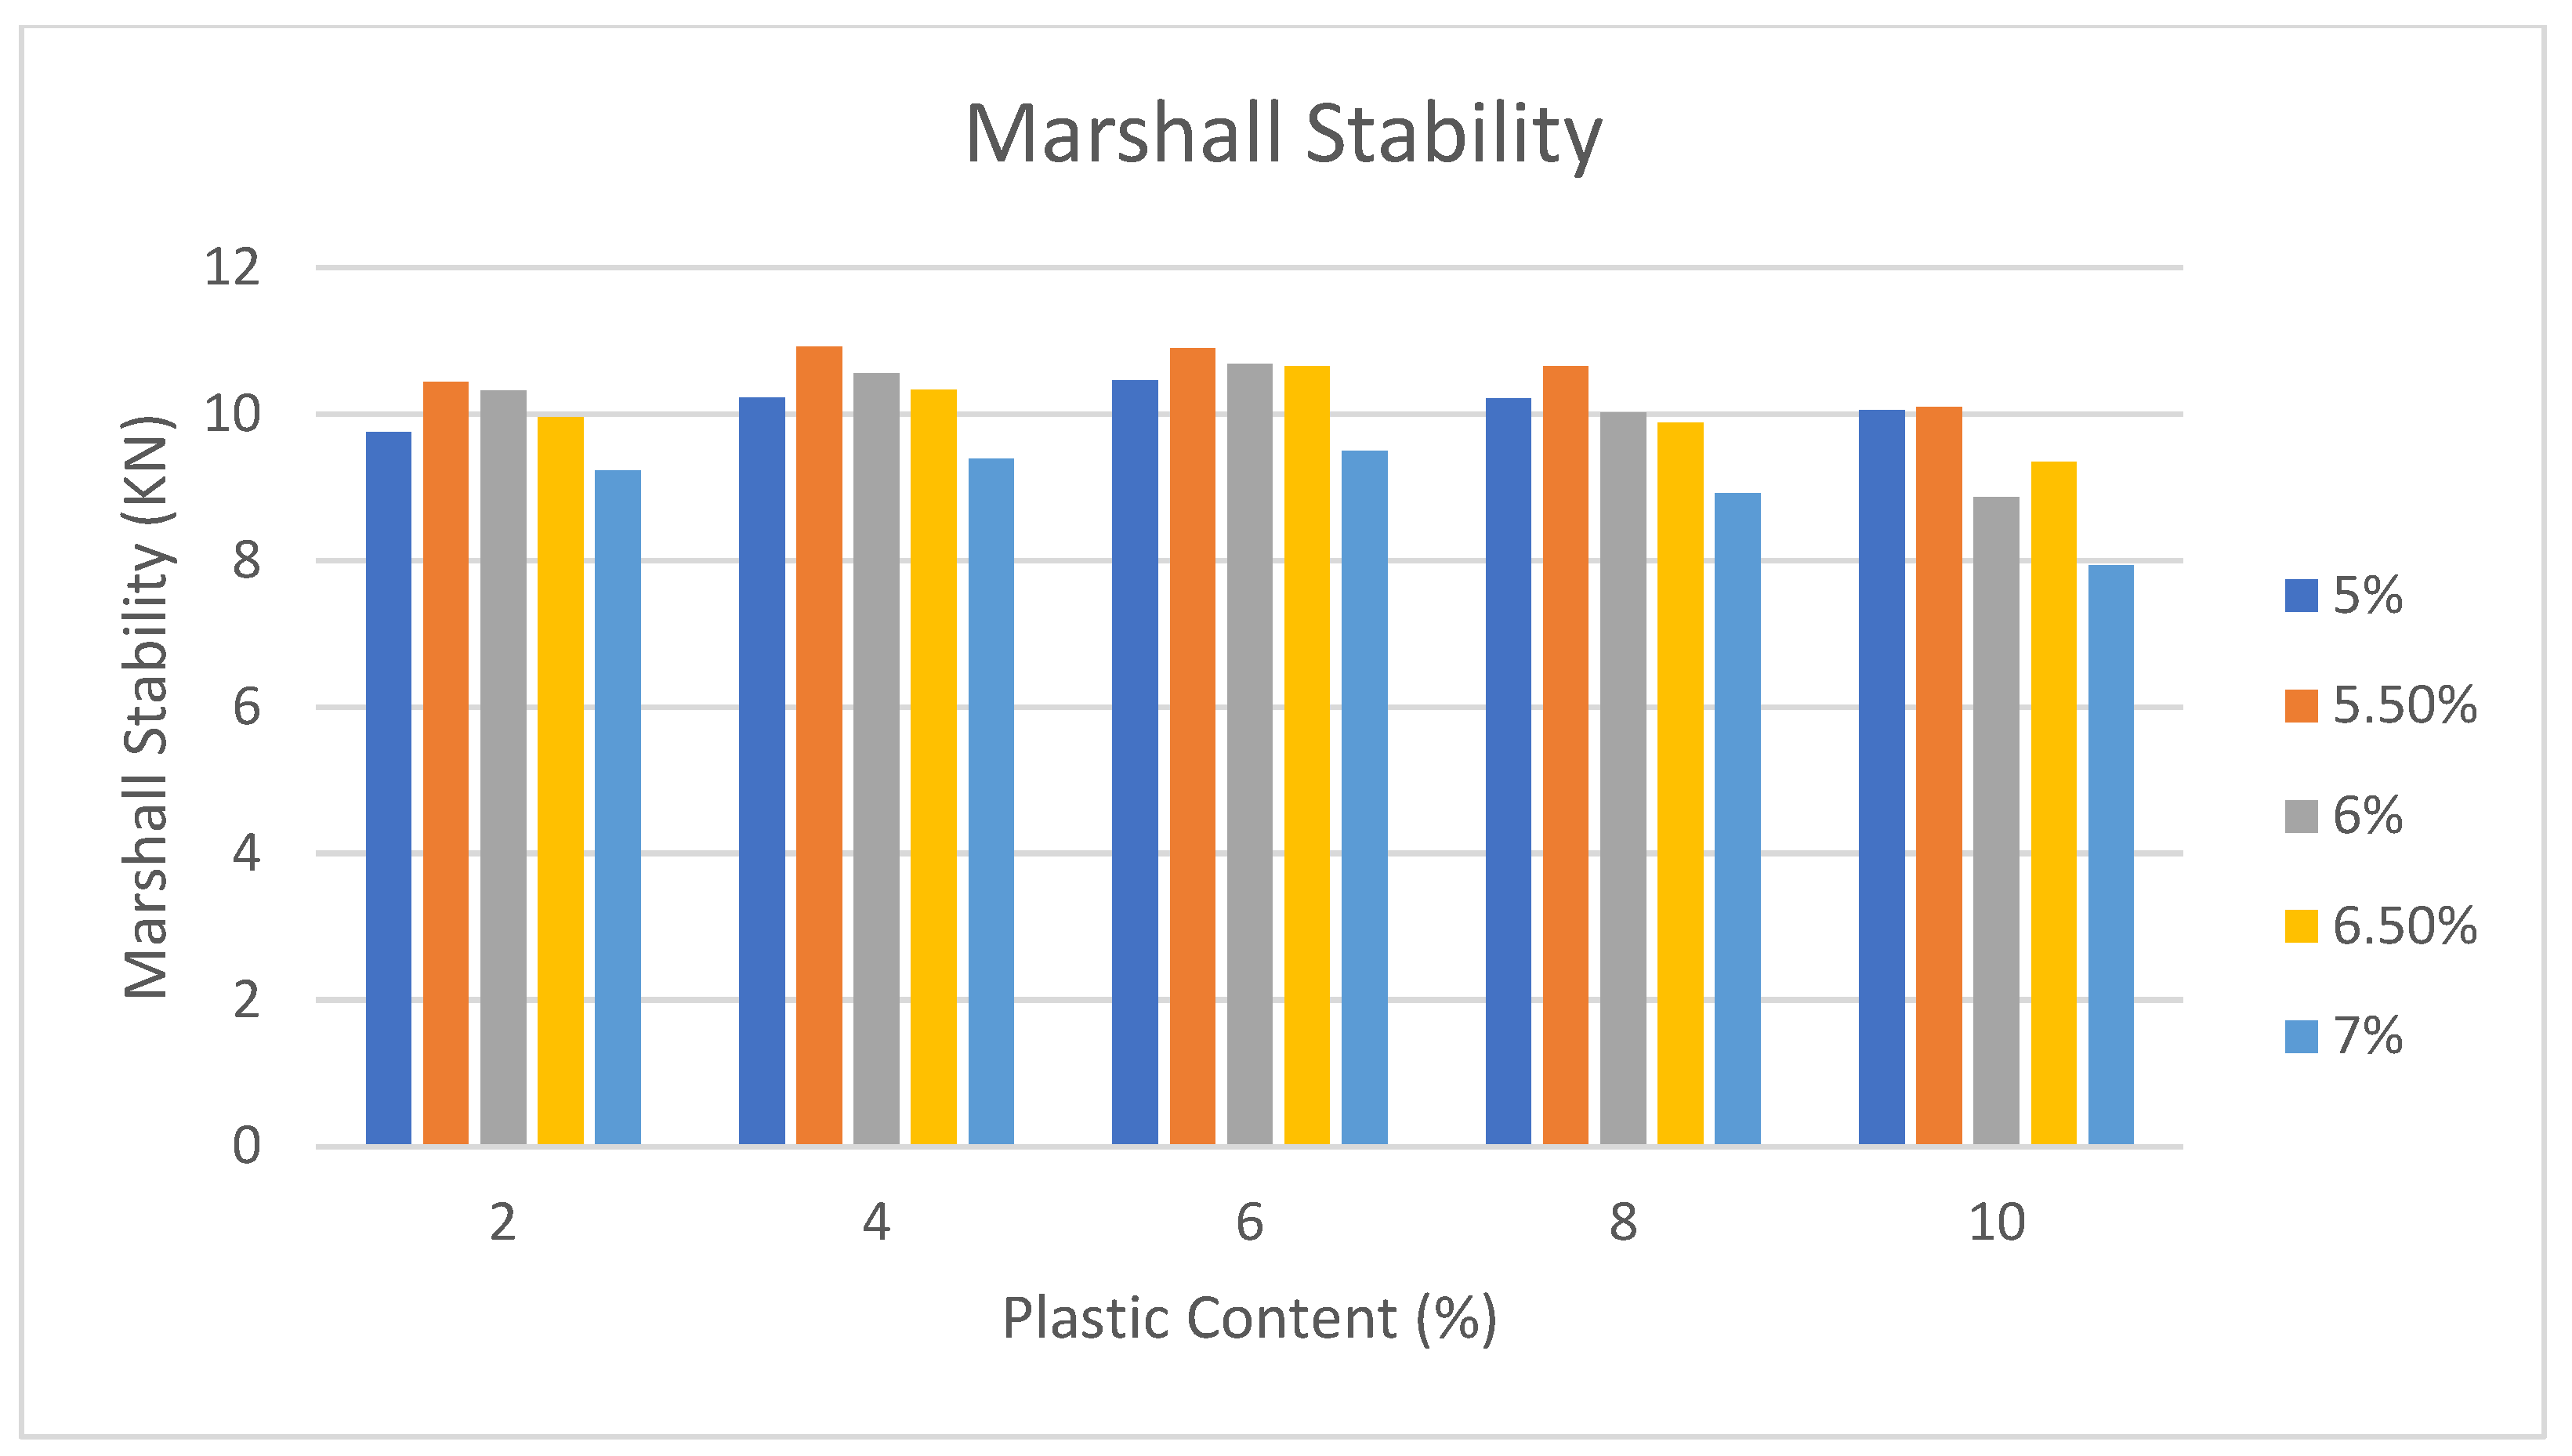
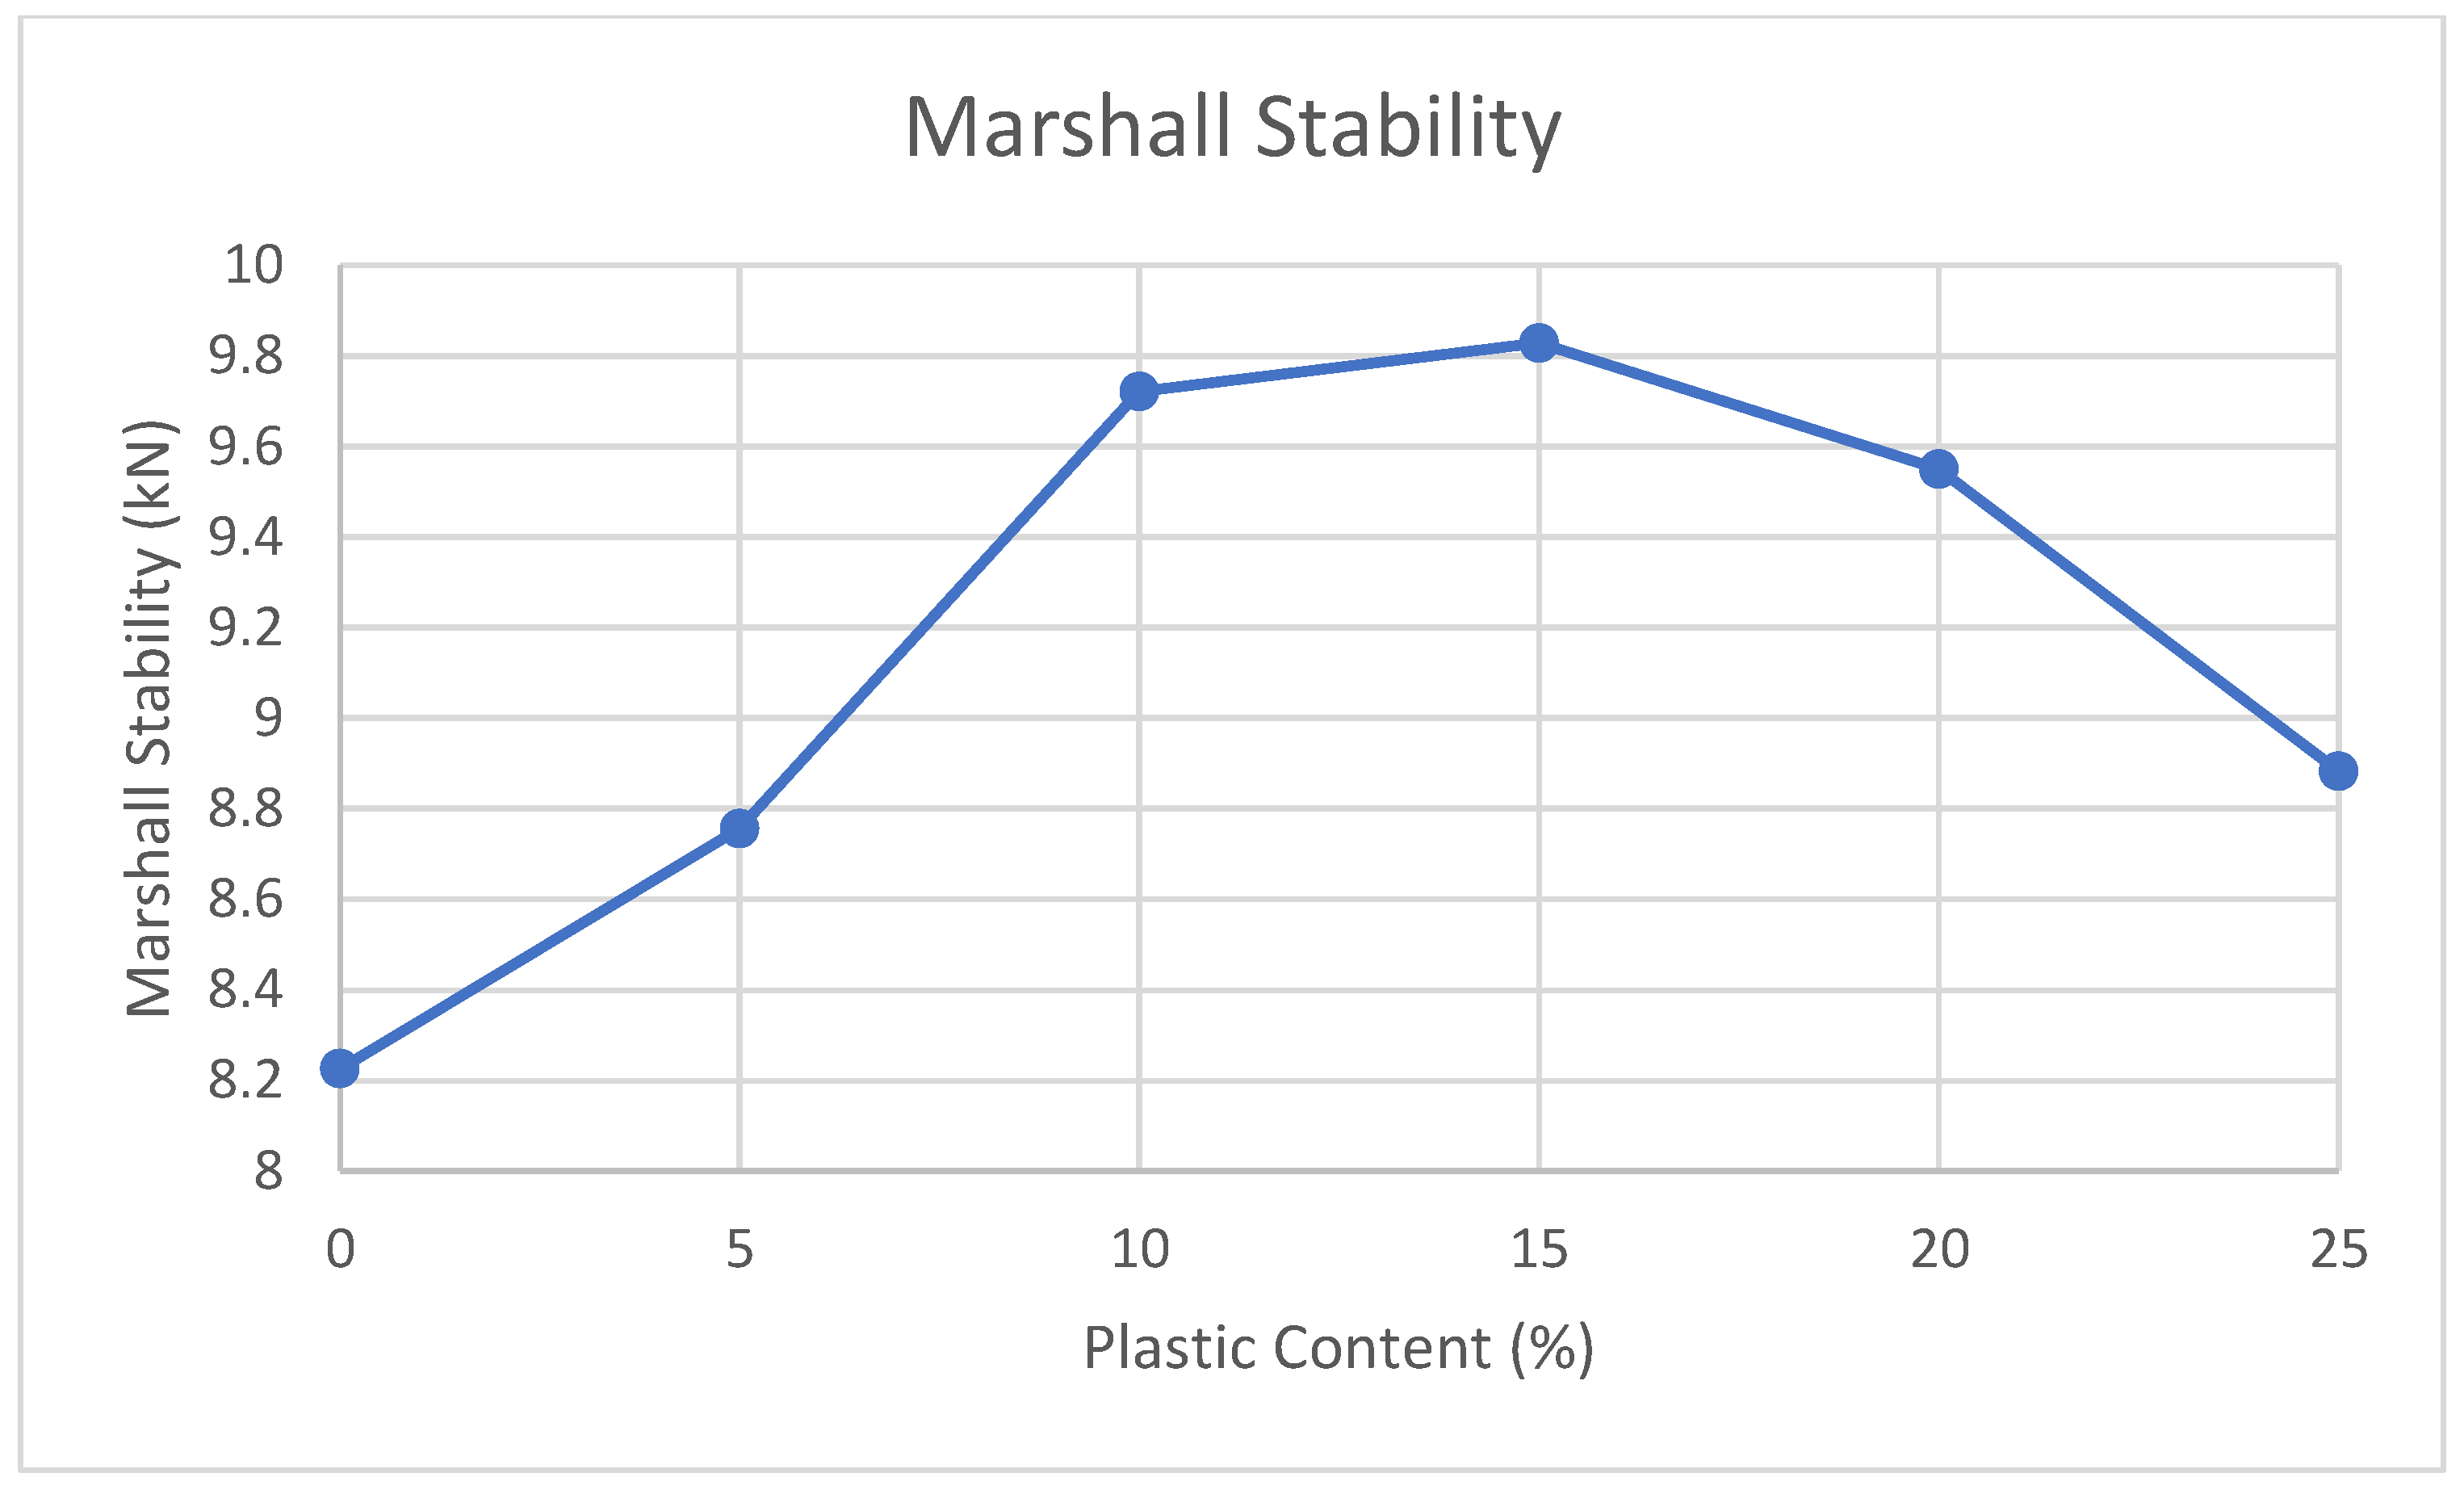
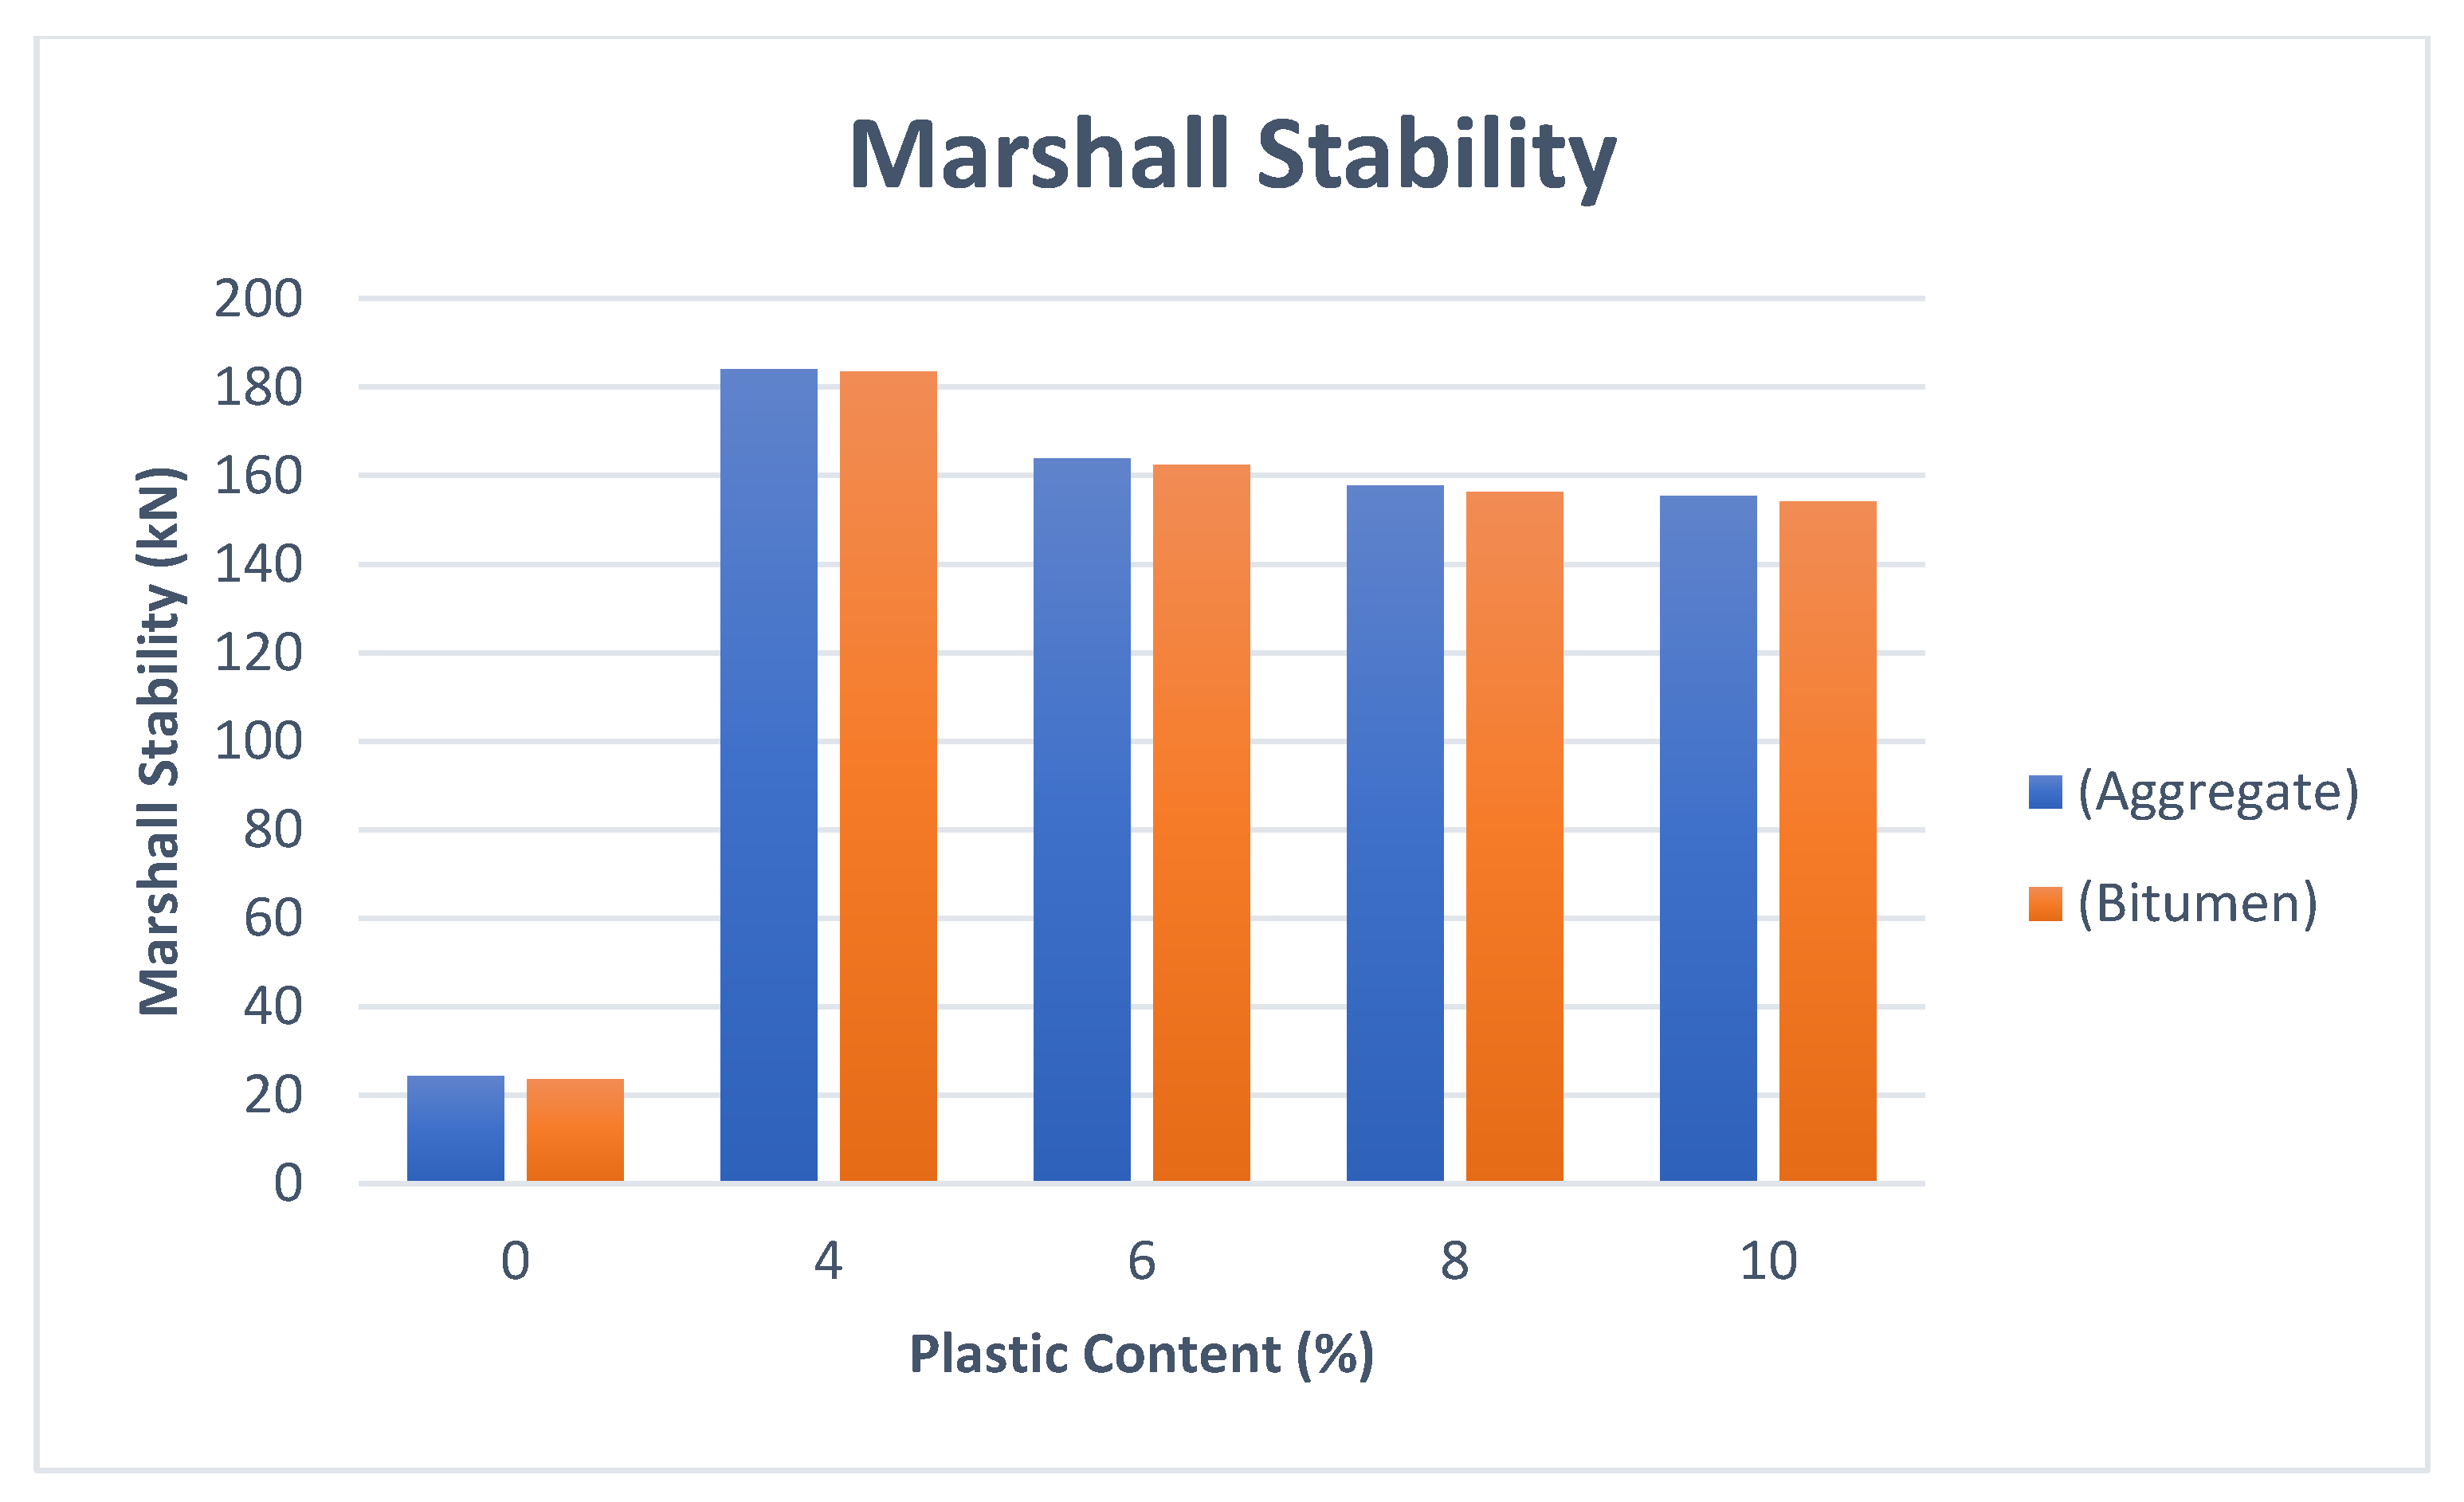
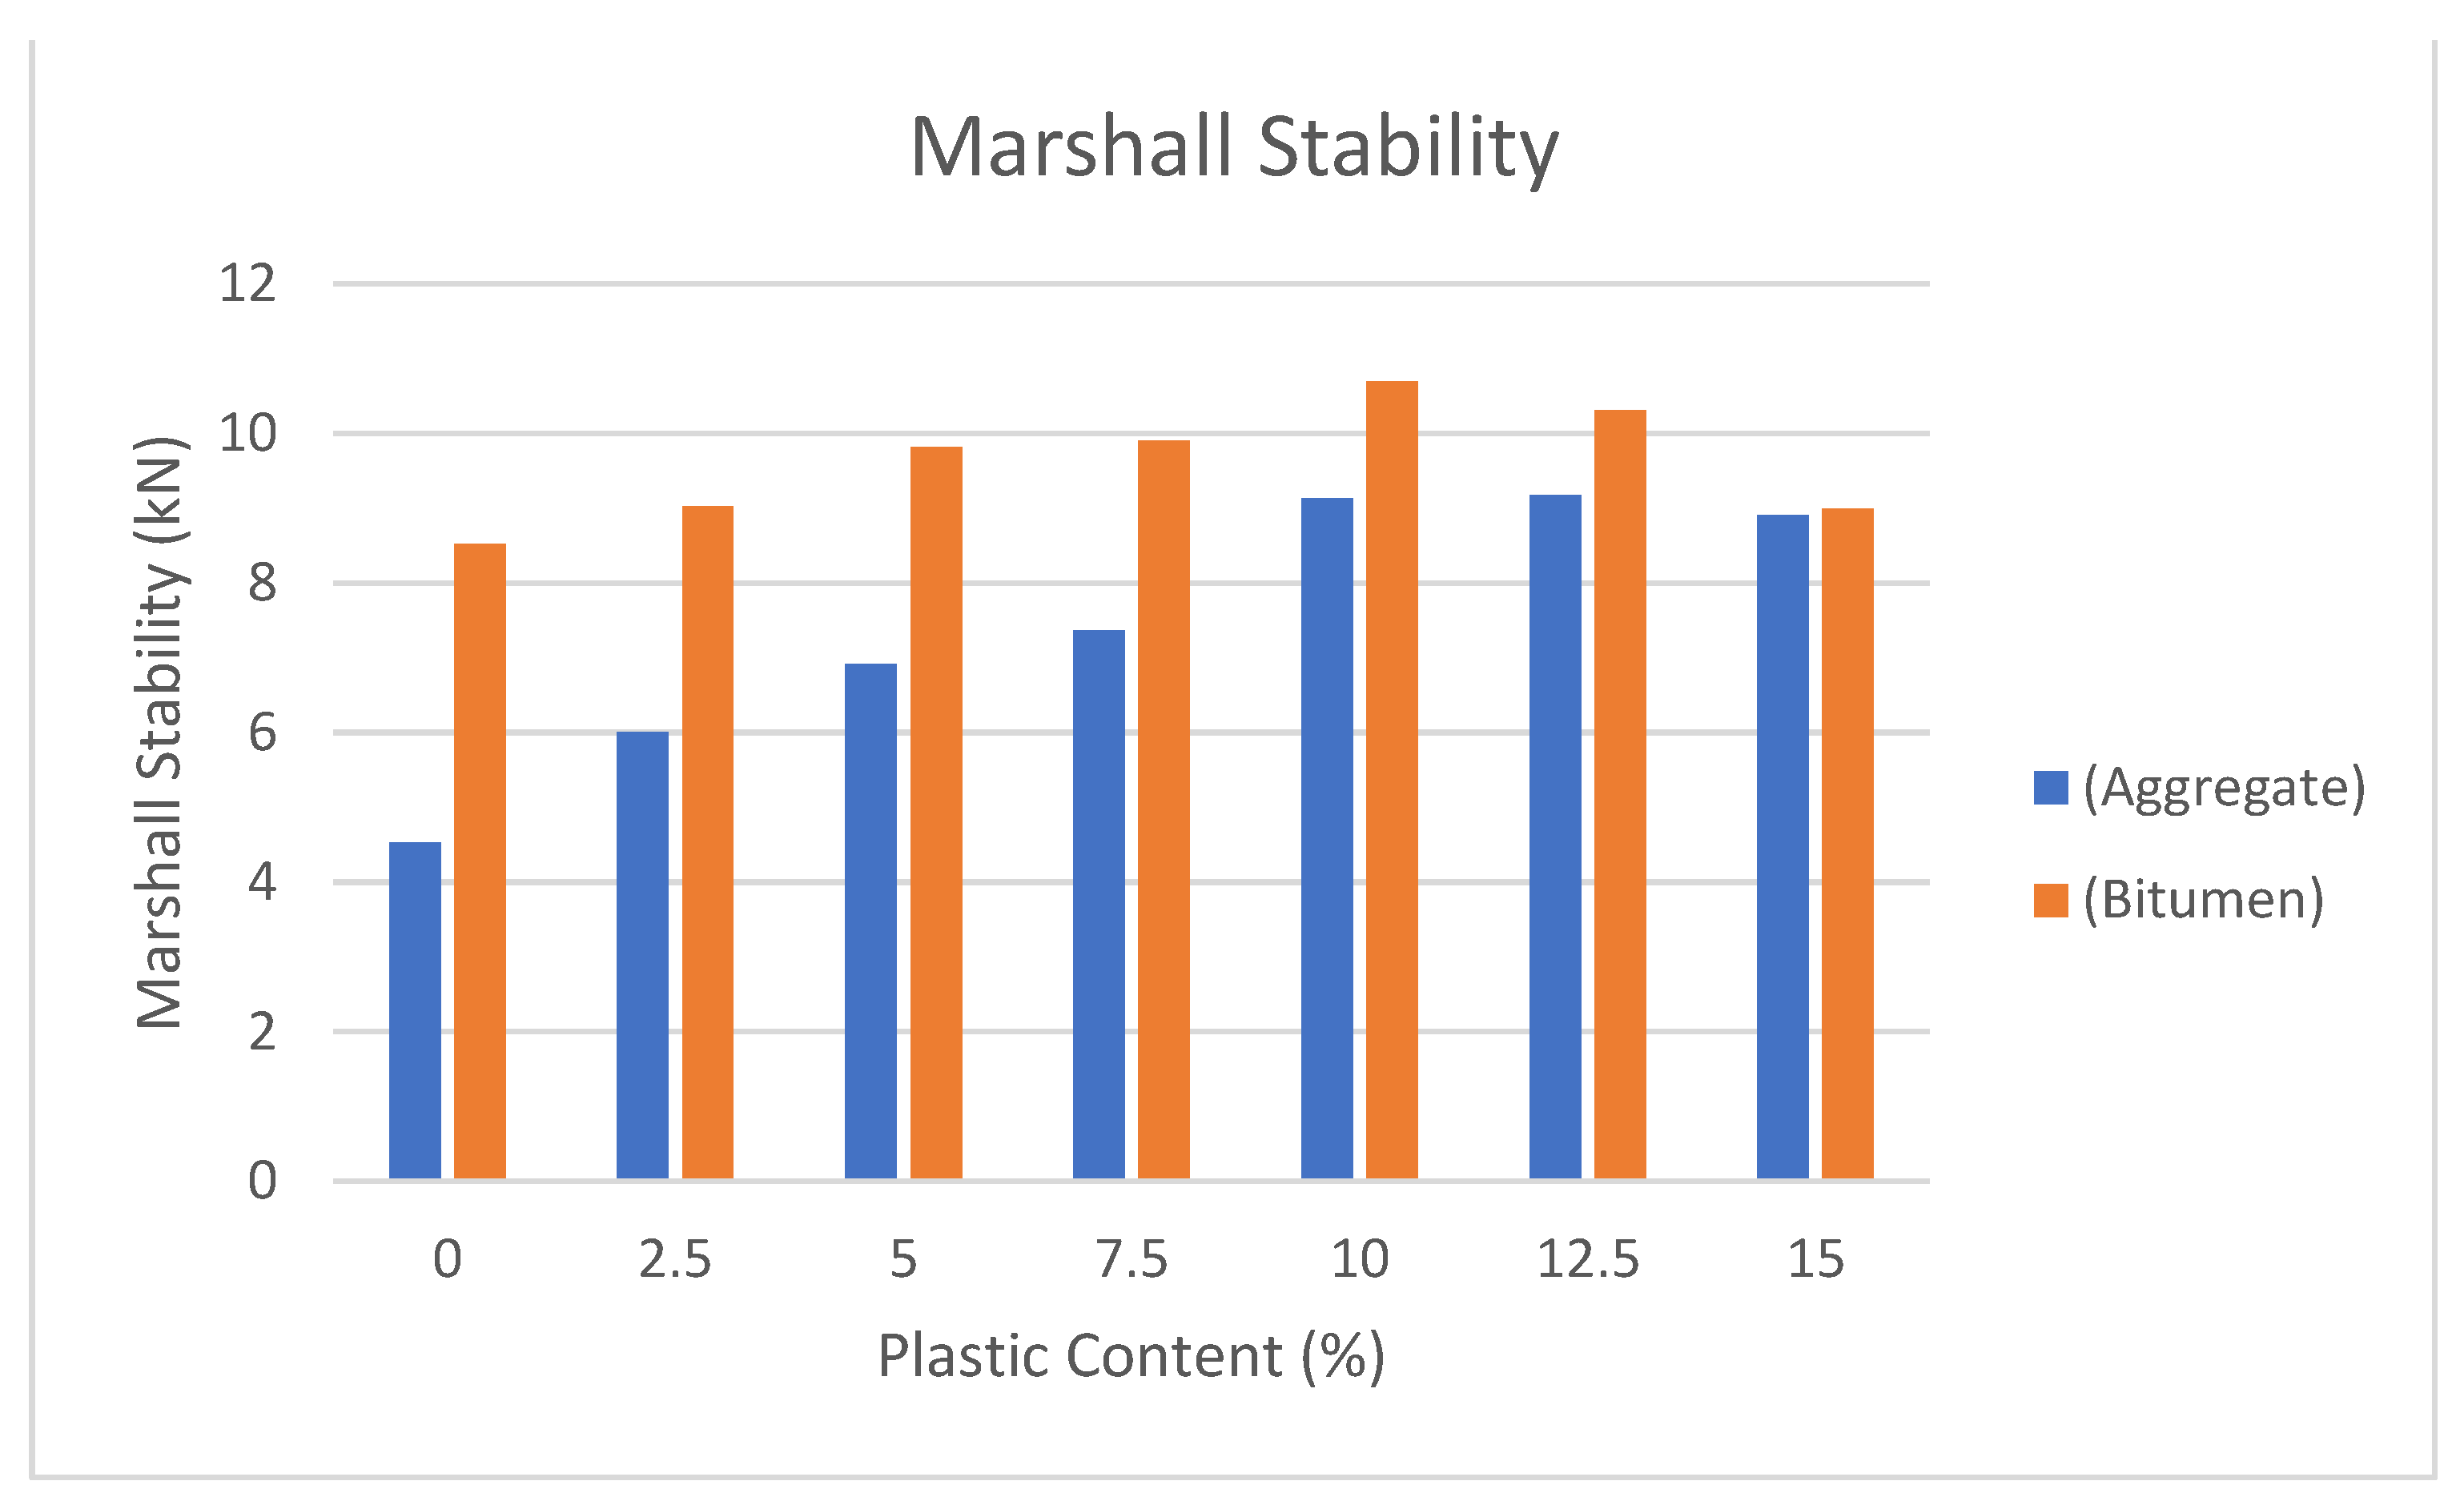
3.1. Marshall Stability
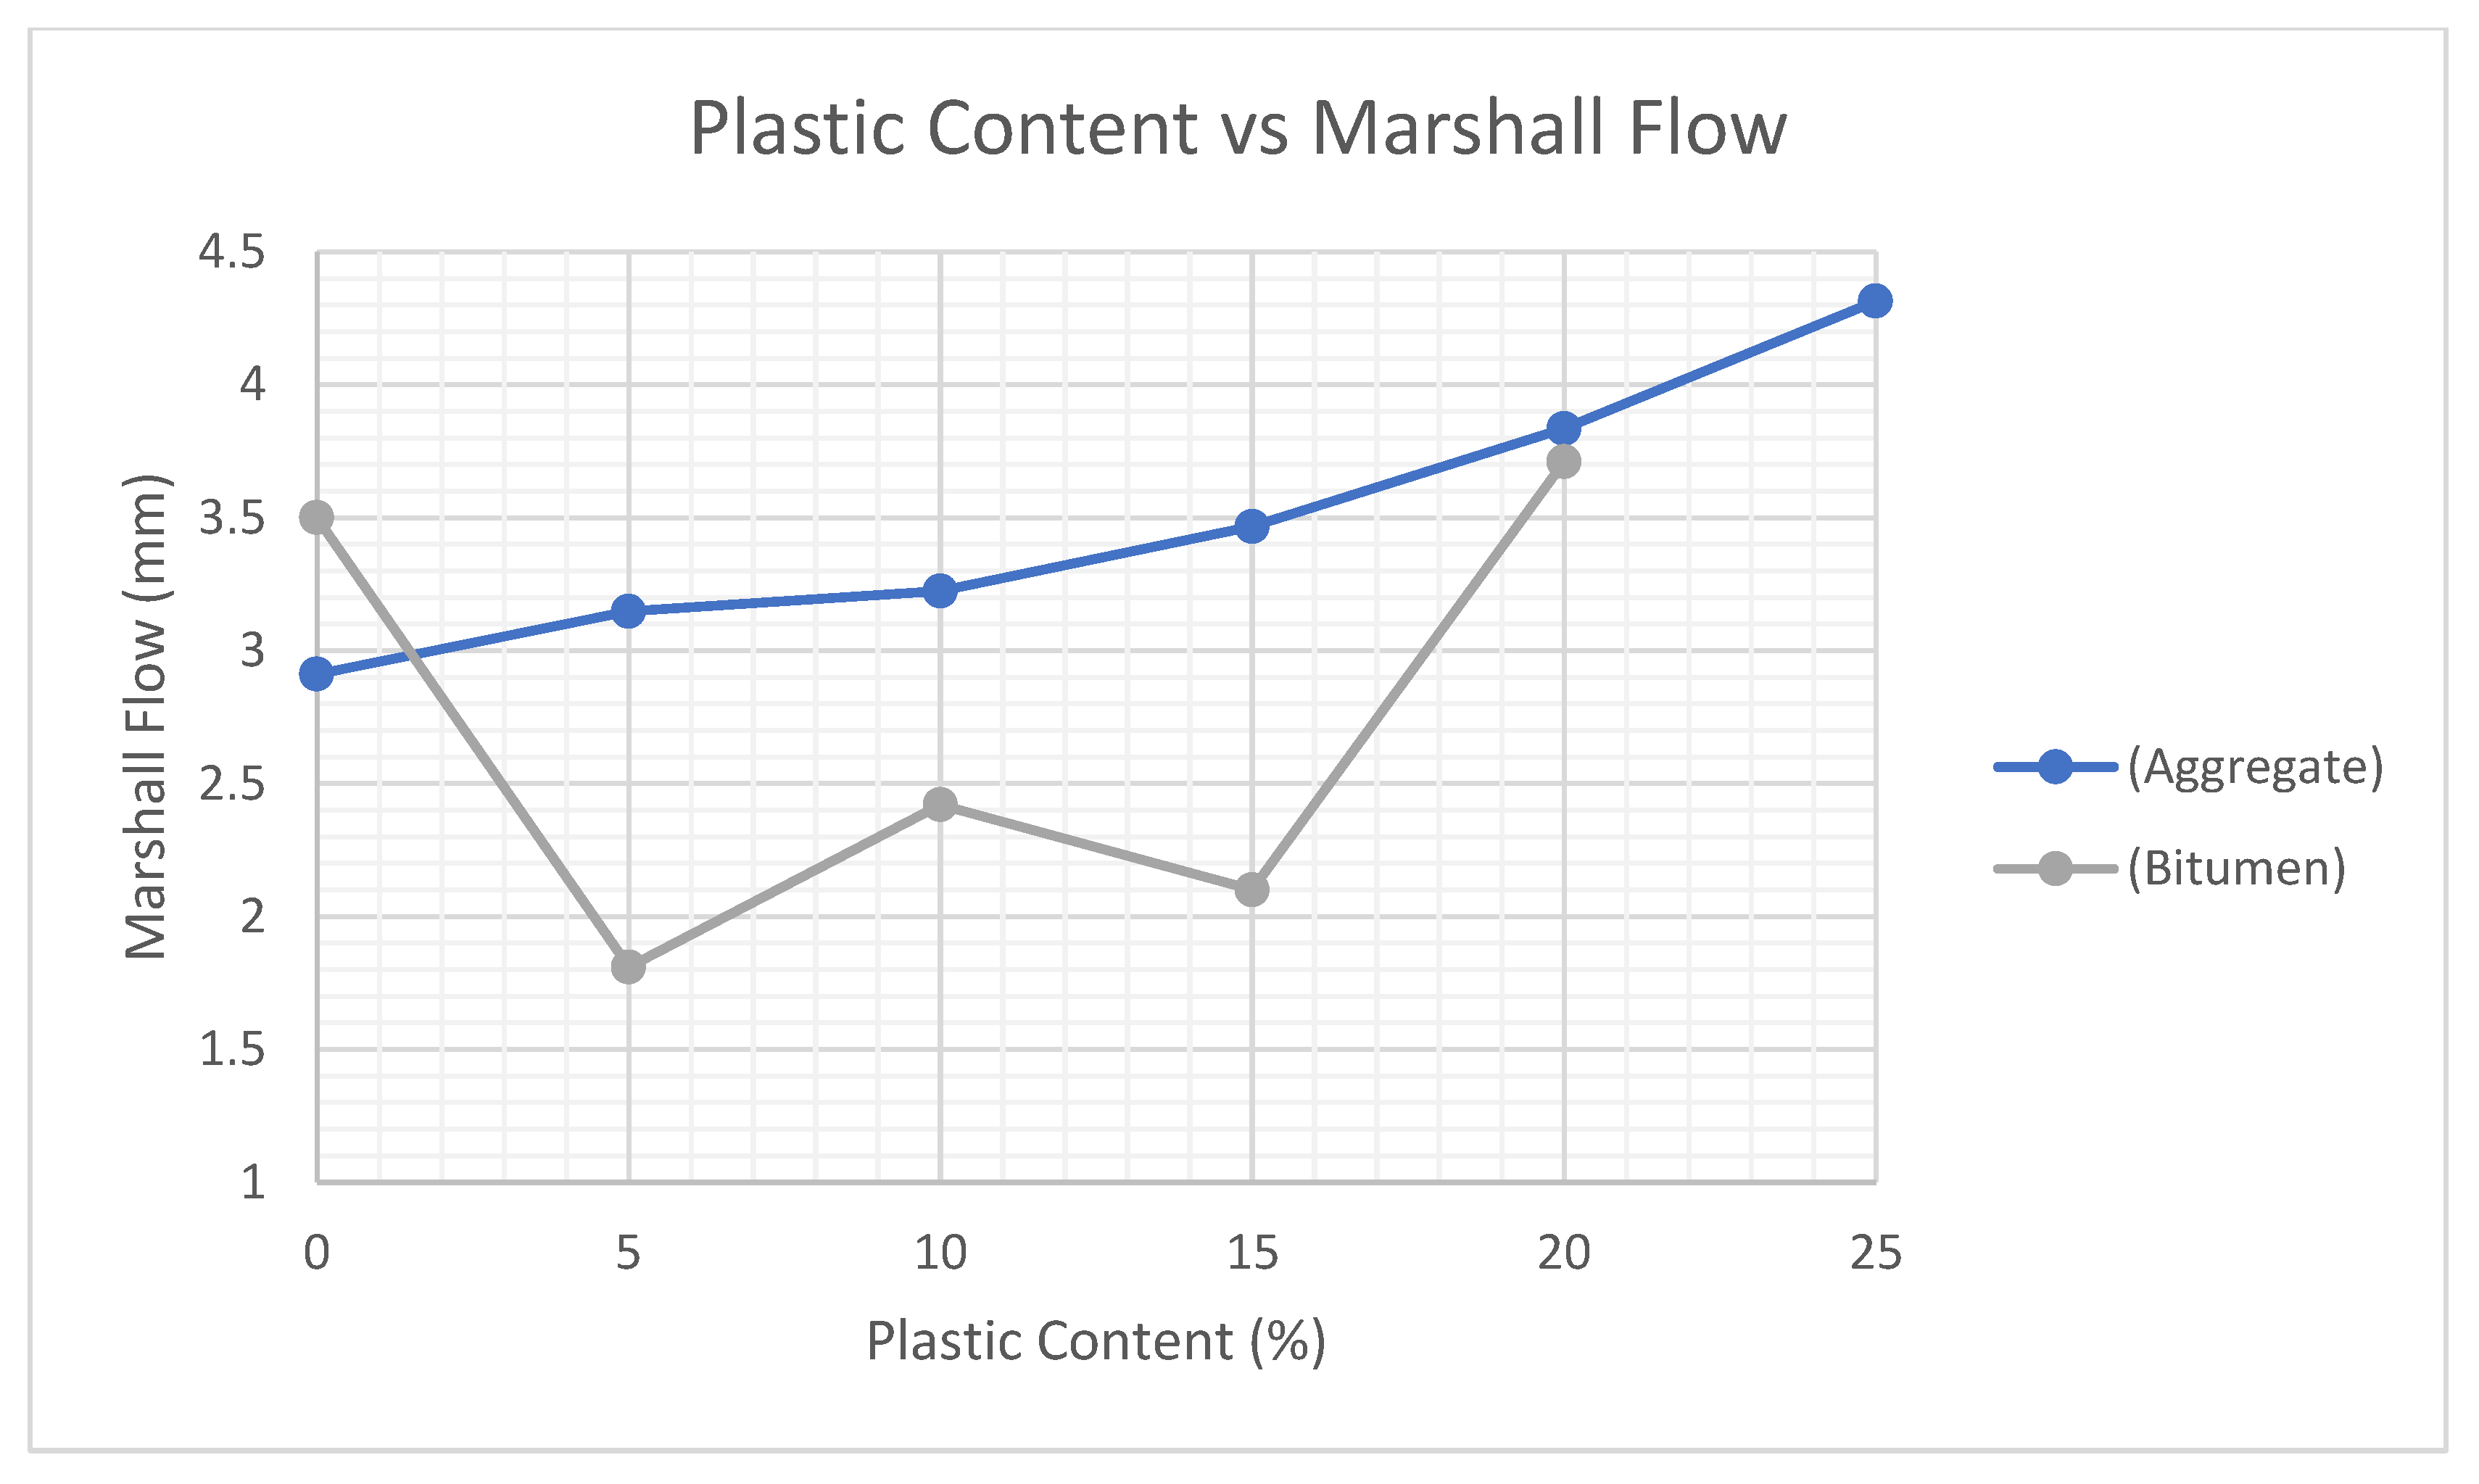
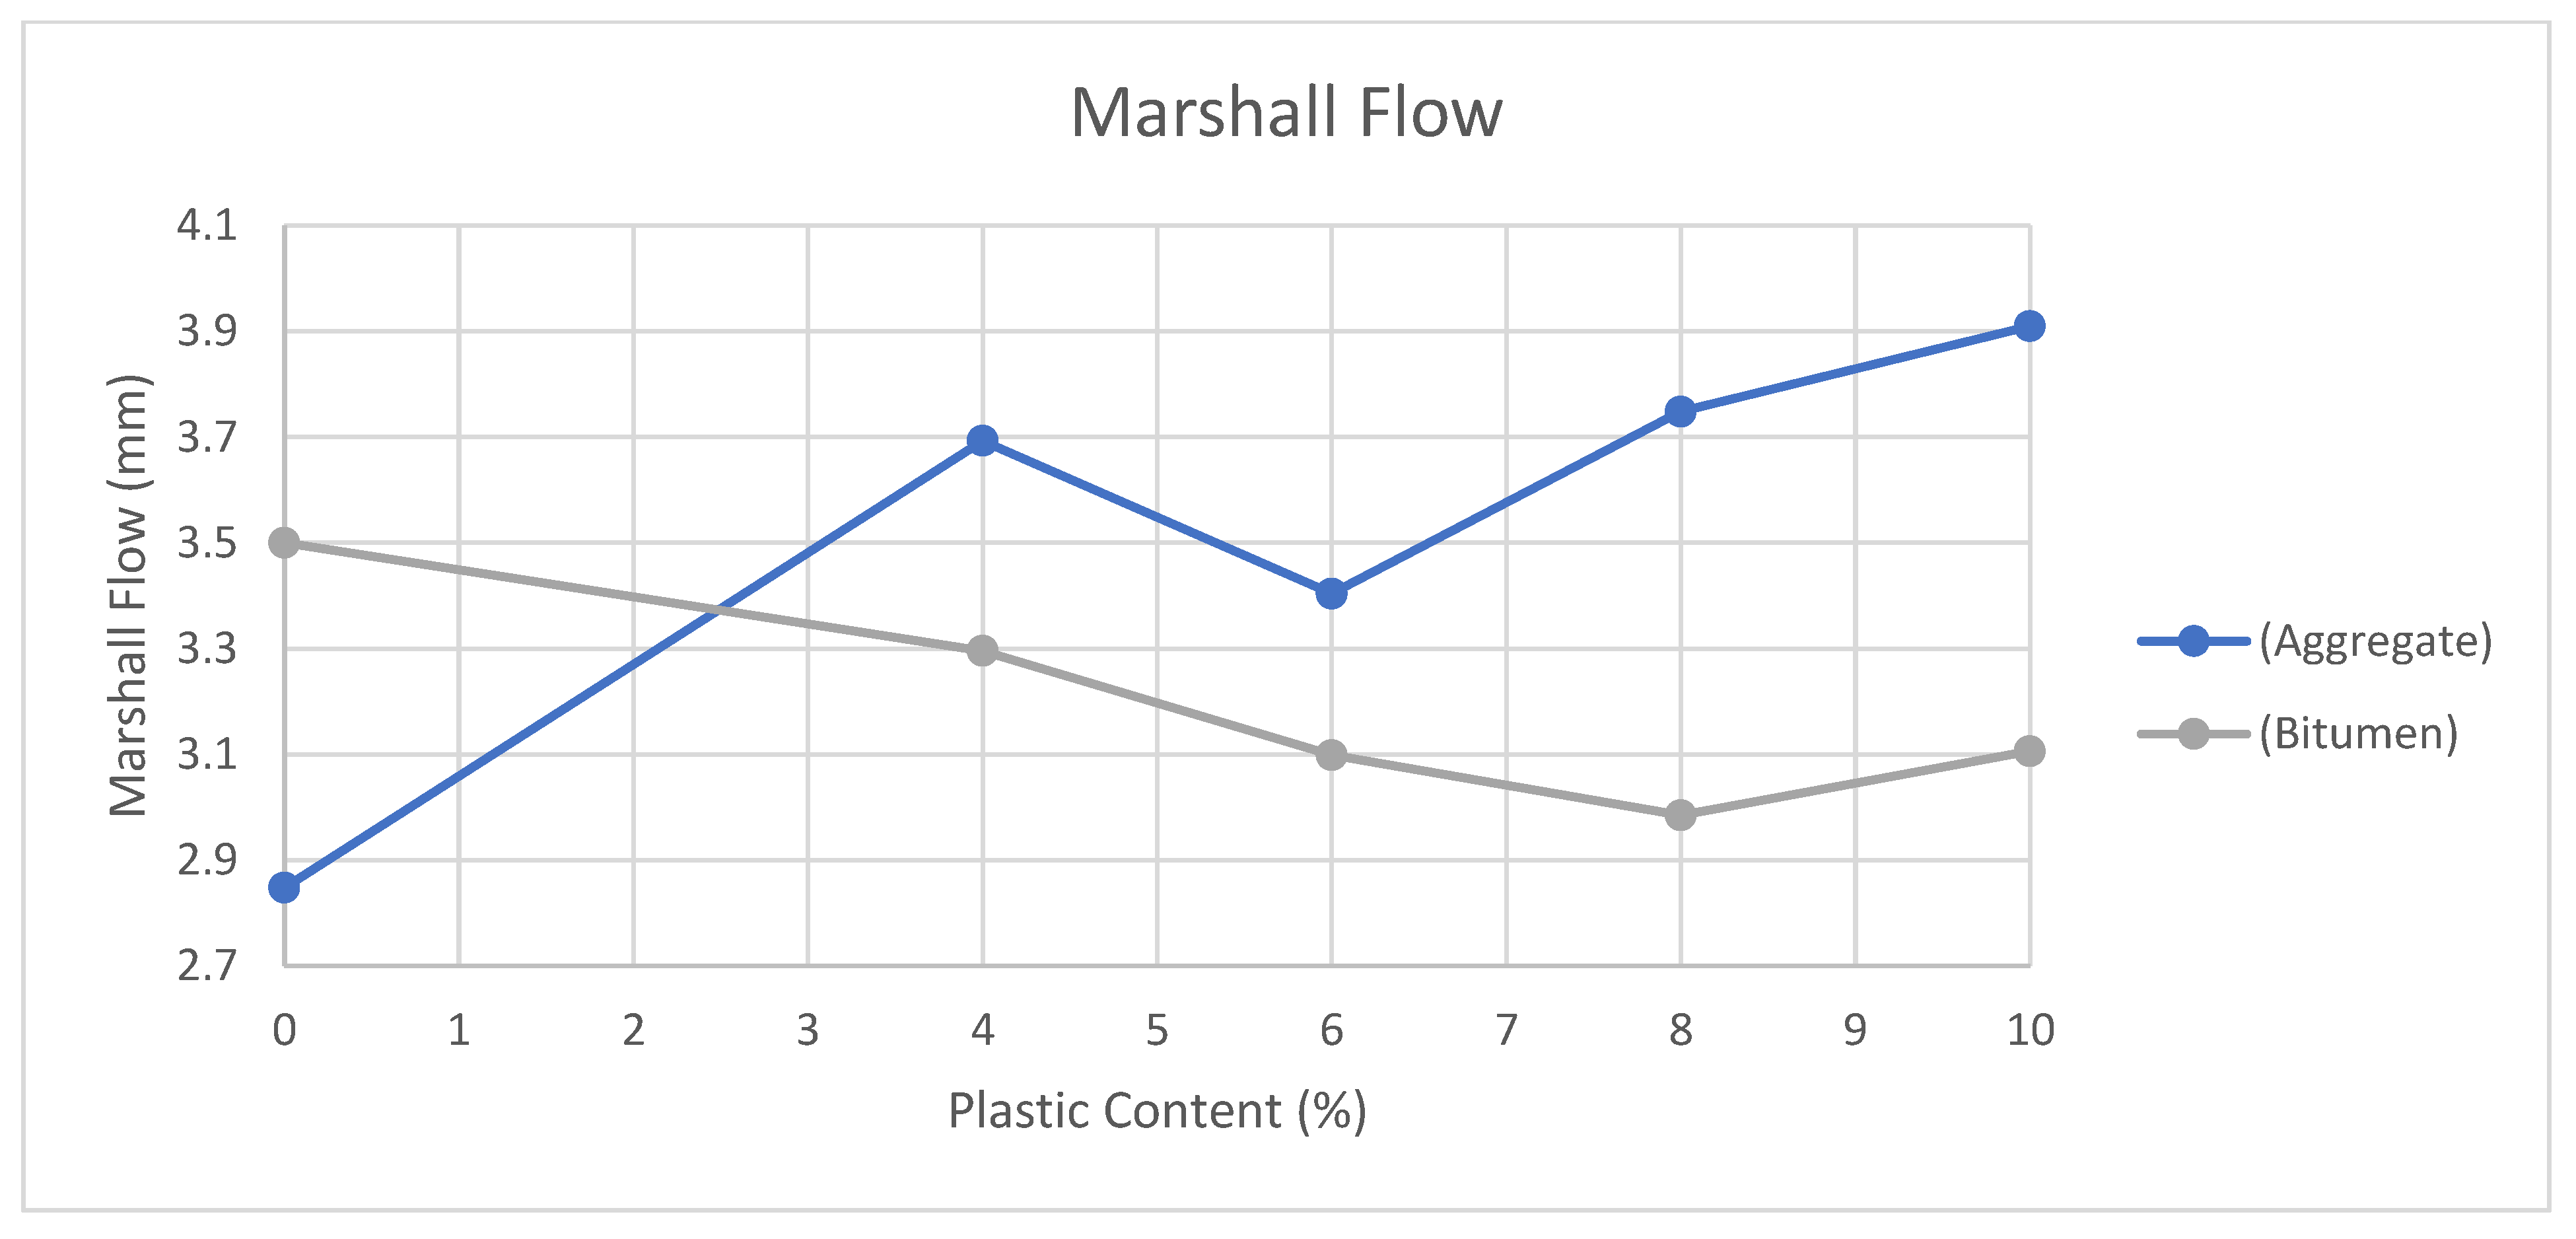
3.2. Marshall Flow
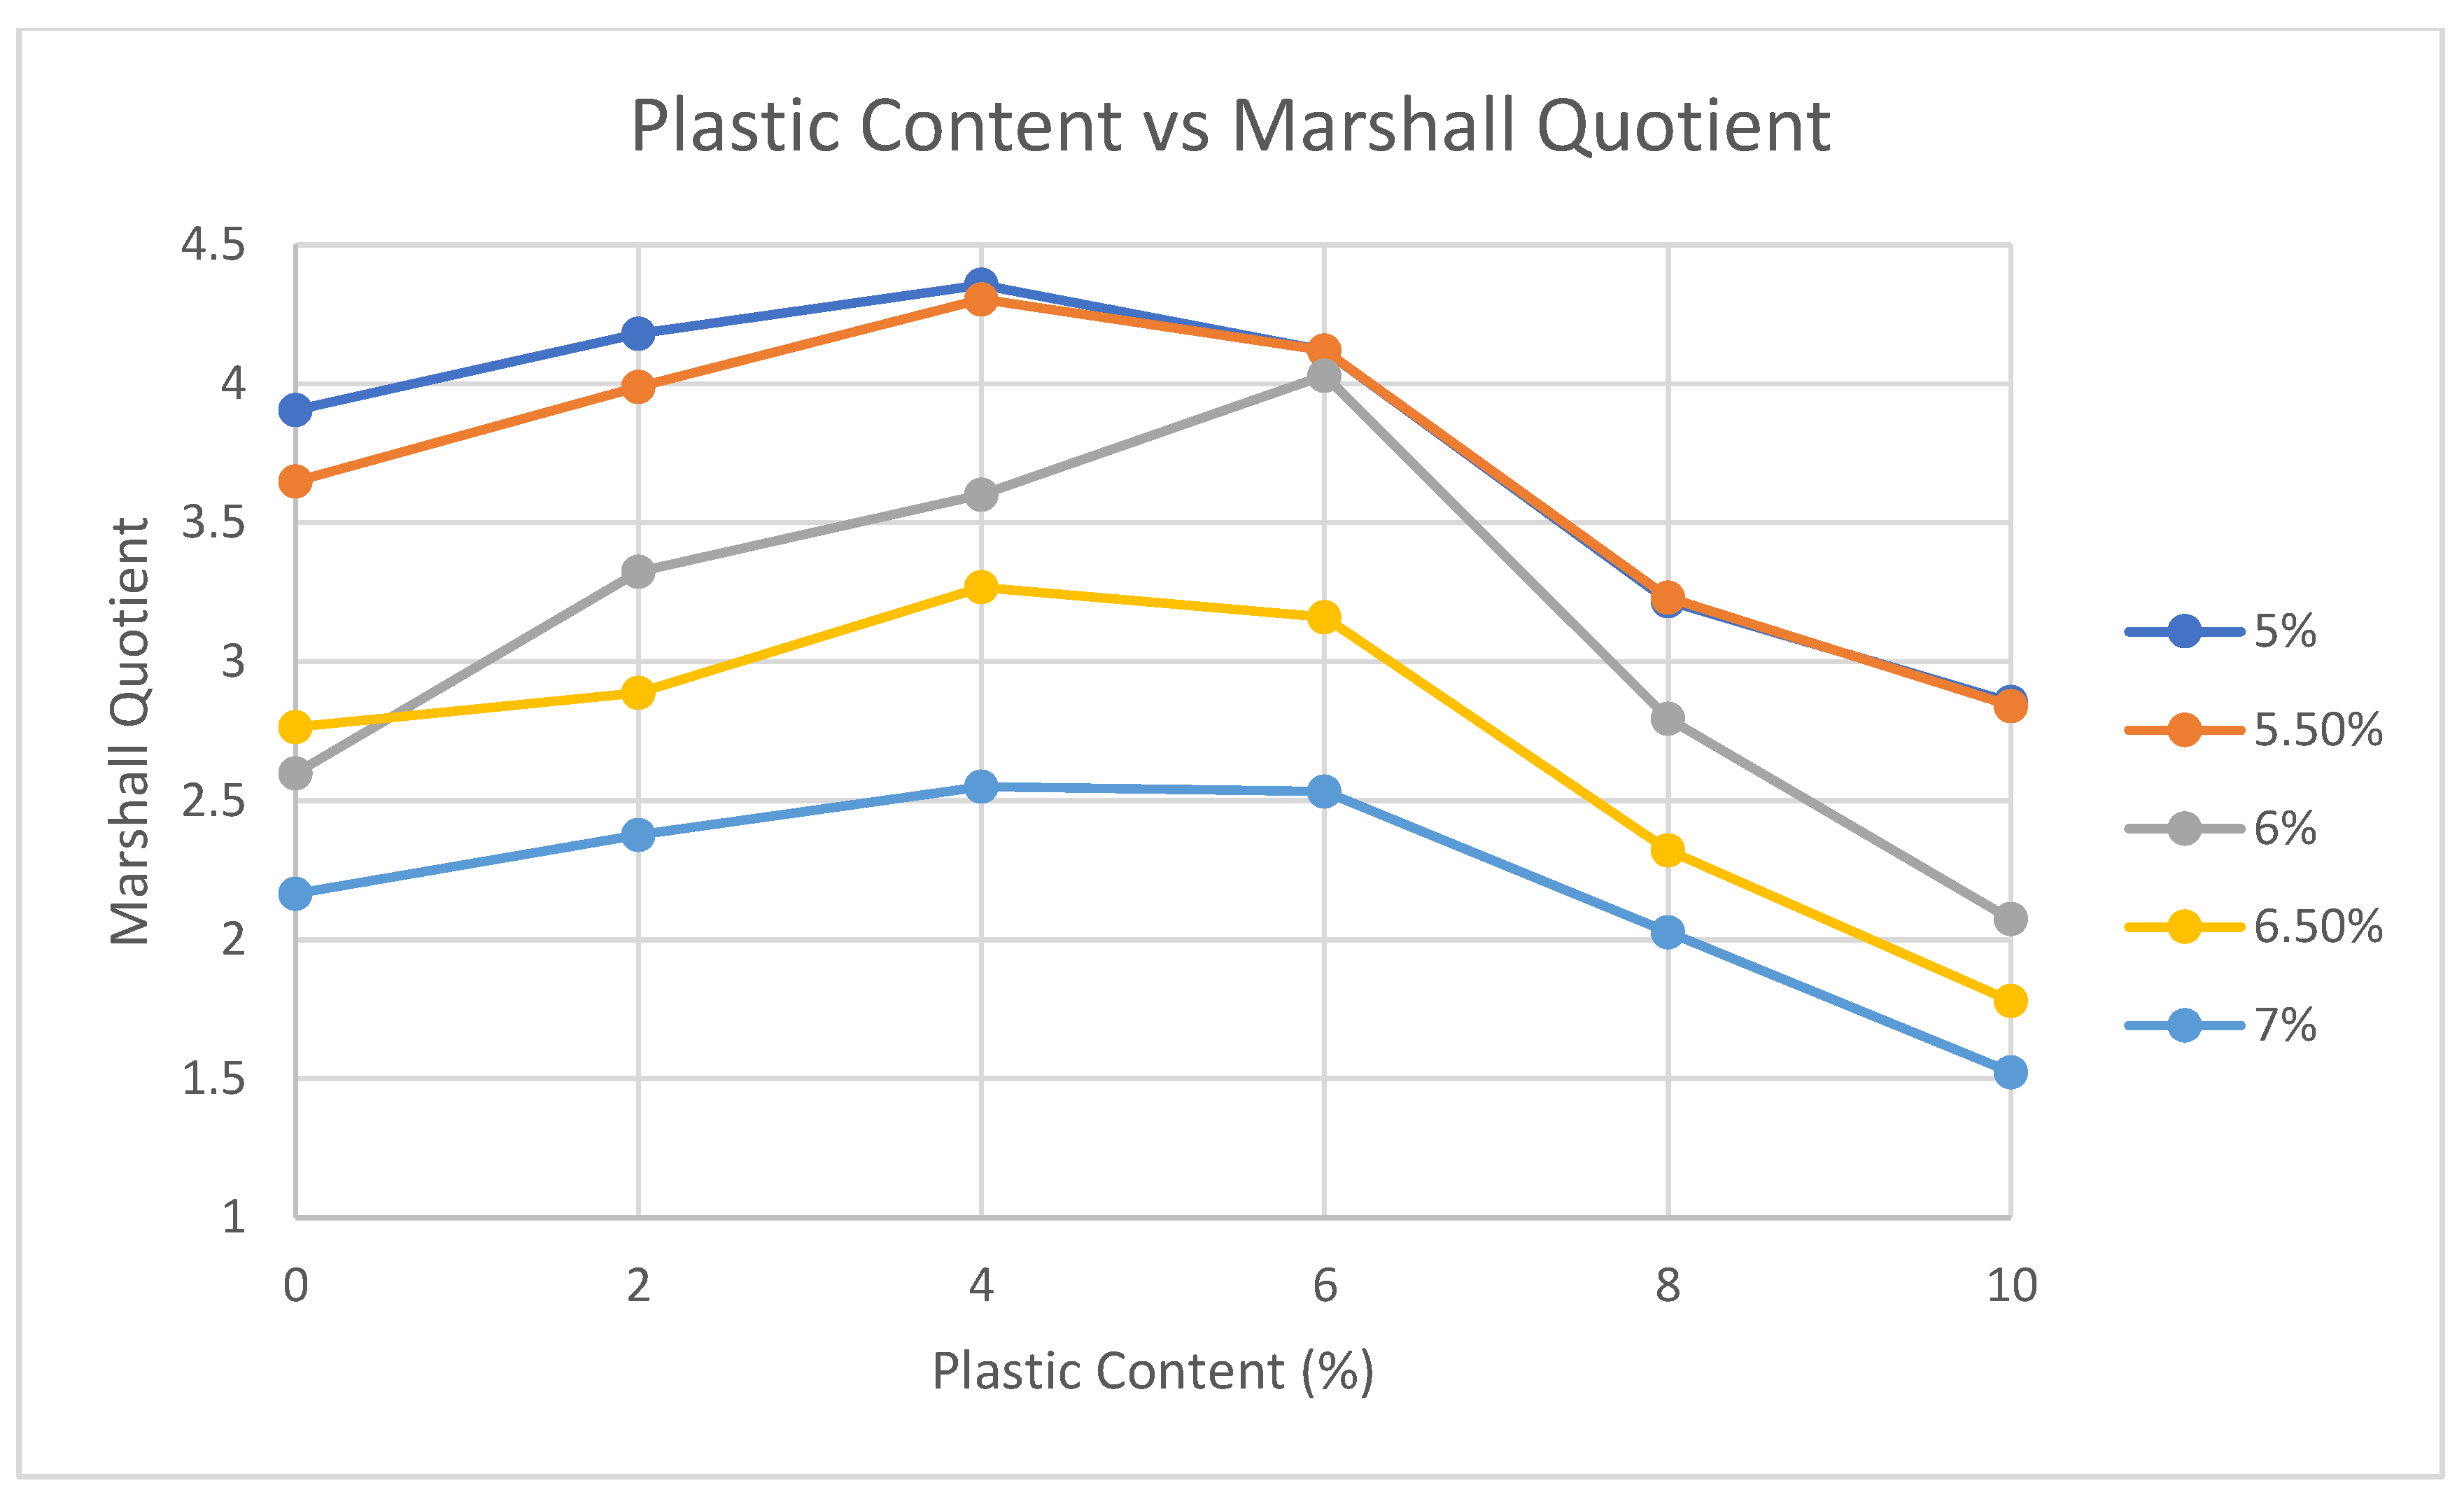
3.3. Marshall Quotient
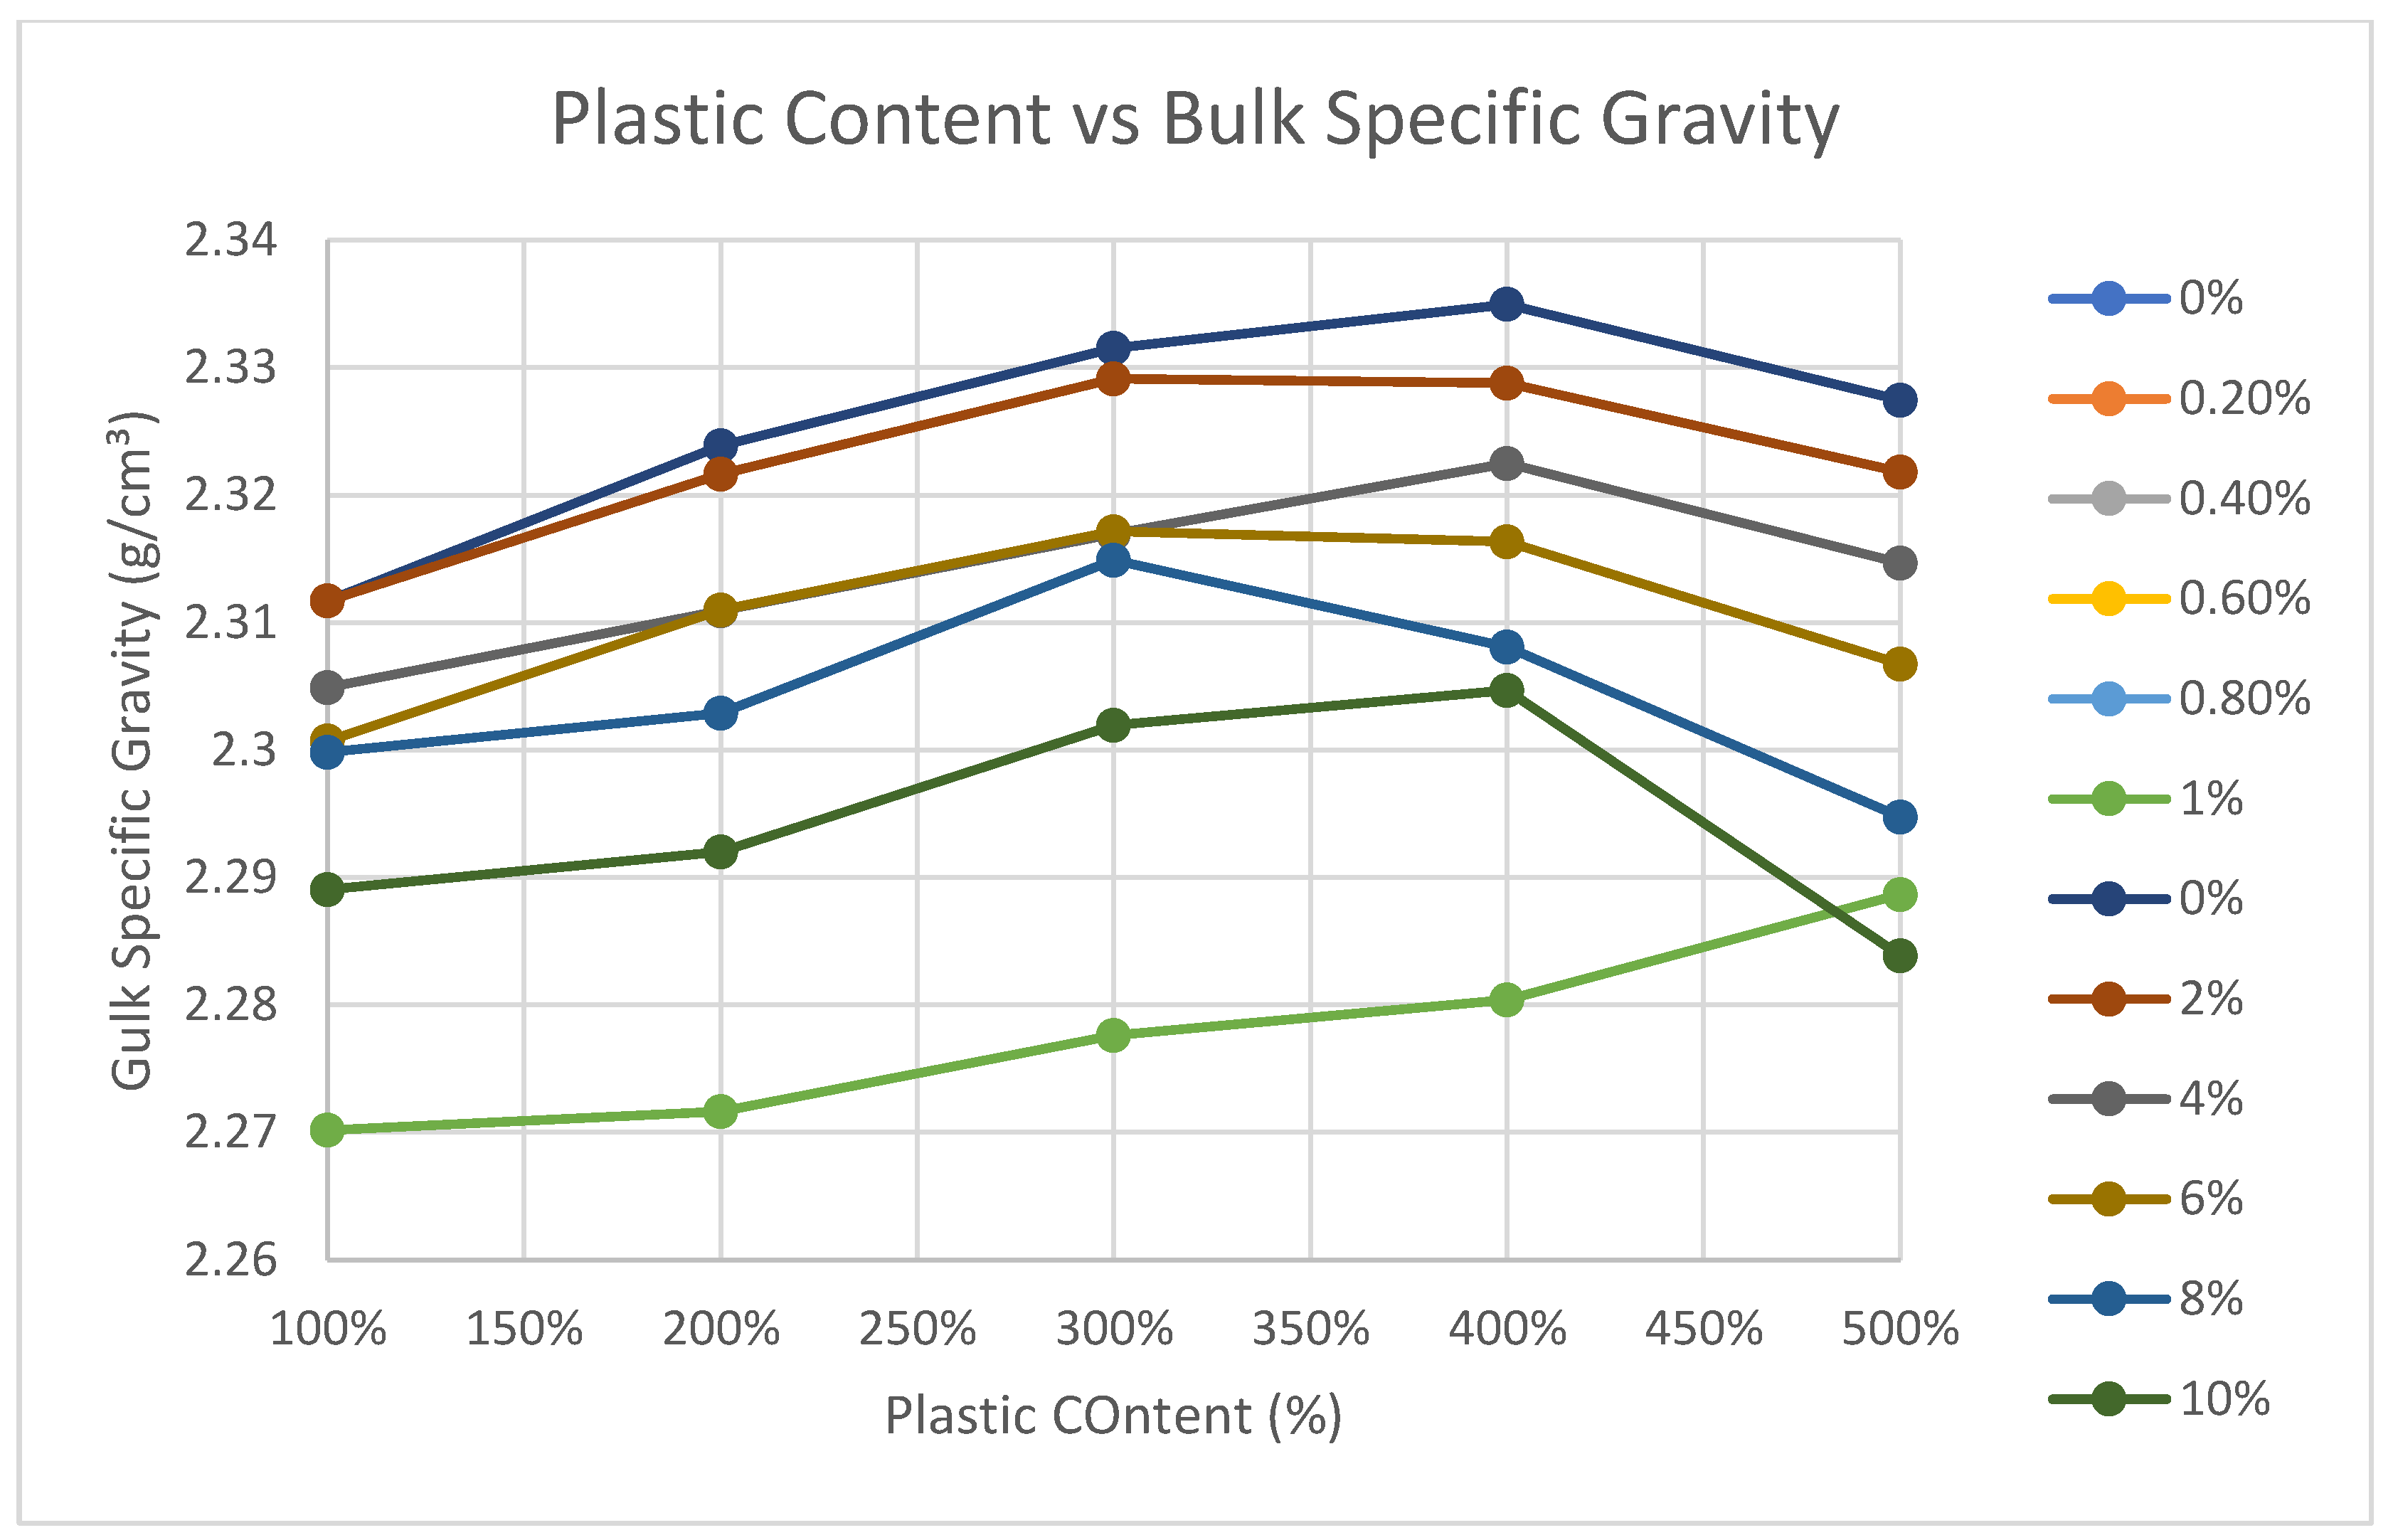
3.4. Bulk Specific Gravity
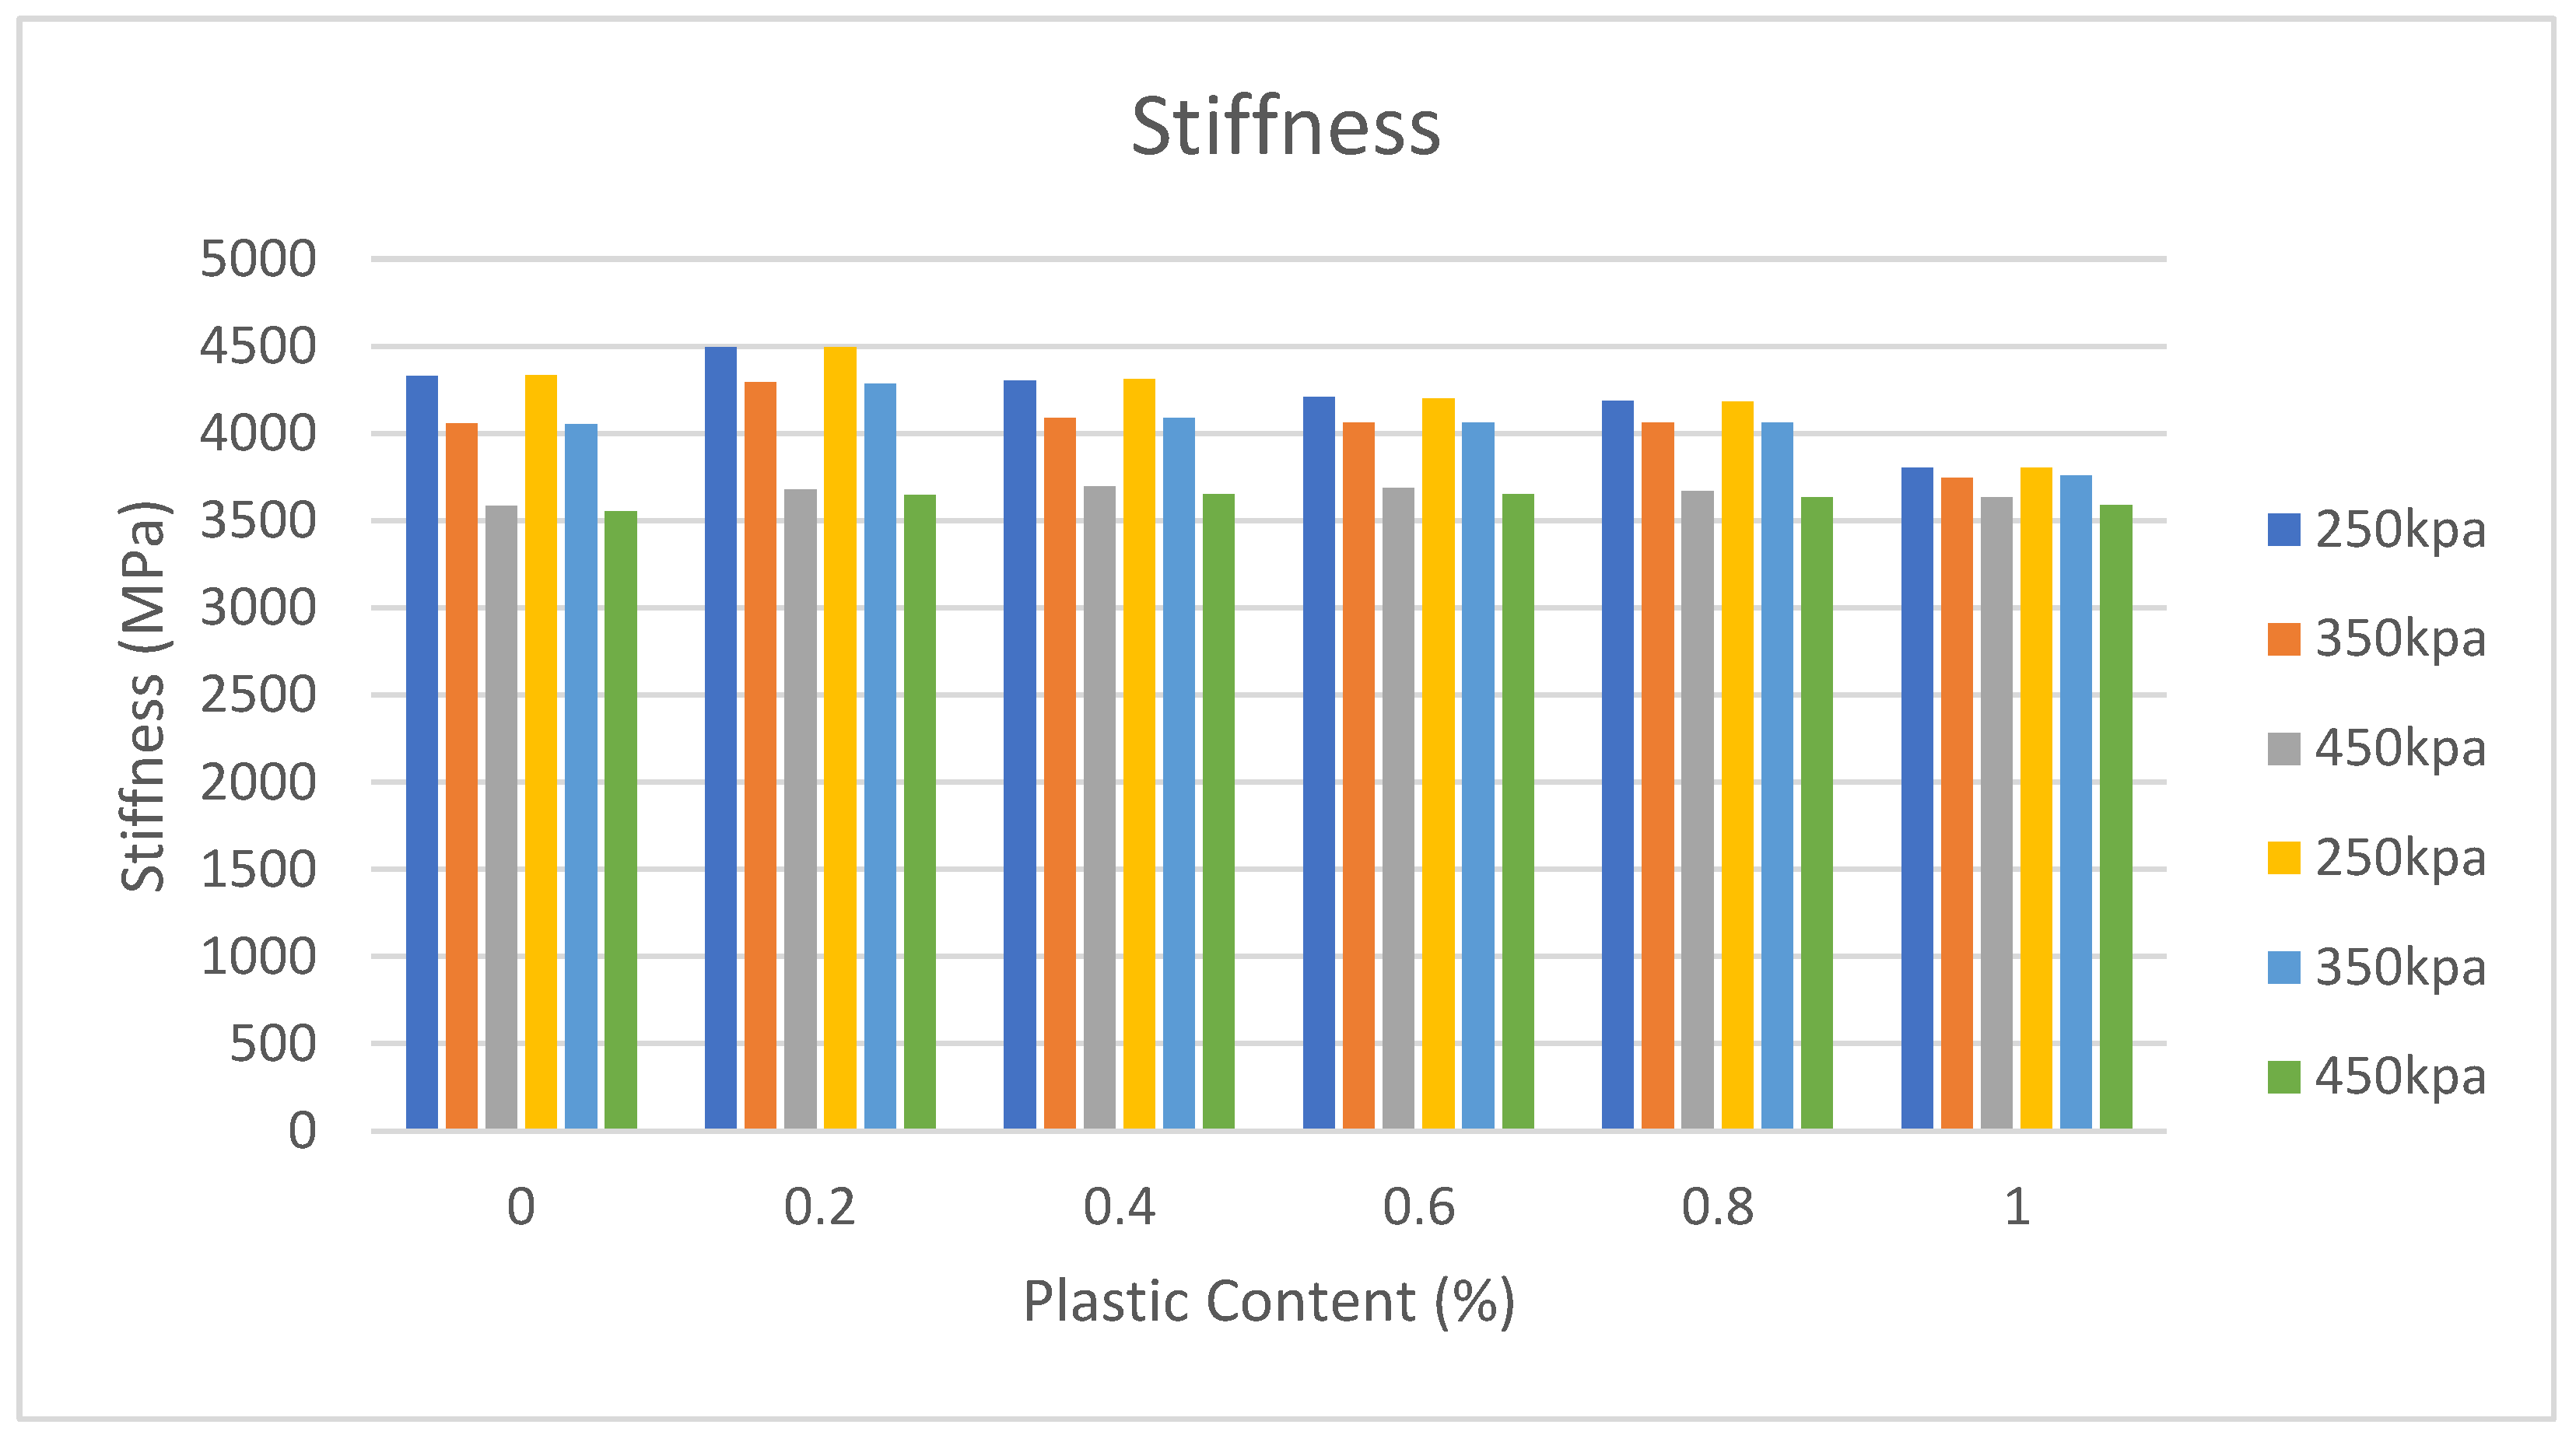
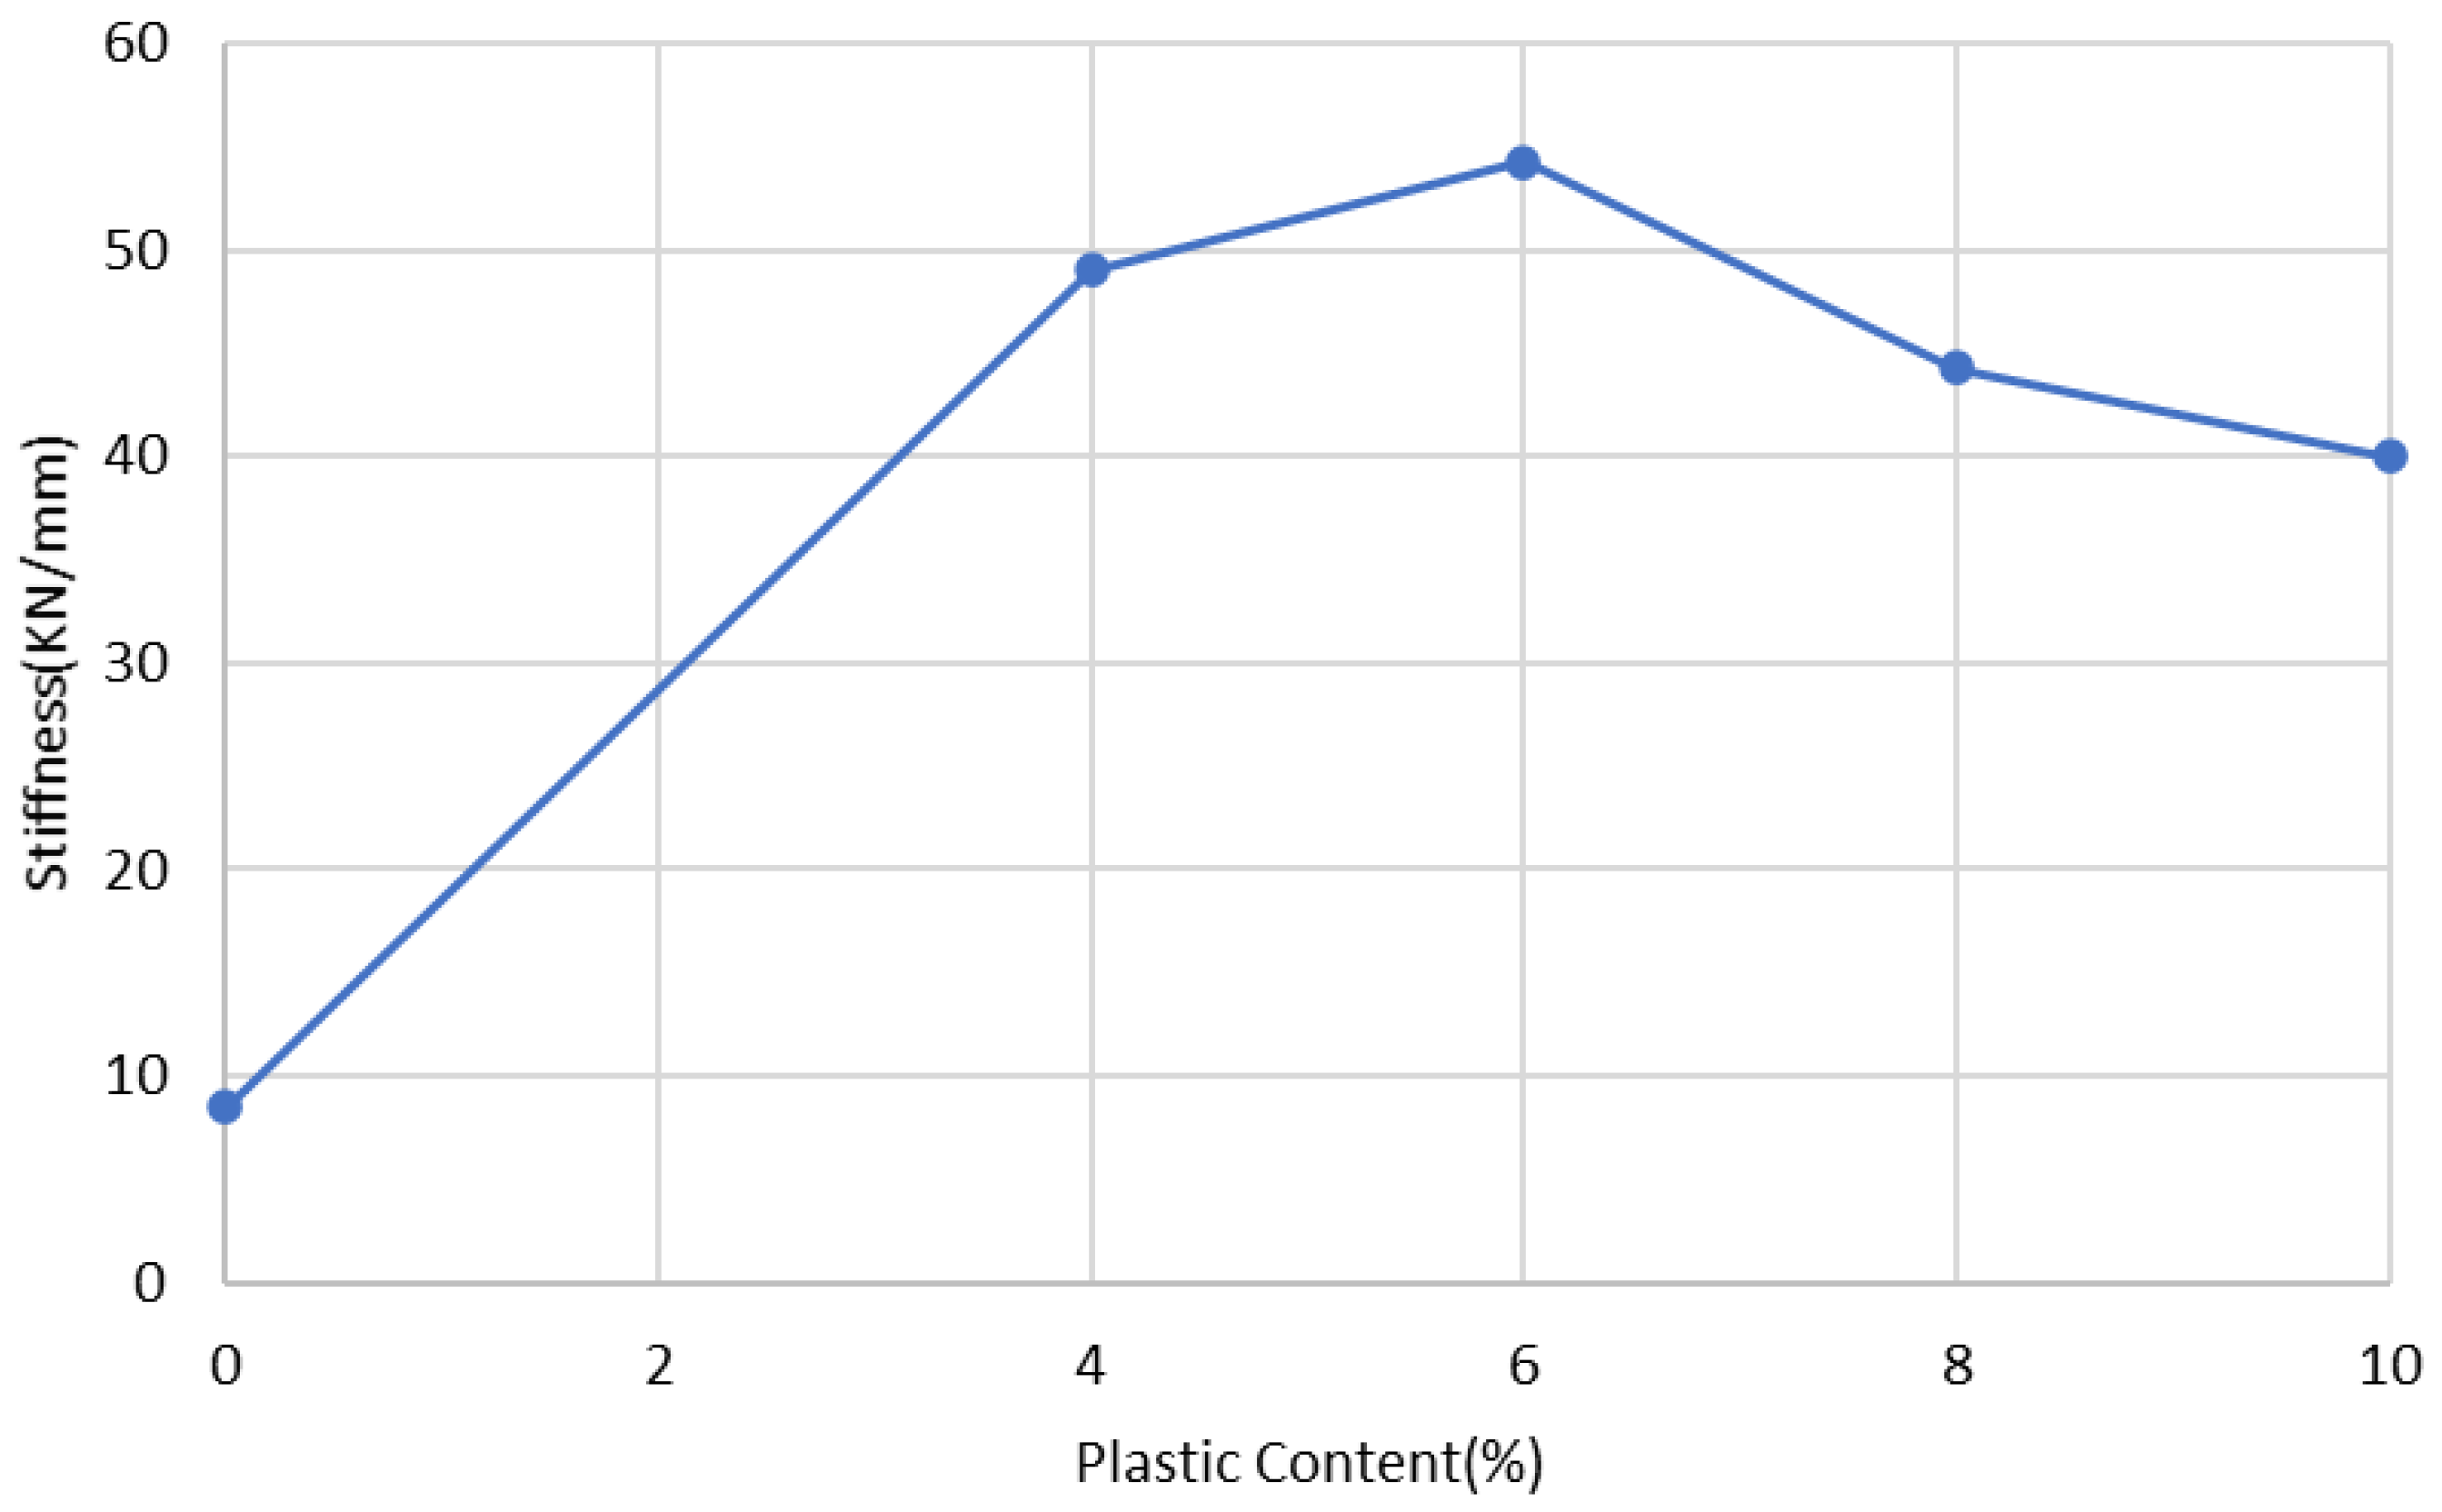
3.5. Stiffness
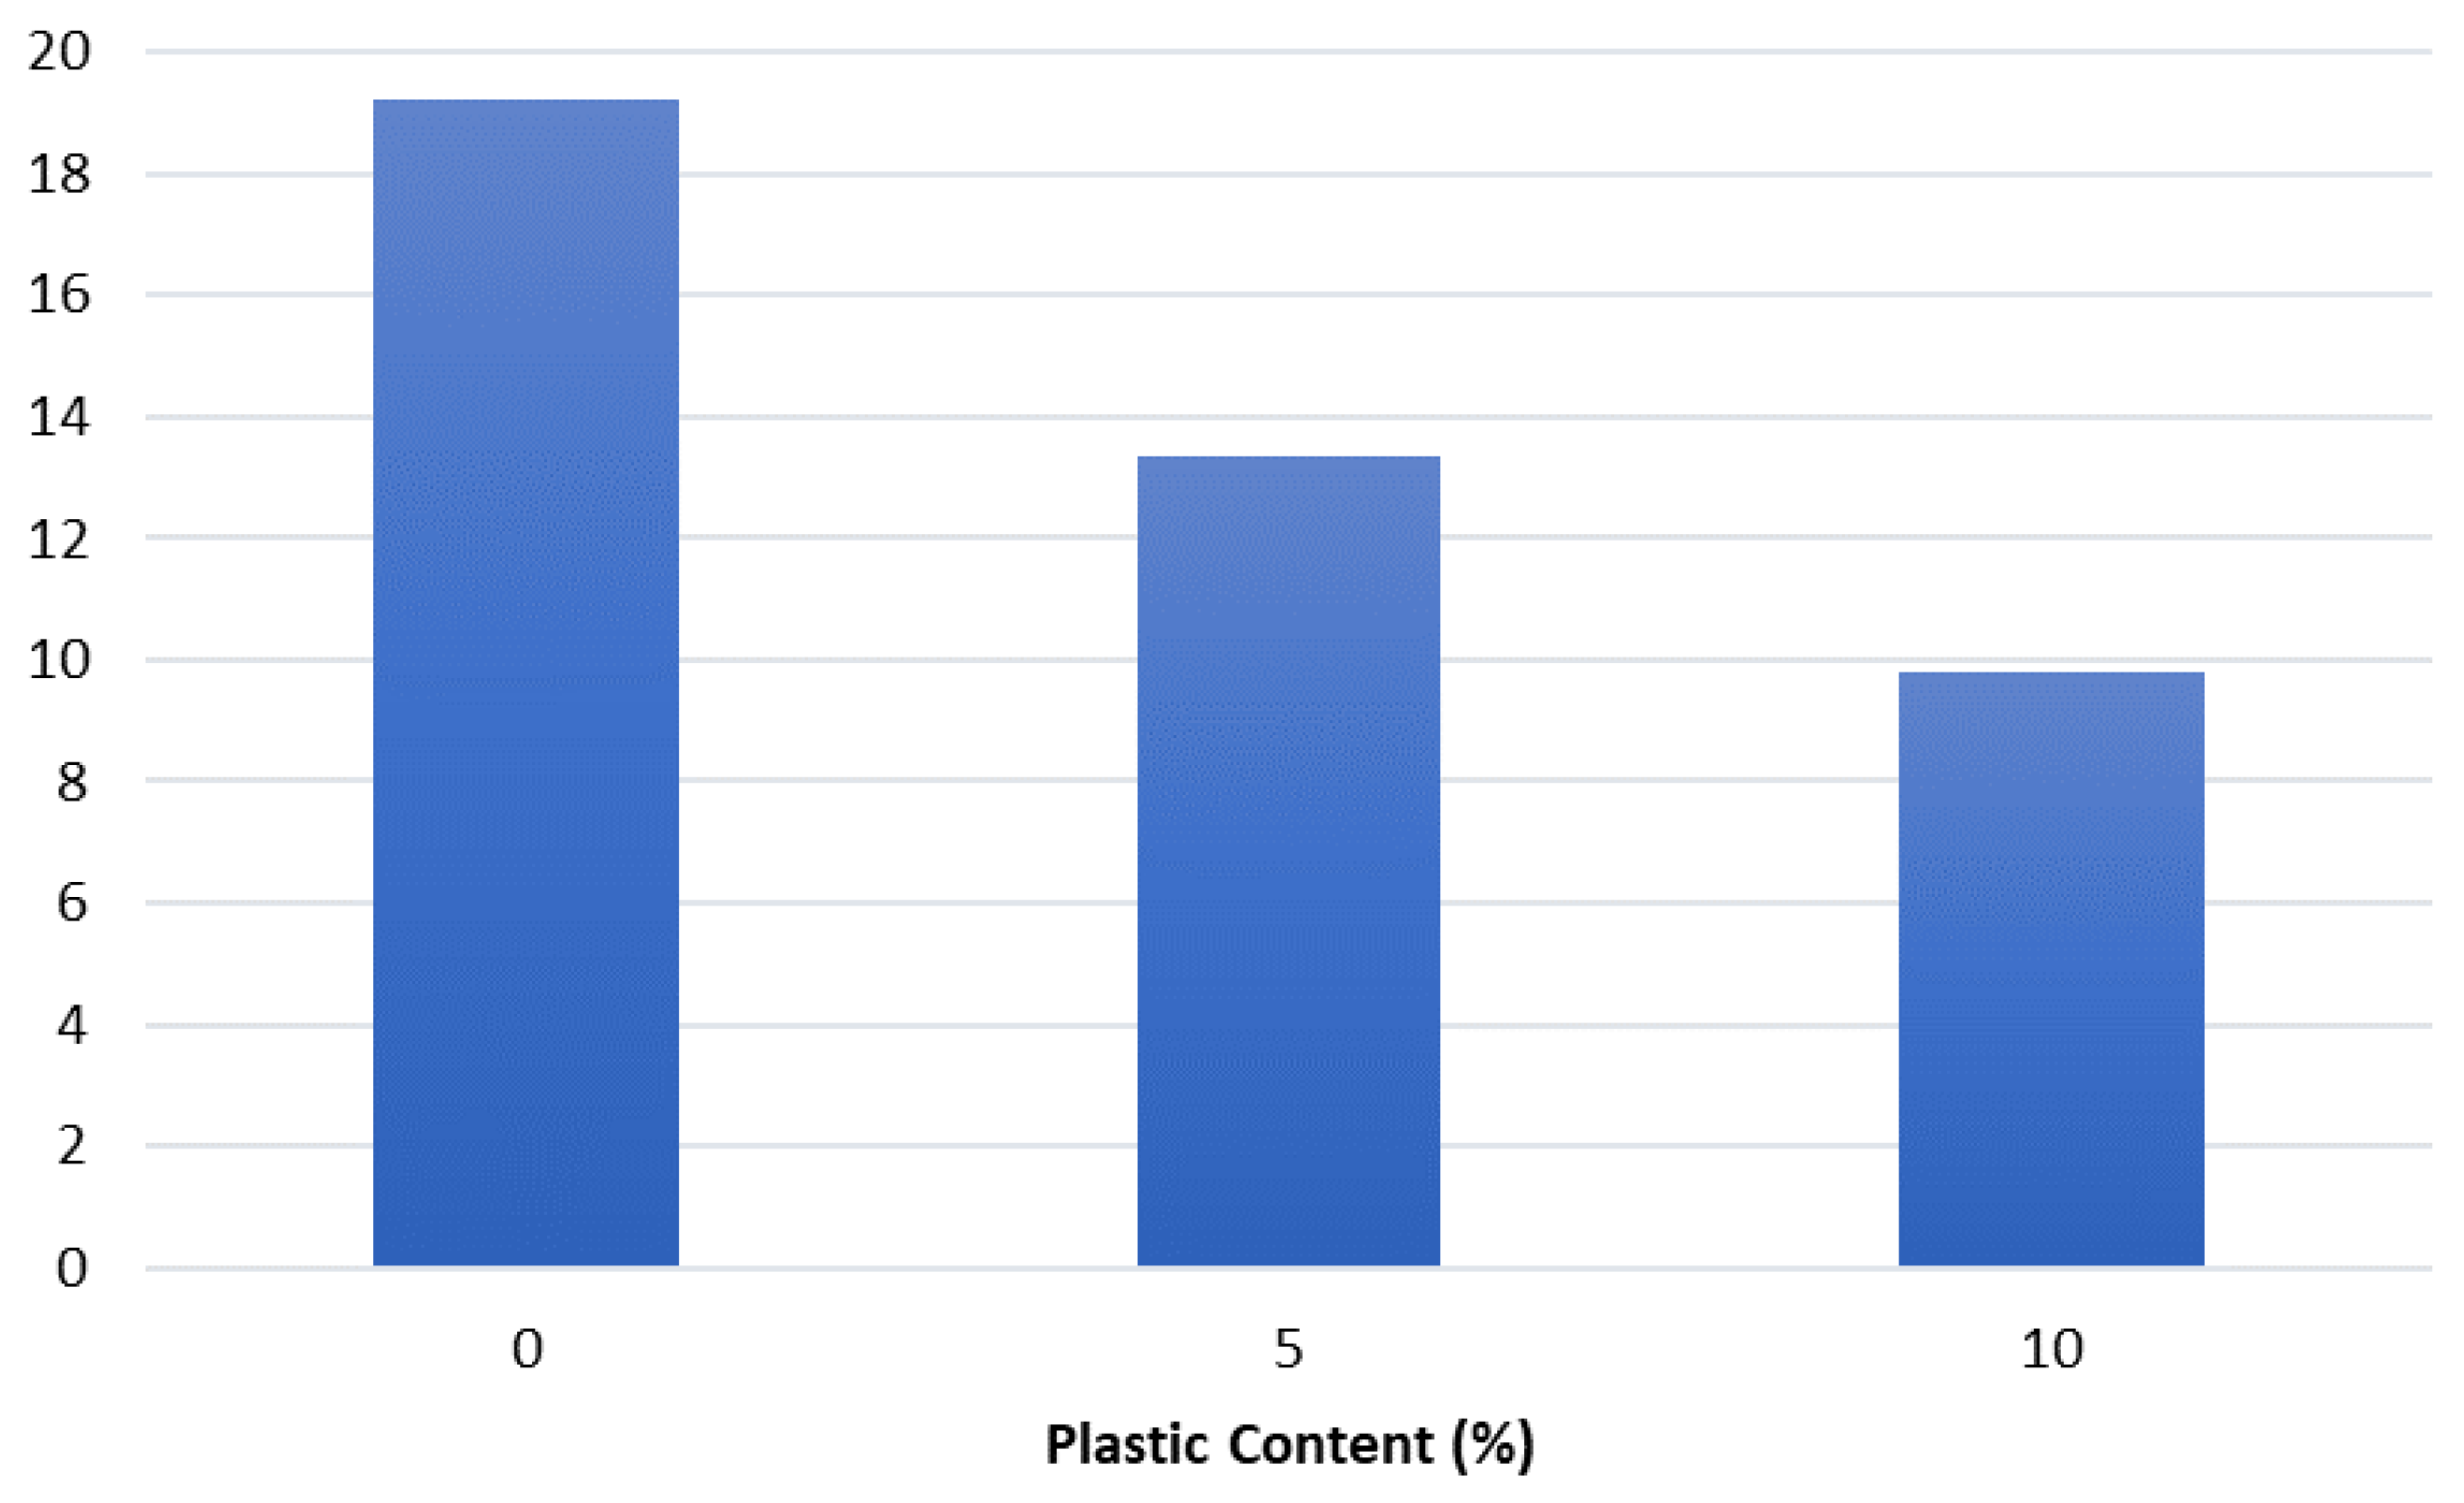
3.6. Aggregate Impact Value
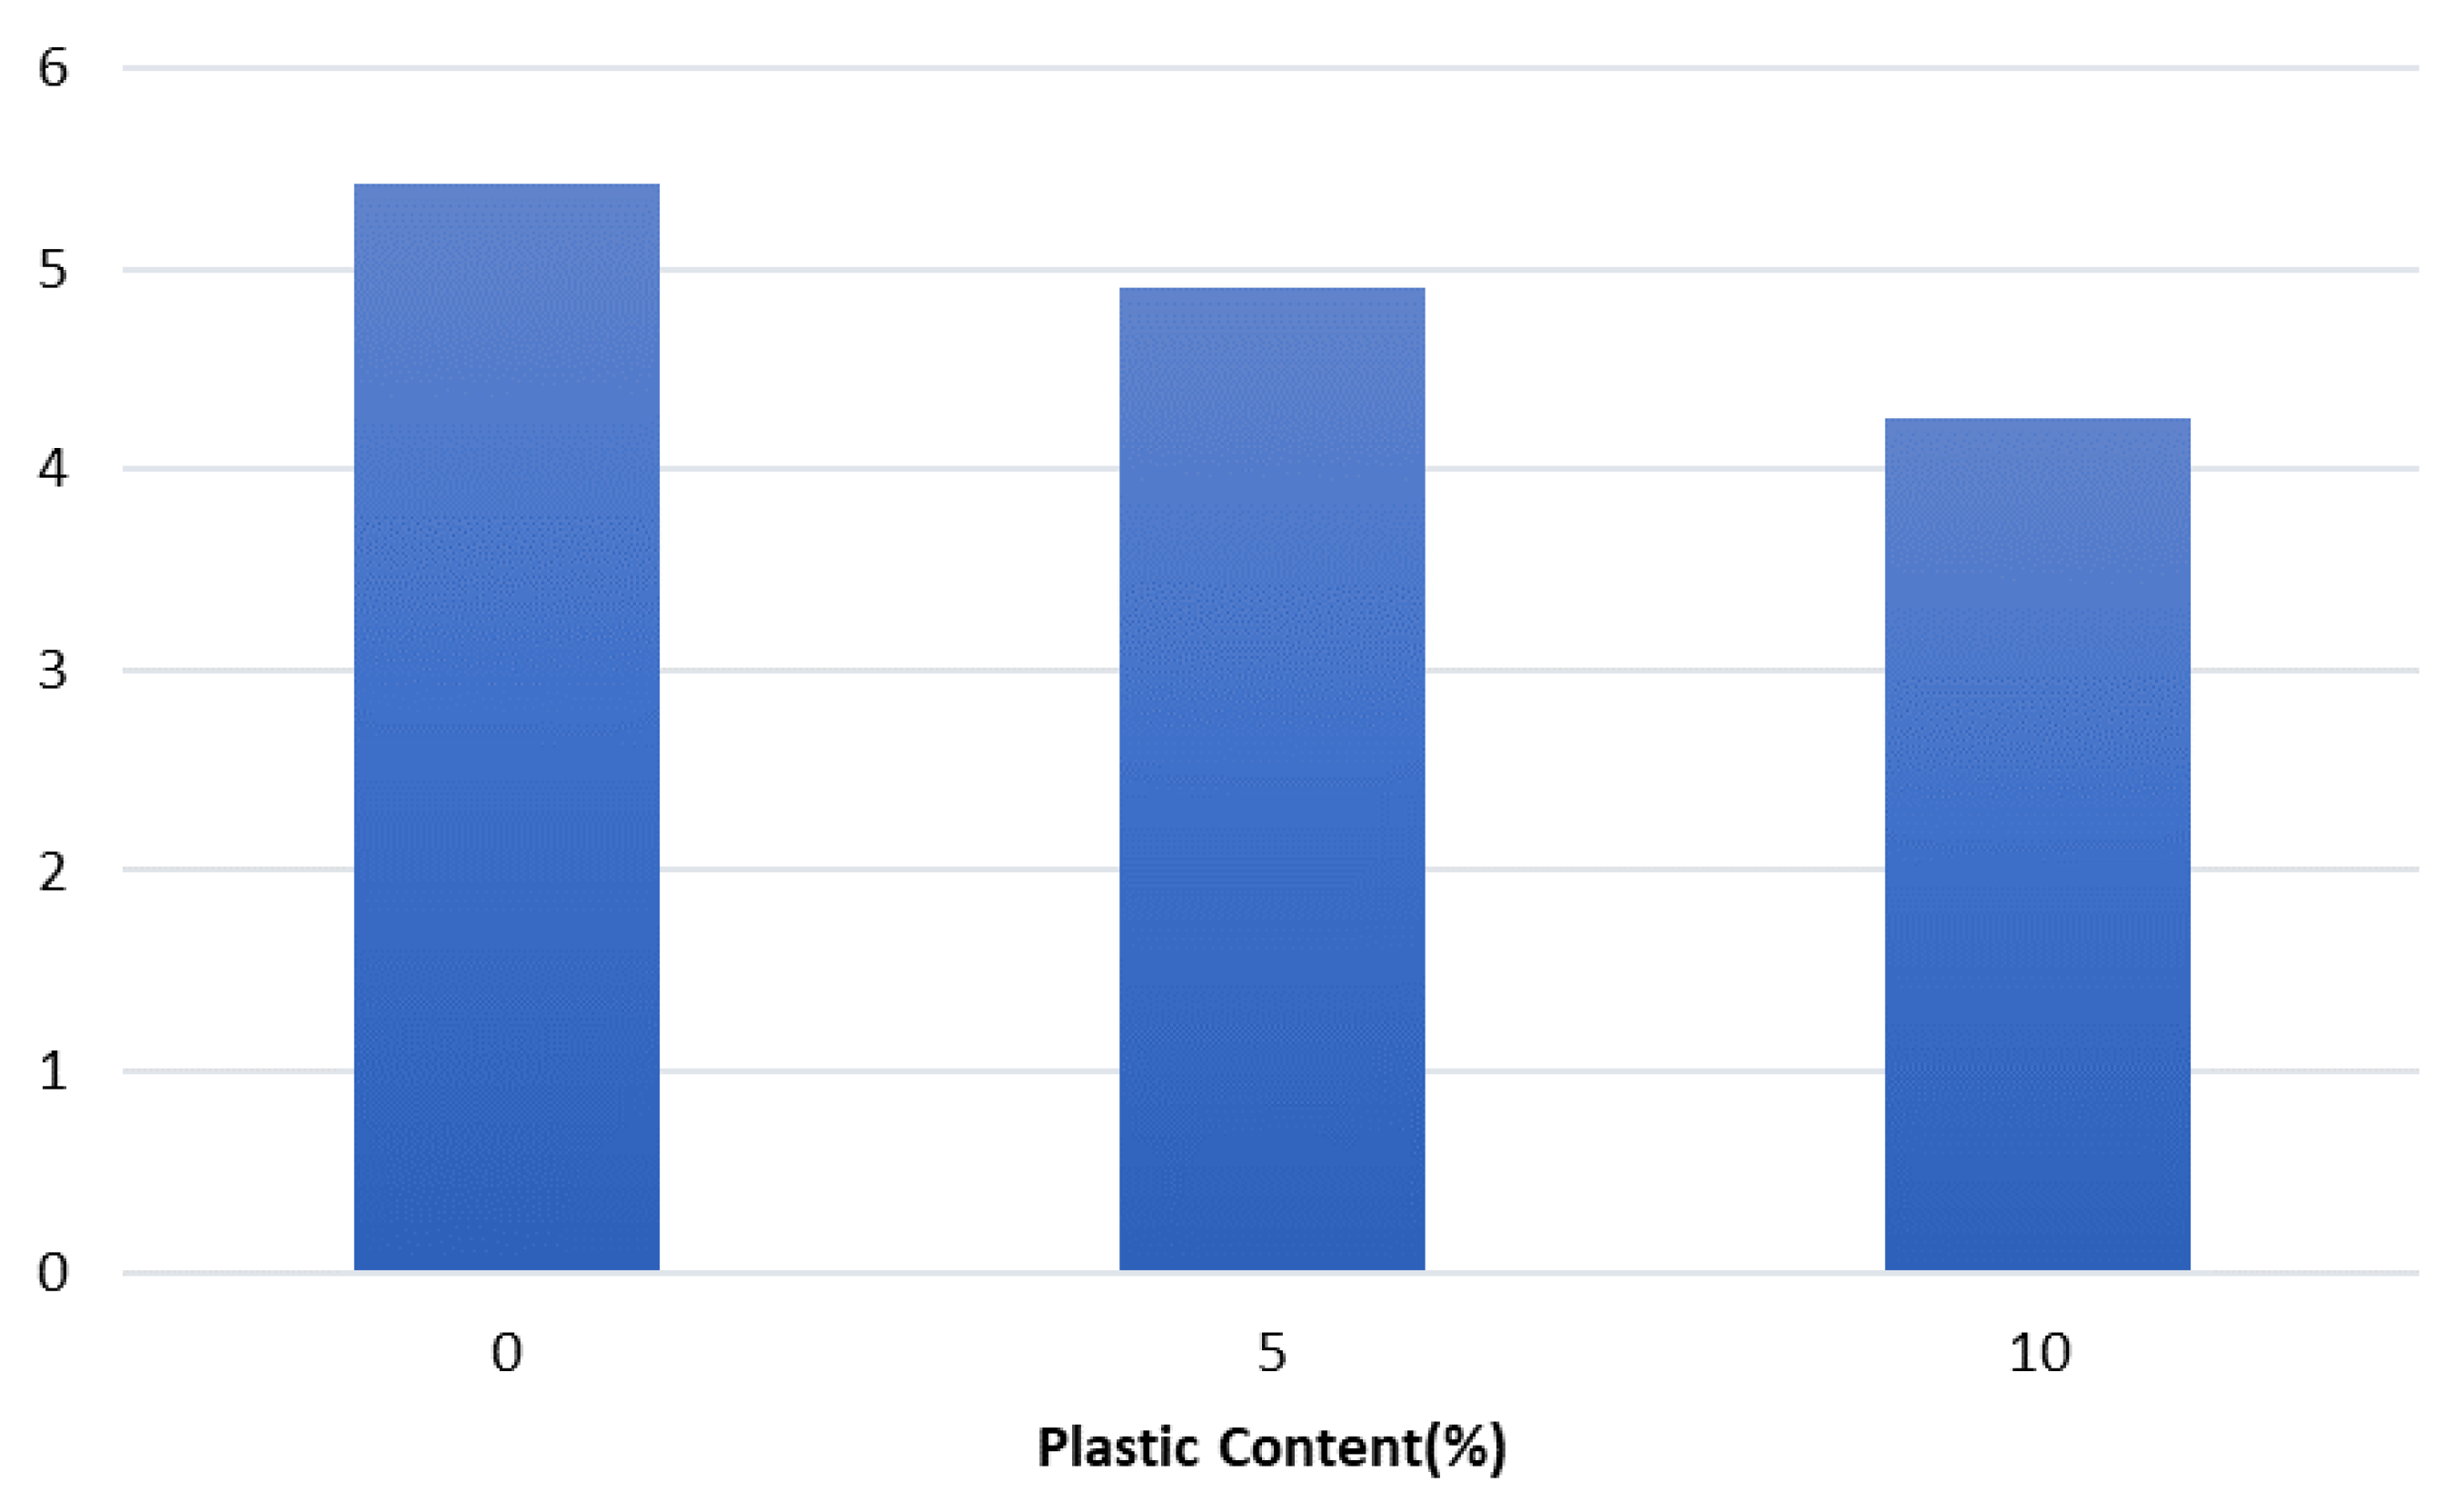
3.7. Aggregate Crushing Value
3.8. Specific Gravity
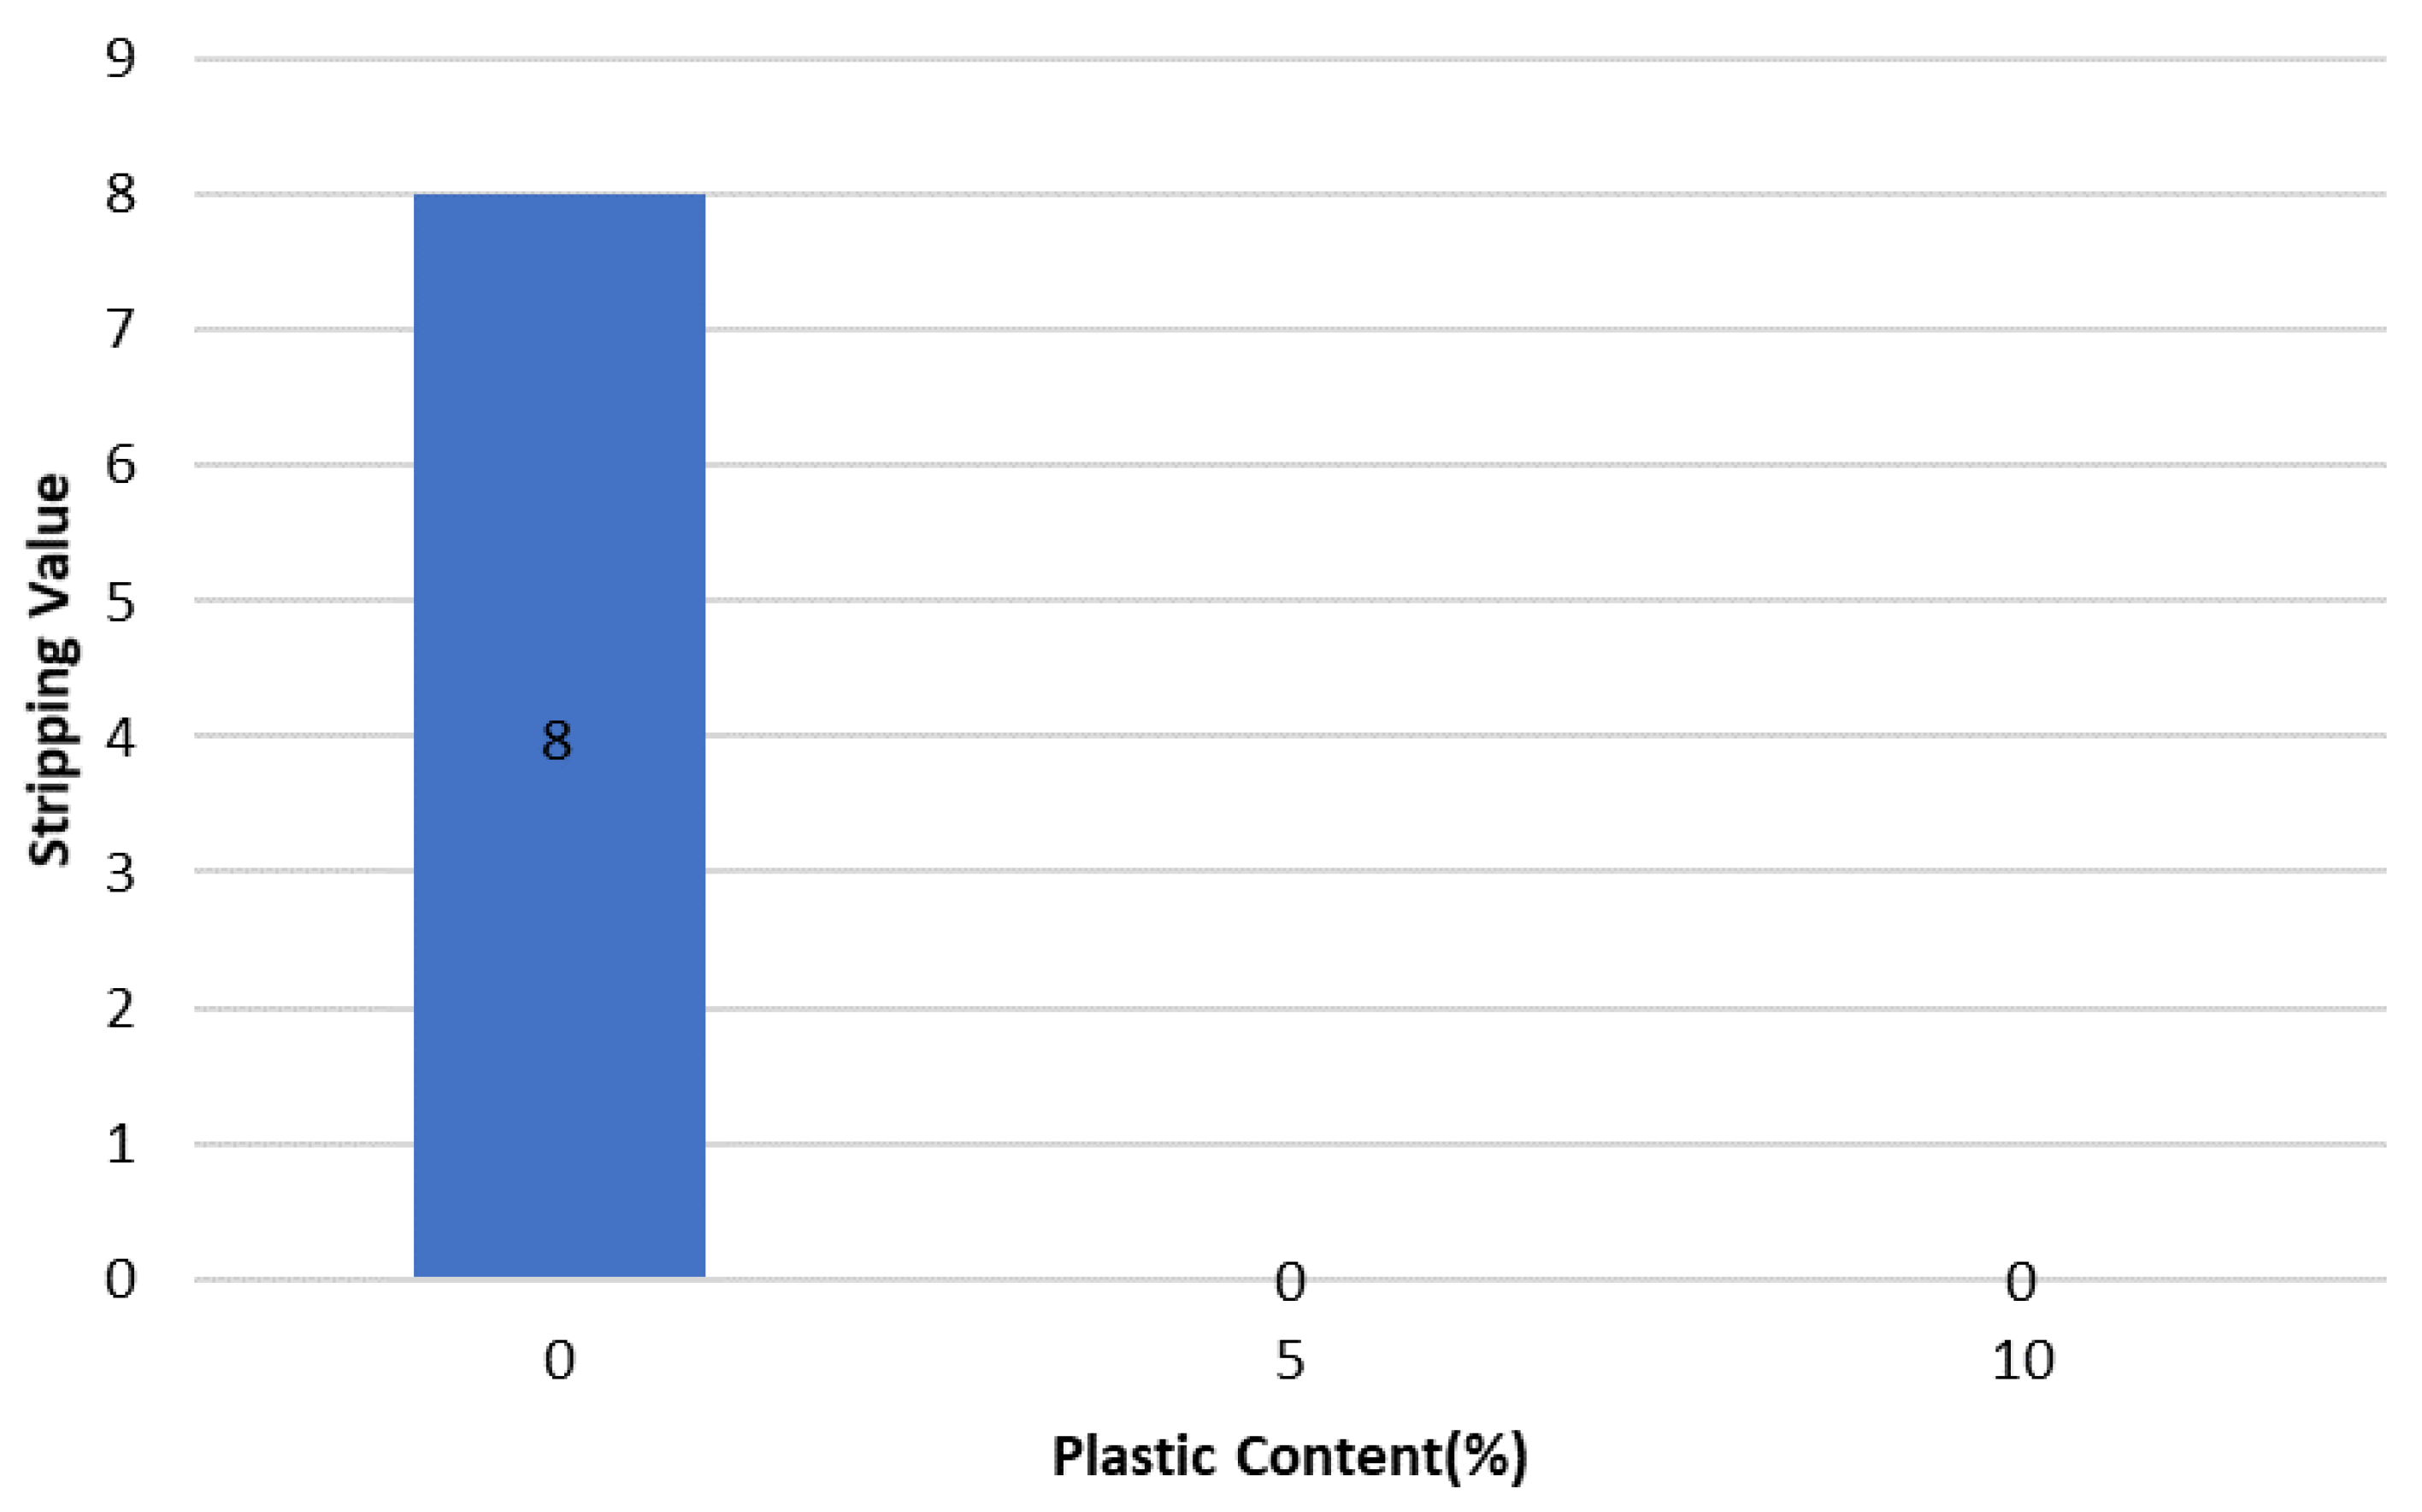
3.9. Stripping Value
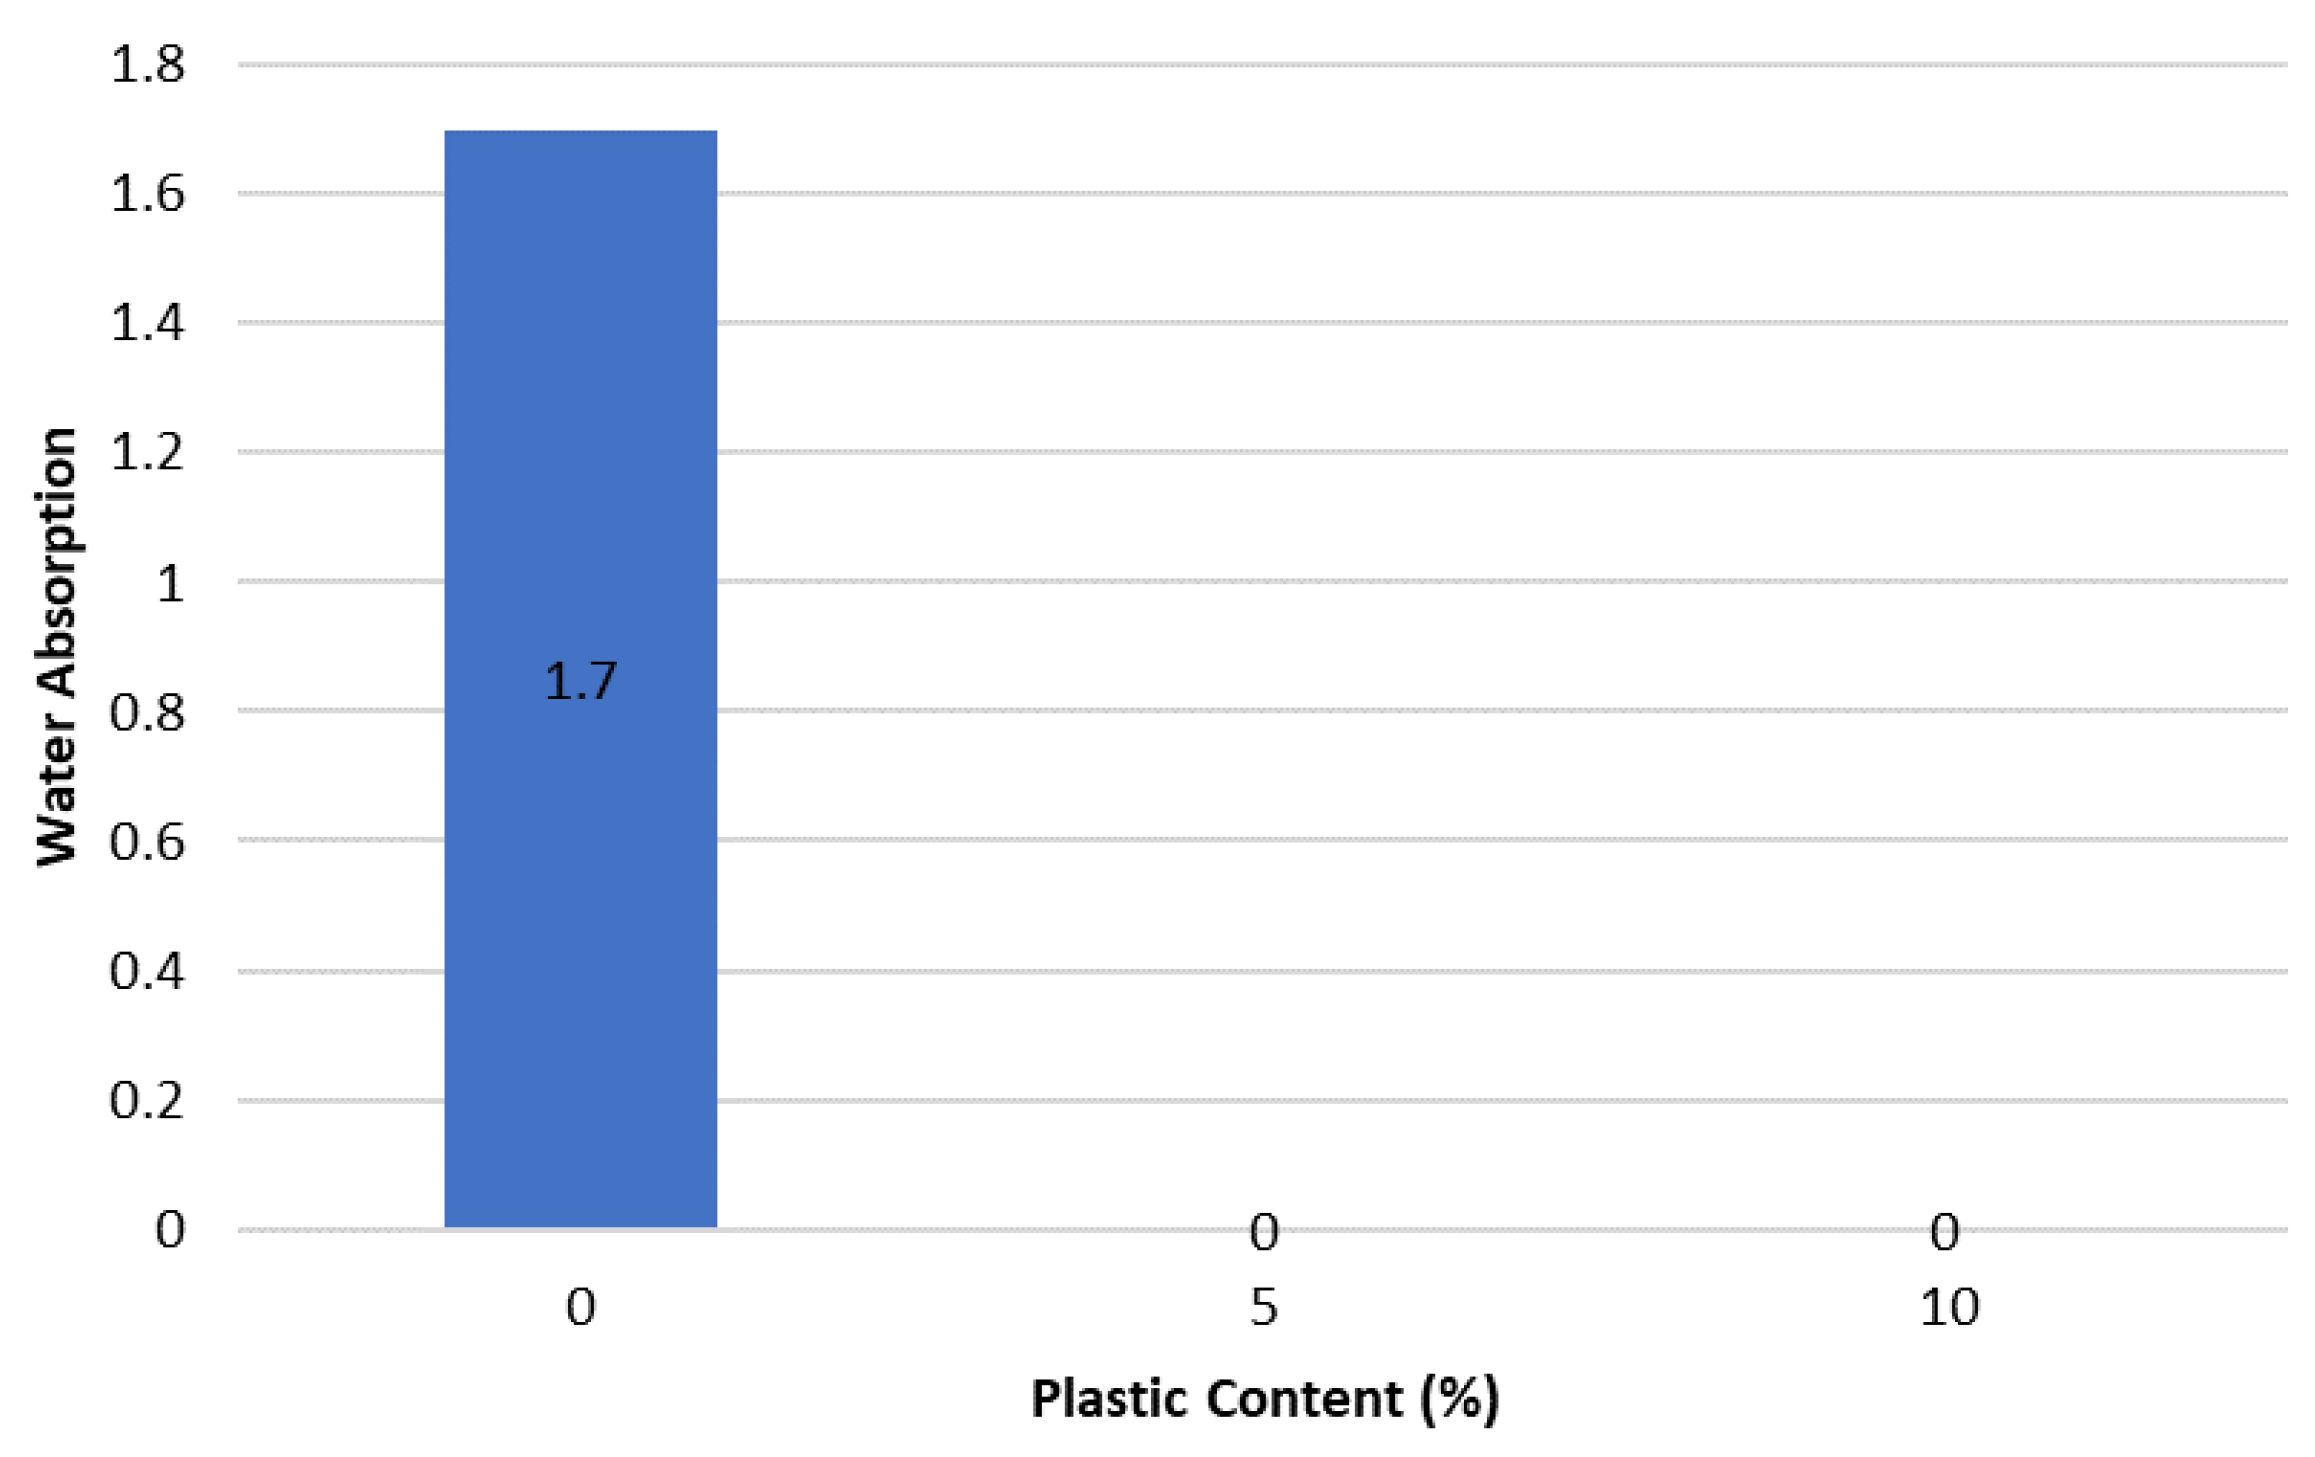
3.10. Water Absorption
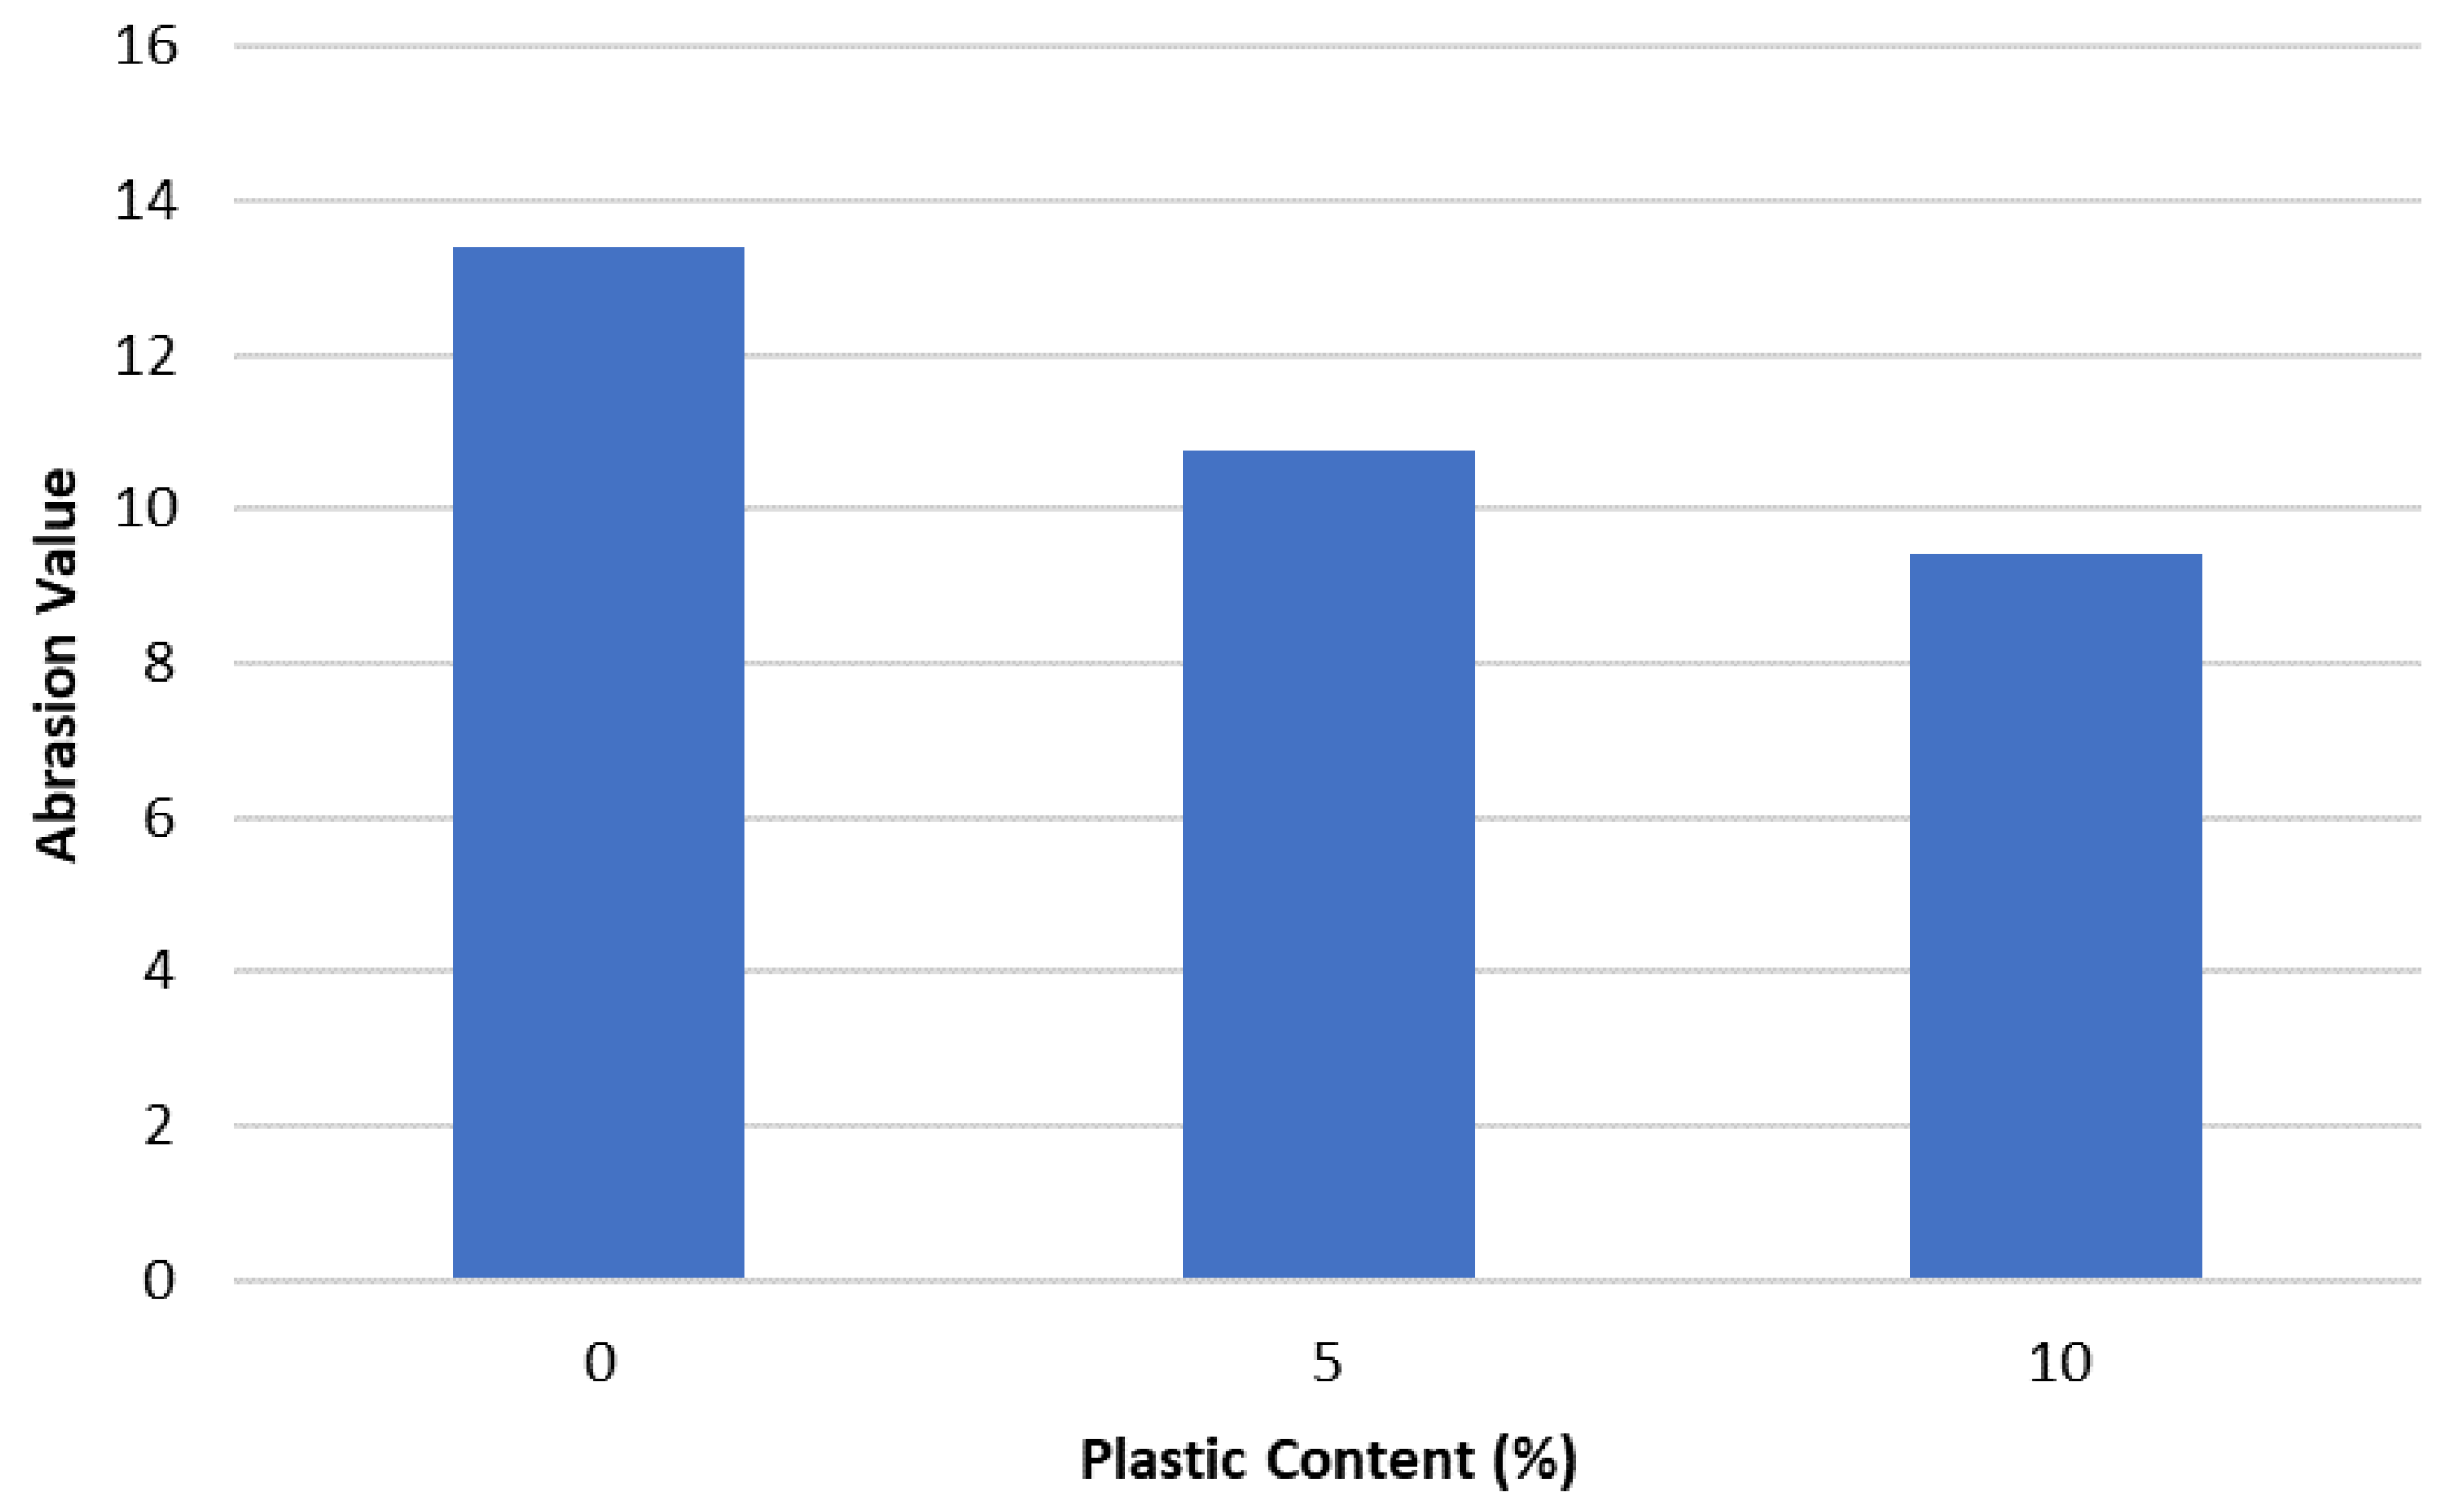
3.11. Los Angeles Abrasion Value
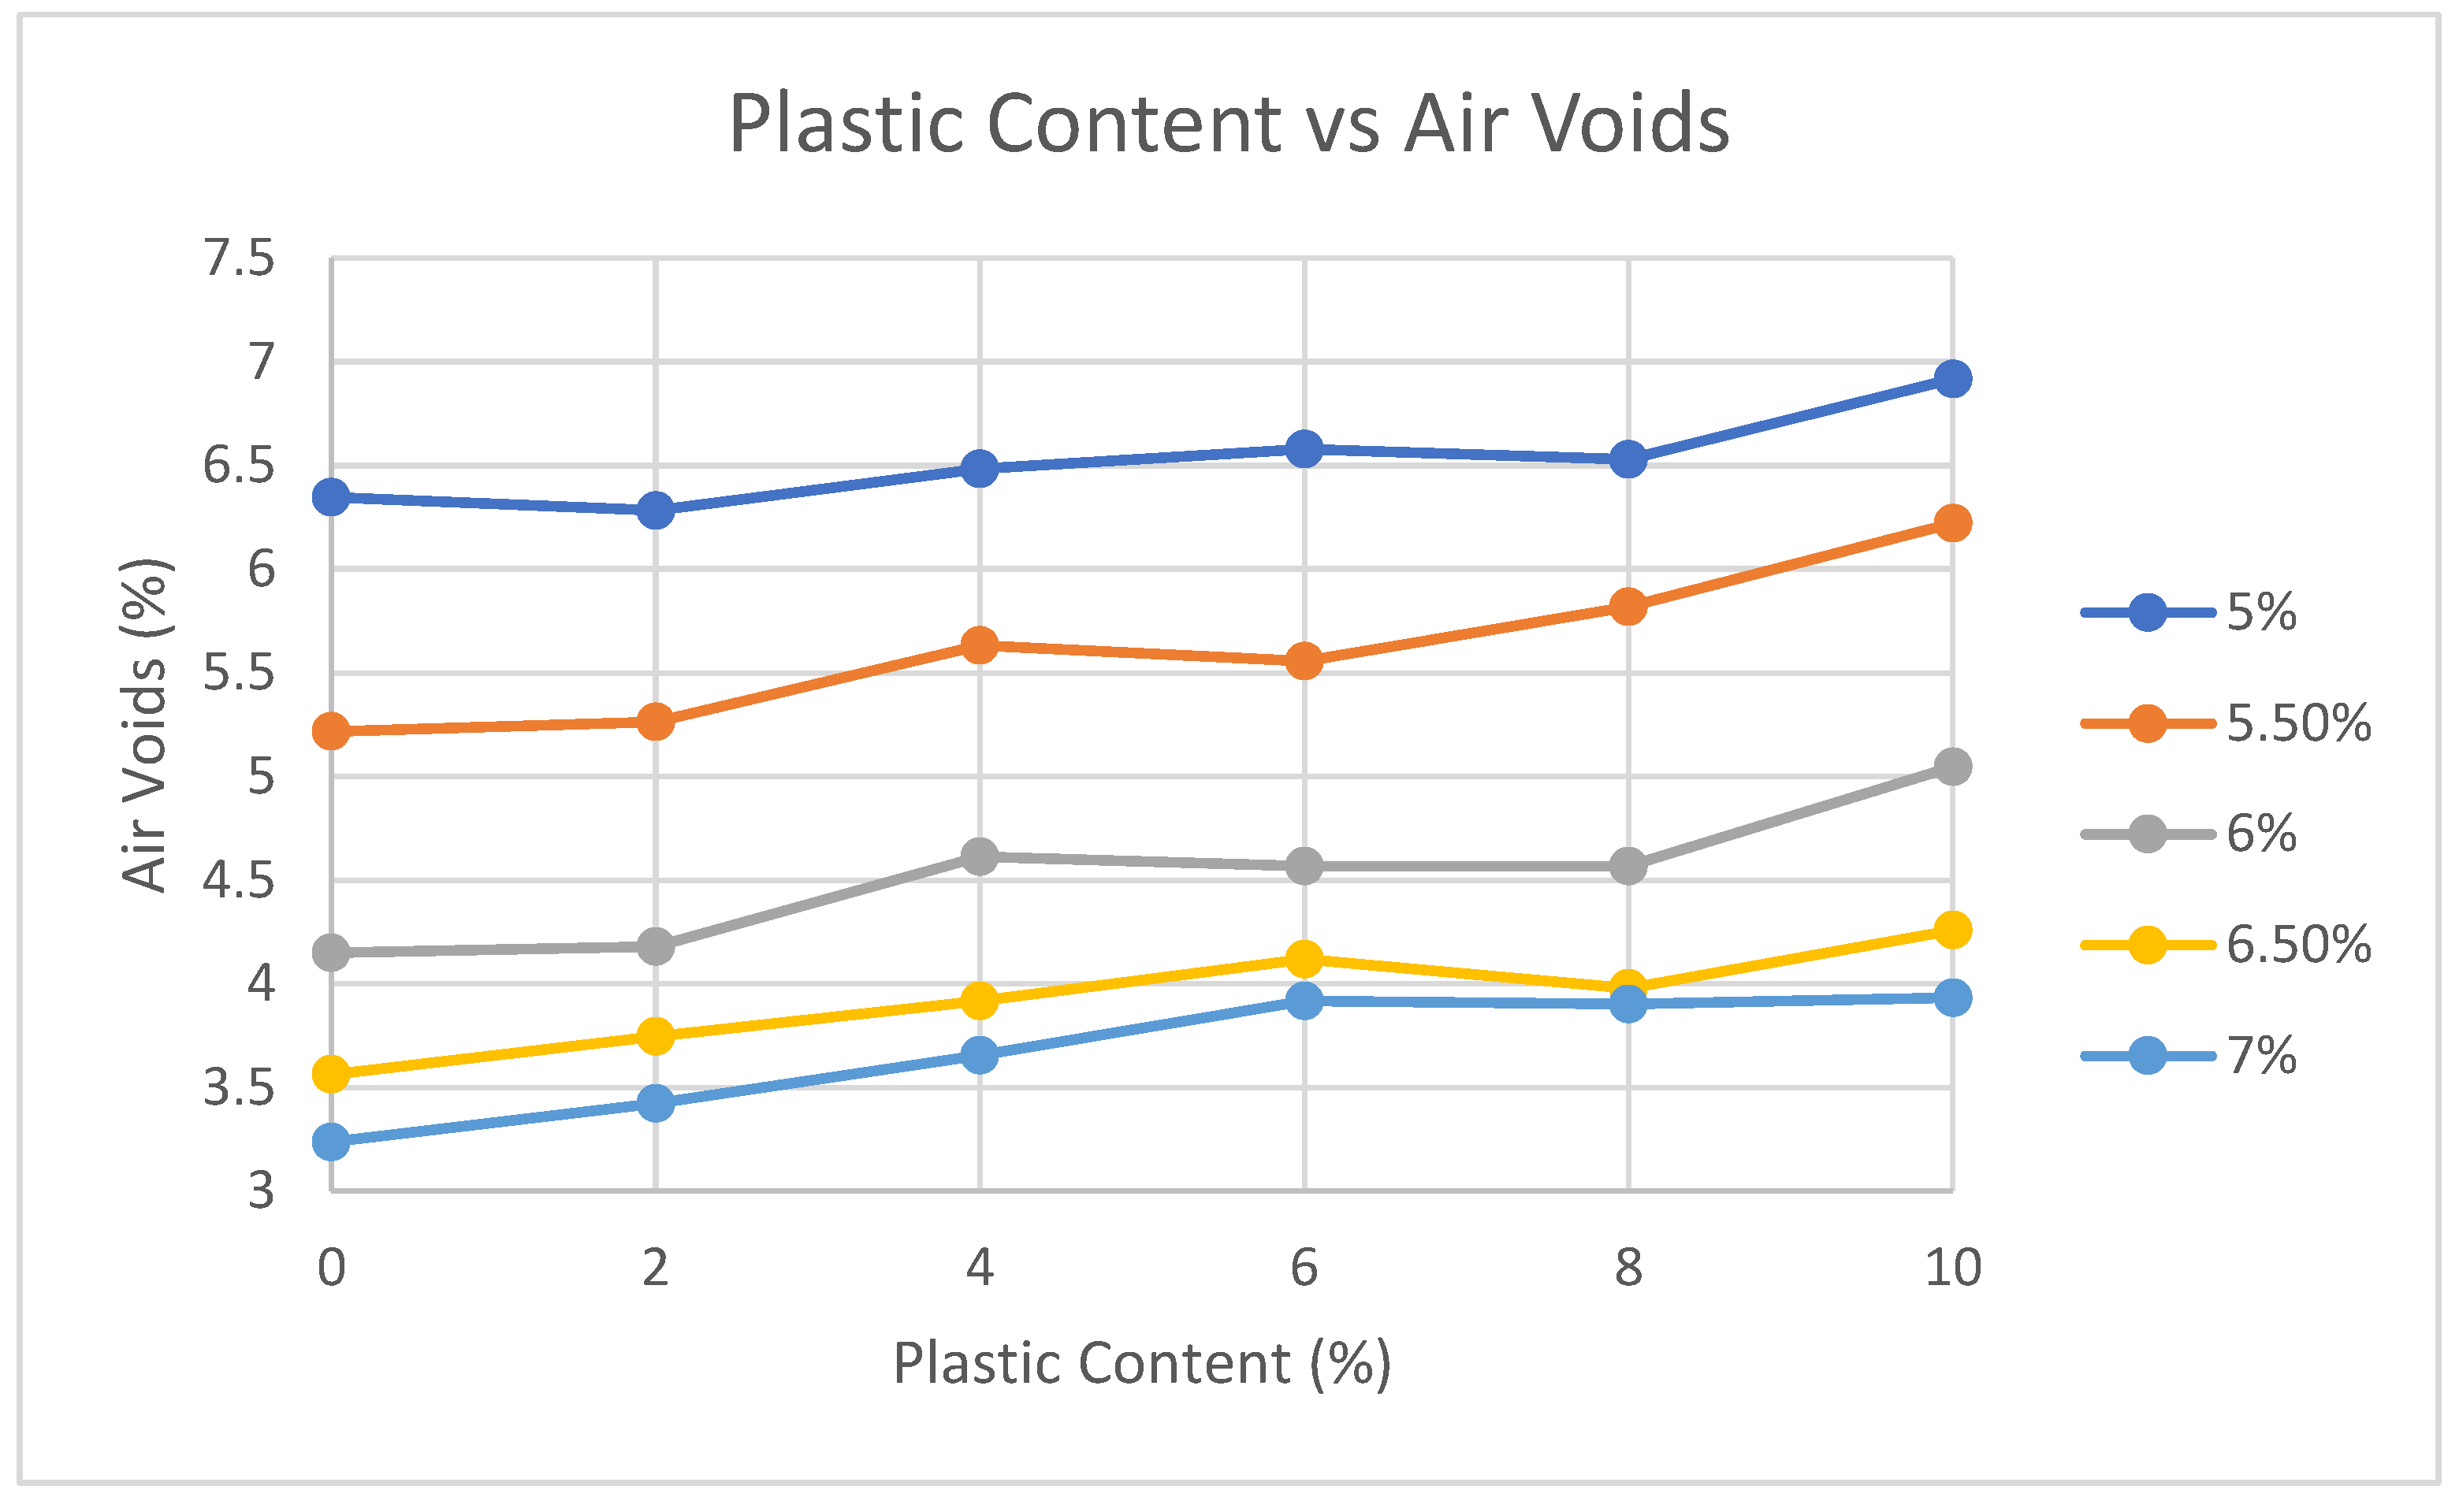
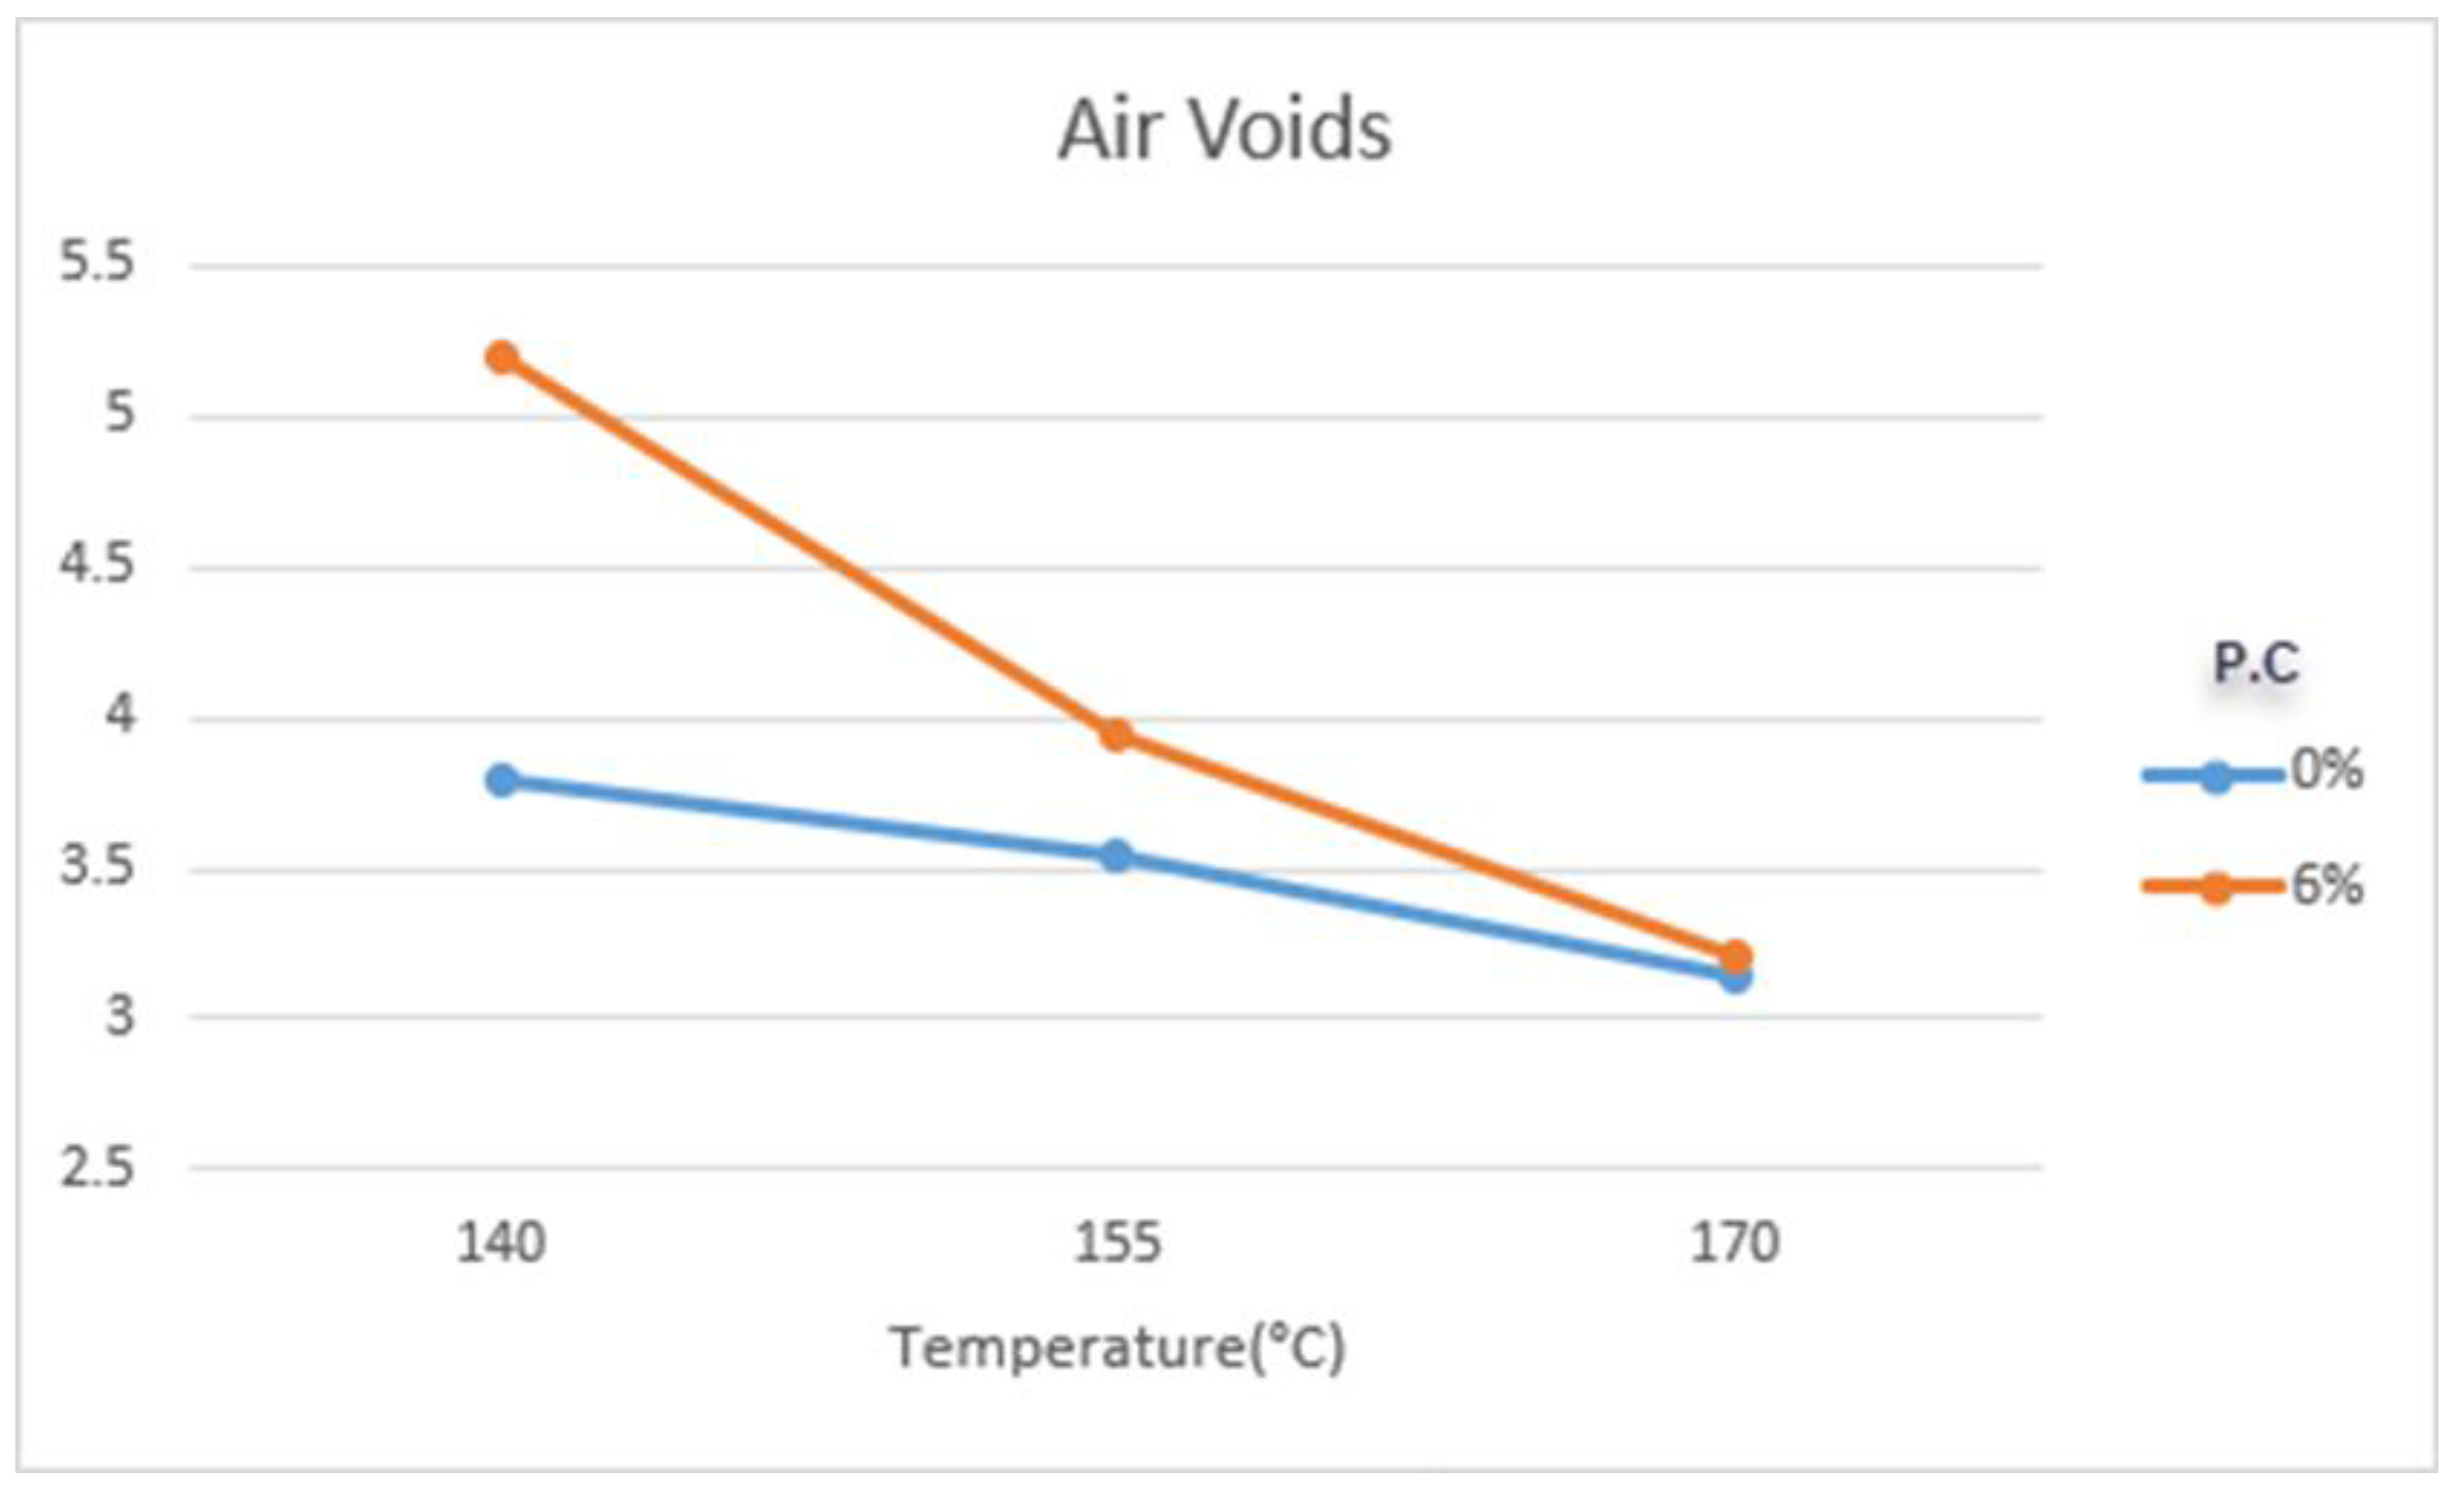
3.12. Air Void
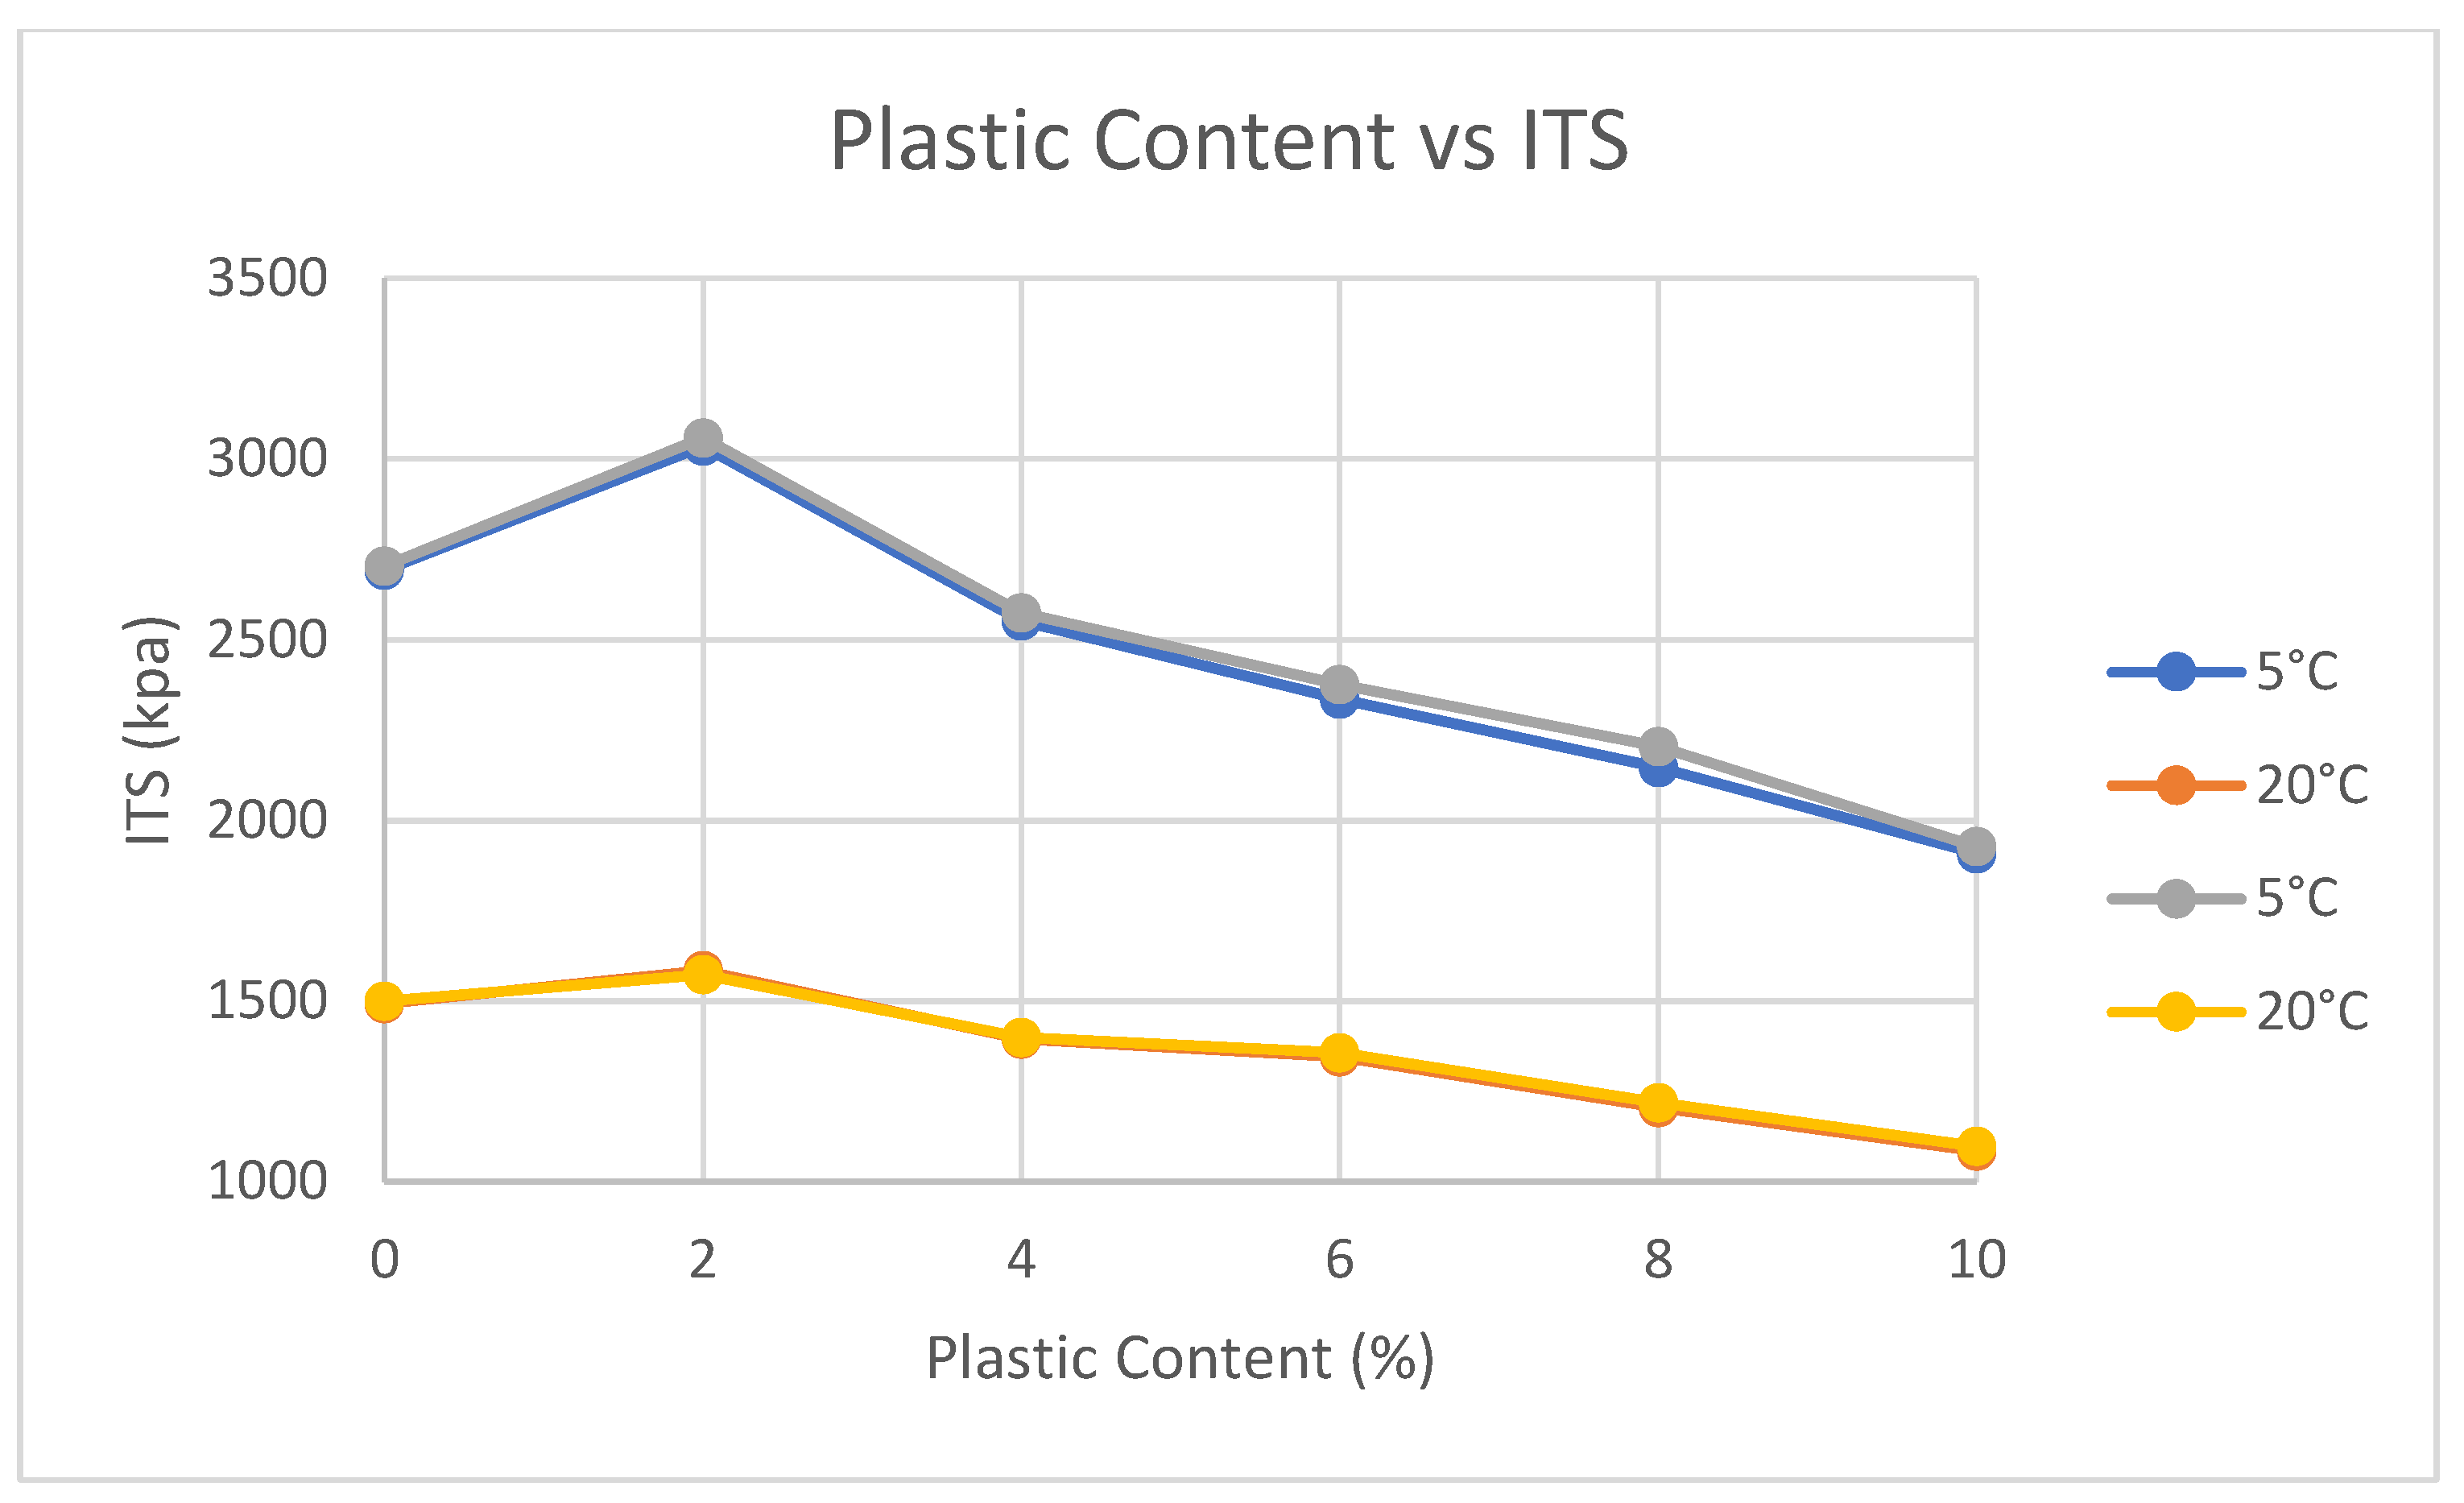
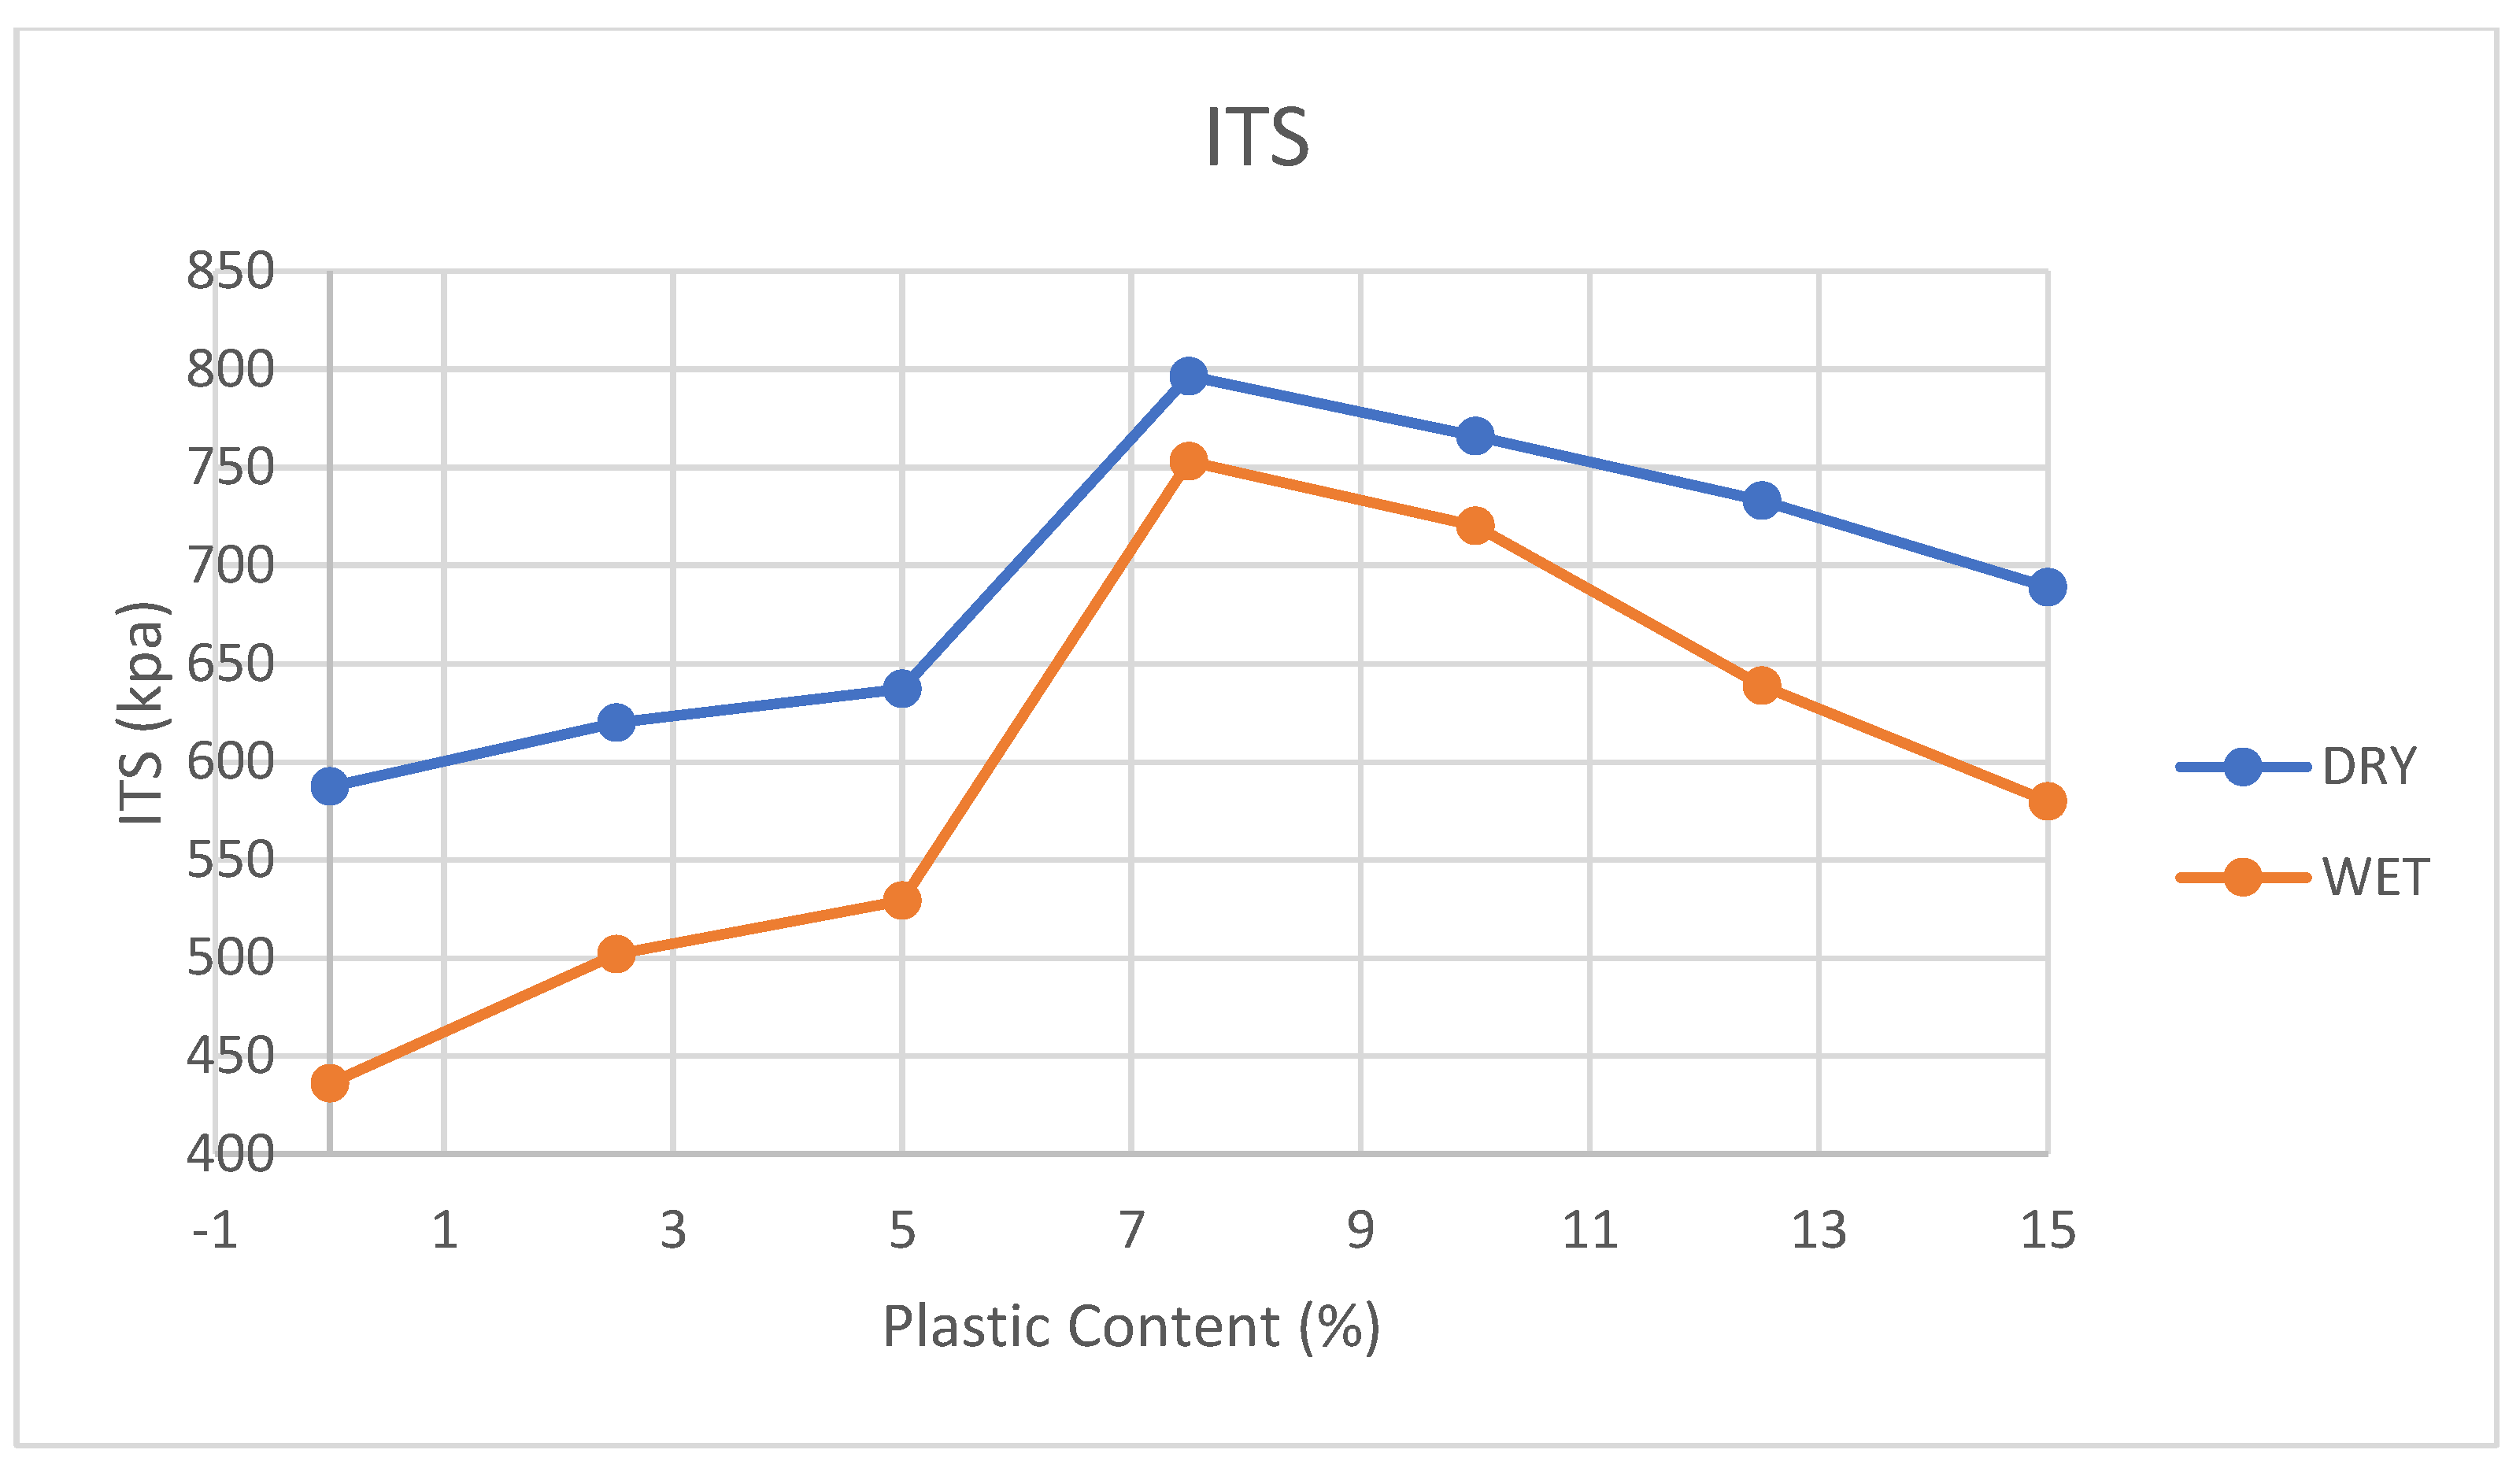
3.13. ITS Test
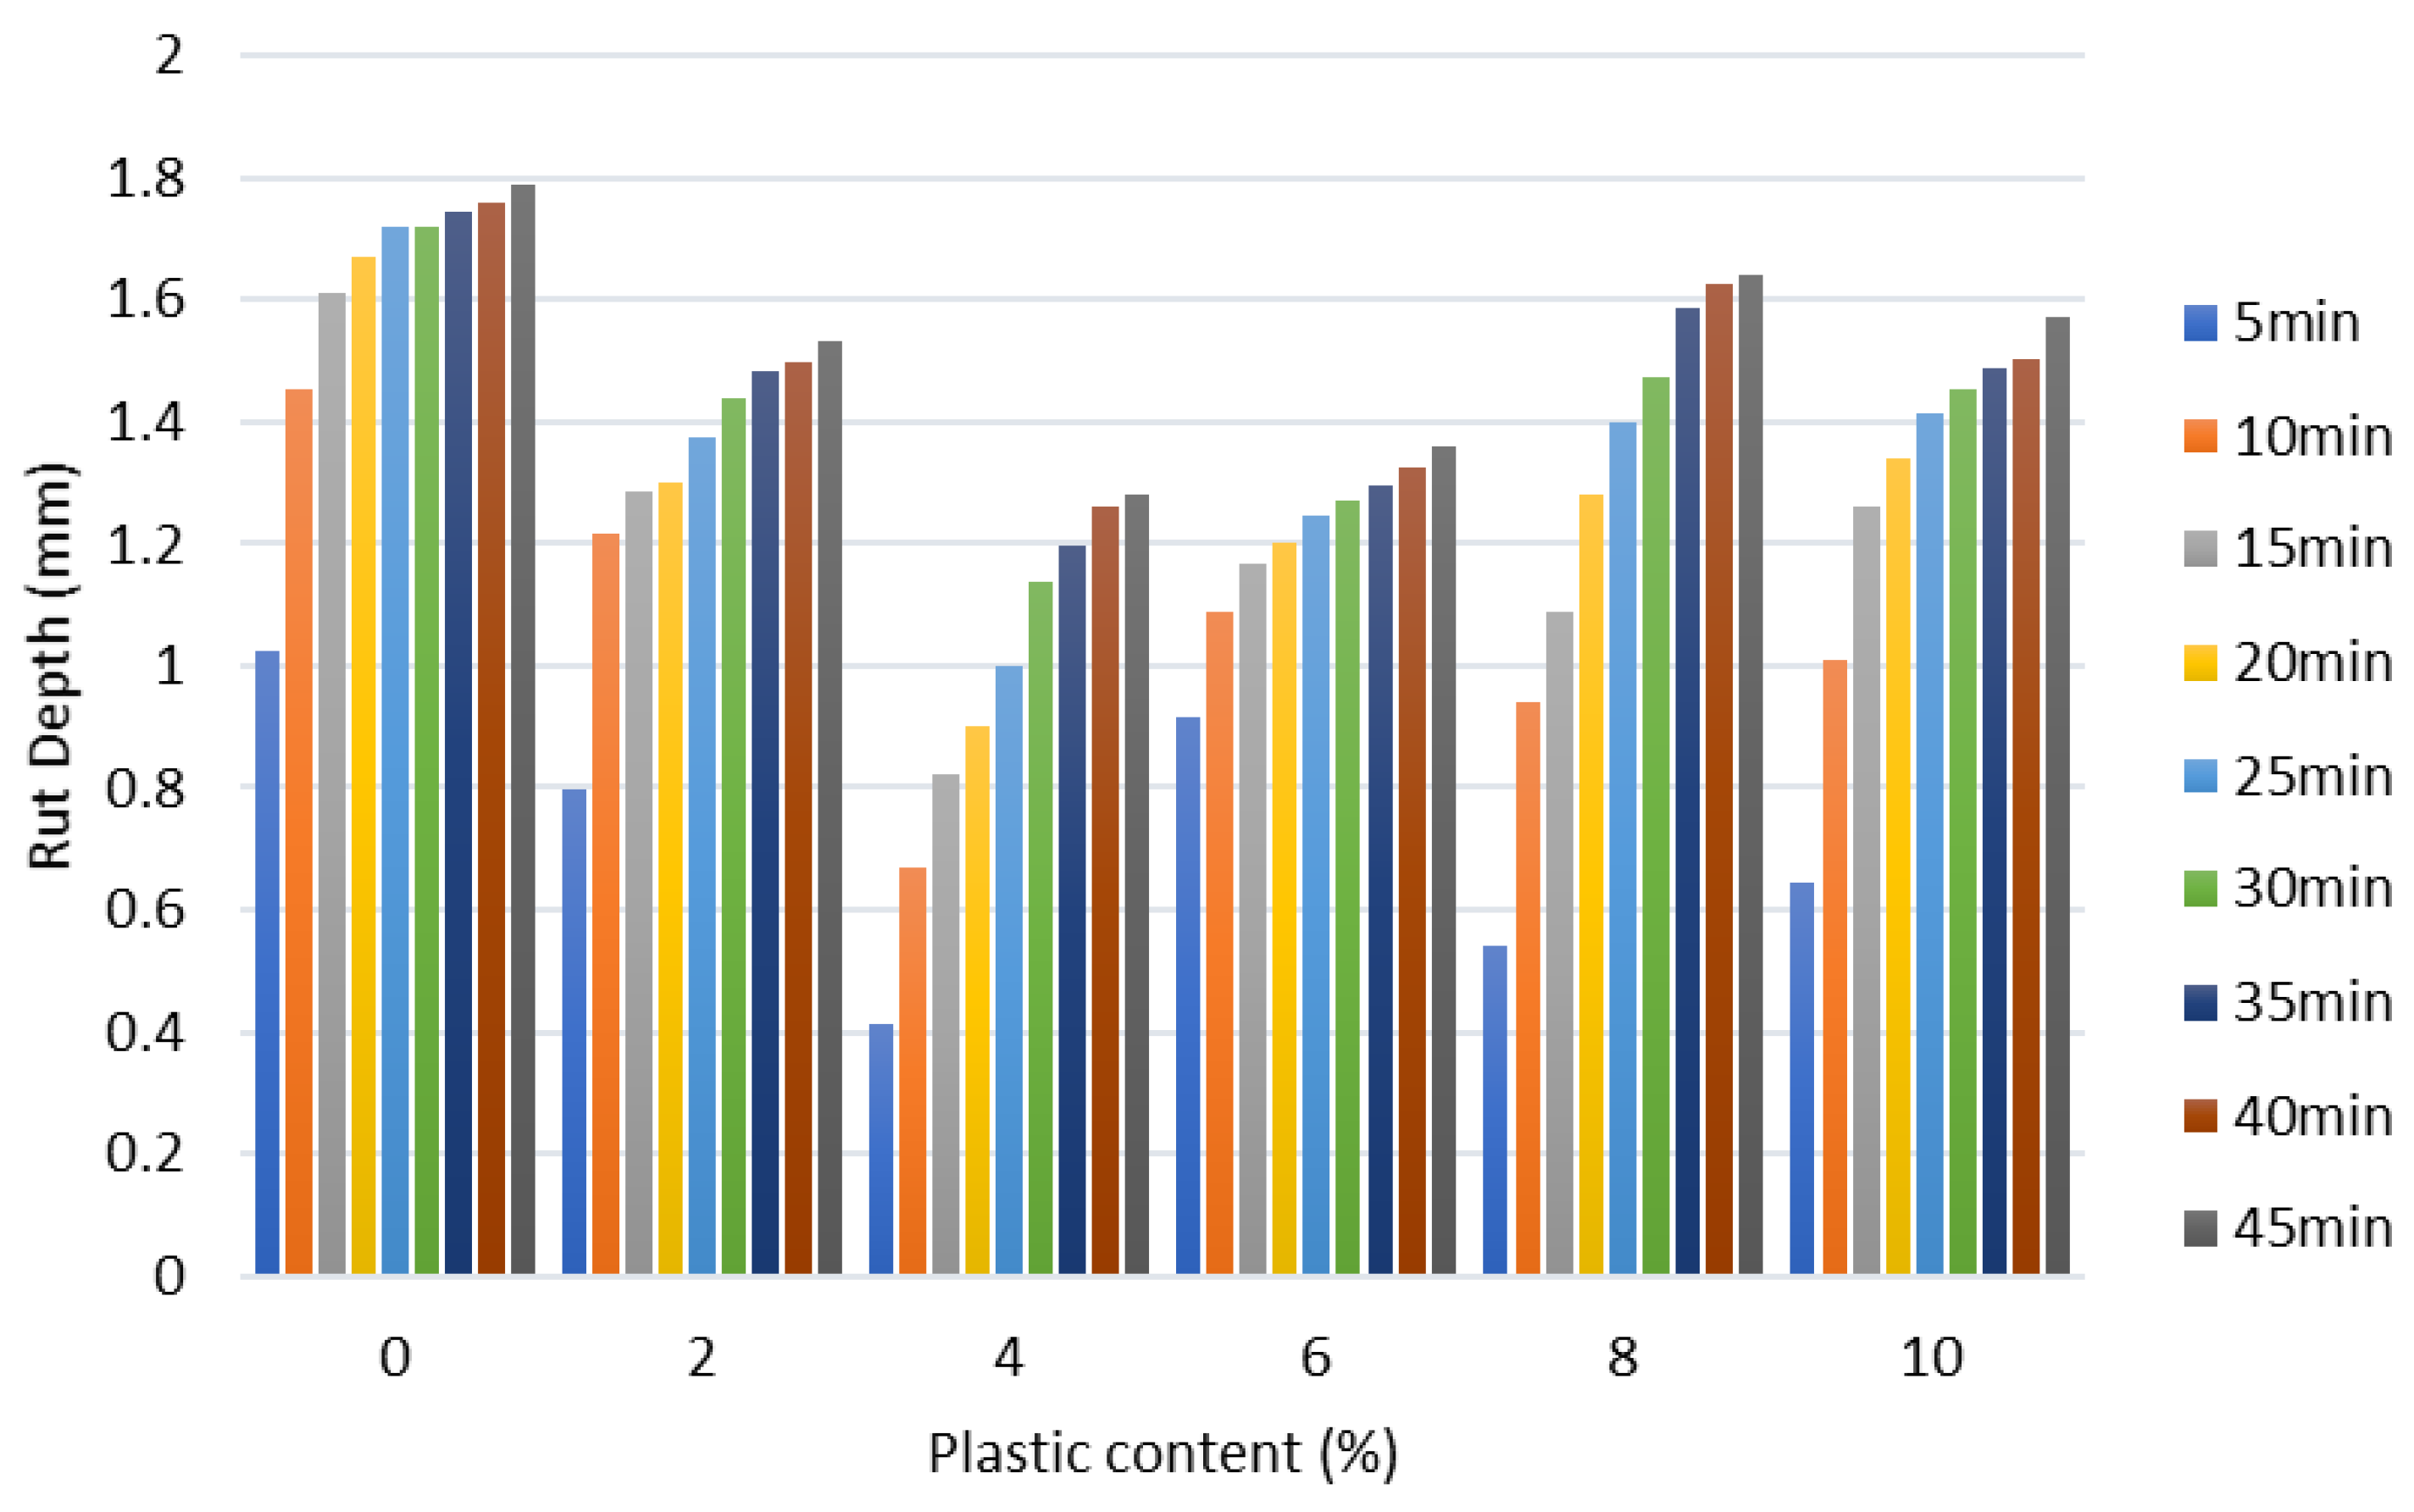
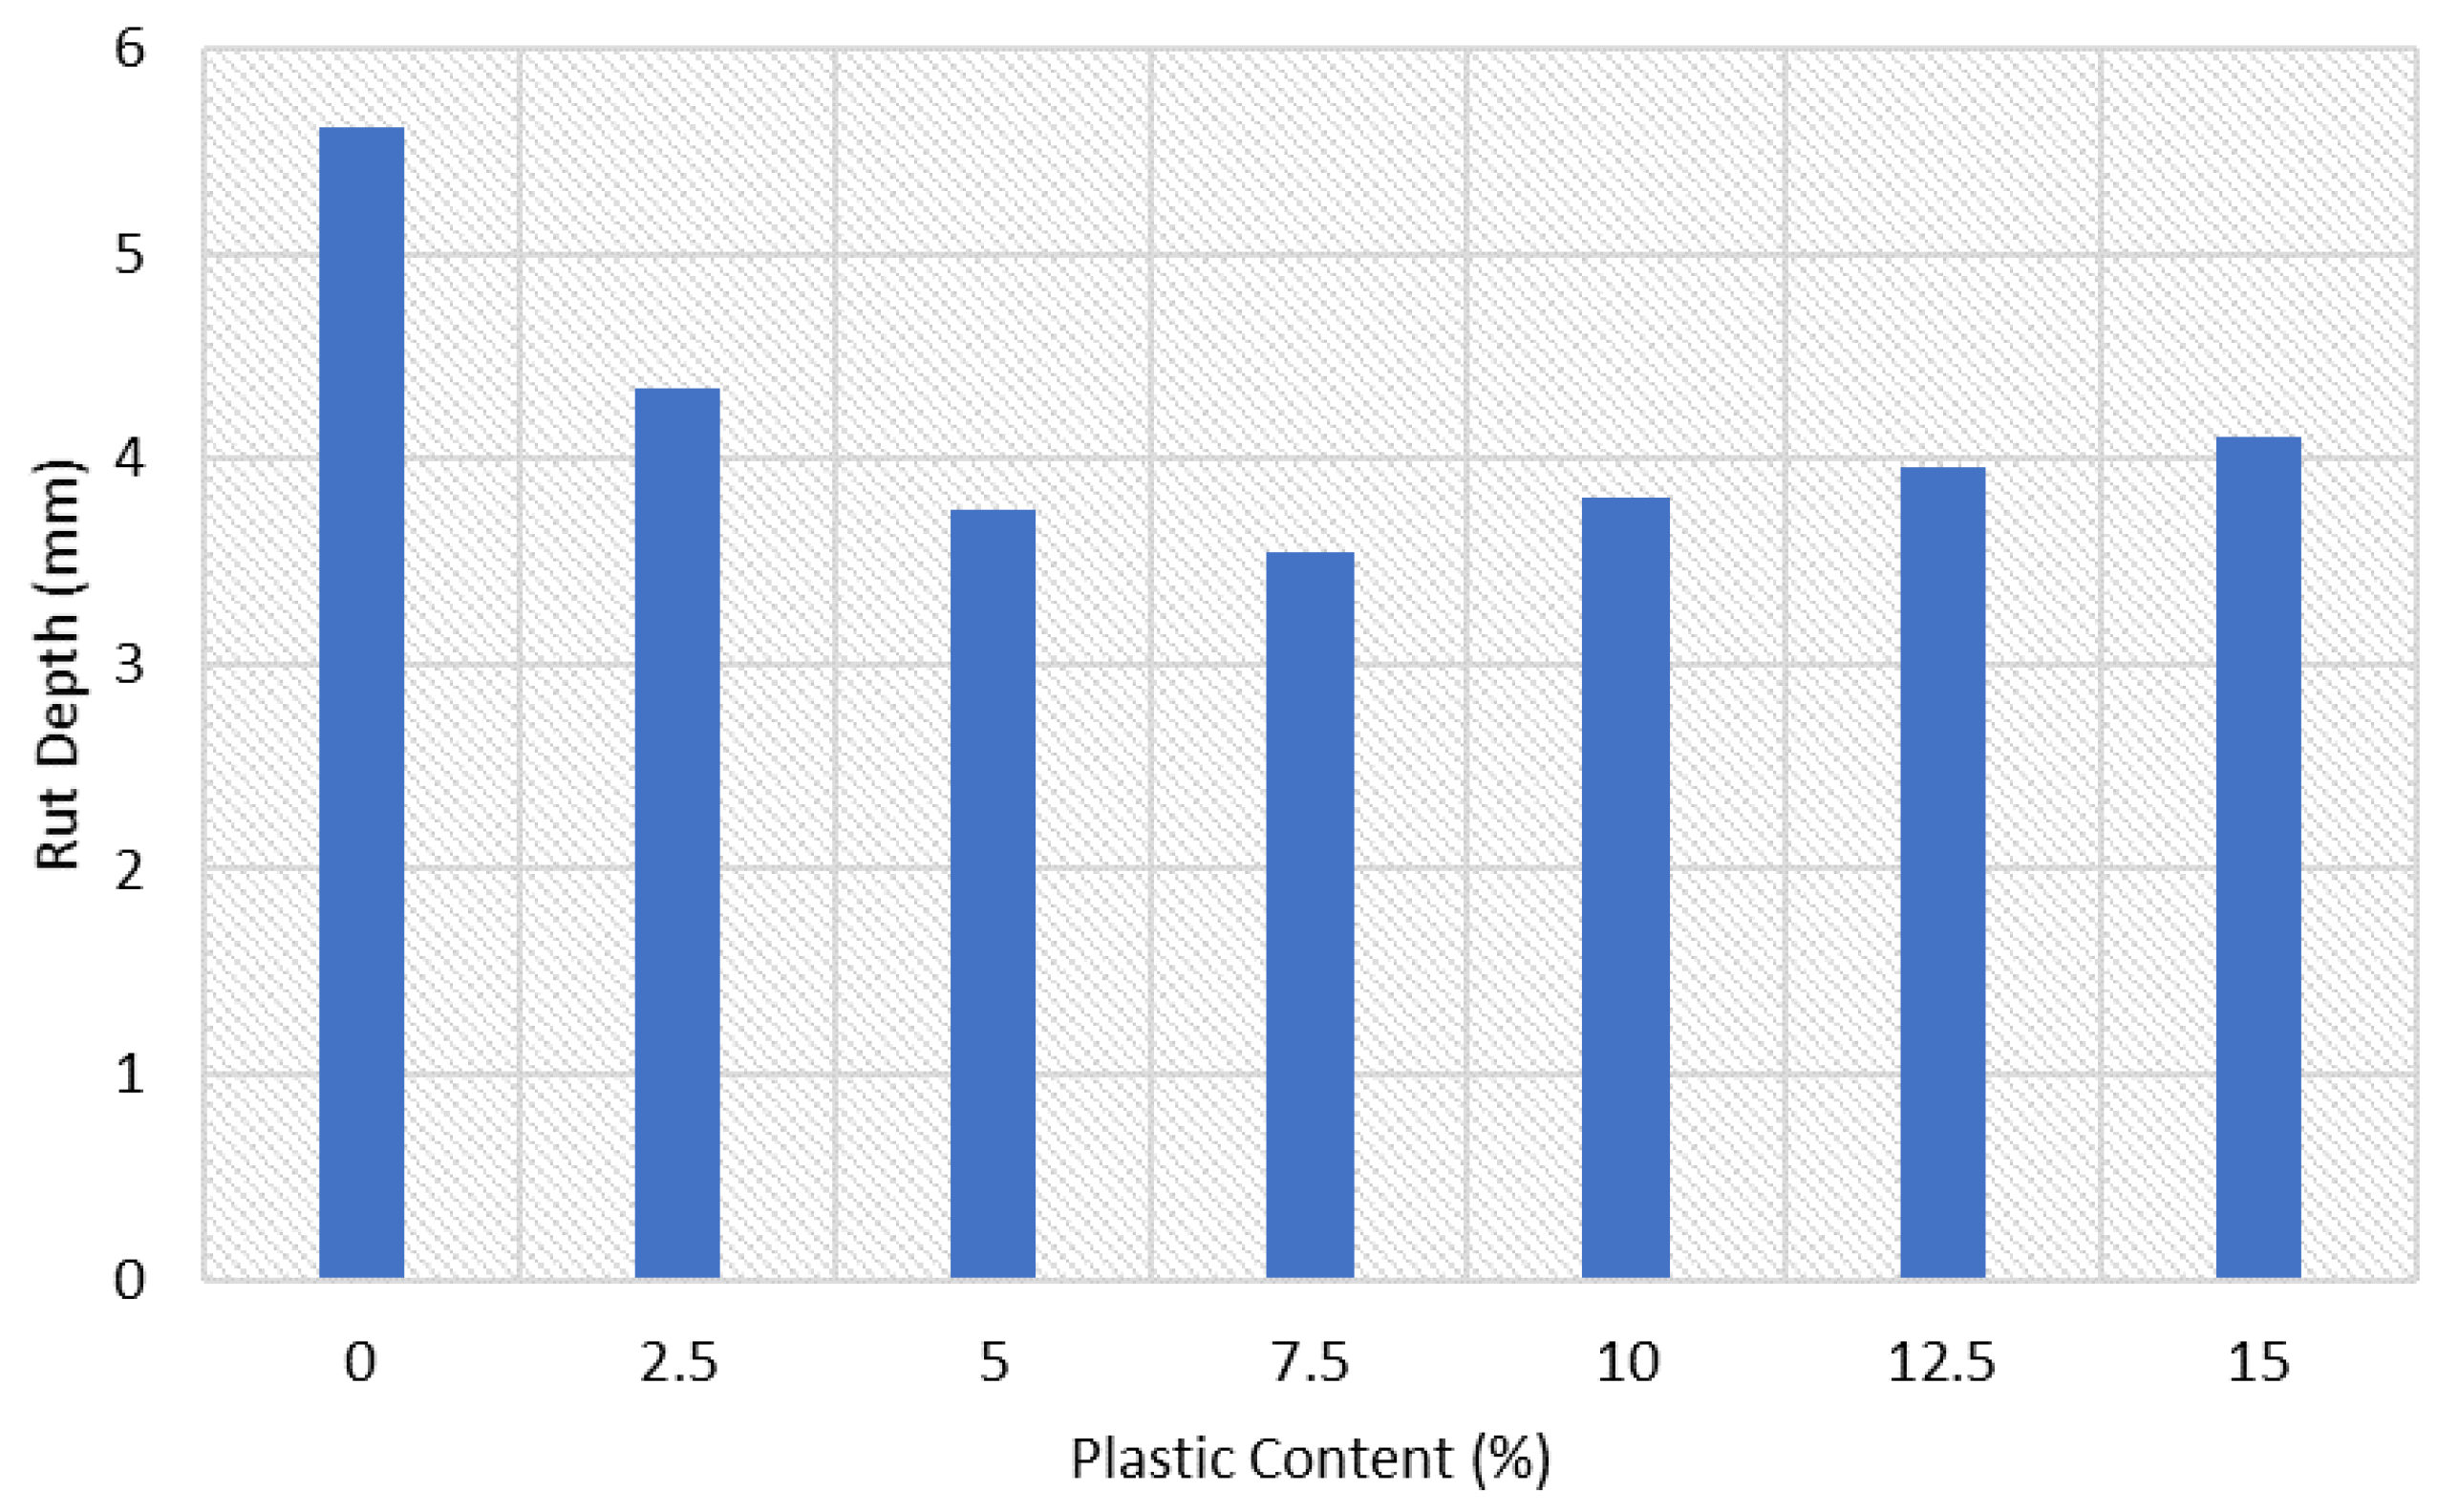
3.14. Wheel Track Test
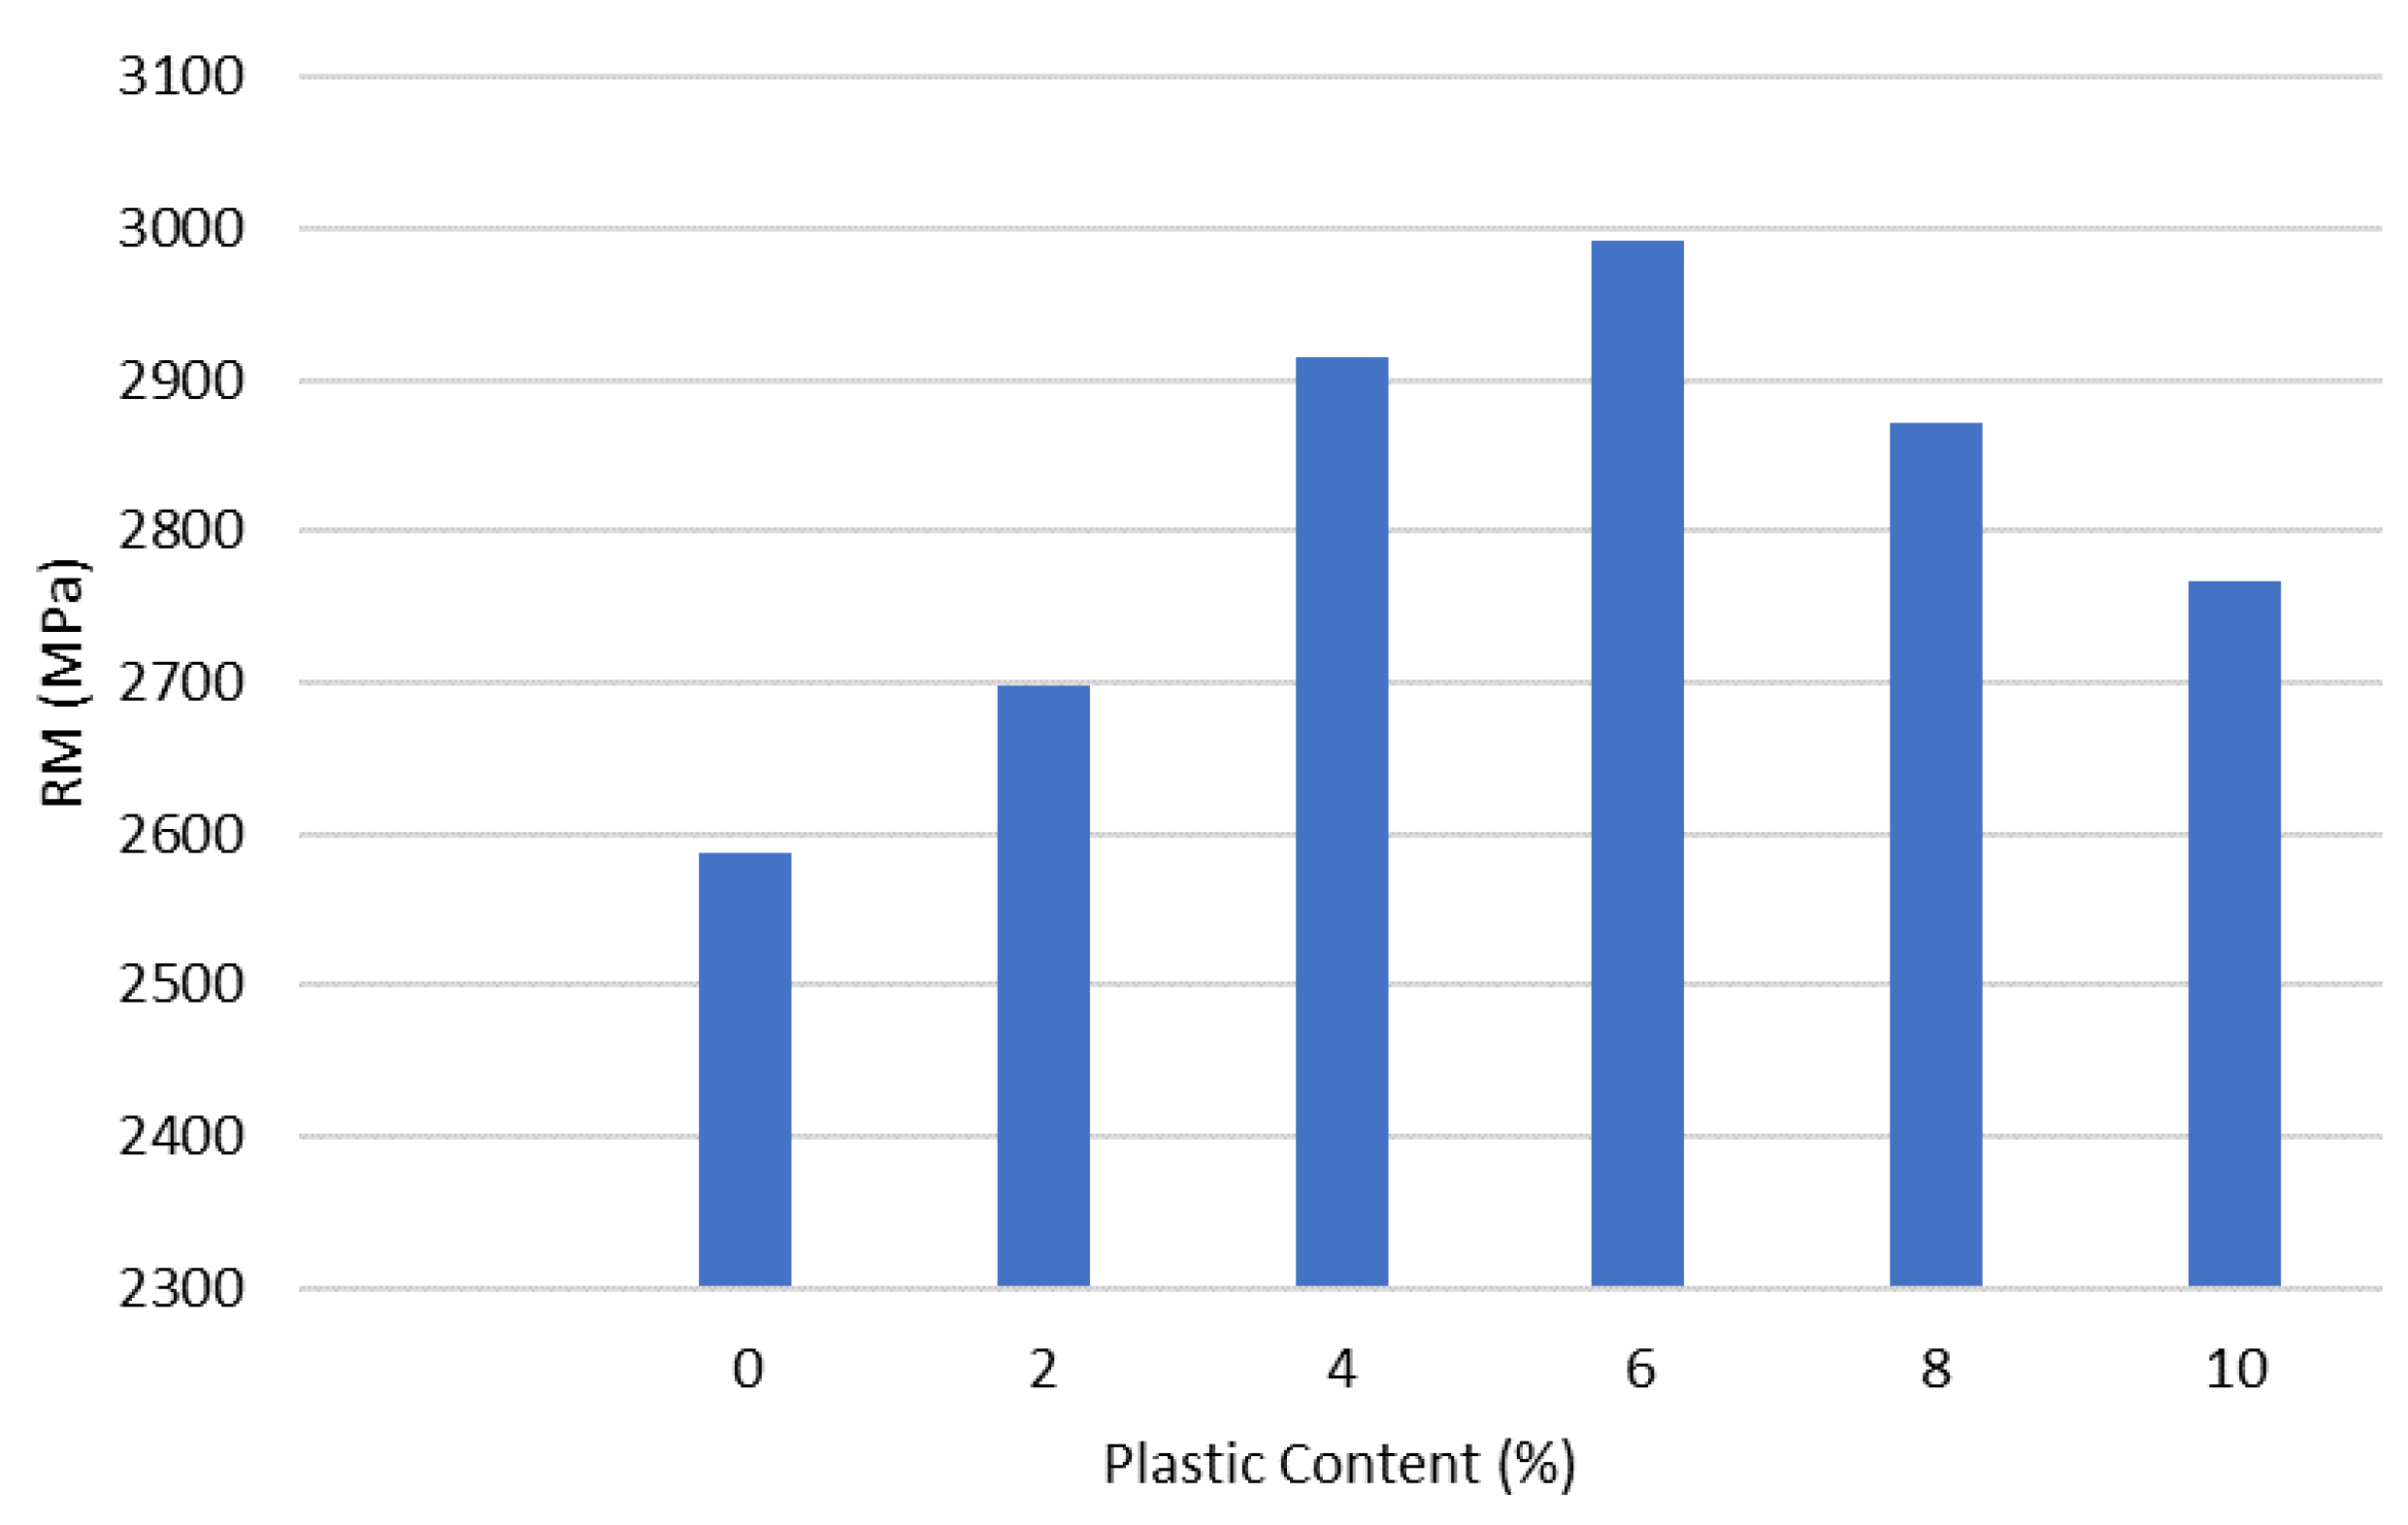
3.15. Resilient Modulus
3.16. Drain Down
3.17. Volumetric Properties
3.17.1. Density
3.17.2. Voids in Total Mix
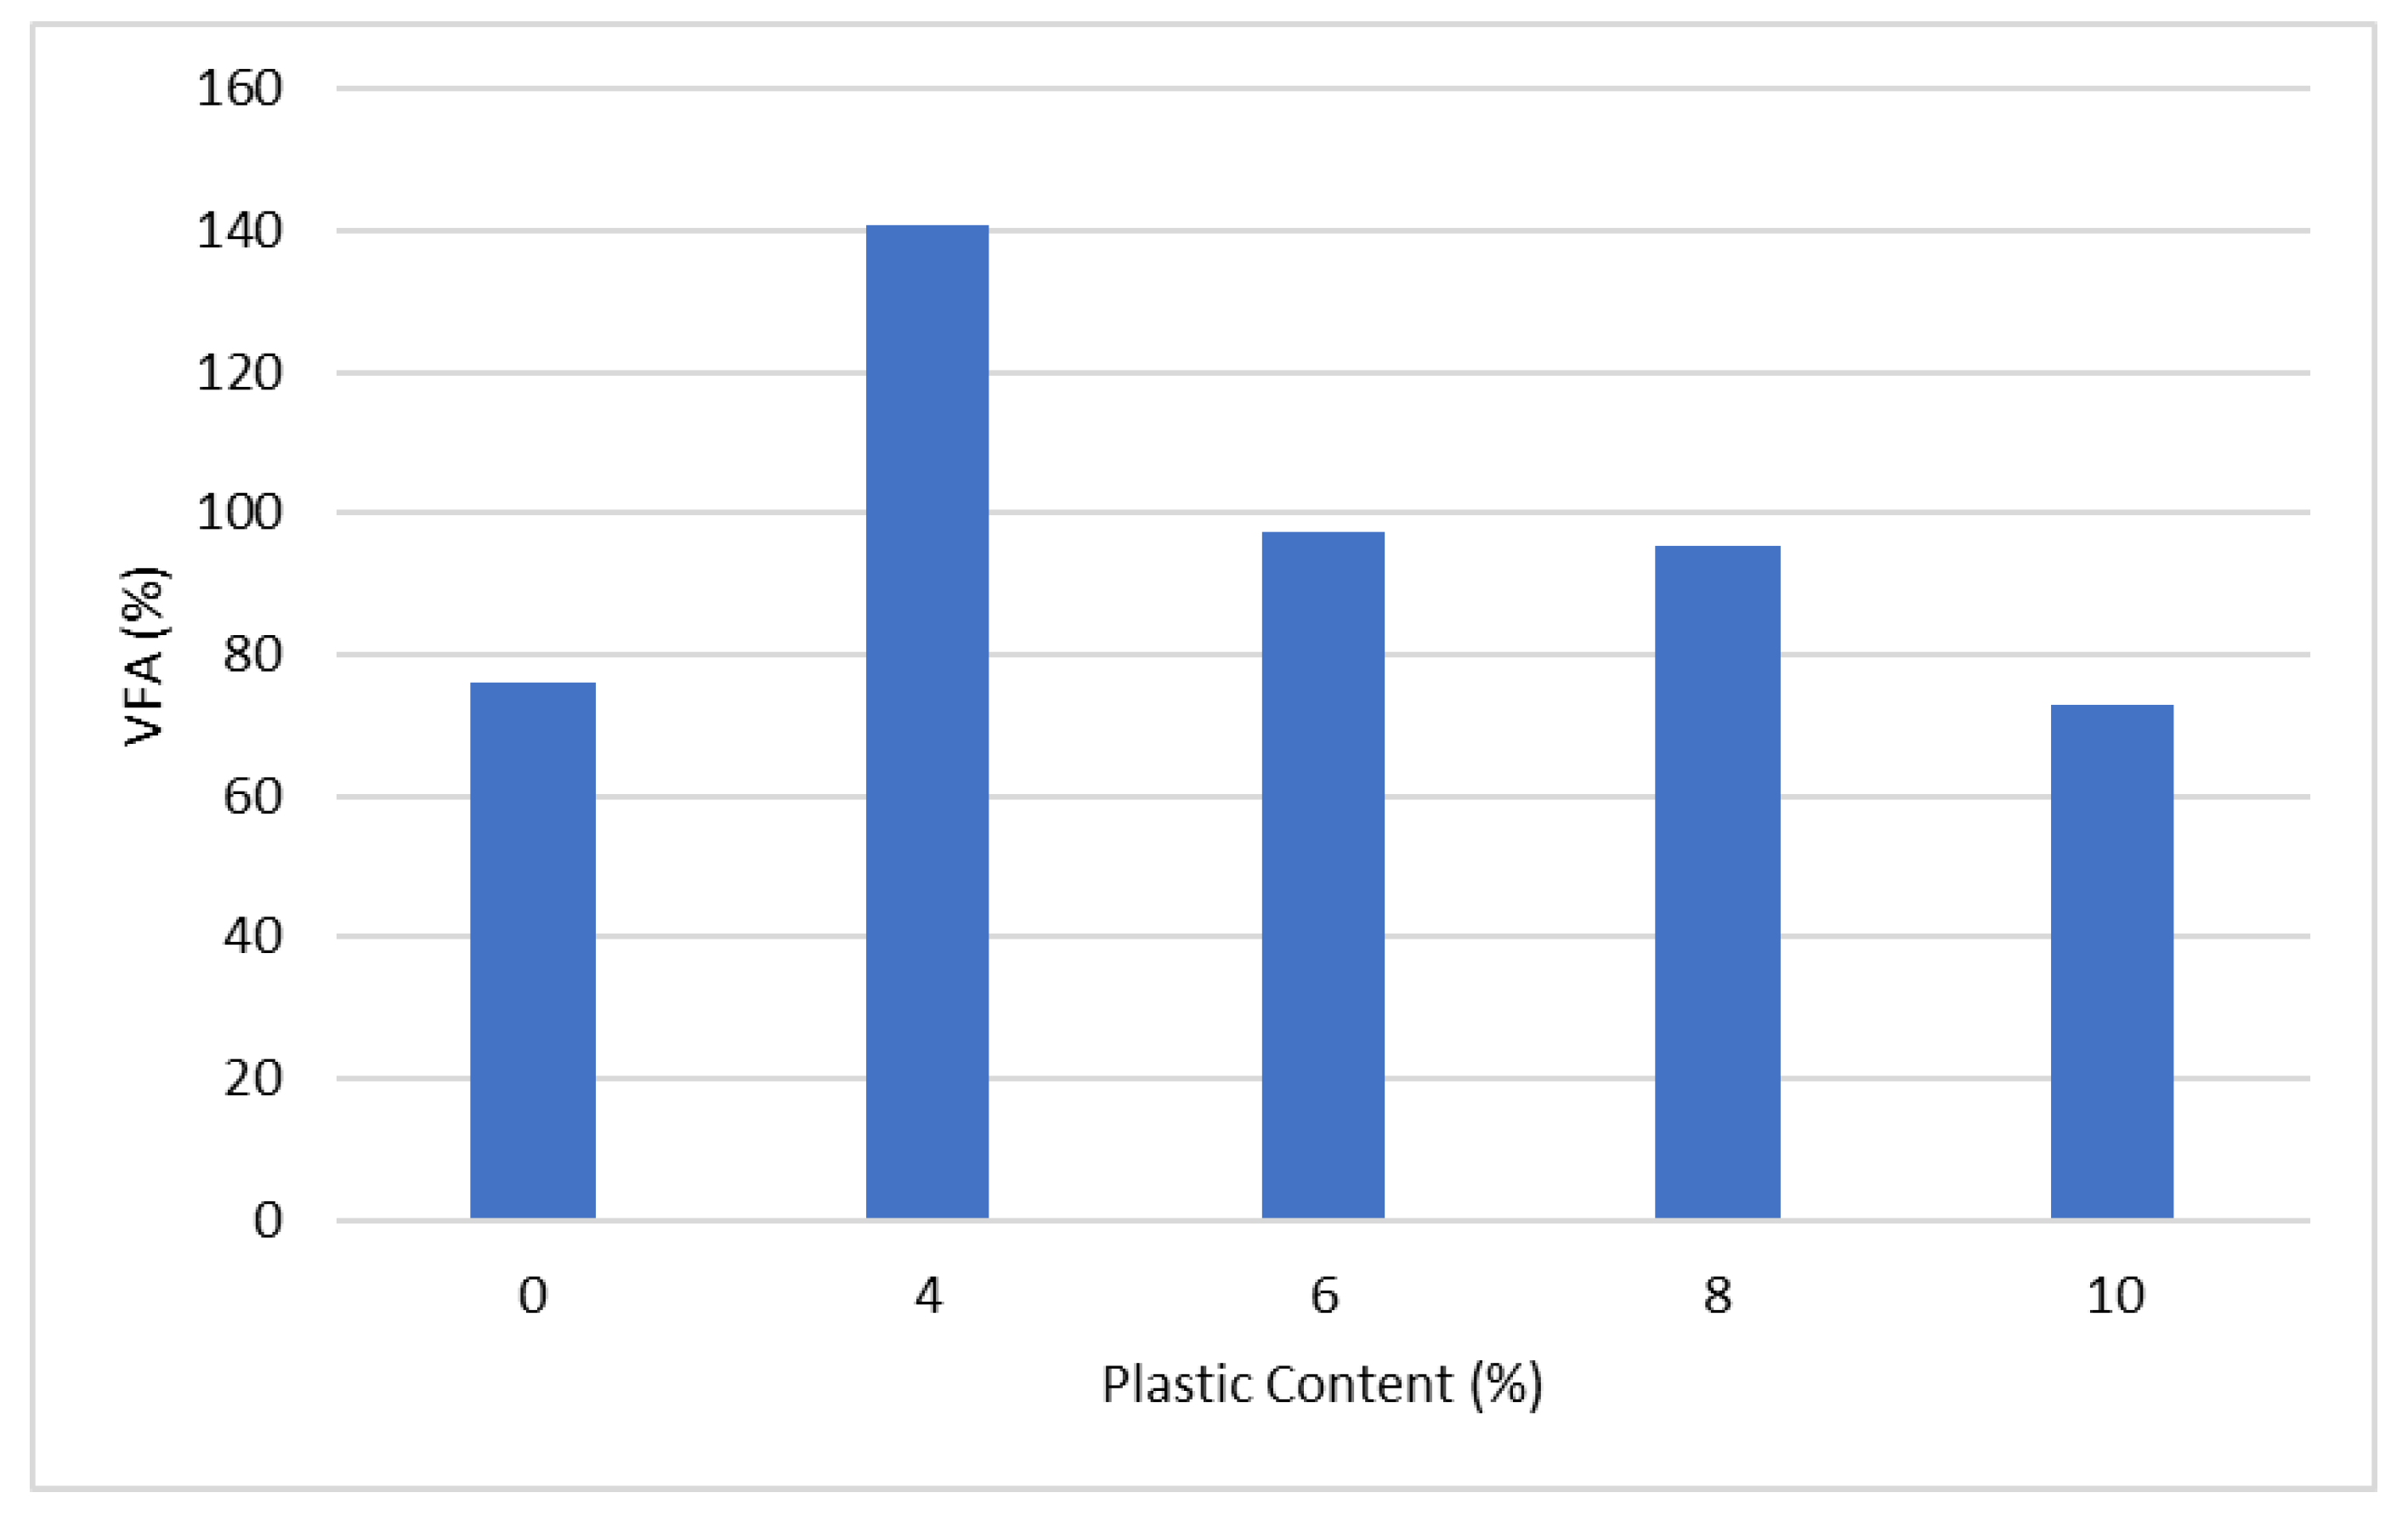
3.17.3. Voids Filled with Asphalt
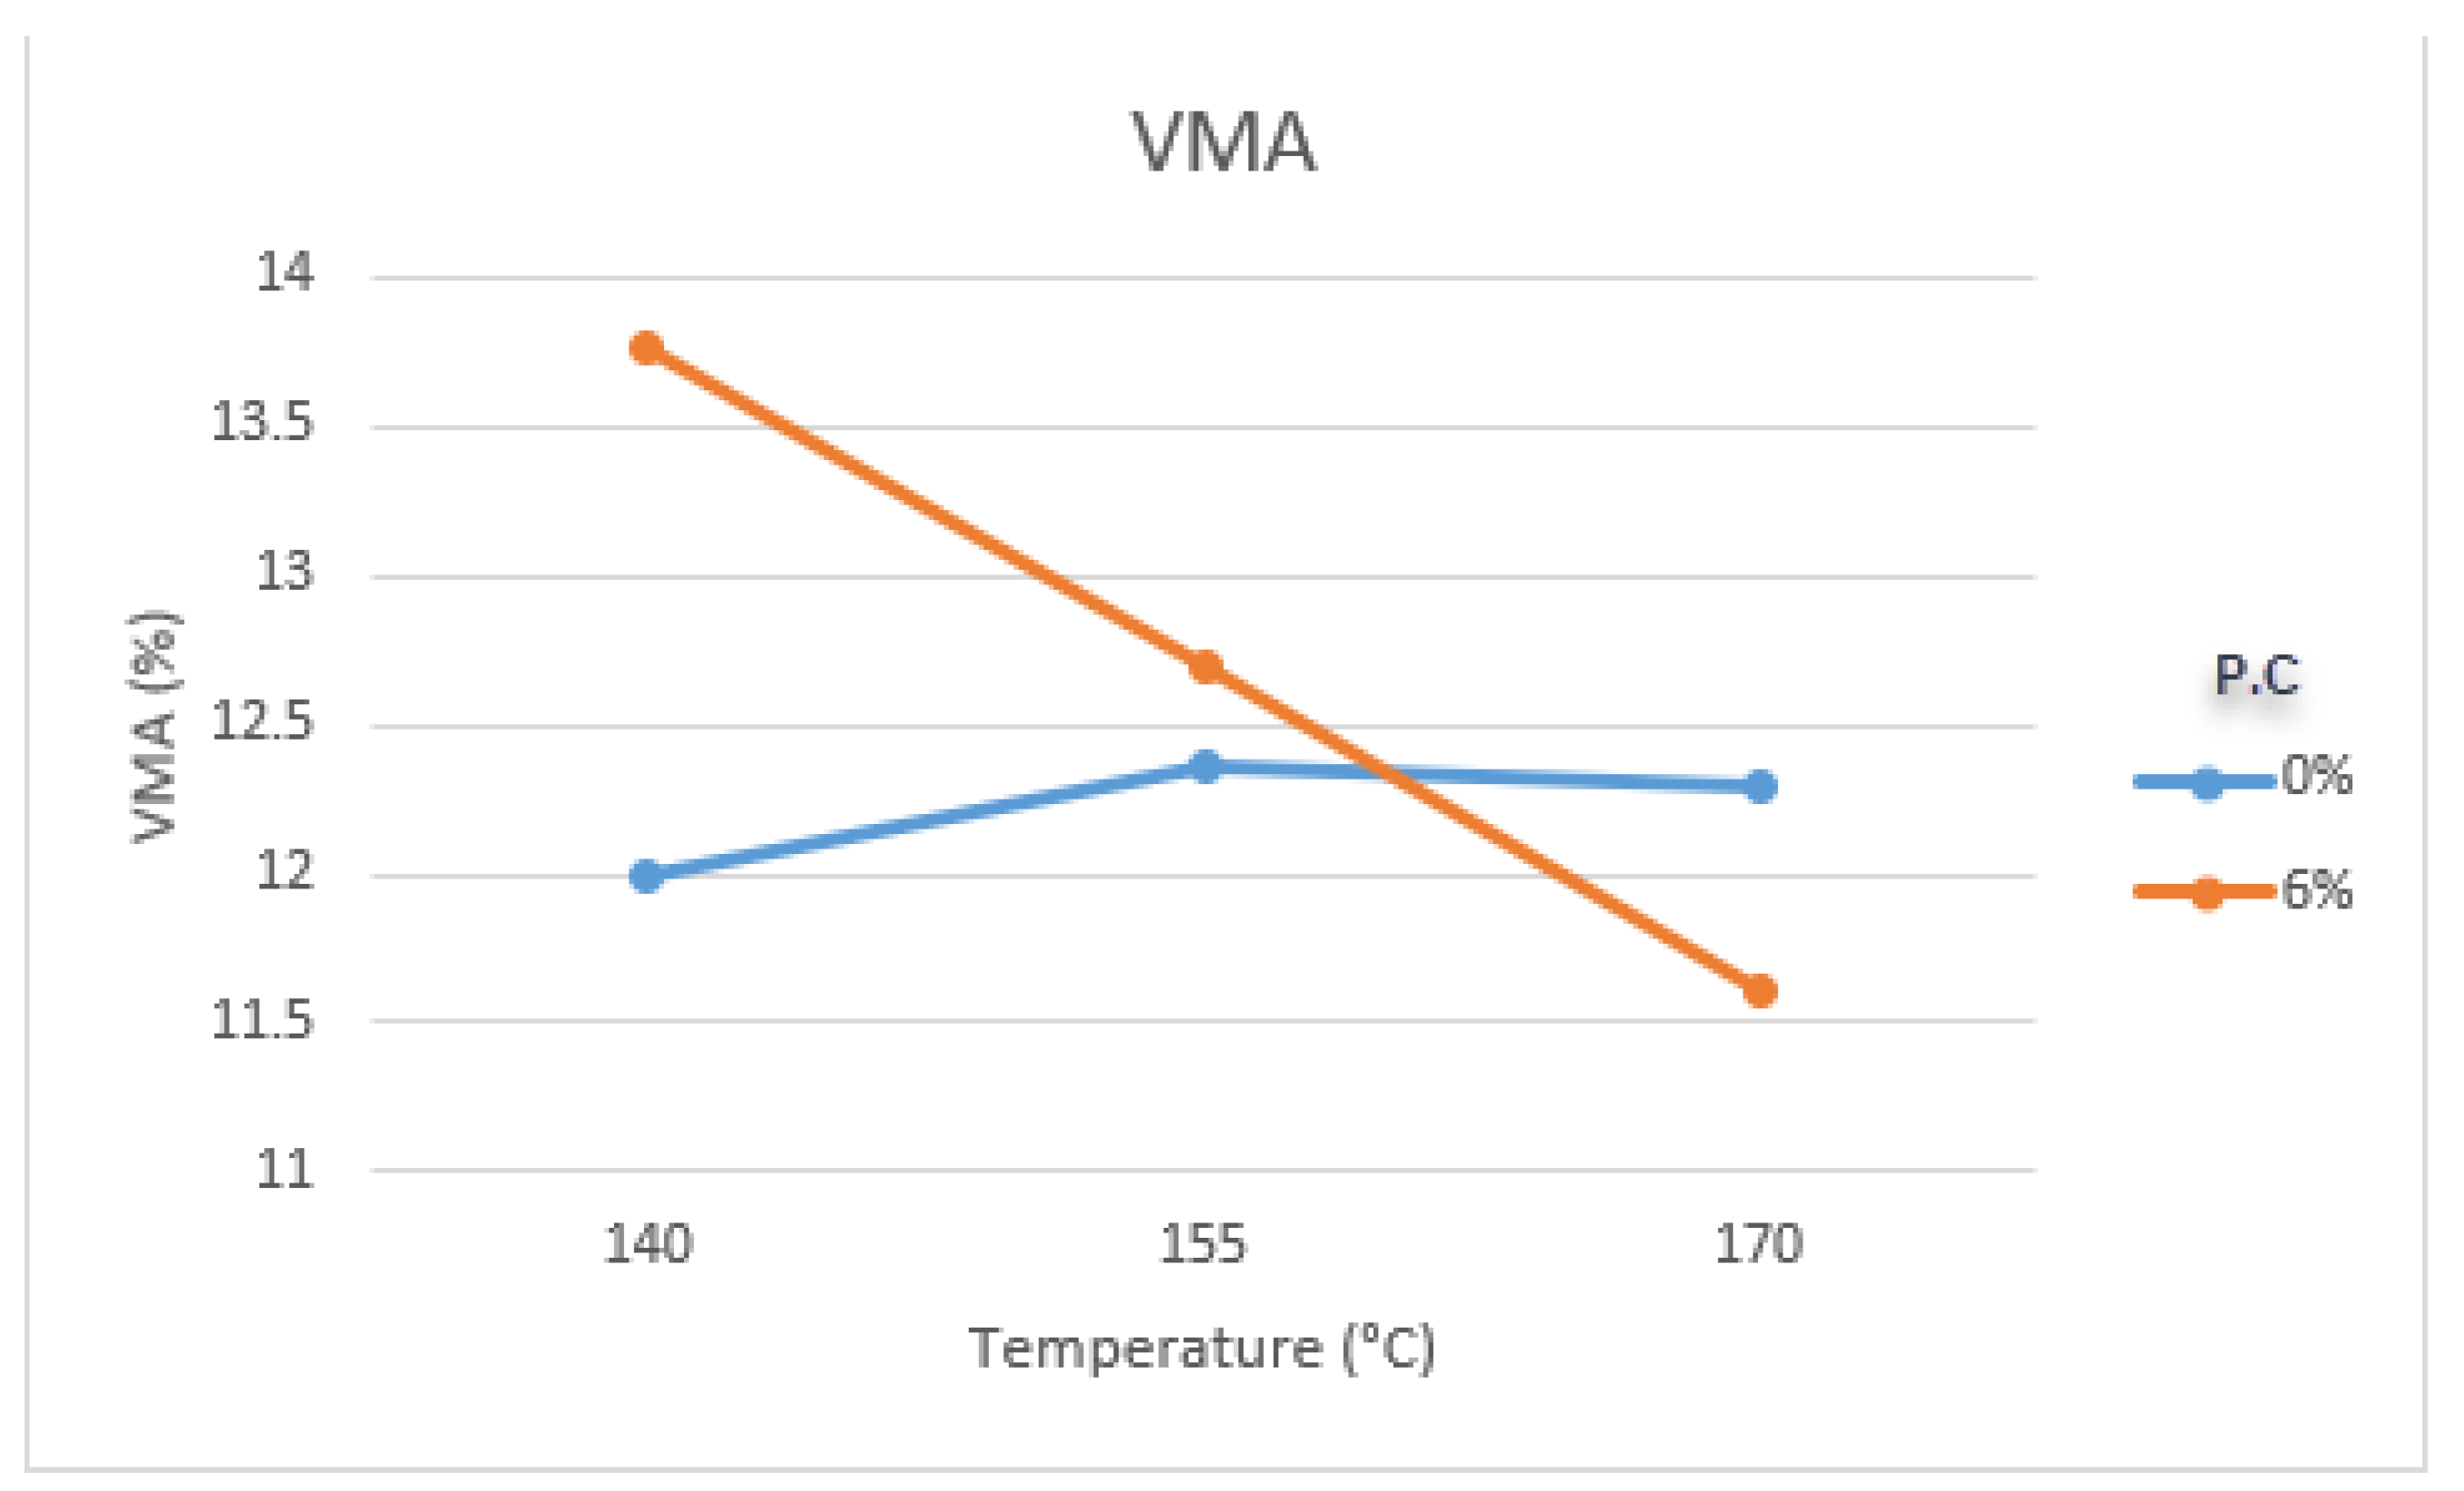
3.17.4. Voids in Mineral Aggregate
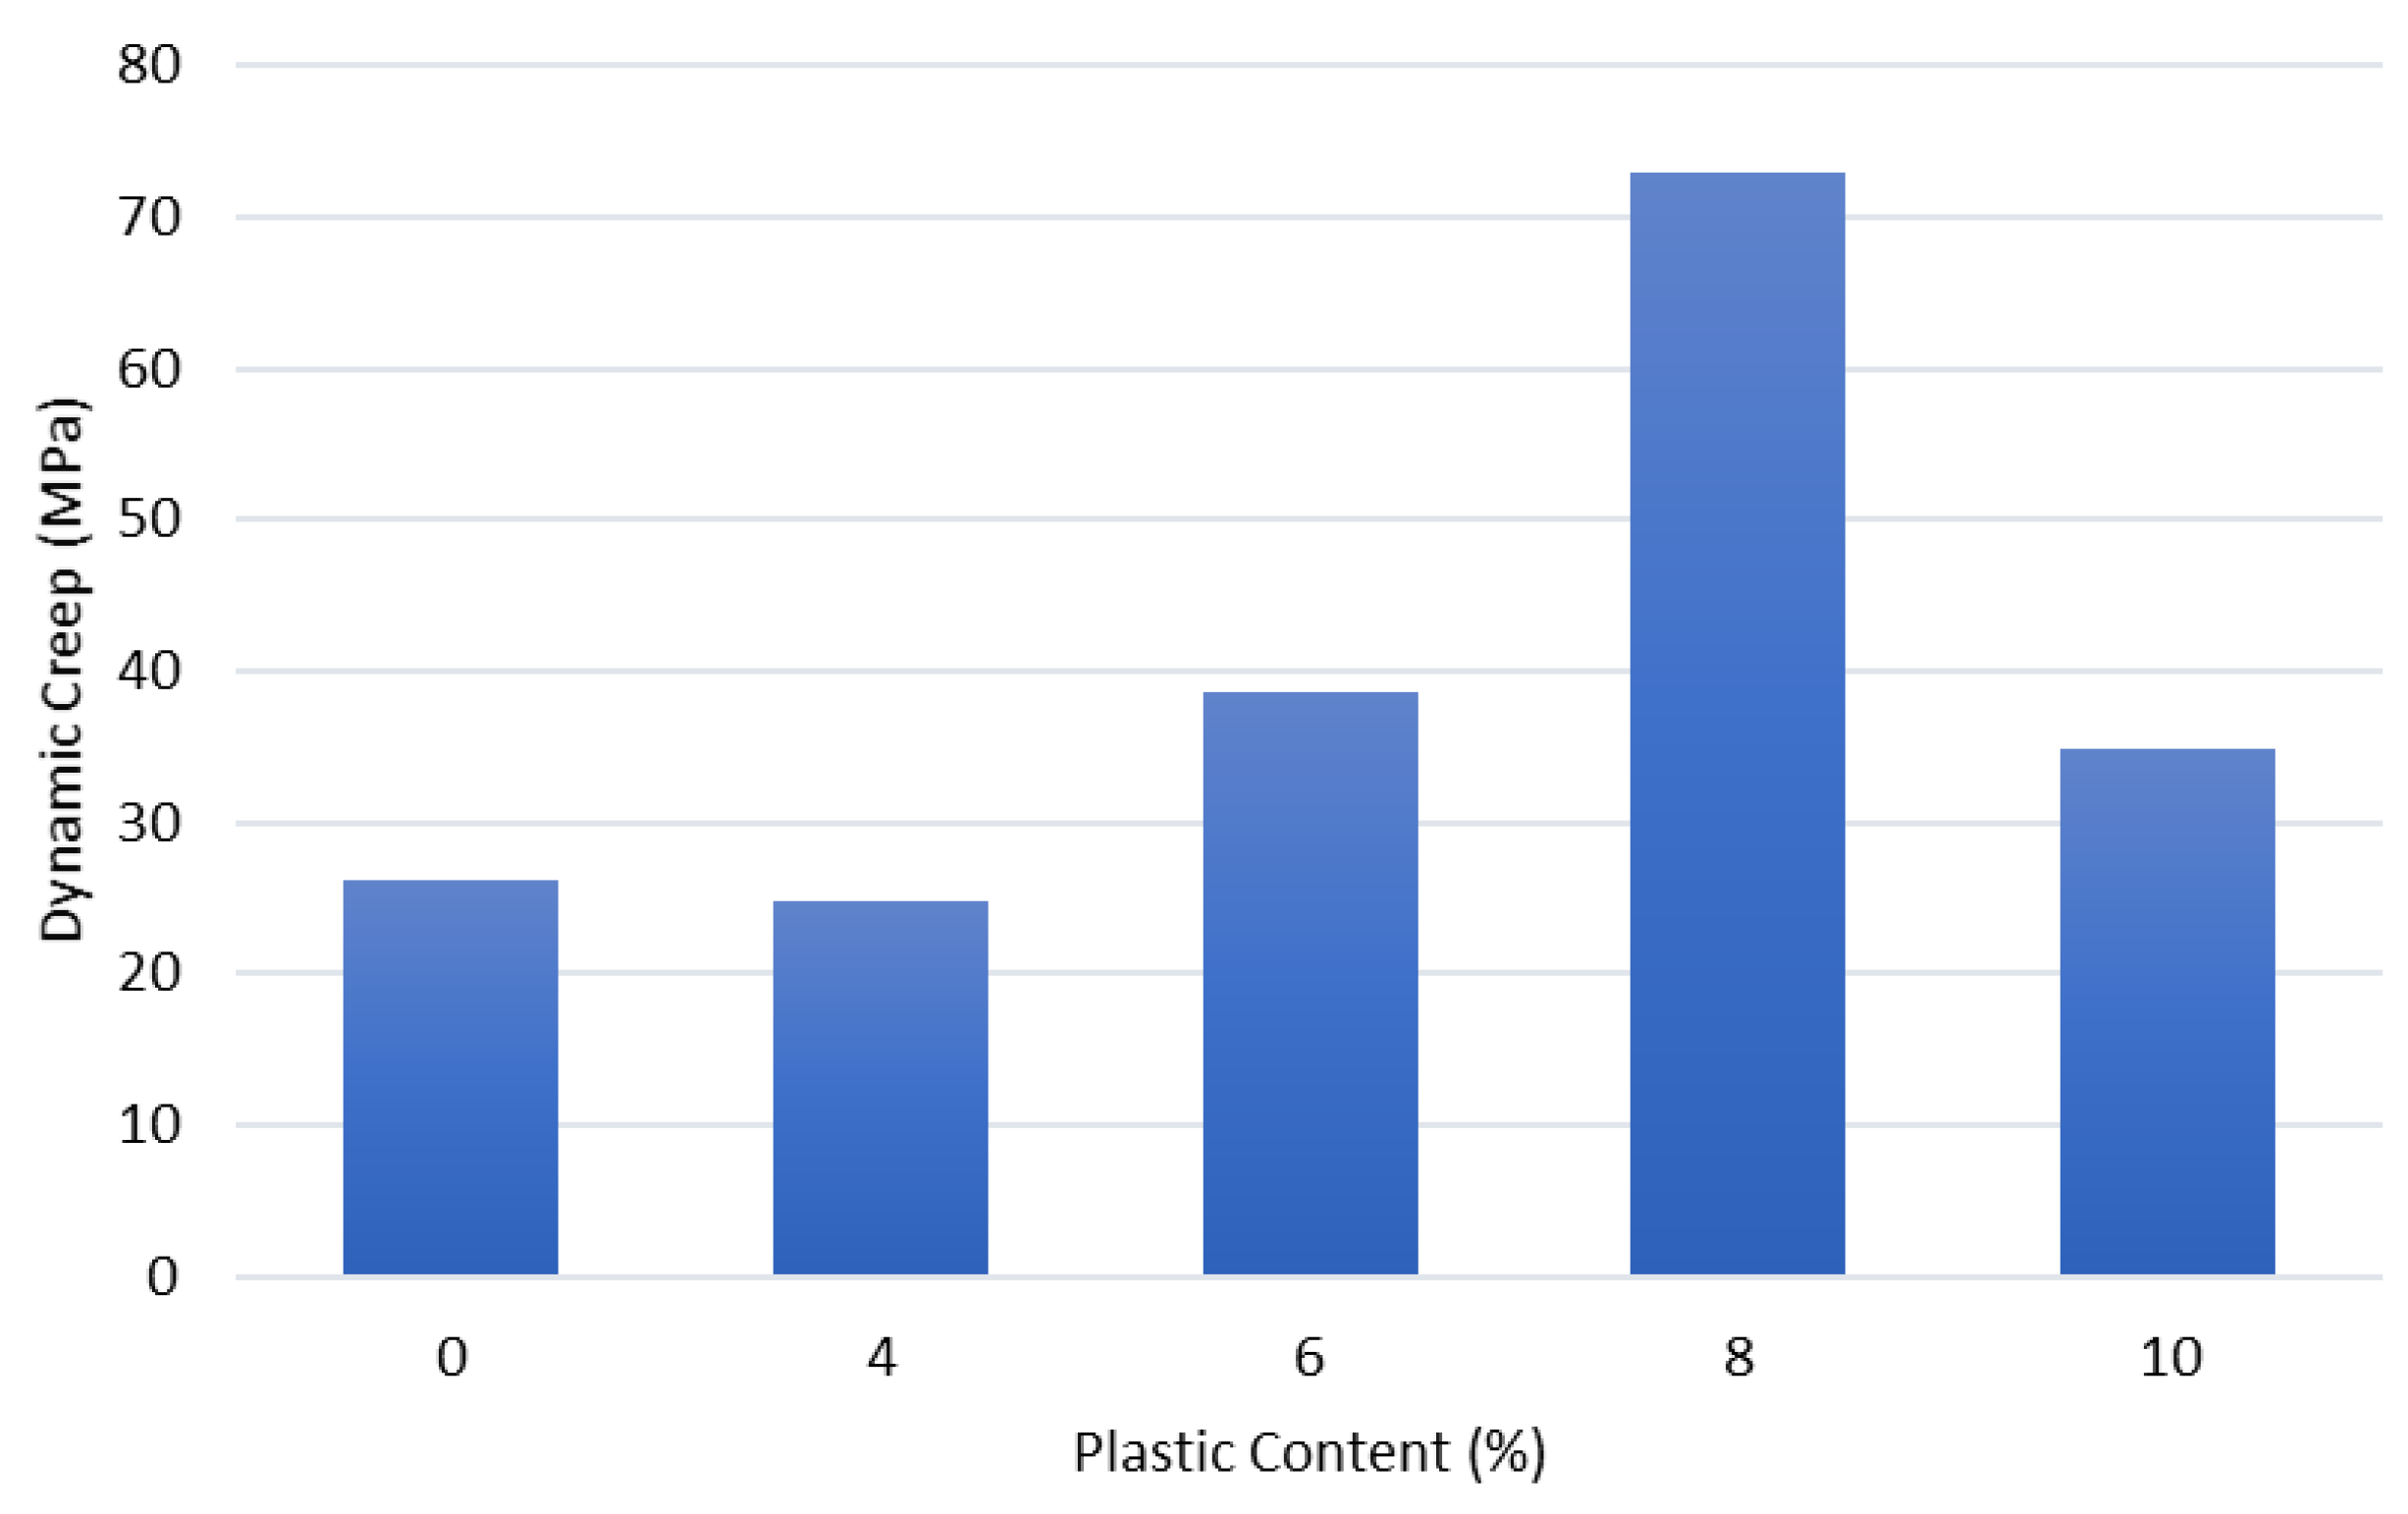
3.17.5. Dynamic Creep
3.17.6. Fatigue
4. Conclusions
Author Contributions
Funding
Data Availability Statement
Conflicts of Interest
References
- Sasidharan, M.; Torbaghan, M.E.; Burrow, M. Using Waste Plastics in Road Construction; Institute of Development Studies: Brighton, UK, 2019. [Google Scholar]
- Ahmadinia, E.; Zargar, M.; Karim, M.R.; Abdelaziz, M.; Shafigh, P. Using waste plastic bottles as additive for stone mastic asphalt. Mater. Des. 2011, 32, 4844–4849. [Google Scholar] [CrossRef]
- Xu, F.; Zhao, Y.; Li, K. Using waste plastics as asphalt modifier: A review. Materials 2021, 15, 110. [Google Scholar] [CrossRef] [PubMed]
- Purcell, A.H.; Smith, F.L. Energy and environmental impacts of materials alternatives: An assessment of quantitative understanding. Resour. Recovery Conserv. 1976, 2, 93–102. [Google Scholar] [CrossRef]
- Kumar, S.; Panda, A.K.; Singh, R. A review on tertiary recycling of high-density polyethylene to fuel. Resour. Conserv. Recycl. 2011, 55, 893–910. [Google Scholar] [CrossRef]
- Craighill, A.L.; Powell, J.C. Lifecycle assessment and economic evaluation of recycling: A case study. Resour. Conserv. Recycl. 1996, 17, 75–96. [Google Scholar] [CrossRef]
- Fink, M.; Fink, J.K. Plastics recycling coupled with enhanced oil recovery. A critical survey of the concept. J. Anal. Appl. Pyrolysis 1997, 40, 187–200. [Google Scholar] [CrossRef]
- Garforth, A.A.; Ali, S.; Hernández-Martínez, J.; Akah, A. Feedstock recycling of polymer wastes. Curr. Opin. Solid State Mater. Sci. 2004, 8, 419–425. [Google Scholar] [CrossRef]
- Khurshid, M.B.; Qureshi, N.A.; Hussain, A.; Iqbal, M.J. Enhancement of hot mix asphalt (HMA) properties using waste polymers. Arab. J. Sci. Eng. 2019, 44, 8239–8248. [Google Scholar] [CrossRef]
- Ben Zair, M.M.; Jakarni, F.M.; Muniandy, R.; Hassim, S. A brief review: Application of recycled polyethylene terephthalate in asphalt pavement reinforcement. Sustainability 2021, 13, 1303. [Google Scholar] [CrossRef]
- Abd Kader, S.A.; Jaya, R.P.; Yaacob, H.; Hainin, M.R.; Hassan, N.A.; Ibrahim, M.H.W.; Mohamed, A.A. Stability and volumetric properties of asphalt mixture containing waste plastic. MATEC Web Conf. 2017, 103, 09002. [Google Scholar] [CrossRef]
- Chavan, M.A.J. Use of plastic waste in flexible pavements. Int. J. Appl. Innov. Eng. Manag. 2013, 2, 540–552. [Google Scholar]
- Abdullah, M.E.; Abd Kader, S.A.; Jaya, R.P.; Yaacob, H.; Hassan, N.A.; Wan, C.N.C. Effect of waste plastic as bitumen modified in asphalt mixture. MATEC Web Conf. 2017, 103, 09018. [Google Scholar] [CrossRef]
- Jethwani, S.; Jha, S.A.; Sangtiani, D. Utilization & Specification of Plastic Waste in Bituminous Roads. Int. J. Eng. Res. 2017, 6, 91–94. [Google Scholar]
- Contreras, L.R.Z.; Cabanag, K.L.N.; De Alday, H.A.; Polillo, J.P.L.; Saiyari, D.M.; Manio, M.V.M. Effects of Temperature in Mechanical Properties of Stone Mastic Asphalt (SMA) Mixture with Waste Polyethylene Terephthalate (PET). In Proceedings of the 2015 International Conference on Environmental Quality Concern, Control and Conservation, Kaohsiung, Taiwan, 7–8 May 2015. [Google Scholar]
- Ramamurty, U.; Jana, S.; Kawamura, Y.; Chattopadhyay, K. Hardness and plastic deformation in a bulk metallic glass. Acta Mater. 2005, 53, 705–717. [Google Scholar] [CrossRef]
- Naskar, M.; Chaki, T.; Reddy, K. Effect of waste plastic as modifier on thermal stability and degradation kinetics of bitumen/waste plastics blend. Thermochim. Acta 2010, 509, 128–134. [Google Scholar] [CrossRef]
- Garcia-Morales, M.; Partal, P.; Navarro, F.; Gallegos, C. Effect of waste polymer addition on the rheology of modified bitumen. Fuel 2006, 85, 936–943. [Google Scholar] [CrossRef]
- Lu, X.; Isacsson, U. Rheological characterization of styrene-butadiene-styrene copolymer modified bitumens. Constr. Build. Mater. 1997, 11, 23–32. [Google Scholar] [CrossRef]
- Awwad, M.T.; Shbeeb, L. The use of polyethylene in hot asphalt mixtures. Am. J. Appl. Sci. 2007, 4, 390–396. [Google Scholar] [CrossRef]
- Hassan, N.A.; Airey, G.D.; Yusoff, N.I.M.; Hainin, M.R.; Putrajaya, R.; Abdullah, M.E.; Aziz, M.M.A. Microstructural characterisation of dry mixed rubberised asphalt mixtures. Constr. Build. Mater. 2015, 82, 173–183. [Google Scholar] [CrossRef]
- ASTM D6927-15; Standard Test Method for Marshall Stability and Flow of Asphalt Mixtures. ASTM International: West Conshohocken, PA, USA, 2015. [CrossRef]
- Akinpelu, M.; Dahunsi, B.I.; Olafusi, O.; Awogboro, O.; Quadri, A. Effect of polythene modified bitumen on properties of hot mix asphalt. ARPN J. Eng. Appl. Sci. 2013, 8, 290–295. [Google Scholar]
- Köfteci, S. Effect of HDPE based wastes on the performance of modified asphalt mixtures. Procedia Eng. 2016, 161, 1268–1274. [Google Scholar] [CrossRef] [Green Version]
- Hinislioğlu, S.; Aras, H.N.; Bayrak, O.Ü. Effects of high density polyethylene on the permanent deformation of asphalt concrete. Indian J. Eng. Mater. Sci. 2005, 12, 456–460. [Google Scholar]
- Moghaddam, T.B.; Karim, M.R. Properties of SMA mixtures containing waste Polyethylene Terephthalate. World Acad. Sci. Eng. Technol. 2012, 6, 612–622. [Google Scholar]
- Jassim, H.M.; Mahmood, O.T.; Ahmed, S.A. Optimum use of plastic waste to enhance the Marshall properties and moisture resistance of hot mix asphalt. Int. J. Eng. Trends Technol. 2014, 7, 18–25. [Google Scholar] [CrossRef]
- Al-shalout, I.; Miro, O.; Stas, R. Effects of moisture, compaction temperature and gradation types on durability of asphalt. Damascus Univ. J. 2007, 23, 7–35. [Google Scholar]
- Ameri, M.; Nasr, D. Performance properties of devulcanized waste PET modified asphalt mixtures. Pet. Sci. Technol. 2017, 35, 99–104. [Google Scholar] [CrossRef]
- Moghaddam, T.B.; Karim, M.R.; Soltani, M. Utilization of waste plastic bottles in asphalt mixture. J. Eng. Sci. Technol. 2013, 8, 264–271. [Google Scholar]
- Modarres, A.; Hamedi, H. Developing laboratory fatigue and resilient modulus models for modified asphalt mixes with waste plastic bottles (PET). Constr. Build. Mater. 2014, 68, 259–267. [Google Scholar] [CrossRef]
- Modarres, A.; Hamedi, H. Effect of waste plastic bottles on the stiffness and fatigue properties of modified asphalt mixes. Mater. Des. 2014, 61, 8–15. [Google Scholar] [CrossRef]
- Jan, H.; Aman, M.Y.; Karim, F. Plastic Bottles Waste Utilization as Modifier for Asphalt Mixture Production. MATEC Web Conf. 2017, 103, 09007. [Google Scholar] [CrossRef] [Green Version]
- Moghaddam, T.B.; Soltani, M.; Karim, M.R. Evaluation of permanent deformation characteristics of unmodified and Polyethylene Terephthalate modified asphalt mixtures using dynamic creep test. Mater. Des. 2014, 53, 317–324. [Google Scholar] [CrossRef] [Green Version]
- Ahmadinia, E.; Zargar, M.; Karim, M.R.; Abdelaziz, M.; Ahmadinia, E. Performance evaluation of utilization of waste Polyethylene Terephthalate (PET) in stone mastic asphalt. Constr. Build. Mater. 2012, 36, 984–989. [Google Scholar] [CrossRef]
- Badejo, A.A.; Adekunle, A.A.; Adekoya, O.O.; Ndambuki, J.M.; Kupolati, K.W.; Bada, B.S.; Omole, D.O. Plastic waste as strength modifiers in asphalt for a sustainable environment. Afr. J. Sci. Technol. Innov. Dev. 2017, 9, 173–177. [Google Scholar] [CrossRef] [Green Version]
- Yeole, C.; Khanapure, V.; Joshi, V.; Shelake, A. Utilization of industrial polypropylene (PP) waste in asphalt binder for flexible pavements. Int. Res. J. Eng. Technol. 2017, 4, 2011–2016. [Google Scholar]
- Mosa, A.M. Modification of hot mix asphalt using polyethylene therephthalate (pet) waste bottles. J. Sci. Technol. 2017, 18, 62–73. [Google Scholar]
- Hassani, A.; Ganjidoust, H.; Maghanaki, A.A. Use of plastic waste (poly-ethylene terephthalate) in asphalt concrete mixture as aggregate replacement. Waste Manag. Res. 2005, 23, 322–327. [Google Scholar] [CrossRef]


| Author | % Replacement of Plastics | Optimum Value Attained At | Replacement |
|---|---|---|---|
| [2] | 0, 2, 4, 6, 8, 10 | 6% | By wt. of bitumen |
| [11] | 0, 4, 6, 8, 10 | 4% | By wt. of bitumen |
| [13] | 0, 4, 6, 8, 10 | 8% | By wt. of bitumen |
| [38] | 0, 0.2, 0.4, 0.6, 0.8, 1 | 1% | By wt. of aggregate |
| [39] | 0, 15, 20, 25, 30 | 15% | By wt. of bitumen |
| [36] | 0, 1, 3, 5 | 1% | By wt. of bitumen |
| [37] | 0, 6, 8, 10, 13, 16, 18 | 8% | By wt. of aggregate |
| [37] | 0, 2, 4, 6, 8, 10 | 4% | By wt. of bitumen |
| [38] | 0.1, 0.3, 0.5, 0.7, 0.9, 1.1 | 0.5% | By wt. of aggregate |
| [39] | 5, 5.5, 6, 6.5, 7, 7.5, 8 | 6.6% | By wt. of bitumen |
| [20] | 6, 8, 10, 12, 14, 16, 18 | 12% | By wt. of bitumen |
| [23] | 2.5, 5.0, 7.5, 10, 12.5, 15% | 12.5% | By wt. of bitumen |
| [24] | 0, 1, 2, 3, 4 | 4% | By wt. of bitumen |
| [25] | 0, 1, 2, 3, 4 | 2% | By wt. of bitumen |
| [28] | 0, 0.2, 0.4, 0.6, 0.8, 1 | 0.4% | By wt. of bitumen |
| [33] | 0, 2.5, 5, 7.5, 10, 12.5, 15 | 7.5–10% | By wt. of bitumen |
| [34] | 2, 4, 6, 8, 10 | 4% | By wt. of bitumen |
| [35] | 0, 2, 4, 6, 8, 10 | 4% | By wt. of bitumen |
| [36] | 0, 2, 4, 6, 8, 10 | 4% | By wt. of bitumen |
| Author | Effect On | |||||||||||||
|---|---|---|---|---|---|---|---|---|---|---|---|---|---|---|
| MS % | MF % | MQ % | BSG % | VMA % | VIM % | VFA % | VTM % | Stiffness % | Density % | ITS % | RM % | Specific Gravity % | AV % | |
| [2] | 6 | 10 | 4 | 0 | 10 | 10 | - | - | - | - | - | - | - | - |
| [11] | 4 | 10 | - | - | - | - | 4 | 4 | 6 | 4 | - | - | - | - |
| [13] | 4 | 0 | 8 | - | - | |||||||||
| [38] | - | - | - | - | - | - | - | - | - | - | - | - | - | - |
| [39] | 15 | 15 | - | - | - | - | - | - | - | - | - | - | - | - |
| [36] | 7 | 8 | - | - | - | - | 7.5 | 5 | - | 6.5 | - | - | - | - |
| [37] | 18 | 10 | - | 13 | - | - | - | - | - | - | - | - | 13 | - |
| [37] | 10 | 10 | - | - | - | - | - | - | - | 0 | - | - | 8 | - |
| [38] | 0.5 | 1.1 | - | - | 1.1 | - | - | - | 0.3 | - | 1.1 | - | - | 1.1 |
| [39] | 6 | 8 | 6 | - | 5 | - | - | - | - | 7 | - | - | - | - |
| [20] | - | 8 | - | - | 12 | - | - | - | - | 12 | - | - | - | 12 |
| [23] | 10 | 2.5 | - | - | - | - | - | - | - | 7 | - | - | - | - |
| [24] | 4 | 4 | - | - | - | - | - | - | - | - | - | - | - | - |
| [25] | 4 | 0 | - | - | - | - | - | - | - | - | - | - | - | - |
| [28] | 5 | 7 | - | - | - | - | - | - | 0.2 | - | - | - | - | - |
| [33] | 10 | - | - | - | - | - | - | - | - | - | 7.5 | - | - | 15 |
| [34] | 4 | 4 | - | - | - | - | - | - | - | - | - | 4 | - | - |
| [35] | 4 | 4 | - | - | - | - | - | - | - | - | - | - | - | - |
| [36] | - | - | - | - | - | - | - | - | - | - | 0 | 6 | - | - |
Disclaimer/Publisher’s Note: The statements, opinions and data contained in all publications are solely those of the individual author(s) and contributor(s) and not of MDPI and/or the editor(s). MDPI and/or the editor(s) disclaim responsibility for any injury to people or property resulting from any ideas, methods, instructions or products referred to in the content. |
© 2023 by the authors. Licensee MDPI, Basel, Switzerland. This article is an open access article distributed under the terms and conditions of the Creative Commons Attribution (CC BY) license (https://creativecommons.org/licenses/by/4.0/).
Share and Cite
Shah, A.M.; Lodhi, R.H.; Javed, M.F.; Jasiński, M.; Jasińska, E.; Gono, M. Structural Performance of Waste Plastic Bottles Modified Asphalt: A Review. Resources 2023, 12, 10. https://doi.org/10.3390/resources12010010
Shah AM, Lodhi RH, Javed MF, Jasiński M, Jasińska E, Gono M. Structural Performance of Waste Plastic Bottles Modified Asphalt: A Review. Resources. 2023; 12(1):10. https://doi.org/10.3390/resources12010010
Chicago/Turabian StyleShah, Abdul Muqeet, Rida Hameed Lodhi, Muhammad Faisal Javed, Michał Jasiński, Elżbieta Jasińska, and Miroslava Gono. 2023. "Structural Performance of Waste Plastic Bottles Modified Asphalt: A Review" Resources 12, no. 1: 10. https://doi.org/10.3390/resources12010010