

Evaluation of Scenedesmus dimorphus under Different Photoperiods with Eutrophicated Lagoon Water
 , , , , and
Abstract
:1. Introduction

| Microalgae | Culture Medium | Metabolism | Photoperiod L:D | Culture Conditions | Biomass Obtained | Reference |
|---|---|---|---|---|---|---|
| Chlorella vulgaris | Water, raw sewage | Mixotrophic | 12:12 | 37,000 lux, 25 °C, 16 days | 69.8 mg/Ld | [11] |
| Water contaminated with 10 g/L of oil | Mixotrophic | 12:12 | 2000 lux, 25 °C | 0.41 g dry biomass | [12] | |
| Water contaminated with 20 g/L of oil | 0.33 g dry biomass | |||||
| Biological reactor wastewater | Mixotrophic | 12:12 | 180 µm/m2/d, 24 ± 1 °C, Air 0.5 vvm | 20.3 mg/Ld | [13] | |
| Chlorella pyrenoidosa | Dairy wastewater | Mixotrophic | 12:12 | 10 W/m2, 25 °C | Not reported | [14] |
| Scenedesmus acutus | Raw wastewater | Mixotrophic | 12:12 | 37,000 lux, 25 °C, 16 days | 61.5 mg/Ld | [11] |
| Scenedesmus sp. | Domestic wastewater | Mixotrophic | 14:10 | 60 µm/m2/d, 25 ± 2 °C, 7 days | 61.4 mg/Ld | [15] |
| Leachate from sanitary landfill, 20% | Mixotrophic | 12:12 | 80 µm/m2/d, air 4.5 L/min, 25 ± 2 °C | 3.9 mg/Ld | [9] | |
| Leachate from sanitary landfill, 60% | Mixotrophic | 319.9 mg/Ld | ||||
| Leachate from sanitary landfill, 80% | Mixotrophic | 421.9 mg/Ld | ||||
| Leachate from sanitary landfill, 100% | Mixotrophic | 163 mg/Ld | ||||
| CHU | Phototrophic | 34.6 mg/Ld | ||||
| Scenedesmus dimorphus and Scenedesmus minutum | Municipal wastewater | Mixotrophic | 16:8 | 150 µm/m2/d, 22 ± 2 °C | 16 mg/L | [16] |
| Scenedesmus dimorphus | Wastewater with lactic acid | Mixotrophic | 14:10 | 2500 lux, 25 °C, 10 days | 2.5 g/L | [17] |
| Wastewater with lactic acid + 0.8 g/L de NaNO3, 4 mg/L K2HPO4-3H2O | Mixotrophic | 14:10 | 4.5 g/L | |||
| BG11 | Phototrophic | 12:12 | CO2 atmospheric 11 L/min, 25 °C, 20 days | 96.5 mg/Ld | [7] | |
| BG11 + Apple pomace hydrolyzate 2% w/v | Mixotrophic | 12:12 | 140.3 mg/Ld | |||
| BBM | Phototrophic | 16:8 | 120 µm/m2/s 11 L/min air | 96.4 mg/Ld | [8] | |
| BBM + Hydrolyzed sugar cane bagasse 10 g/L | Mixotrophic | 16:8 | 105.9 mg/Ld | |||
| BBM + Hydrolyzed sugar cane bagasse 5 g/L | Mixotrophic | 16:8 | 119.2 mg/Ld |
2. Materials and Methods
2.1. Characteristics of the Culture Medium
2.2. Culture Conditions
2.3. Biomass Harvesting
2.4. Lipid Extraction
2.5. Characterization
3. Results
4. Discussion
5. Conclusions
Author Contributions
Funding
Data Availability Statement
Conflicts of Interest
References
- Erbland, P.; Caron, S.; Peterson, M.; Alyokhin, A. Design and performance of a low-cost, automated, large-scale photobioreactor for microalgae production. Aquac. Eng. 2020, 90, 102103. [Google Scholar] [CrossRef]
- Naveenkumar, R.; Baskar, G. Process optimization, green chemistry balance and technoeconomic analysis of biodiesel production from castor oil using heterogeneous nanocatalyst. Bioresour. Technol. 2021, 320, 124347. [Google Scholar] [CrossRef] [PubMed]
- Srivastava, R.K. Producción de bioenergía mediante la contribución de un sistema microbiano eficaz y adecuado. Mater. Sci. Energy Technol. 2019, 2, 308–318. [Google Scholar] [CrossRef]
- Živković, S.B.; Veljković, M.V.; Banković-Ilić, I.B.; Krstić, I.M.; Konstantinović, S.S.; Ilić, S.B.; Avramović, J.M.; Stamenković, O.S.; Veljković, V.B. Technological, technical, economic, environmental, social, human health risk, toxicological and policy considerations of biodiesel production and use. Renew. Sustain. Energy Rev. 2017, 79, 222–247. [Google Scholar] [CrossRef]
- Shah, S.H.; Raja, I.A.; Mahmood, Q.; Pervez, A. Improvement in lipids extraction processes for biodiesel production from wet microalgal pellets grown on diammonium phosphate and sodium bicarbonate combinations. Bioresour. Technol. 2016, 214, 199–209. [Google Scholar] [CrossRef] [PubMed]
- Patel, A.K.; Joun, J.M.; Hong, M.E.; Sim, S.J. Efecto de las condiciones de luz en el cultivo mixotrófico de microalgas verdes. Bioresour. Technol. 2019, 282, 245–253. [Google Scholar] [CrossRef] [PubMed]
- Laraib, N.; Hussain, A.; Javid, A.; Bukhari, S.M.; Ali, W.; Manzoor, M.; Jabeen, F. Mixotrophic Cultivation of Scenedesmus dimorphus for Enhancing Biomass Productivity and Lipid Yield. Iran. J. Sci. Technol. Trans. A Sci. 2021, 45, 397–403. [Google Scholar] [CrossRef]
- Manzoor, M.; Ahmad, Q.-u.-A.; Aslam, A.; Jabeen, F.; Rasul, A.; Schenk, P.M.; Qazi, J.I. Cultivo mixotrófico de Scenedesmus dimorphus en hidrolizado de bagazo de caña de azúcar. Environ. Prog. Sustain. Energy 2019, 39, e13334. [Google Scholar] [CrossRef]
- De Souza, L.; Lima, A.S.; Matos, Â.P.; Wheeler, R.M.; Bork, J.A.; Vieira Cubas, A.L.; Moecke, E.H.S. Biopolishing sanitary landfill leachate via cultivation of lipid-rich Scenedesmus microalgae. J. Clean. Prod. 2021, 303, 127094. [Google Scholar] [CrossRef]
- Fan, H.; Wang, K.; Wang, C.; Yu, F.; He, X.; Ma, J.; Li, X. A comparative study on growth characters and nutrients removal from wastewater by two microalgae under optimized light regimes. Environ. Technol. Innov. 2020, 19, 100849. [Google Scholar] [CrossRef]
- Sacristán-de Alva, M.; Luna-Pabello, V.M.; Cadena-Martínez, E.; Alva-Martinez, A.F. Producción de biodiésel a partir de microalgas y una cianobacteria cultivada en diferentes calidades de agua. Agrociencia 2014, 48, 271–284. [Google Scholar]
- Xaaldi Kalhor, A.; Mohammadi Nassab, A.D.; Abedi, E.; Bahrami, A.; Movafeghi, A. Biodiesel production in crude oil contaminated environment using Chlorella vulgaris. Bioresour. Technol. 2016, 222, 190–194. [Google Scholar] [CrossRef] [PubMed]
- Fernández-Linares, L.C.; Guerrero Barajas, C.; Durán Páramo, E.; Badillo Corona, J.A. Evaluación de la biomasa de Chlorella vulgaris y microalgas autóctonas con aguas residuales tratadas como medio de cultivo de crecimiento. Bioresour. Technol. 2017, 244, 400–406. [Google Scholar] [CrossRef]
- Kothari, R.; Pathak, V.V.; Kumar, V.; Singh, D.P. Experimental study for growth potential of unicellular alga Chlorella pyrenoidosa on dairy waste water: An integrated approach for treatment and biofuel production. Bioresour. Technol. 2012, 116, 466–470. [Google Scholar] [CrossRef] [PubMed]
- Nayak, M.; Karemore, A.; Sen, R. Performance evaluation of microalgae for concomitant wastewater bioremediation, CO2 biofixation and lipid biosynthesis for biodiesel application. Algal Res. 2016, 16, 216–223. [Google Scholar] [CrossRef]
- Kudahettige, N.P.; Pickova, J.; Gentili, F.G. Stressing algae for biofuel production: Biomasa y composición bioquímica de Scenedesmus dimorphus y Selenastrum minutum cultivadas en aguas residuales municipales no tratadas. Front. Energy Res. 2018, 6, 132. [Google Scholar] [CrossRef]
- Zhang, C.; Wu, D.J.; Zhong, C.Q. Cultivating Scenedesmus dimorphus in lactic acid wastewater for cost-effective biodiesel production. Sci. Total Environ. 2021, 792, 148428. [Google Scholar] [CrossRef]
- Meng, Y.; Yao, C.; Xue, S.; Yang, H. Application of fourier transform infrared (FT-IR) spectroscopy in determination of microalgal compositions. Bioresour. Technol. 2014, 151, 347–354. [Google Scholar] [CrossRef]
- González Grijalva, R.D. Análisis Económico de la Producción de Biomasa a Partir de Microalgas para Biocombustibles en Fotobiorreactores a Escala Piloto; Universidad Internacional SEK: Quito, Ecuador, 2018. [Google Scholar]
- Mamo, T.T.; Mekonnen, Y.S. Microwave-Assisted Biodiesel Production from Microalgae, Scenedesmus Species, Using Goat Bone-Made Nano-catalyst. Appl. Biochem. Biotechnol. 2020, 190, 1147–1162. [Google Scholar] [CrossRef]
- Nguyen, T.T.; Uemura, Y.; Lam, M.K.; Mansor, N.; Lim, J.W. Revelando el efecto de los parámetros de reacción hacia la distribución de grupos alquilo en la transesterificación in situ de Chlorella vulgaris. Energy Convers. Manag. 2019, 185, 223–231. [Google Scholar] [CrossRef]
- Tran, D.T.; Chen, C.L.; Chang, J.S. Effect of solvents and oil content on direct transesterification of wet oil-bearing microalgal biomass of Chlorella vulgaris ESP-31 for biodiesel synthesis using immobilized lipase as the biocatalyst. Bioresour. Technol. 2013, 135, 213–221. [Google Scholar] [CrossRef] [PubMed]
- Duygu, D.Y. Fourier transform infrared (FTIR) spectroscopy for identification of Chlorella vulgaris Beijerinck 1890 and Scenedesmus obliquus (Turpin) Kützing 1833. Afr. J. Biotechnol. 2012, 11, 3817–3824. [Google Scholar] [CrossRef]
- Indhumathi, P.; Soundararajan, M.; Syed Shabudeen, P.S.; Soba, U.S.; Suresh, E. Utilización, aislamiento y caracterización de Chlorella vulgaris para el tratamiento de secuestro de carbono y aguas residuales. Asian J. Microbiol. Biotechnol. Environ. 2013, 4, 661–666. [Google Scholar]
- Murdock, J.N.; Wetzel, D.L. FT-IR microspectroscopy enhances biological and ecological analysis of algae. Appl. Spectrosc. Rev. 2009, 44, 335–361. [Google Scholar] [CrossRef]
- Smith, B. Infrared Spectral Interpretation; CRC Press: Boca Raton, FL, USA, 1999. [Google Scholar]
- Esther Elizabeth Grace, C.; Kiruthika Lakshmi, P.; Meenakshi, S.; Vaidyanathan, S.; Srisudha, S.; Briget Mary, M. Biomolecular transitions and lipid accumulation in green microalgae monitored by FTIR and Raman analysis. Spectrochim. Acta-Part A Mol. Biomol. Spectrosc. 2020, 224, 117382. [Google Scholar] [CrossRef] [PubMed]
- Fabian, H.; Mäntele, W. Infrared spectroscopy of proteins. In Handbook of Vibrational Spectroscopy; John Wiley & Sons: Hoboken, NJ, USA, 2006; pp. 3399–3425. [Google Scholar]
- Stuart, B.H. Infrared Spectroscopy: Fundamentals and Applications; John Wiley & Sons: Hoboken, NJ, USA, 2004; Volume 8. [Google Scholar] [CrossRef]
- Bordoloi, N.; Narzari, R.; Sut, D.; Saikia, R.; Chutia, R.S.; Kataki, R. Characterization of bio-oil and its sub-fractions from pyrolysis of Scenedesmus dimorphus. Renew. Energy 2016, 98, 245–253. [Google Scholar] [CrossRef]
- Hernández, M.M.; Acosta, S.L.S.; Ramírez, C.L.; Palacio, M.C.R. Perfil lipídico de Lagerheinia sp. Aislada de aguas residuales industriales. Tamaulipas, México. Adv. Cienc. Ing. 2018, 9, 25–33. [Google Scholar]
- Enamala, M.K.; Enamala, S.; Chavali, M.; Donepudi, J.; Yadavalli, R.; Kolapalli, B.; Aradhyula, T.V.; Velpuri, J.; Kuppan, C. Production of biofuels from microalgae—A review on cultivation, harvesting, lipid extraction, and numerous applications of microalgae. Renew. Sustain. Energy Rev. 2018, 94, 49–68. [Google Scholar] [CrossRef]
- Avula, S.G.C.; Belovich, J.M.; Xu, Y. Determinación de ésteres metílicos de ácidos grasos derivados de biomasa de algas Scenedesmus dimorphus por GC-MS con esterificación en un paso de ácidos grasos libres y transesterificación de glicerolípidos. J. Sep. Sci. 2017, 40, 2214–2227. [Google Scholar] [CrossRef]

| Treatment | Culture Medium | Photoperiod (Light:Dark) |
|---|---|---|
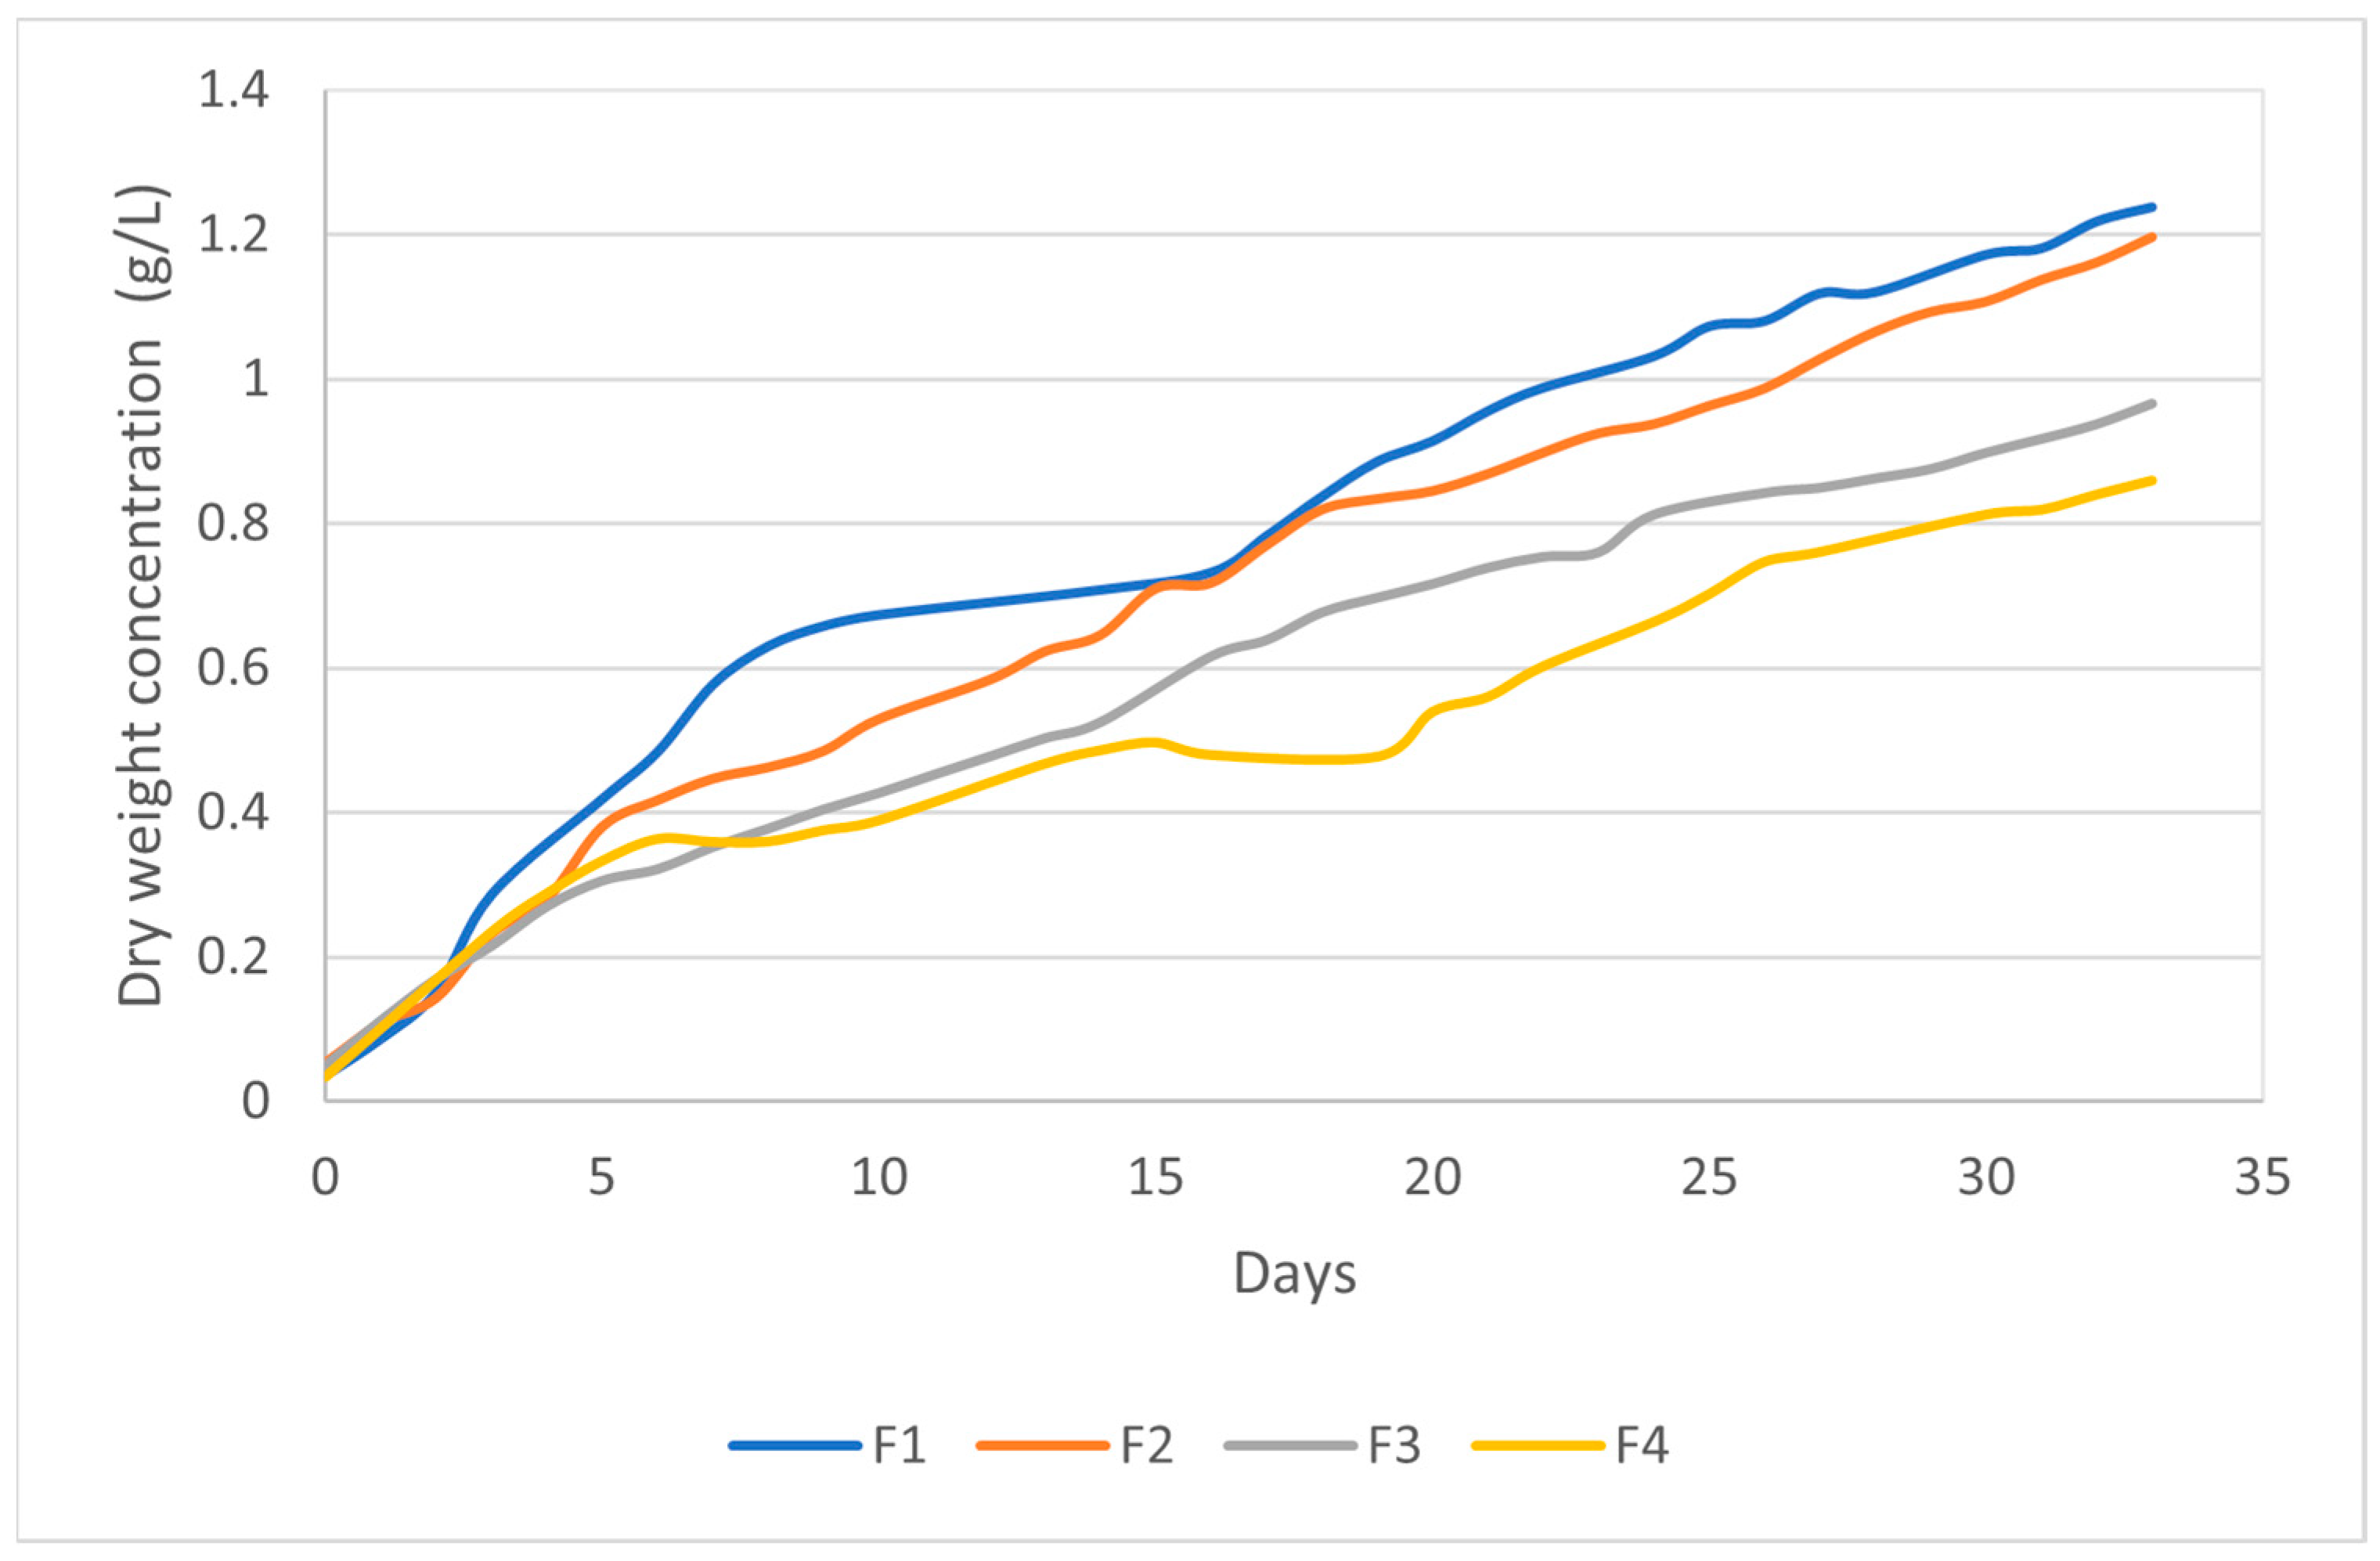
| 1 | Eutrophicated lagoon water | F1 (10.5:13.5) |
| 2 | Eutrophicated lagoon water | F2 (11.5:12.5) |
| 3 | Eutrophicated lagoon water | F3 (12.5:11.5) |
| 4 | Eutrophicated lagoon water | F4 (13.5:10.5) |
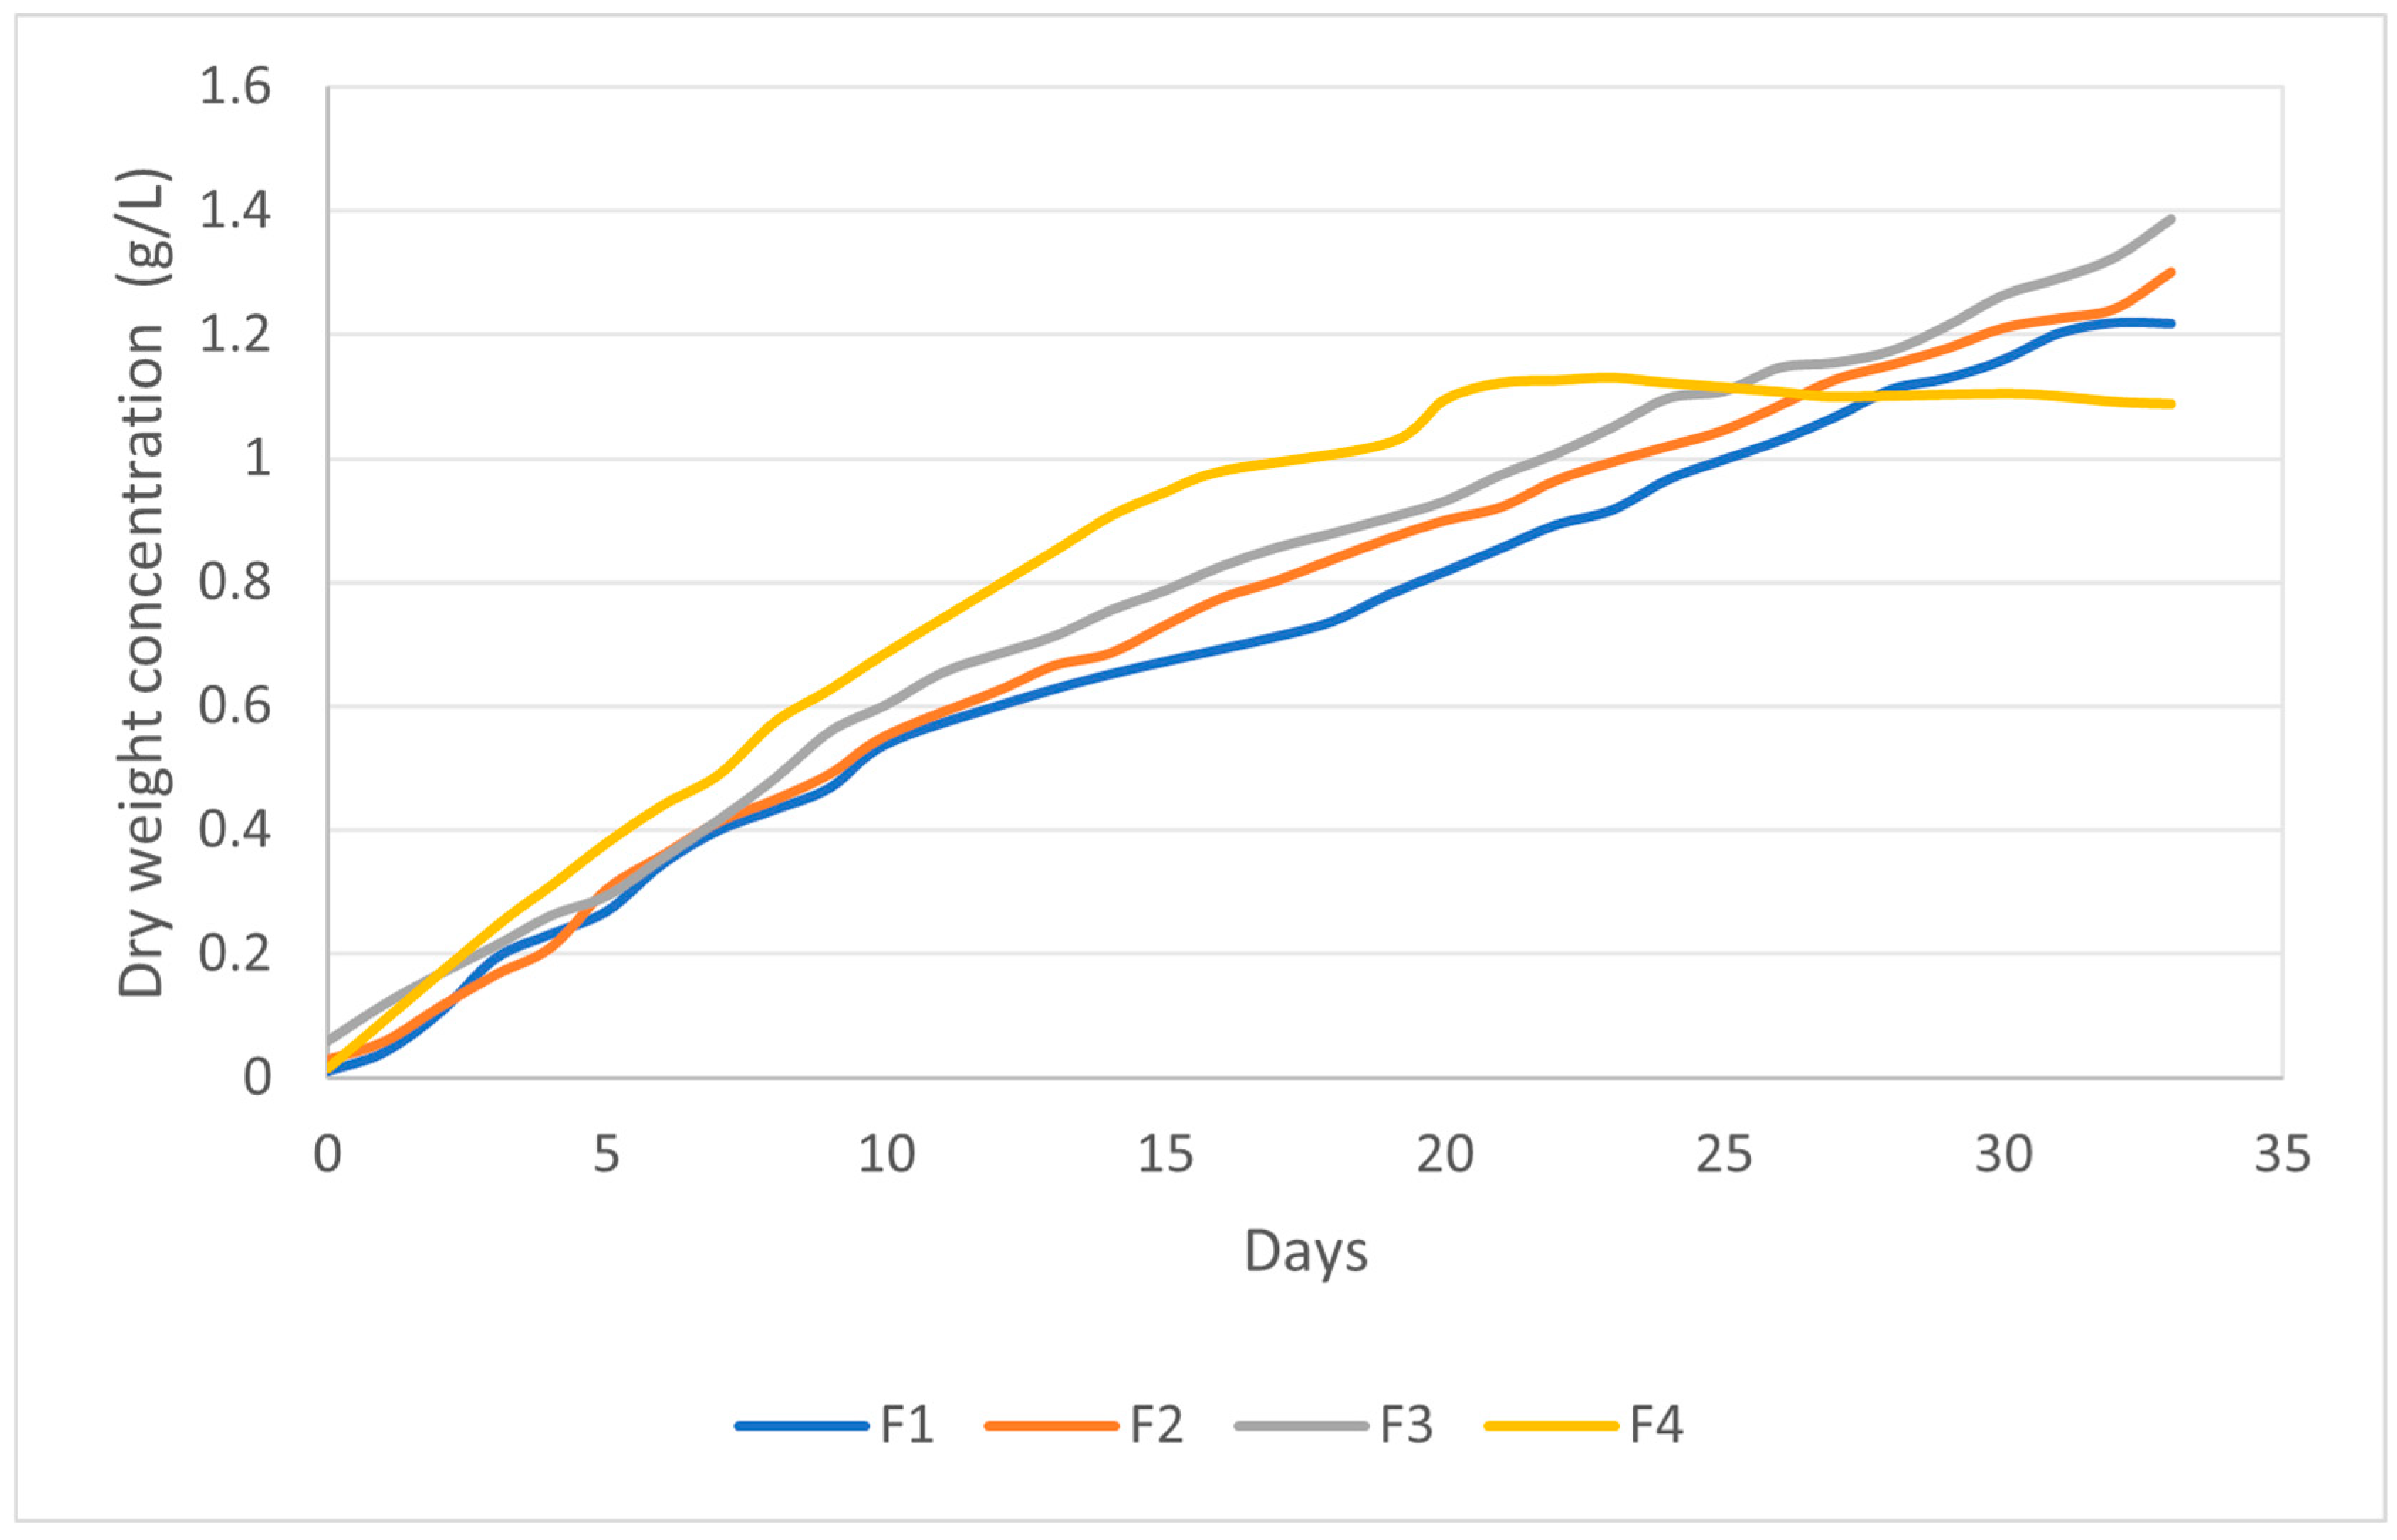
| 5 | Bayfolan 0.3% | F1 (10.5:13.5) |
| 6 | Bayfolan 0.3% | F2 (11.5:12.5) |
| 7 | Bayfolan 0.3% | F3 (12.5:11.5) |
| 8 | Bayfolan 0.3% | F4 (13.5:10.5) |
| Factor B | Factor A—Biomass Productivity (g/L/Day) | |||
|---|---|---|---|---|
| Growing Medium | F1 (10.5:13.5) | F2 (11.5:12.5) | F3 (12.5:11.5) | F4 (13.5:10.5) |
| Eutrophicated lagoon water | 0.055 | 0.043 | 0.040 | 0.023 |
| 0.054 | 0.050 | 0.033 | 0.025 | |
| 0.052 | 0.041 | 0.035 | 0.023 | |
| Bayfolan at 0.3% | 0.038 | 0.036 | 0.033 | 0.023 |
| 0.035 | 0.039 | 0.032 | 0.023 | |
| 0.036 | 0.036 | 0.033 | 0.026 | |
| Origin of Variances | Sum of Squares | Degrees of Freedom | Mean Squares | F | Probability | Critical Value for F |
|---|---|---|---|---|---|---|
| Sample | 0.000170 | 1 | 0.000170 | 27.48 | 8.04 × 10⁻⁵ | 4.49 |
| Columns | 0.001514 | 3 | 0.000504 | 81.30 | 6.69 × 10⁻¹⁰ | 3.23 |
| Interaction | 0.000385 | 3 | 0.000128 | 20.67 | 9.44 × 10⁻⁶ | 3.23 |
| In-group | 9.93 × 10⁻⁵ | 16 | 6.20 × 10⁻⁶ | |||
| Total | 0.002169 | 23 |
| Origin of Variances | Sum of Squares | Degrees of Freedom | Mean Squares | F | Probability | Critical Value for F |
|---|---|---|---|---|---|---|
| Between groups | 0.001471 | 3 | 0.00049033 | 50.29 | 1.55 × 10⁻⁵ | 4.06 |
| Within groups | 0.000078 | 8 | 0.00000975 | |||
| Total | 11 |
| F1 | F2 | F3 | F4 | |
|---|---|---|---|---|
| F1 | - | 0.0090 | 0.0177 | 0.0300 |
| F2 | - | - | 0.0087 | 0.0210 |
| F3 | - | - | - | 0.0123 |
| F4 | - | - | - | - |
| Origin of Variances | Sum of Squares | Degrees of Freedom | Mean Squares | F | Probability | Critical Value for F |
|---|---|---|---|---|---|---|
| Between groups | 0.000428 | 3 | 0.000142 | 53.54 | 1.22 × 10⁻⁵ | 4.06 |
| Within groups | 2.13 × 10⁻⁵ | 8 | 2.66 × 10⁻⁶ | |||
| Total | 11 |
| F1 | F2 | F3 | F4 | |
|---|---|---|---|---|
| F1 | - | −0.0006 | −0.0030 | 0.0123 |
| F2 | - | - | −0.0023 | 0.0130 |
| F3 | - | - | - | 0.0153 |
| F4 | - | - | - | - |
| Factor B | Factor A—% Removal of Chemical Oxygen Demand | |||
|---|---|---|---|---|
| F1 (10.5:13.5) | F2 (11.5:12.5) | F3 (12.5:11.5) | F4 (13.5:10.5) | |
| Eutrophicated lagoon water | 95.1 | 93.1 | 87.8 | 59.9 |
| 97.1 | 91.9 | 82.5 | 61.0 | |
| 94.5 | 91.0 | 80.5 | 60.5 | |
| Bayfolan at 0.3% | 59.5 | 89.0 | 87.2 | 43.6 |
| 60.1 | 87.6 | 89.6 | 40.8 | |
| 61.2 | 89.1 | 89.7 | 45.1 | |
| Origin of Variances | Sum of Squares | Degrees of Freedom | Mean Squares | F | Probability | Critical Value for F |
|---|---|---|---|---|---|---|
| Sample | 868.806666 | 1 | 868.806666 | 247.25 | 3.75 × 10⁻¹¹ | 4.49 |
| Columns | 4986.05833 | 3 | 1662.01944 | 473.00 | 7.93 × 10⁻¹⁶ | 3.23 |
| Interaction | 1380.29333 | 3 | 460.097777 | 130.94 | 1.80 × 10⁻¹¹ | 3.23 |
| In-group | 56.22 | 16 | 3.51375 | |||
| Total | 7291.37833 | 23 |
| Origin of Variances | Sum of Squares | Degrees of Freedom | Mean Squares | F | Probability | Critical Value for F |
|---|---|---|---|---|---|---|
| Between groups | 2240.995833 | 3 | 746.998611 | 170.77 | 1.36 × 10⁻⁷ | 4.06 |
| Within groups | 34.99333333 | 8 | 4.37416666 | |||
| Total | 2275.989167 | 11 |
| F1 | F2 | F3 | F4 | |
|---|---|---|---|---|
| F1 | - | 3.5666 | 11.9666 | 35.1000 |
| F2 | - | - | 8.4000 | 31.5333 |
| F3 | - | - | - | 23.1333 |
| F4 | - | - | - | - |
| Origin of Variances | Sum of Squares | Degrees of Freedom | Mean Squares | F | Probability | Critical Value for F |
|---|---|---|---|---|---|---|
| Between groups | 4125.35583 | 3 | 1375.11861 | 518.26 | 1.68 × 10⁻⁹ | 4.06 |
| Within groups | 21.2266667 | 8 | 2.6533333 | |||
| Total | 11 |
| F1 | F2 | F3 | F4 | |
|---|---|---|---|---|
| F1 | - | −28.3000 | −28.5600 | 14.4300 |
| F2 | - | - | −0.2600 | 42.7300 |
| F3 | - | - | - | 43.0000 |
| F4 | - | - | - | - |
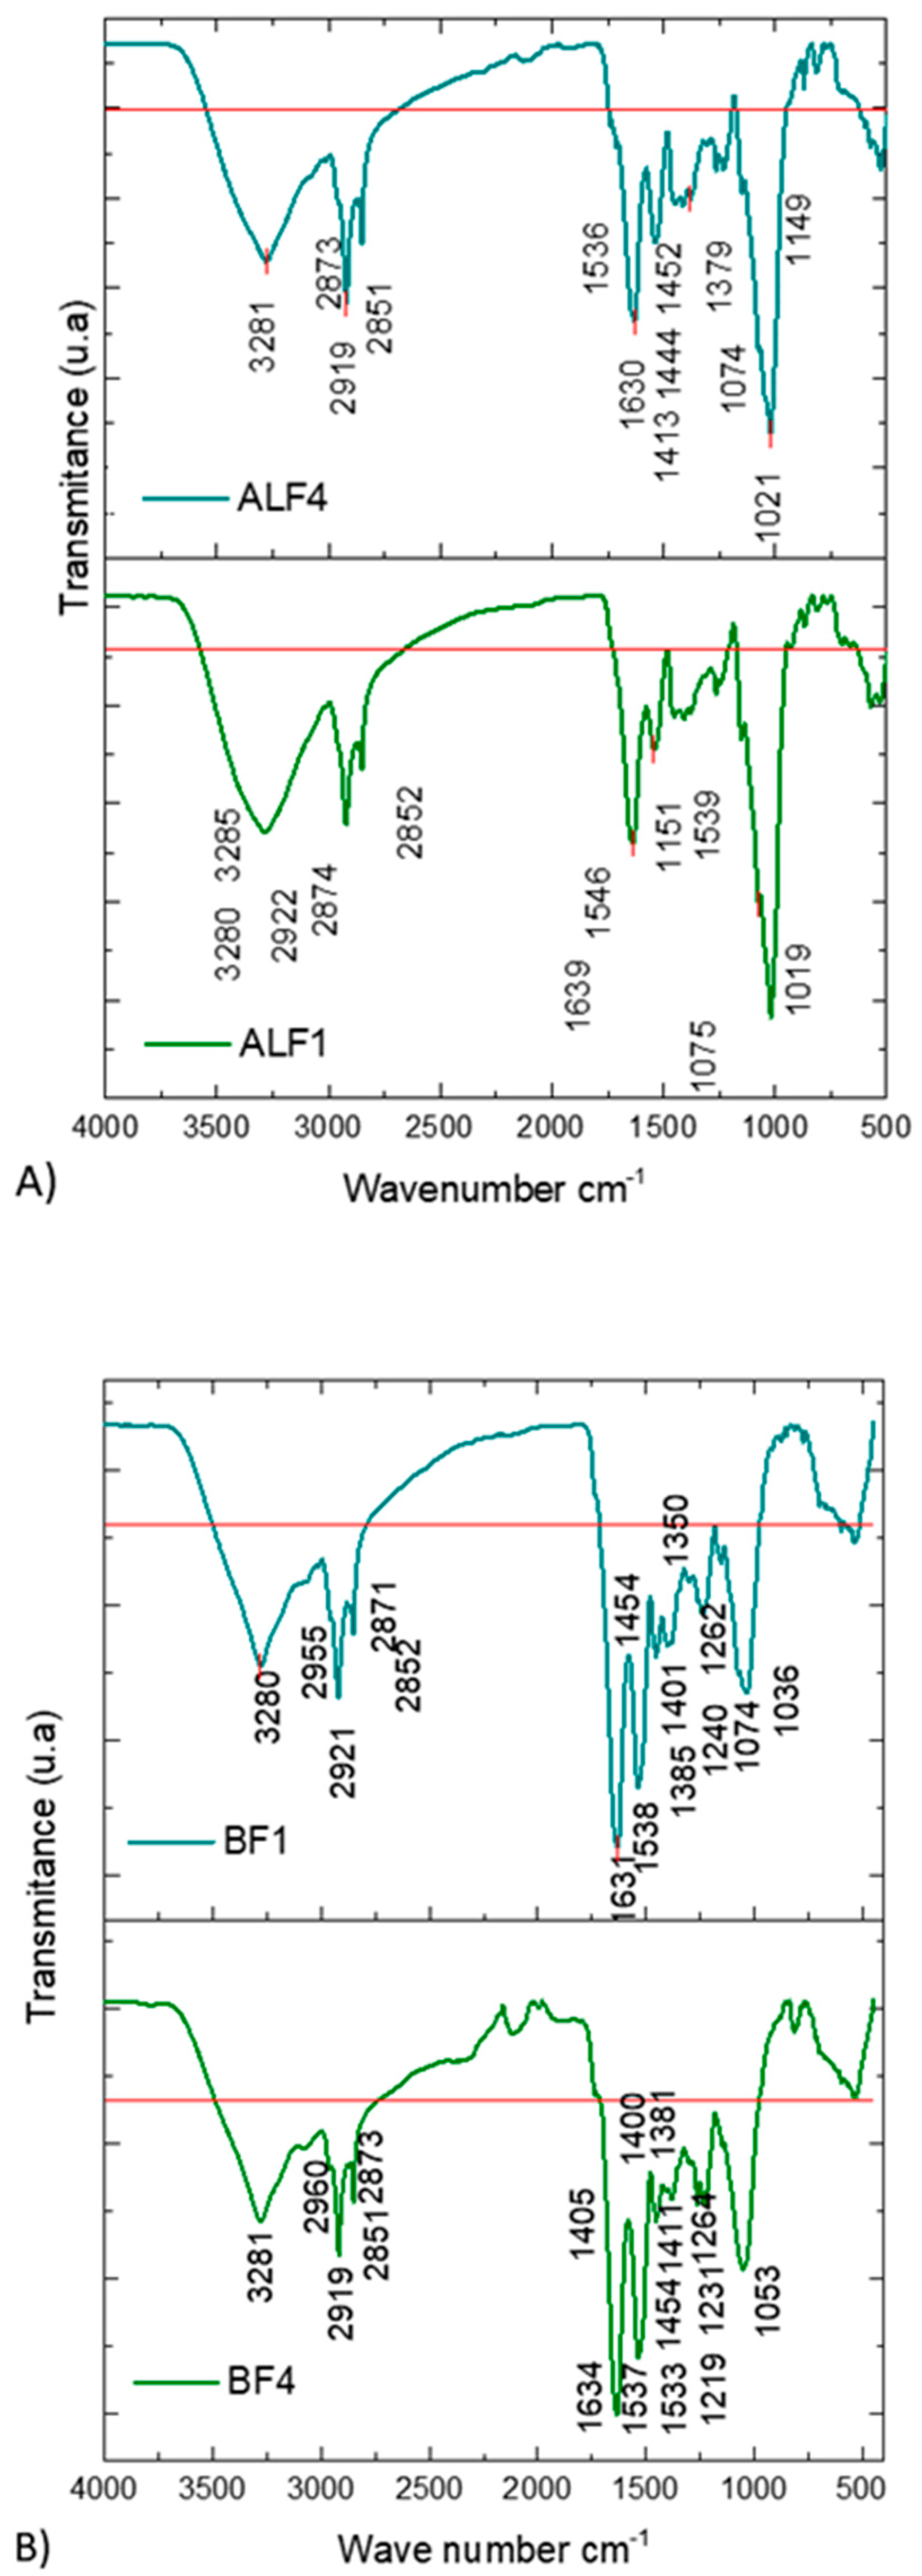
| ALF1 | ALF4 | BF1 | BF4 | Wavenumber Range cm−1 | Functional Group | References |
|---|---|---|---|---|---|---|
| 950–1200 Carbohydrate Band | [18] | |||||
| 1019 | 1021 | 980–1072 | C-O-C polysaccharides | [23,24] | ||
| 1036 | ||||||
| 1053 | ||||||
| 1036 | 1030–1099 | P=O nucleic acids | [25] | |||
| 1053 | ||||||
| 1075 | 1074 | 1074 | ||||
| 1075 | 1074 | 1074 | 1070–1140 | C-O-C | [26] | |
| 1151 | 1149 | 1134–1174 | C-O-C polysaccharides | [23] | ||
| 1219 | 1210–1240 | P=O polysaccharides | [27] | |||
| 1240 | ||||||
| 1240 | 1230–1244 | P=O polysaccharides | [25] | |||
| 1240 | 1231 | 1230–1310 | C-N secondary amide | [26] | ||
| 1262 | 1264 | |||||
| 1350 | 1191–1356 | P=O polysaccharides, phosphodiester | [23] | |||
| 1379 | 1370–1398 | CH3, CH2, C-O proteins, and carboxyl groups | [25] | |||
| 1385 | 1381 | |||||
| 1413 | 1401 | 1400 | 1390–1430 | C-N amide stretching | [26] | |
| 1405 | ||||||
| 1411 | ||||||
| 1413 | 1401 | 1400 | 1392–1460 | C-O carboxyl groups | [25] | |
| 1444 | 1405 | |||||
| 1411 | ||||||
| 1450–1720 Amino acid band | [28] | |||||
| 1490–1710 Protein band | [18] | |||||
| 1452 | 1454 | 1454 | 1450–1456 | CH2, CH3 Lipids and proteins | [23,25] | |
| 1539 | 1536 | 1538 | 1533 | 1515–1570 | N-H secondary amide | [26] |
| 1546 | 1537 | |||||
| 1639 | 1630 | 1631 | 1634 | 1630–1680 | C=O secondary amide | [26] |
| 2800–3000 Lipid band | [18] | |||||
| 2852 | 2851 | 2852 | 2851 | 2850–2960 | CH2 symmetrical nucleic acids | [29] |
| 2874 | 2873 | 2871 | 2873 | 2960–2975 | CH3 asymmetric Lipids | [25] |
| 2922 | 2919 | 2921 | 2919 | 2916–2936 | CH2 asymmetric Lipids | [29] |
| 2955 | 2960 | 2952–2972 | CH3 symmetrical Lipids | [29] | ||
| 3280 | 3281 | 3280 | 3281 | 3170–3370 | N-H secondary amide | [26] |
| 3285 | ||||||
| BF1 | BF4 | ALF1 | ALF4 | |
|---|---|---|---|---|
| Saturated Fatty Acids (%) | 60.52 | 62.66 | 53.02 | 55.86 |
| Caprylic acid (C8:0) | 2.5 | 3.01 | 3.9 | 4.37 |
| Capric acid (C10:0) | 2.15 | 2.61 | 3.4 | 3.81 |
| Lauric acid (C12:0) | 2.40 | 2.73 | 3.57 | 4.08 |
| Tridecanoic acid (C13:0) | 1.33 | 1.5 | 1.86 | 2.03 |
| Myristic acid (C14:0) | 2.82 | 4.02 | 4.16 | 4.65 |
| Pentadecanoic acid (C15:0) | 1.26 | 1.65 | 1.81 | 2.01 |
| Palmitic acid (C16:0) | 18.17 | 18.71 | 11.59 | 13.09 |
| Margaric acid (C17:0) | 4.11 | 2.01 | 3.03 | 2.78 |
| Stearic acid (C18:0) | 9.66 | 8.35 | 11.24 | 8.79 |
| Arachidic acid (C20:0) | 2.73 | 3.44 | 4.37 | 5.13 |
| Heneicosanoic acid (C21:0) | 1.52 | 0 | 0 | 0 |
| Behenic acid (C22:0) | 7.87 | 9.71 | 0 | 5.12 |
| Tricosanoic acid (C23:0) | 1.21 | 1.46 | 4.09 | 0 |
| Lignoceric acid (C24:0) | 2.79 | 3.42 | 0 | 0 |
| Monounsaturated fatty acids | 17.60 | 18.40 | 23.96 | 24.97 |
| Myristoleic acid (C14:1 cis 9) | 1.39 | 1.67 | 2.18 | 2.28 |
| Pentadecanoic acid (C15:1 cis 10) | 1.52 | 1.94 | 2.44 | 0 |
| Hexadecenoic acid (C16:1 cis 9) | 1.81 | 2.09 | 2.39 | 6.5 |
| Margaroleic acid (C17:1 cis 10) | 1.56 | 1.91 | 2.46 | 2.64 |
| Oleic acid (C18:1 cis 9) | 9.57 | 9.2 | 12.41 | 11.31 |
| Eicosenoic acid (C20:1 cis 11) | 1.75 | 1.59 | 2.08 | 2.24 |
| Polyunsaturated fatty acids | 21.87 | 18.99 | 23.02 | 19.17 |
| Linoleic acid (C18:2 cis 9, 12) | 12.05 | 9.81 | 11.55 | 10.36 |
| Gamma-linoleic acid (C18:3 cis 6,9, 12) | 1.59 | 1.97 | 2.13 | 2.45 |
| Alpha-linolenic acid (C18:3 cis 9, 12, 15) | 4.14 | 5.78 | 5.42 | 6.36 |
| Eicosadienoic acid (C20:2 cis 11, 14) | 1.23 | 0 | 0 | 0 |
| Eicosatrienoic acid (C20:3 cis 8, 11, 14) | 1.53 | 0 | 0 | 0 |
| Arachidonic acid (C20:4 cis 5, 8, 11, 14) | 1.33 | 1.43 | 1.89 | 0 |
| Docosahexaenoic acid (C22:6 cis 4, 7, 10, 13, 16, 19) | 0 | 0 | 2.03 | 0 |
| Trans fatty acids | 0 | 0 | 0 | 0 |
Disclaimer/Publisher’s Note: The statements, opinions and data contained in all publications are solely those of the individual author(s) and contributor(s) and not of MDPI and/or the editor(s). MDPI and/or the editor(s) disclaim responsibility for any injury to people or property resulting from any ideas, methods, instructions or products referred to in the content. |
© 2023 by the authors. Licensee MDPI, Basel, Switzerland. This article is an open access article distributed under the terms and conditions of the Creative Commons Attribution (CC BY) license (https://creativecommons.org/licenses/by/4.0/).
Share and Cite
Pérez Bravo, S.G.; Castañeda Chávez, M.d.R.; Aguilera Vázquez, L.; Gallardo Rivas, N.V.; Morales Rodríguez, M.L.; Páramo García, U. Evaluation of Scenedesmus dimorphus under Different Photoperiods with Eutrophicated Lagoon Water. Resources 2023, 12, 140. https://doi.org/10.3390/resources12120140
Pérez Bravo SG, Castañeda Chávez MdR, Aguilera Vázquez L, Gallardo Rivas NV, Morales Rodríguez ML, Páramo García U. Evaluation of Scenedesmus dimorphus under Different Photoperiods with Eutrophicated Lagoon Water. Resources. 2023; 12(12):140. https://doi.org/10.3390/resources12120140
Chicago/Turabian StylePérez Bravo, Sheila Genoveva, María del Refugio Castañeda Chávez, Luciano Aguilera Vázquez, Nohra Violeta Gallardo Rivas, María Lucila Morales Rodríguez, and Ulises Páramo García. 2023. "Evaluation of Scenedesmus dimorphus under Different Photoperiods with Eutrophicated Lagoon Water" Resources 12, no. 12: 140. https://doi.org/10.3390/resources12120140