1. Introduction
The current lifecycle of corrugated cardboard boxes (CCB) starts with the manufacturing of the CCBs with raw materials such as hardwood, softwood, and adhesives. These raw materials are collected and transported to the location of the pulp-making operation. The pulp is made out of softwood and hardwood to form fibers which are then combined with recycled fibers to manufacture paper. Next, the manufactured paper is transported to the location of the converting operation. Two types of paper are used in manufacturing the CCBs: liner and medium. CCBs comprise a corrugated board that is made up of three layers of corrugated sheets (an inside liner, an outside liner, and a medium that goes between the two, which is fluted). The corrugated board is formed in the required shape and size of CCBs. Once the CCBs are formed, they are shipped to the required location (e.g., retail stores), where they start their use phase. In this phase, they are mainly used as outer packaging material for the transportation and shipping of goods and products. In the disposal phase, the CCBs are either recycled or landfilled. A huge amount of the supply chain goes into extracting raw materials, such as cutting hardwood and softwood trees and processing them. Additionally, extraction plays a role in the recycling phase, where the recycled fibers are extracted from old CCBs.
Previous work [
1] has laid the groundwork for this research paper. This previous work discussed pollution and the current efforts to reduce global warming and climate change. It focused on recycling waste and the two main shortcomings of recycling corrugated cardboard boxes (CCB). First, out of 100 billion boxes produced in the U.S. each year, only 70–75% of the boxes are received for recycling [
2,
3]. Second, a typical CCB contains only 50% of its fibers from recycled fibers [
4,
5]. Previous work showed that one of the main reasons for the low recycling rate is the lack of motivation in the general population. In order to address this, the authors proposed a way to “reuse” the CCB instead of recycling it in addition to testing different types of motivation tools. The paper proposed a new motivation means by combining persuasion techniques (ethos, pathos, logos, and aesthetics) and operant condition techniques (positive reinforcement, positive punishment, negative reinforcement, and negative punishment). After conducting two surveys and analyzing the data with various tools, the same paper recommended using “positively-reinforced ethos” as an incentive for the general population to reuse the CCB over recycling or landfilling it. Lastly, the paper also gave the cost of positive reinforcement (
$1.81) and the cost of ethos (
$1.79). This mean value is used in this study, with the cost of motivating the general population using positive reinforcement ethos being assigned a value of
$1.80. The proposed “reuse” cycle includes the general population allocating the CCB they received to “reuse” containers. Then these boxes would be collected by a truck and transported to the location where the CCBs are checked and resold to the general population. When the CCBs are not in a condition to be reused, they are assigned to recycling. Reuse is generally thought to be more sustainable for industries because it will eliminate/decrease certain supply chains and/or extraction of raw materials. Thus, it is important to examine if the environmental and economic cost of reducing the extraction is able to offset the additional cost of recollection and incentives.
Thus, [
1] answers questions on motivation and incentives that will work to motivate the general population to reuse and the cost of the incentive to motivate. However, from a systems standpoint, it is also (possibly more) important to determine the amount of carbon that is saved by reusing the CCB instead of recycling it or landfilling it. Moreover, is the reusing process economically feasible? Thus, this paper evaluates the carbon emission of CCB with different disposal scenarios (reusing, recycling, and landfilling). It will also evaluate the economic aspects of the “reuse” process to test its economic feasibility.
2. Materials and Methods
There are many methods to evaluate the carbon emission of a product. Based on the scope, it can be broadly categorized into two types, cradle-to-gate and cradle-to-grave. The cradle-to-gate method includes all the pollution from raw material gathering to packaging and shipping of the final product. It excludes the use phase and disposal phase. The cradle-to-grave method, in contrast, includes all the emissions over the entire life of the product.
2.1. Lifecycle Assessment
Life Cycle Assessment (LCA) was used to calculate the carbon emission of CCB over its life cycle. Ref. [
6] defines LCA as “an environmental accounting and management approach that considers all the aspects of resources use and environmental releases associated with an industrial system from cradle-to-grave.” The lifecycle of a corrugated cardboard box can be divided into four parts: pulp-making, converting, use phase, and end of the lifecycle. To calculate the carbon emission in these stages and to estimate total carbon emission over the life cycle of a corrugated cardboard box, LCA is carried out. The LCA methodology used in this research follows the international organization for standardization’s ISO 14040 and ISO 14044. The methodology to conduct an LCA consists of four steps:
Set Goal and Scope;
Life Cycle Inventory (LCI) Analysis;
Life Cycle Impact Assessment (LCIA);
Interpretation of Results.
2.1.1. Set Goal and Scope
The main product under study is a single-walled corrugated cardboard box. A recent study [
5] conducted by Fibre Box Association shows that an average corrugated cardboard box is made up of 50% recycled fibers. Thus, the product that is modeled and considered in this study is assumed to be manufactured with 50% recycled fibers. The function assumed for the product under this study is the domestic use of the average corrugated cardboard box produced in the U.S., namely, that of using the corrugated box mainly as a secondary packaging of products for shipping and transportation. The functional unit is defined as the domestic use of 1 kg of an average single-walled corrugated cardboard box produced in the United States. The goods that the corrugated cardboard box would carry are not considered in this study.
The system boundary includes the following four steps of the lifecycle of the corrugated box, which is set concerning a cradle-to-grave approach, i.e., from raw material extraction to the disposal of the product:
Pulp-making: This includes forest operations (cutting down the trees), transportation of the wood, chipping operation (converting wood into small chips), production of pulp from the chips, paper-making operation from pulp, conversion into a roll, and all the support operations such as steam/heat generation, chemical generation, etc.
Converting: This includes the transportation of paper to converting operations, the converting operation, which includes converting the liner board and corrugated medium into a corrugated box, and all the other supporting operations.
Use: This includes the transportation to use phase and the assumed transportation of the box in its use phase.
End-of-lifecycle (EoL): This includes the transportation of corrugated boxes from the use phase to the EoL phase and the energy and emission from the EoL processes such as landfilling, recycling, and burning.
Capital equipment, maintenance, transport of employees, and operation of support equipment are not included in the scope of this study. The energy required to pack a product in the use phase is also not considered in the scope. Wood and coal ashes are considered residual waste in the production process of CCB. The co-products—turpentine and tall oil—that are produced during the manufacturing process of CCB are very small in number and quality compared to CCB. Thus, co-product allocations are ignored as different allocation procedures are likely to have insignificant effects on the results.
2.1.2. Life Cycle Inventory Analysis
In the Life Cycle Inventory Analysis step, a description of the material used in the lifecycle of the product is expected. It also includes energy flows within the system as well as the system’s interaction with the environment. The life cycle inventory data for a corrugated cardboard box is taken from a report [
7] published by NCASI in 2017 as a reference, and the model is built upon it. The reference report has collected data with the help of surveys from corrugated cardboard manufacturing industries in the United States. Inventory data is divided in terms of stages of the lifecycle and are specified below.
Pulp-Making Phase
The pulp-making process consists of many different processes, inputs, and outputs that are outlined in
Figure 1.
Thus, the above figure outlines the life cycle process of the corrugated box, from raw materials such as wood logs and wood chips to the end product of the containerboard. It also specifies the energy consumed as well as the byproducts of this process. It is also important to specify the input-output to the production of the containerboard unit process per functional unit, as given in
Table 1.
Converting Phase
Converting process consists of many different processes that are outlined in
Figure 2.
Thus, the above figure outlines the life cycle process of the corrugated box’s converting process, which gets the containerboard as input from the pulp-making step, which is then converted to a corrugated cardboard box. It also specifies the energy consumed as well as the byproducts of this process. It is also important to specify the input-output to converting unit process per functional unit, as given in
Table 2 below.
Use Phase
This phase consists of the use of the corrugated box to ship other products by various consumers. Calculating carbon emission for this phase is very difficult, as it depends on the content inside the corrugated box and distance, as well as the mode of transport used for shipping purposes. Thus, certain assumptions are made to calculate carbon emissions in this phase. The United States Census Bureau’s data on commodity flow is used as the reference data to calculate the shipping distance of a representative corrugated box in the United States. This data was published in 2017 in the CFS preliminary report: Shipment characteristics by total modal activity [
8]. Below is the available data in
Table 3.
End-of-Lifecycle
The End-of-Lifecycle of the corrugated cardboard box is modeled with respect to the data from the United States Environmental Protection Agency from 2018 as shown in
Table 4 [
9].
Thus, the end of the life cycle of corrugated cardboard boxes is modeled with respect to the recently available data from 2018. Recycling of CCB is 80.88%, landfill of CCB is 15.37%, and combustion of CCB is 3.75%.
Apart from the material use and energy consumption data, it is also important to specify the reference data on the electricity generation and transportation values used as assumptions for modeling. Data on the U.S. average electricity grid fuel consumption mix used for 2021 is shown in
Table 5 below (U.S. Energy Information Administration) [
10].
All energy used in the input of the operations is considered electricity. Thus, electricity is modeled in OpenLCA, as given in
Table 6 below.
The amount of electricity is based on the national average (mean) in the United States. Since the database did not include electricity produced from solar, other gases, geothermal, and other sources, they are all added to the “average electricity mix”.
Data on transportation distances were modeled using the NCASI report [
7] from 2017, which is given in
Table 7 below.
2.1.3. Life Cycle Impact Assessment (LCIA)
This step includes describing the selected impact categories for LCA analysis as well as describing the method used to calculate the impact category. There are many impact categories as a list of commonly used categories is specified in ISO 14047 Technical Report (ISO2012a): global warming, human toxicity, stratospheric ozone depletion, depletion of abiotic resources, photo-oxidant formation, nitrification, ecotoxicity, acidification, and the depletion of biotic resources. Since this study focuses on the carbon emission of 1 kg of corrugated cardboard box over its lifecycle, three impact categories are used as follows:
Global warming, Fossil;
Global warming, Biogenic, GWP 20 years;
Global warming, Biogenic, GWP 100 years.
The impact category listed above are custom-made impact categories that are formed by combining the following standard impact categories:
GHG Protocol;
Environmental Footprint;
IPCC 2013 GWP 20;
IPCC 2013 GWP 100.
Impact categories depend on the impact factors included in their respective category. Impact factors for the three impact categories used in this study can be made available upon request to the authors. It is important to note that the Global Warming Potential (GWP) values for the impact factors are mainly derived from the Fifth Assessment Report (AR5) of IPCC (IPCC 2013, Table 8.A.1) [
11].
2.1.4. Interpretation of Results
This step is done in the next two sections (
Section 3 and
Section 4) of this research paper.
2.2. Economic Model
It is also important to look at the economics of reusing corrugated cardboard boxes instead of landfilling them or recycling them. Two concepts are used in this research to study and model the economics of this proposed “reuse” of corrugated boxes—benefit-cost analysis and marginal cost–willingness-to-pay curve.
Benefit-cost analysis is simply a method to evaluate something by considering its potential cost and benefits. According to Ref. [
12], “Benefit-cost analysis is for the public sector what a profit-and-loss analysis is for a business firm or a budget is for a household.” Benefit-cost analysis is a tool used from society’s standpoint to make a public decision instead of a single profit-making firm. The basic framework for benefit-cost analysis is used with reference to Ref. [
12], which includes the following four steps:
Clearly specify the project or program;
Describe the inputs and outputs of the program quantitatively;
Estimate the value of social costs and benefits of these inputs and outputs;
Compare these benefits and costs.
Marginal cost, or willingness-to-pay curves, can simply be imagined as supply and demand graphs with respect to the prediction of demand and ability to supply. According to Ref. [
12], a “willingness-to-pay for a given consumption level is the total amount a person would be willing to pay to attain that consumption level rather than go without the good entirely.” In other words, willingness-to-pay is the maximum amount an individual is willing to pay to acquire a good/service. According to Ref. [
13], “Marginal cost is the increment in cost that occurs when the output produced is increased by one unit.” Therefore, marginal cost is the difference in total cost that is experienced when the quantity of production is increased or the cost of producing one additional product is.
3. Results
3.1. Carbon Emission for Pulp-Making and Converting Operations
LCA modeling was conducted on OpenLCA software version 1.11.0 for pulp-making and converting operations. The databases specified under
Table 8 were combined and used to model the pulp-making and converting operations.
Thus, baseline data is used from these databases. OpenLCA is used to calculate the carbon emission for pulp-making and converting operations (excluding transportation).
Table 9 below shows the results from OpenLCA software for the two phases.
3.2. Carbon Emissions from Transportation
Carbon emission from the transportation of goods is calculated by using the following formula:
The product’s weight and travel distance are specified in the Life cycle inventory section. The emission factors are from the United States Environment Protection Agency‘s GHG emission factors Hub, as shown in
Table 8 (April 2022) [
24]. Below are the results in
Table 10 and
Table 11 for the transportation based on phases of the lifecycle.
3.3. Carbon Emission for Use Phase
It is difficult to identify/calculate the distance traveled by an average CCB and its mode of transport. In general, corrugated cardboard boxes are mainly used for packaging and transporting products. Usually, this phase is ignored, and the carbon emission from the use phase of CCB is allocated to the product that CCB holds for the sake of its transportation. To approximately calculate carbon emissions from this phase, the mean distance traveled by the average corrugated box with respect to the mode of transport is given in
Table 12 which is obtained from the United States Census Bureau’s CFS Preliminary Report (CF1700P2): Shipment characteristics by total modal activity (2017) [
8]. Here, the mass of the product is considered to be 1 kg as the functional unit in this research is 1 kg of CCB.
3.4. Carbon Emission for the End-of-Lifecycle (EoL) Phase
To calculate carbon emission at the EoL phase of 1 kg of CCB, it is important to understand the waste management methods used and emissions from respective methods. The reference data from 2018 is specified under the lifecycle inventory step in
Table 4. Out of the total waste collected, 81% is recycled, 4% is combusted, and 15% is landfilled. To calculate the carbon emission from each of the above management pathways, the authors use emission factors from the United States Environment Protection Agency‘s GHG emission factors Hub, as shown in
Table 9 (April 2022) [
24]. The emission factors from this reference data include the actual emission from the management pathway as well as the transport of the waste.
Table 13 shows the data for emission factors of CCB for different waste management methods.
3.5. Carbon for the Newly Proposed “Reuse” Phase
The “Reuse” phase proposes collecting used corrugated boxes similar to trash/recycling waste and then checking for usability and reselling the box to be reused. The proposed phase is imagined as a truck driving toward the individual’s location to collect old CCB as well as to collect trash. To calculate the carbon emission in the transportation of CCB from a general person’s location to a local collection point to reuse the CCB, it is important to identify the average distance the collection truck would travel. The United States Environment Protection Agency‘s Waste Transfer Stations, a manual for decision-making reports, was used [
25]. The report refers to the break-even point between the hauling cost and round-trip distance. The break-even point is 35 miles round trip from the waste source to the disposal. Thus, the transportation for this “reuse” phase is assumed to be 35 miles round trip. For emission factors, the United States Environment Protection Agency‘s GHG emission factors Hub (April 2022) was used and is shown in
Table 8 [
24].
Thus, the carbon emission for each phase of the lifecycle is given in
Table 14.
Thus, below are the overall results:
The carbon emission of a CCB over its lifecycle (excluding the Reuse phase) is 4.45677 kgCO2-eq for single use;
The carbon emission of a CCB reused once (including the Reuse phase once and Use phase twice) is 5.84332 kgCO2-eq, i.e., 2.92166 kgCO2-eq per use;
The carbon emission saved by the “reuse” cycle for every use would be 4.45677 − 2.92166 = 1.53511 kgCO2-eq per use.
In order to show relative comparisons among multiple studies,
Table 15 compares these results with the previous literature conducted on carbon emissions from CCBs.
3.6. Economic Modeling: Benefit-Cost Analysis
The functional unit considered in this paper is 1 kg of CCB. Thus, a CCB of 18 3/8 × 18 3/8 × 18 5/8″ (±1/8″) dimension is considered. The mass of this particular CCB is 1.01 kg. This particular CCB is currently (December 2022) sold at
$2.83 [
29]. It is assumed that the cost of a new CCB (
$2.83) includes the cost of manufacturing, transportation, and profits (i.e., there is no net external subsidization). The cost of motivation for reuse with a “Positive Reinforced Ethos” incentive is
$1.80, as mentioned in Ref. [
1]. Also, it is important to assume and evaluate the cost of reselling CCB. The selling price of a used box to resell is assumed to be
$2. Another assumption made for this calculation is that the benefit-cost analysis is carried out for a total of 100,000 boxes. This means we assume there is a need to use 100,000 boxes. Now in this scenario, it can be the use of 100,000 new CCBs or 50,000 boxes which are reused once in their lifecycle as proposed. To perform a benefit-cost analysis, it is important to identify benefits and costs for the newly proposed “reuse” phase.
Benefits:
Social cost: It is also important to evaluate the social cost of carbon emissions to use in economic modeling. According to Ref. [
30], the social cost of carbon could be
$900/tCO2, i.e.,
$0.9/kgCO
2;
Cost saving for second use: This is the cost that is saved by using a used box instead of a new box. Basically, it is the cost of production, transportation, and profit of the new box that is saved. In other words, the number of reused boxes is multiplied by the cost of the new box ($1.83). This is beneficial as the “reuse” cycle saves the cost of manufacturing and operating costs.
Cost:
Cost of motivation: This is the cost that is needed to motivate the general population to assign their CCBs to the “reuse” cycle. This cost is $1.80 per box;
Cost of reselling the CCBs: This is the cost that individuals pay to buy the reused boxes. This cost includes the operation cost plus the profit for the entity that would coordinate the whole “reuse” cycle.
Thus, the benefits-cost analysis is shown in
Table 16.
Sensitivity Analysis
- 1.
Case I: Lowest cost of a new box (
$1.17) for the “reuse” cycle to be profitable as shown in
Table 17.
- 2.
Case II: The highest cost of a used box (
$3.66) for the “reuse” cycle to be profitable as shown in
Table 18.
- 3.
Case III: Highest cost for motivation (
$3.46) for the “reuse” cycle to be profitable as shown in
Table 19.
3.7. Economic Modeling: Marginal Cost–Willingness-to-Pay Curves
Willingness-to-pay (WTP) for a new CCB is evaluated by considering eight CCBs with different dimensions and thicknesses as shown in
Table 20. The reference data is used from “Uline” company’s catalog. It is made sure that the mean weight of all eight CCBs is equal to 1 kg.
Although WTP for old CCBs is not available, the authors assumed that the WTP curve for old CCBs would be proportionate to that of the WTP curve of new CCBs. Thus, the slope of the WTP curve for the new CCBs was calculated. In order to draw the WTP curve for old CCBs, the mean of all the prices from
Table 20 (i.e.,
$3.686) is taken and is assumed to be proportionate to
$2, which is the assumed cost for old CCBs. Thus, that is how values of cost for different numbers of old CCBs are evaluated, as shown in
Table 21:
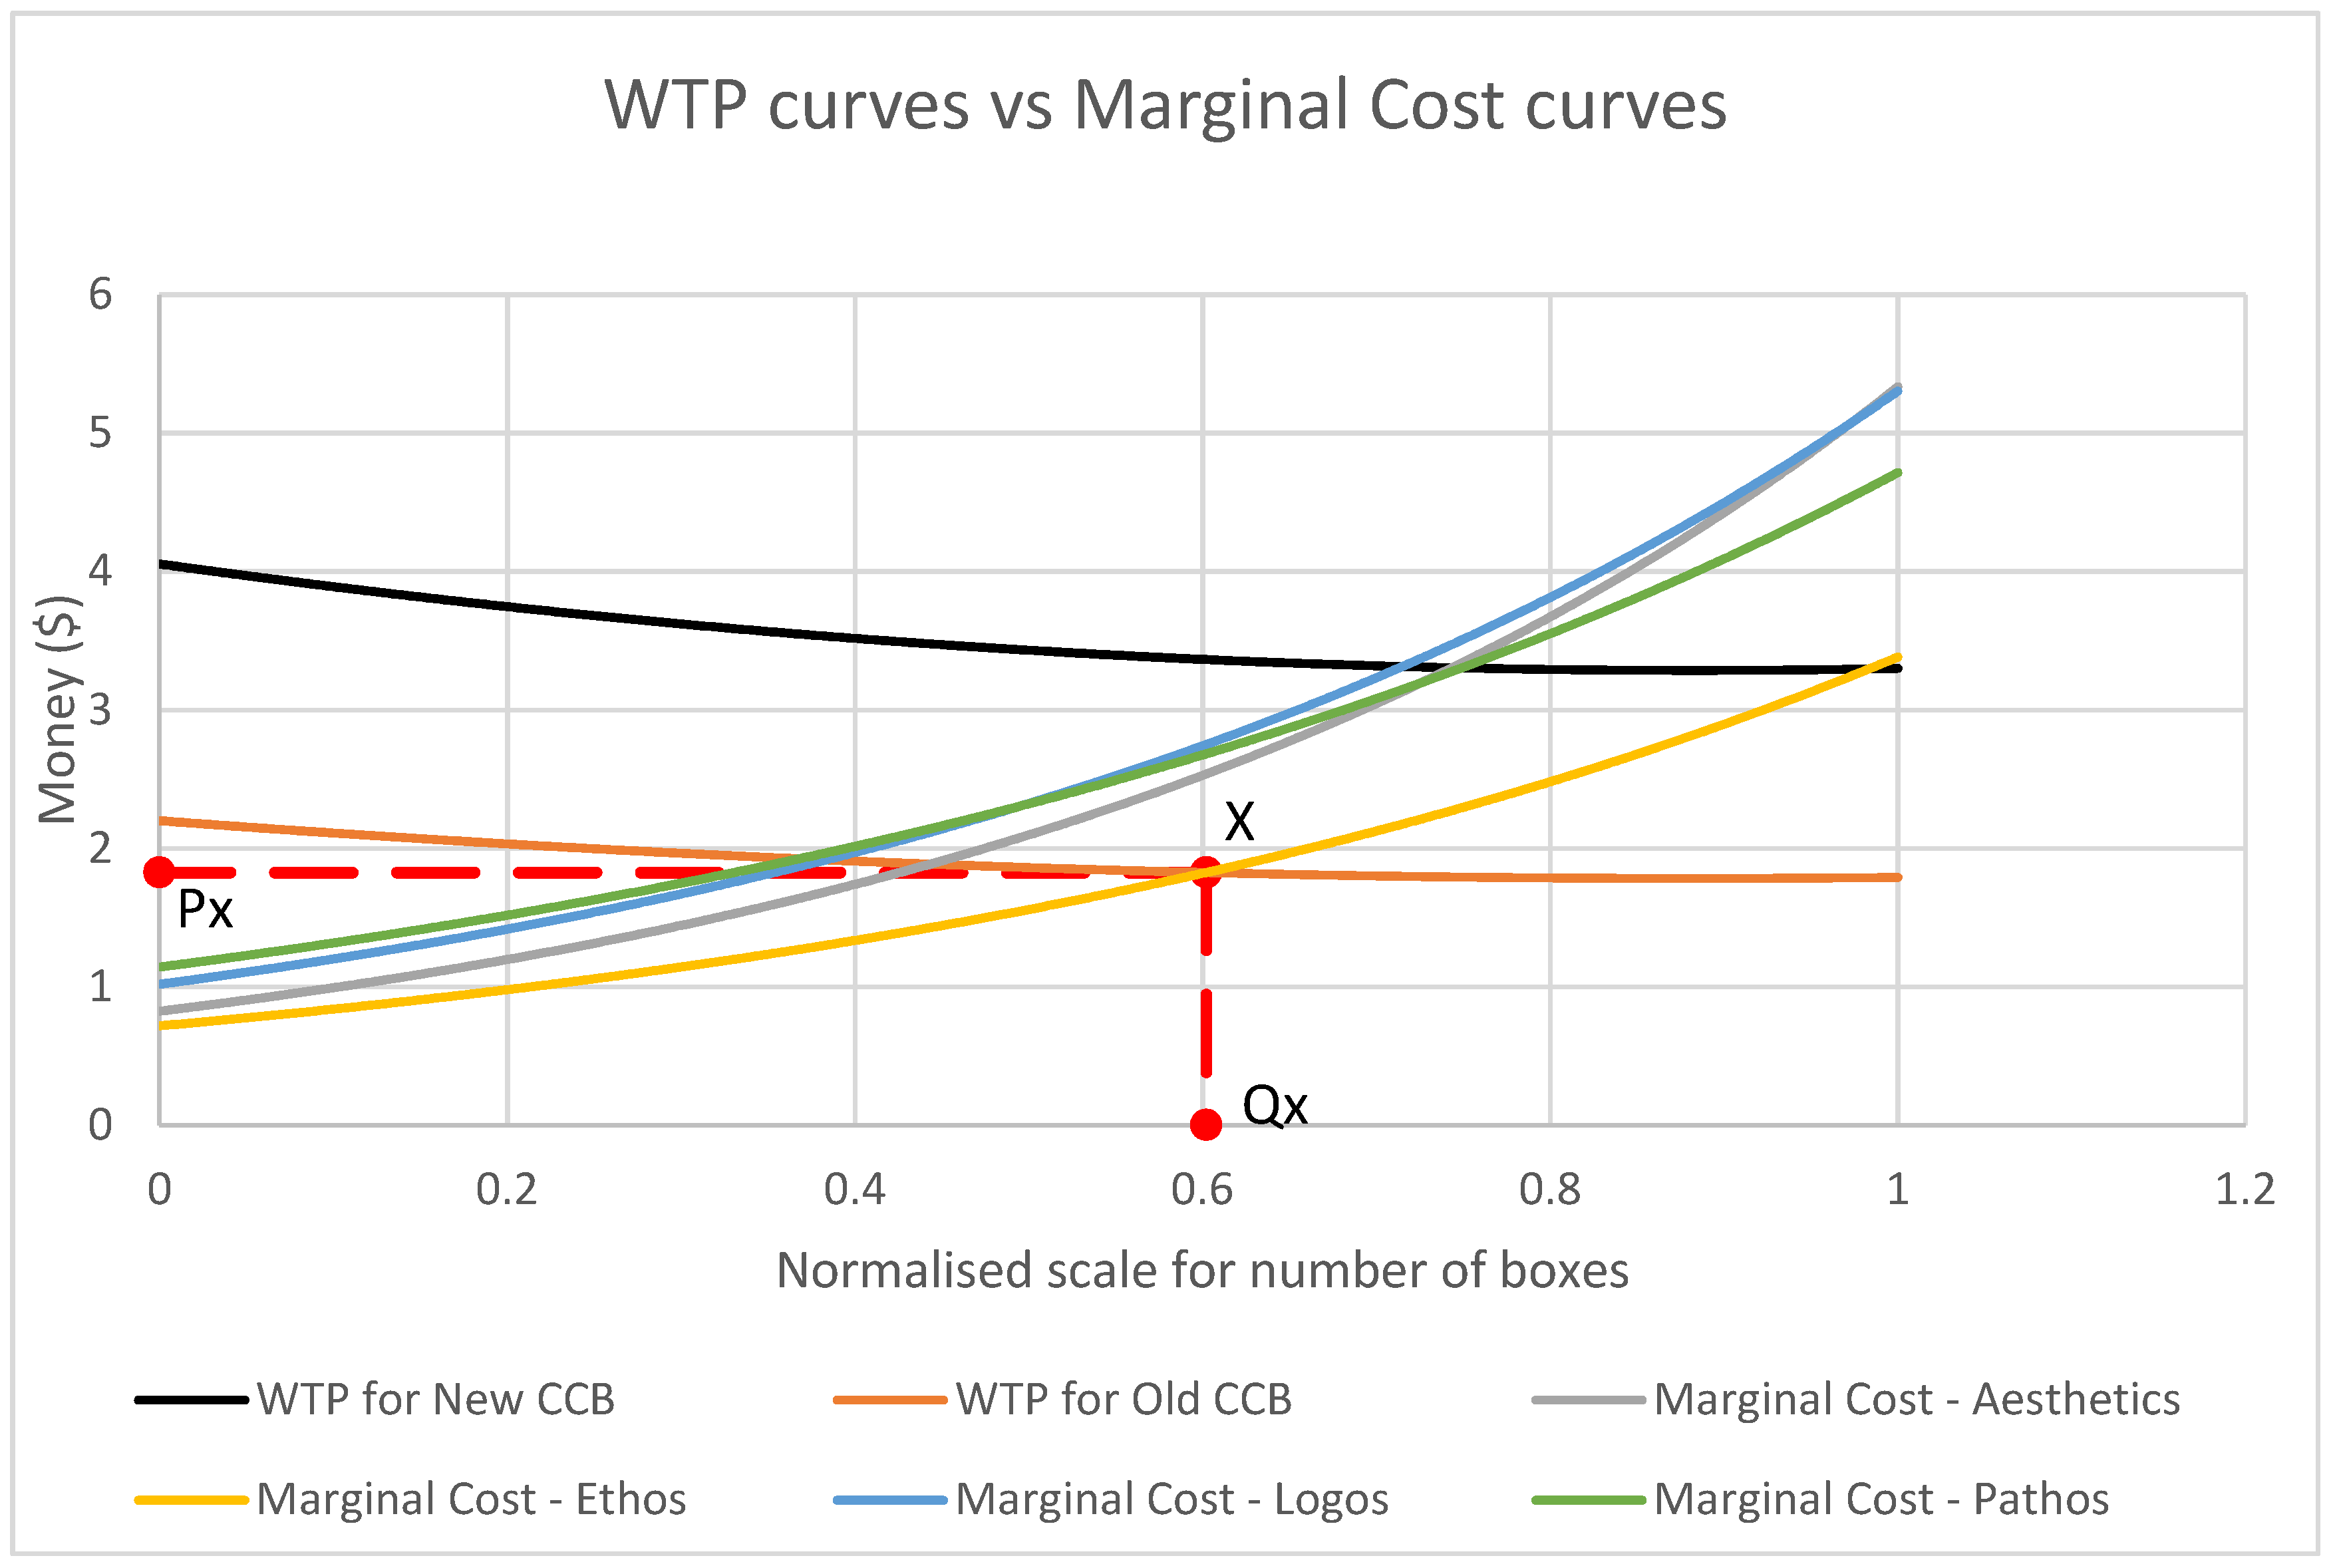
The marginal cost curves are evaluated from the database collected for the previous survey [
1]. In this survey, the authors asked 13 quantitative questions related to incentives with the help of specific persuasion techniques. Thus, a mean of 13 quantitative questions was taken for each of the 92 participants and categorized them with respect to persuasion techniques. Therefore, there are four marginal cost curves for aesthetics, ethos, logos, and pathos. To plot the WTP and marginal curves, the number of boxes (x-axis) is normalized from 0 to 1. The marginal cost curves show the relation of money to acquire more boxes via the “reuse” cycle. The willingness to pass curve shows the relation of money to consumers buying the number of boxes. Thus,
Figure 3 below shows WTP and marginal cost curves for CCB.
4. Discussion
OpenLCA software is a tool that uses different databases to get the baseline values and properties of the materials and processes. Thus, multiple databases listed under
Table 8 were combined to get more precise and specific data to model the CCB lifecycle. Once the model is complete, emission analysis is carried out with a custom impact method, as explained in the methodology section. There are two types of carbon emissions: fossil and biogenic carbon emissions. The only difference between both is their source of carbon emissions. For fossil carbon emission, the source is fossil fuels, and it exposes carbon to the atmosphere, which was trapped in geological reserves for many years. On the other hand, biogenic carbon emission is from woody biomass. The carbon emission from biomass is not trapped for a long time, as the carbon is absorbed from the atmosphere by the biomass. For this paper, authors have considered overall carbon emissions (excluding biogenic CO
2 emission). Thus, the results from OpenLCA software consist of the production of CCB ignoring the transportation of the material. As explained in the introduction, pulp-making operations use more energy and have more steps in order to convert the raw material into a paper sheet which explains the high carbon emission in pulp-making operations compared to converting operations. In terms of the transportation of materials and products in pulp-making operations and converting operations, the carbon emission in the converting phase is more than that of the pulp-making operation. One of the main reasons for this is the transportation of containerboard and corrugated sheet to the converting operations, as these are mainly done with the help of trucks. In addition, the transportation of corrugated products to use phase uses trucks as a primary mode of transportation which further adds to carbon emissions. The carbon emission in the use phase is the second highest contributor to the carbon emission of CCB over its lifecycle. One of the main reasons for the high carbon emission in the use phase is the transportation of packages by air. The transportation of CCB by air alone contributes to 93.7% of total carbon emissions in the use phase. From the EoL phase, it is important to notice that the emission factor for recycling waste is more than from the combustion of waste. Thus, 59.7% of the carbon emission in the EoL phase is due to landfilling of CCBs, and 39.4% is due to the recycling of CCBs. The carbon emission of the reuse phase is just 0.18% of all the other phases combined (the current CCB lifecycle). Thus, the current CCB lifecycle carbon emission is 4.46 kgCO
2-eq (single-use CCB). Although the carbon emission from CCB is higher compared to the other literature, as shown in
Table 15, it is important to note that the carbon emission values heavily depend upon the scope and assumptions of the LCA process. Another reason for higher carbon emissions could be because the authors have tried to be more compressive/exhaustive about all the possible carbon sources compared to other papers. The carbon emission for a reused box (used once and reused once) is 2.92 kgCO
2-eq per use. Thus overall, the reused CCB would save 1.54 kgCO
2-eq for the second time it is used as well, as it will save on the efforts of producing a new CCB.
The overall result from the benefit-cost analysis shows that for the assumed 100,000 uses of a CCB, the 50,000 reused CCBs would give a net profit of $83,103 with a benefit-cost ratio of 1.44. Although the benefit-cost analysis depends on the assumption made with respect to the operating cost of reuse and resell value of the reused box, sensitivity analysis is carried out to test the boundaries of this business model. The business can break even without making a profit if the cost of the new box is lowered to $1.17, if the reused box is sold at its maximum price of $3.66, or if the cost for motivation is increased to its highest limit of $3.46. Going above the limit specified will adversely affect the profitability of the reuse cycle. The marginal cost and WTP curves give a brief idea of the supply and demand of the CCBs. It can be observed from the graph that the marginal cost of ethos is significantly less than that of the marginal costs of aesthetics, logos, and pathos. Thus, motivating the general population with ethos will have more individuals participating in the reuse cycle at a lower cost. The WTP of the new CCB is included for reference, but the main output of the graph is the intersection point between the WTP of the old CCB and the marginal curves. The point of intersection between the marginal cost curve and the WTP curve is the economic efficiency point. The point of intersection “X” is where the cost of motivation for the used CCB is just exactly equal to the marginal value of the CCB. Thus, the quantity “Qx (0.6022)” at value ‘Px ($1.825)’ is efficient because it produces a balance between the marginal worth of CCB and what it costs to motivate the general population as measured in the marginal cost curve.
5. Conclusions
The purpose of this study was to introduce a new sustainable, feasible way of handling the disposal of CCBs. This paper calculates the carbon emission of CCBs for their current lifecycle, which is 4.46 kgCO2-eq. The paper also explains the proposed “reuse” phase, which allows individuals to use a single CCB multiple times. If the CCB is reused once, then it consists of two use phases which means the overall carbon emission for each use drops from 4.46 kgCO2-eq to 2.92 kgCO2-eq. This significantly decreases carbon emissions of CO2 by approximately 34.44%. Thus, by conducting a life cycle analysis, it can be concluded that “reuse” is more sustainable compared to recycling in terms of environmental gains.
It was observed that in terms of economic analysis, the benefit-cost analysis gave a benefit-cost ratio of 1.44 for base assumptions. The sensitivity analysis gave a brief idea of the boundary conditions for this model to keep the benefit-cost ratio above or equal to one. Marginal cost versus willingness-to-pay curves indicated that out of the four available persuasion techniques, the use of ethos for incentivization gave more boxes to be reused at the lowest cost. This further supports the recommendation of a previous paper [
1] to use ethos to motivate the general population. Thus, it can be concluded from the benefit-cost analysis and cost curves that “reuse” is more sustainable compared to recycling in terms of economic feasibility. The approach that authors took in this research paper—simultaneously including analytics, WTP and marginal cost curves, and LCA—suggests a model repurposable for use in other products and processes where one can incentivize the general population to take pressure off of the extraction industry as a part of the business. This will allow businesses to take out or lower the extraction needs from similar industries, which would promote sustainable efforts.
The future scope and prospects of this research include how to assess other sustainable efforts for their feasibility across the whole lifecycle and how to evaluate the monetary aspect of the sustainable effort with the help of economics. Although it is well-known that CCBs can be used multiple times in an industrial setting [
38,
39], it is also important to explore the feasibility and practicality of the implementation of the proposed reuse process. There is a strong possibility of the use of this framework to evaluate other sustainable efforts, such as promoting the use of sustainable cars.
Author Contributions
Conceptualization, H.K. and S.S.; methodology, H.K. and S.S.; formal analysis, H.K. and S.S.; writing—original draft preparation, H.K.; writing—review and editing, S.S.; visualization, H.K.; supervision, S.S.; funding acquisition, S.S. All authors have read and agreed to the published version of the manuscript.
Funding
This research was funded by Colorado State University’s SoGES (the School of Global Environmental Sustainability), the Global Challenges Research Team 4 Grant, and the APC was funded by Colorado State University’s Systems Engineering Department.
Institutional Review Board Statement
Not applicable.
Informed Consent Statement
Not applicable.
Data Availability Statement
The data on the list of impact categories and their GWP values is available upon request.
Acknowledgments
We wish to show our appreciation to Angie Chromiak for guiding us through the IRB application. We would also like to thank the following people for helping us with the distribution of surveys and administrative tasks: Ingrid Bridge, Chrissy Charny, Debra Dandaneau, and Mary Gomez.
Conflicts of Interest
The authors declare no conflict of interest.
References
- Ketkale, H.; Simske, S. Encouraging Reuse in the Corrugated Packaging Industry Using Persuasion and Operant Conditioning. Sustainability 2022, 14, 6454. [Google Scholar] [CrossRef]
- ABB Group. All of Those Boxes. Available online: https://new.abb.com/docs/librariesprovider15/default-document-library/no5_boxes_oct14.pdf?sfvrsn=2 (accessed on 22 December 2022).
- Recycling.com. Why Cardboard Recycling Is Crucial to Protect the Earth. Available online: https://www.ocrecycling.com/cardboard-recycling-crucial (accessed on 22 December 2022).
- Corrugated Packaging Alliance. Corrugated Packaging—A Recycling Success Story; Corrugated Packaging Alliance: Elk Grove Village, IL, USA, 2016. [Google Scholar]
- Fibre Box Association. Corrugated Packaging—An Extraordinary Recycling Success Story. Available online: http://www.corrugated.org/wp-content/uploads/2019/12/Recycling_White_Paper_2019_vfinal.pdf (accessed on 22 December 2022).
- Curran, M. LIFE-CYCLE ASSESSMENT; Encyclopedia of Ecology; Subject Area: Human, Ecology; Jorgensen, S.E., Fath, B., Eds.; Elsevier BV: Amsterdam, The Netherlands, 2008; Chapter 13; pp. 2168–2174. ISBN 978008045405. [Google Scholar]
- National Council for Air and Stream Improvement, Inc. (NCASI). 2014 Life Cycle Assessment of U.S. Average Corrugated Product—Final Report; Report prepared for the Corrugated Product Alliance (CPA); National Council for Air and Stream Improvement, Inc.: Cary, NC, USA, 2017. [Google Scholar]
- United States Census Bureau: CF1700P2|CFS Preliminary Report: Shipment Characteristics by Total Modal Activity: 2017. Available online: https://data.census.gov/table?q=cf1700p2&hidePreview=true&tid=CFSPRELIM2017.CF1700P2 (accessed on 22 December 2022).
- United States Environmental Protection Agency: Paper and Paperboard Containers and Packaging. Available online: https://www.epa.gov/facts-and-figures-about-materials-waste-and-recycling/containers-and-packaging-product-specific#PaperandPaperboardC&P (accessed on 22 December 2022).
- U.S. Energy Information Administration: U.S. utility-scale electricity generation by source, amount, and share of total in 2021. Available online: https://www.eia.gov/tools/faqs/faq.php?id=427&t=3#:~:text=In%202021%2C%20about%204%2C108%20billion,facilities%20in%20the%20United%20States.&text=About%2061%25%20of%20this%20electricity,%2C%20petroleum%2C%20and%20other%20gases (accessed on 22 December 2022).
- Stocker, T.F.; Qin, D.; Plattner, G.K.; Tignor, M.; Allen, S.K.; Boschung, J.; Nauels, A.; Xia, Y.; Bex, V.; Midgley, P.M. (Eds.) Climate Change 2013: The Physical Science Basis. Contribution of Working Group I to the Fifth Assessment Report of the Intergovernmental Panel on Climate Change; Cambridge University Press: Cambridge, UK; New York, NY, USA, 2013; p. 1535. [Google Scholar]
- Field, B.; Field, M. Environmental Economics an Introduction, 8th ed.; McGraw-Hill: New York, NY, USA, 2021. [Google Scholar]
- Carey, K. Cost Function Estimates. In Encyclopedia of Health Economics; Culyer, A., Ed.; Elsevier: Amsterdam, The Netherlands, 2014; pp. 121–125. [Google Scholar]
- OpenLca Nexus: AGRIBALYSE. Available online: https://nexus.openlca.org/database/Agribalyse (accessed on 22 December 2022).
- OpenLca Nexus: BIOENERGIEDAT. Available online: https://nexus.openlca.org/database/bioenergiedat (accessed on 22 December 2022).
- OpenLca Nexus: Ecoinvent. Available online: https://nexus.openlca.org/database/ecoinvent (accessed on 22 December 2022).
- OpenLca Nexus: PEF Database. Available online: https://nexus.openlca.org/database/Environmental%20Footprints (accessed on 22 December 2022).
- OpenLca Nexus: JRC European Commission. Available online: https://nexus.openlca.org/database/ELCD (accessed on 22 December 2022).
- OpenLca Nexus: Exiobase. Available online: https://nexus.openlca.org/database/exiobase (accessed on 22 December 2022).
- OpenLca Nexus: NEEDS. Available online: https://nexus.openlca.org/database/NEEDS (accessed on 22 December 2022).
- OpenLca Nexus: OpenLca. Available online: https://nexus.openlca.org/database/openLCA%20LCIA%20methods (accessed on 22 December 2022).
- OpenLca Nexus: The Evah Institute. Available online: https://nexus.openlca.org/database/OzLCI2019 (accessed on 22 December 2022).
- OpenLca Nexus: Worldsteel Association. Available online: https://nexus.openlca.org/database/worldsteel (accessed on 22 December 2022).
- United States Environmental Protection Agency: GHG Emission Factors Hub. Available online: https://www.epa.gov/climateleadership/ghg-emission-factors-hub (accessed on 22 December 2022).
- United States Environmental Protection Agency: Waste Transfer Stations: A Manual for Decision-Making. Available online: https://www.epa.gov/sites/default/files/2016-03/documents/r02002.pdf (accessed on 22 December 2022).
- Dominic, C.A.; Östlund, S.; Buffington, J.; Masoud, M.M. Towards a conceptual sustainable packaging development model: A corrugated box case study. Packag. Technol. Sci. 2015, 28, 397–413. [Google Scholar] [CrossRef]
- Su, Y.; Duan, H.; Wang, Z.; Song, G.; Kang, P.; Chen, D. Characterizing the environmental impact of packaging materials for express delivery via life cycle assessment. J. Clean. Prod. 2020, 274, 122961. [Google Scholar] [CrossRef]
- Koskela, S.; Dahlbo, H.; Judl, J.; Korhonen, M.R.; Niininen, M. Reusable plastic crate or recyclable cardboard box? A comparison of two delivery systems. J. Clean. Prod. 2014, 69, 83–90. [Google Scholar] [CrossRef]
- ULINE: 18 × 18 × 18” Corrugated Boxes. Available online: https://www.uline.com/Product/Detail/S-4185/Corrugated-Boxes-200-Test/18-x-18-x-18-Corrugated-Boxes (accessed on 24 December 2022).
- Ackerman, F.; Stanton, E.A. Climate risks and carbon prices: Revising the social cost of carbon. Economics 2012, 6, 1–25. [Google Scholar] [CrossRef] [Green Version]
- ULINE: 20 x 18 x 16” Corrugated Boxes. Available online: https://www.uline.com/Product/Detail/S-4795/Corrugated-Boxes-200-Test/20-x-18-x-16-Corrugated-Boxes (accessed on 24 December 2022).
- ULINE: 20 x 16 x 20” Corrugated Boxes. Available online: https://www.uline.com/Product/Detail/S-23993/Corrugated-Boxes-200-Test/20-x-16-x-20-Corrugated-Boxes (accessed on 24 December 2022).
- ULINE: 20 x 12 x 12” Corrugated Boxes. Available online: https://www.uline.com/Product/Detail/S-12603/Heavy-Duty-Boxes/20-x-12-x-12-275-lb-Double-Wall-Corrugated-Boxes (accessed on 24 December 2022).
- ULINE: 19 x 19 x 19” Corrugated Boxes. Available online: https://www.uline.com/Product/Detail/S-4860/Corrugated-Boxes-200-Test/19-x-19-x-19-Corrugated-Boxes (accessed on 24 December 2022).
- ULINE: 18 x 18 x 8” Corrugated Boxes. Available online: https://www.uline.com/Product/Detail/S-14232/Heavy-Duty-Boxes/18-x-18-x-8-275-lb-Double-Wall-Corrugated-Boxes (accessed on 24 December 2022).
- ULINE: 18 x 18 x 12” Corrugated Boxes. Available online: https://www.uline.com/Product/Detail/S-4399/Corrugated-Boxes-200-Test/18-x-18-x-12-Corrugated-Boxes (accessed on 24 December 2022).
- ULINE: 20 x 18 x 18” Corrugated Boxes. Available online: https://www.uline.com/Product/Detail/S-14286/Corrugated-Boxes-200-Test/20-x-18-x-18-Corrugated-Boxes (accessed on 24 December 2022).
- Box LatchTM. Products Featured in London Trade Show-Box Latch Products. Available online: https://www.boxlatch.com/box-latch-products-featured-london-trade-show/ (accessed on 24 December 2022).
- Box Latch 10+ Box Re-Use|Closed-Loop Production Process | Wisconsin Plastics, Inc. Available online: https://www.youtube.com/watch?v=FkjqiLX39yg (accessed on 24 December 2022).
Figure 1.
Inputs and outputs of pulp and paper-making operation.
Figure 1.
Inputs and outputs of pulp and paper-making operation.
Figure 2.
Inputs and outputs of converting operation.
Figure 2.
Inputs and outputs of converting operation.
Figure 3.
Cost curves: WTP curve vs. Marginal cost curve.
Figure 3.
Cost curves: WTP curve vs. Marginal cost curve.
Table 1.
Input/Output material and energy for production on containerboard [
7].
Table 1.
Input/Output material and energy for production on containerboard [
7].
| Input/Output | Quantity | Unit |
|---|
| INPUTS |
| Resources |
| Water intake | 30.9 | kg |
| Fiber raw material |
| Hardwood logs | 0.14 | kg |
| Softwood logs | 0.58 | kg |
| Purchased hardwood chips | 0.10 | kg |
| Purchased softwood chips | 0.32 | kg |
| Recovered fiber | 0.57 | kg |
| Chemicals |
| Sodium hydroxide (Caustic) | 7.6 × 10⁻³ | kg |
| Sulfuric Acid | 1.2 × 10⁻² | kg |
| Aluminum Sulfate | 2.7 × 10⁻³ | kg |
| Starch | 5.4 × 10⁻³ | kg |
| Lime | 9.0 × 10⁻³ | kg |
| Soda | 3.6 × 10⁻³ | kg |
| Pitch dispersant | 6.0 × 10⁻⁵ | kg |
| Strength agents | 7.0 × 10⁻³ | kg |
| Other fillers | 5.5 × 10⁻³ | kg |
| Energy |
| Electricity | 8.55 | MJ |
| Purchased power | 1.66 | MJ |
| Purchased steam | 0.77 | MJ |
| OUTPUTS |
| Products and co-products |
| Containerboard | 1.10 | kg |
| Turpentine and tall oil | 0.017 | kg |
| Sold power | 0.07 | kWh |
| Emission to air | | |
| Nitrogen oxides (NOx) | 1.56 × 10⁻³ | kg |
| Sulfur oxides (Sox) | 1.15 × 10⁻³ | kg |
| Total reduced sulfur (TRS), as H2S | 7.71 × 10⁻⁵ | kg |
| Particulates | 6.11 × 10⁻⁴ | kg |
| Carbon monoxide (CO) | 2.57 × 10⁻⁴ | kg |
| Carbon dioxide (CO2), biogenic | 1.23 | kg |
| Carbon dioxide (CO2), fossil | 0.331 | kg |
| Methane (CH4), biogenic | 1.22 × 10⁻³ | kg |
| Methane (CH4), fossil | 1.3 × 10⁻⁵ | kg |
| Nitrous oxide (N2O) | 5.01 × 10⁻⁵ | kg |
| Evaporated water | 3.67 | kg |
| Emissions to water |
| Process effluent | 26.8 | kg |
| Cooling water discharges | 1.82 | kg |
| Adsorbable Organic Halides (AOX) | 4.21 × 10⁻⁶ | kg |
| Biochemical oxygen demand (BOD5) | 9.73 × 10⁻⁴ | kg |
| Total suspended solids (TSS) | 1.34 × 10⁻³ | kg |
| Total nitrogen | 2.04 × 10⁻⁴ | kg |
| Total phosphorus | 3.45 × 10⁻⁵ | kg |
| Residuals |
| Wastewater treatment plant residuals | 0.036 | kg |
| Wood ashes | 0.023 | kg |
| Coal ashes | 0.006 | kg |
| Other solid wastes | 0.049 | kg |
Table 2.
Input/Output material and energy for production on corrugated boxes.
Table 2.
Input/Output material and energy for production on corrugated boxes.
| Input/Output | Quantity | Unit |
|---|
| INPUTS |
| Resources |
| Water intake | 0.457 | kg |
| Fiber raw material |
| Containerboard | 1.10 | kg |
| Chemicals |
| Starch | 2.00 × 10⁻² | kg |
| Wax | 3.76 × 10⁻³ | kg |
| Ink | 1.30 × 10⁻³ | kg |
| Adhesive | 1.61 × 10⁻³ | kg |
| Coating | 5.13 × 10⁻⁴ | kg |
| Borax | 3.03 × 10⁻⁴ | kg |
| Resin | 3.38 × 10⁻⁴ | kg |
| Sodium hydroxide (Caustic) | 5.51 × 10⁻⁴ | kg |
| Energy |
| Electricity | 1.40 | MJ |
| Purchased power | 0.142 | MJ |
| Purchased steam | 2.41 × 10⁻³ | MJ |
| OUTPUTS |
| Products and co-products |
| Corrugated cardboard box | 1.0 | kg |
| Emission to air | | |
| Nitrogen oxides (NOx) | 5.09 × 10⁻⁵ | kg |
| Sulfur oxides (Sox) | 1.03 × 10⁻⁶ | kg |
| Particulates | 4.37 × 10⁻⁵ | kg |
| Carbon monoxide (CO) | 5.44 × 10⁻⁵ | kg |
| Carbon dioxide (CO2), fossil | 8.51 × 10⁻² | kg |
| Methane (CH4), fossil | 1.46 × 10⁻⁶ | kg |
| Nitrous oxide (N2O) | 2.37 × 10⁻⁷ | kg |
| Non-methane VOCs | 1.39 × 10⁻⁴ | kg |
| Evaporated water | 0.215 | kg |
| Emissions to water |
| Effluent, direct | 0.0133 | kg |
| Effluent, indirect and other | 0.252 | kg |
| BOD, direct | 4.53 × 10⁻⁶ | kg |
| TSS, direct | 2.52 × 10⁻⁶ | kg |
| Residuals |
| Converting losses to recycling | 0.125 | kg |
| Other solid wastes | 0.049 | kg |
Table 3.
Data from 2017 CFS preliminary report: Shipment characteristics by total modal activity.
Table 3.
Data from 2017 CFS preliminary report: Shipment characteristics by total modal activity.
| Mode of Transport | Year | Ton-Miles (Millions) | Ton-Miles (Percent of Total) | Average Miles per Shipment |
|---|
| Truck | 2017 | 1,347,240 | 43 | 186 |
| Rail | 2017 | 1,460,158 | 46.6 | 969 |
| Water | 2017 | 216,794 | 6.9 | 439 |
| Air | 2017 | 6560 | 0.2 | 1006 |
| Other | 2017 | 27,189 | 0.8 | 886 |
Table 4.
Total paper and paperboard containers and packaging in MSW by weight (in thousands of U.S. tons).
Table 4.
Total paper and paperboard containers and packaging in MSW by weight (in thousands of U.S. tons).
| Management Pathway | 2000 | 2005 | 2010 | 2015 | 2017 | 2018 |
|---|
| Generation | 39,940 | 39,640 | 37,680 | 39,920 | 41,060 | 41,900 |
| Recycled | 21,040 | 23,610 | 26,850 | 31,200 | 30,080 | 33,890 |
| Composted | - | - | - | - | - | - |
| Combustion with Energy Recovery | 3670 | 2920 | 1920 | 1710 | 2160 | 1570 |
| Landfilled | 15,230 | 13,110 | 8910 | 7010 | 8820 | 6440 |
Table 5.
U.S. utility-scale electricity generation by source, amount, and share of the total in 2021.
Table 5.
U.S. utility-scale electricity generation by source, amount, and share of the total in 2021.
| Energy Source | Billion kWh | Share of Total |
|---|
| Total—all sources | 4108 | |
| Fossil fuels (total) | 2508 | 61.0% |
| Natural gas | 1579 | 38.4% |
| Coal | 898 | 21.9% |
| Petroleum (total) | 19 | 0.5% |
| Petroleum liquids | 12 | 0.3% |
| Petroleum coke | 8 | 0.2% |
| Other gases | 11 | 0.3% |
| Nuclear | 778 | 18.9% |
| Renewables (total) | 815 | 19.8% |
| Wind | 378 | 9.2% |
| Hydropower | 252 | 6.1% |
| Solar (total) | 115 | 2.8% |
| Photovoltaic | 112 | 2.7% |
| Solar thermal | 3 | 0.1% |
| Biomass (total) | 54 | 1.3% |
| Wood | 36 | 0.9% |
| Landfill gas | 9 | 0.2% |
| Municipal solid waste (biogenic) | 6 | 0.1% |
| Other biomass waste | 2 | 0.1% |
| Geothermal | 16 | 0.4% |
| Other sources | 12 | 0.3% |
Table 6.
Electricity modeling in OpenLCA by source, share, and values.
Table 6.
Electricity modeling in OpenLCA by source, share, and values.
| Energy Source | Share of Total | Pulp-Making Operations (10.98 MJ) | Converting (1.544 MJ) |
|---|
| Coal | 21.90% | 2.24 | 0.42 |
| Petroleum | 0.50% | 0.05 | 0.01 |
| Natural gas | 38.40% | 3.92 | 0.73 |
| Nuclear | 18.90% | 1.93 | 0.36 |
| Wind | 9.20% | 0.94 | 0.18 |
| Hydropower | 6.10% | 0.62 | 0.12 |
| Biomass | 1.30% | 0.13 | 0.02 |
| Average Electricity mix | 3.80% | 0.39 | 0.07 |
Table 7.
Transportation data for distance, mode of transportation, and its share.
Table 7.
Transportation data for distance, mode of transportation, and its share.
| Material | Truck | Train | Boat, Barge | Boat, Ocean |
|---|
| % | km | % | km | % | km | % | km |
|---|
| Wood logs to Pulp & Paper mills | 98.4 | 159 | 1.6 | 1577 | | | | |
| Wood chips to Pulp & Paper mills | 94.5 | 299 | 5.5 | 1674 | | | | |
| Recovered fiber to pulp and paper mills | 85.4 | 241 | 12.6 | 505 | 2.0 | 822 | | |
| Pulp to pulp and paper mills | 80.1 | 262 | 19.8 | 1511 | | | | |
| Chemicals | 58.1 | 217 | 28.0 | 1333 | 12.8 | 674 | 1.0 | 2992 |
| Containerboard to converting | 80.1 | 262 | 19.8 | 1511 | | | | |
| Corrugated sheets | 80.1 | 262 | 19.8 | 1511 | | | | |
| Corrugated product to use | 95.7 | 283 | 4.3 | 2446 | | | | |
Table 8.
List of databases that were combined in OpenLCA.
Table 8.
List of databases that were combined in OpenLCA.
| Database Name | Source |
|---|
| Agribalyse v3.0.1 | French Agency for Ecological Transition [14] |
| BioEnergieDat | German BioEnergieDat Project [15] |
| Ecoinvent v3.7 | Ecoinvent [16] |
| Environmental Footprint v2.0 | European Commission’s Single Market for Green Products initiative [17] |
| ELCD v3.2 | European reference of Life Cycle Database of the Joint Research Center [18] |
| Exiobase v3.4 | Multi-regional Environmentally Extended Supply and Use/Input-Output database (MR EE SUT/IO) [19] |
| NEEDS | New Energy Externalities Developments for Sustainability [20] |
| OpenLCA v2.1.3 | OpenLCA [21] |
| OzLCI 2019 | The Evah Institute [22] |
| Worldsteel_2020 (EF 3.0) | The World Steel Association [23] |
Table 9.
OpenLCA results for pulp-making and converting operations.
Table 9.
OpenLCA results for pulp-making and converting operations.
| Emission Type | Pulp-Making
(kgCO2-eq) | Converting
(kgCO2-eq) |
|---|
| Fossil | 2.03313 | 0.36044 |
| Biogenic (GWP 20 years) | 1.33393 | - |
| Biogenic (GWP 100 years) | 1.26464 | - |
Table 10.
Carbon emission from transportation in pulp-making operation.
Table 10.
Carbon emission from transportation in pulp-making operation.
| Material | Mode of Transport | Percentage Used | Distance (km) | Kg × Km | Emission Factor (kgCO2-eq/kg × km) | CO2 Emission (kgCO2-eq) |
|---|
| Wood log to P&P mill (0.72 kg) | Truck | 98% | 159 | 112.6483 | 0.00037 | 0.04217 |
| Train | 2% | 1577 | 18.1670 | 0.00004 | 0.00071 |
| Wood chips to P&P mill (0.42 kg) | Truck | 95% | 299 | 118.6731 | 0.00037 | 0.04442 |
| Train | 6% | 1674 | 38.6694 | 0.00004 | 0.00151 |
| Recovered fiber (0.57 kg) | Truck | 85% | 241 | 117.3140 | 0.00037 | 0.04391 |
| Train | 13% | 505 | 36.2691 | 0.00004 | 0.00142 |
| Boat, Barge | 2% | 822 | 9.3708 | 0.00007 | 0.00068 |
| Pulp to paper mill (0.005 kg) | Truck | 80% | 262 | 1.0493 | 0.00037 | 0.00039 |
| Train | 20% | 1511 | 1.4959 | 0.00004 | 0.00006 |
| Chemicals (0.04656 kg) | Truck | 58% | 217 | 5.8701 | 0.00037 | 0.00220 |
| Train | 28% | 1333 | 17.3781 | 0.00004 | 0.00068 |
| Boat, Barge | 13% | 674 | 4.0168 | 0.00007 | 0.00029 |
| Boat, Ocean | 1% | 2992 | 1.3931 | 0.00007 | 0.00010 |
| Total Carbon emission in kgCO2-eq | 0.1385 |
Table 11.
Carbon emission from transportation in converting operation.
Table 11.
Carbon emission from transportation in converting operation.
| Material | Mode of Transport | Percentage Used | Distance (km) | Kg × Km | Emission factor (kgCO2-eq/kg × km) | CO2 Emission (kgCO2-eq) |
|---|
| Chemicals (0.0283 kg) | Truck | 58% | 217.0000 | 3.5774 | 0.00037 | 0.00134 |
| Train | 28% | 1333.0000 | 10.5907 | 0.00004 | 0.00041 |
| Boat, Barge | 13% | 674.0000 | 2.4480 | 0.00007 | 0.00018 |
| Boat, Ocean | 1% | 2992.0000 | 0.8490 | 0.00007 | 0.00006 |
| Containerboard (1.1 kg) | Truck | 80% | 262.0000 | 230.8482 | 0.00037 | 0.08641 |
| Train | 20% | 1511.0000 | 329.0958 | 0.00004 | 0.01284 |
| Corrugated sheets (1 kg) | Truck | 80% | 262.0000 | 209.8620 | 0.00037 | 0.07855 |
| Train | 20% | 1511.0000 | 299.1780 | 0.00004 | 0.01168 |
| Corrugated product to use (1 kg) | Truck | 96% | 283.0000 | 270.8310 | 0.00037 | 0.10138 |
| Train | 4% | 2446.0000 | 105.1780 | 0.00004 | 0.00410 |
| Total Carbon emission in kgCO2-eq | 0.2970 |
Table 12.
Carbon emission in the use phase for CCB.
Table 12.
Carbon emission in the use phase for CCB.
| Mode of Transportation | Average Distance Traveled (mile) | Emission Factor in kgCO2-eq/kg-Mile | Emission (kgCO2-eq) |
|---|
| Truck | 186 | 0.00023 | 0.0433 |
| Rail | 969 | 0.00002 | 0.0235 |
| Air | 1006 | 0.00128 | 1.2919 |
| Water | 439 | 0.00005 | 0.0198 |
| Total Carbon emission in kgCO2-eq | 1.3785 |
Table 13.
Emission factors for CCB w.r.t waste management method.
Table 13.
Emission factors for CCB w.r.t waste management method.
| | Emission Factor in Metric Tons CO2-eq/Short Ton Material |
|---|
| Material | Recycled | Landfilled | Combusted |
|---|
| Corrugated Container | 0.11 | 0.90 | 0.05 |
Table 14.
Overall carbon emission of CCB over its lifecycle with all the phases.
Table 14.
Overall carbon emission of CCB over its lifecycle with all the phases.
| Emission Type | Pulp-Making Operation | Converting Operation | Use Phase | Reuse Phase | EoL Phase |
|---|
| Fossil kgCO2-eq | 2.17163 | 0.65744 | 1.3785 | 0.00805 | 0.2492 |
| Biogenic KgCO2-eq (GWP 20 years) | 1.33393 | - | - | - | - |
| Biogenic KgCO2-eq (GWP 100 years) | 1.26464 | - | - | - | - |
Table 15.
Comparison of carbon emission with the other literature.
Table 15.
Comparison of carbon emission with the other literature.
| Source | Carbon Emission (kgCO2-eq) | Functional Unit (kg) | Carbon Emission per kg of CCB (kgCO2-eq/kg) |
|---|
| [26] | 9.9 | 4 | 2.475 |
| [27] | 3.046 | 1 | 3.046 |
| [28] | 0.876 | 0.546 | 1.60 |
| This paper | 4.4567 | 1 | 4.4567 |
Table 16.
Benefit-cost analysis for CCB.
Table 16.
Benefit-cost analysis for CCB.
| Base costs | New box | $2.83 |
| Used box | $2.00 |
| Cost for motivation | $1.80 |
| Benefit | Social cost (1.5351 × 0.9 × 100,000 × 1.01) | $131,603.27 |
| The cost saved by reusing (2.83 × 50,000) | $141,500.00 |
| Total benefit | $273,103.27 |
| Cost | Motivation cost (1.80 × 50,000) | $90,000.00 |
| Resell used boxes (operating costs plus profits) (2 × 50,000) | $100,000.00 |
| Total cost | $190,000.00 |
| | Net Benefit (Total benefit − Total cost) | $83,103.27 |
| | Benefit-Cost ratio (Total benefit/Total cost) | $1.44 |
Table 17.
Benefit-cost analysis with the lowest cost of a new box.
Table 17.
Benefit-cost analysis with the lowest cost of a new box.
| Base costs | New box | $1.17 |
| Used box | $2.00 |
| Cost for motivation | $1.80 |
| Benefit | Social cost (1.5351 × 0.9 × 100,000 × 1.01) | $131,603.27 |
| The cost saved by reusing (1.17 × 50,000) | $58,500.00 |
| Total benefit | $190,103.27 |
| Cost | Motivation cost (1.80 × 50,000) | $90,000.00 |
| Resell used boxes (operating costs plus profits) (2 × 50,000) | $100,000.00 |
| Total cost | $190,000.00 |
| | Net Benefit (Total benefit − Total cost) | $103.27 |
| | Benefit-Cost ratio (Total benefit/Total cost) | 1.00 |
Table 18.
Benefit-cost analysis with the highest cost of a used box.
Table 18.
Benefit-cost analysis with the highest cost of a used box.
| Base costs | New box | $2.83 |
| Used box | $3.66 |
| Cost for motivation | $1.80 |
| Benefit | Social cost (1.5351 × 0.9 × 100,000 × 1.01) | $131,603.27 |
| The cost saved by reusing (2.83 × 50,000) | $141,500.00 |
| Total benefit | $273,103.27 |
| Cost | Motivation cost (1.80 × 50,000) | $90,000.00 |
| Resell used boxes (operating costs plus profits) (3.66 × 50,000) | $183,000.00 |
| Total cost | $273,000.00 |
| | Net Benefit (Total benefit − Total cost) | $103.27 |
| | Benefit-Cost ratio (Total benefit/Total cost) | 1.00 |
Table 19.
Benefit-cost analysis with the highest cost for motivation.
Table 19.
Benefit-cost analysis with the highest cost for motivation.
| Base costs | New box | $2.83 |
| Used box | $2.00 |
| Cost for motivation | $3.46 |
| Benefit | Social cost (1.5351 × 0.9 × 100,000 × 1.01) | $131,603.27 |
| The cost saved by reusing (2.83 × 50,000) | $141,500.00 |
| Total benefit | $273,103.27 |
| Cost | Motivation cost (3.46 × 50,000) | $173,000.00 |
| Resell used boxes (operating costs plus profits) (2 × 50,000) | $100,000.00 |
| Total cost | $273,000.00 |
| | Net Benefit (Total benefit − Total cost) | $103.27 |
| | Benefit-Cost ratio (Total benefit/Total cost) | 1.00 |
Table 20.
Willingness-to-pay for a new CCB.
Table 20.
Willingness-to-pay for a new CCB.
| | | Price per Box ($) |
|---|
| Dimension of CCB | Weight (kg) | 25 | 100 | 250 | 500 | 1000 |
|---|
| 20 × 18 × 16″ [31] | 0.98 | 4.26 | 3.97 | 3.73 | 3.52 | 3.27 |
| 20 × 16 × 20″ [32] | 1.01 | 4.25 | 4.04 | 3.8 | 3.71 | 3.43 |
| 20 × 12 × 12″ [33] | 0.98 | 4.83 | 4.39 | 3.97 | 3.64 | 3.38 |
| 19 × 19 × 19″ [34] | 0.95 | 4.36 | 3.97 | 3.86 | 3.52 | 3.29 |
| 18 × 18 × 8″ [35] | 1.09 | 5.52 | 5.16 | 4.79 | 4.49 | 4.3 |
| 18 × 18 × 12″ [36] | 0.94 | 2.45 | 2.45 | 2.45 | 2.45 | 2.45 |
| 18 × 18 × 18″ [29] | 1.01 | 2.83 | 2.83 | 2.83 | 2.83 | 2.83 |
| 20 × 18 × 18″ [37] | 1.07 | 4.42 | 4.15 | 3.91 | 3.72 | 3.39 |
| Average | 1.00 | 4.115 | 3.87 | 3.6675 | 3.485 | 3.2925 |
Table 21.
Willingness-to-pay for old CCB.
Table 21.
Willingness-to-pay for old CCB.
| | | Price per Box ($) |
|---|
| Weight (kg) | 25 | 100 | 250 | 500 | 1000 |
|---|
| Old CCBs | 1.00 | 2.23 | 2.10 | 1.99 | 1.89 | 1.79 |
| Disclaimer/Publisher’s Note: The statements, opinions and data contained in all publications are solely those of the individual author(s) and contributor(s) and not of MDPI and/or the editor(s). MDPI and/or the editor(s) disclaim responsibility for any injury to people or property resulting from any ideas, methods, instructions or products referred to in the content. |
© 2023 by the authors. Licensee MDPI, Basel, Switzerland. This article is an open access article distributed under the terms and conditions of the Creative Commons Attribution (CC BY) license (https://creativecommons.org/licenses/by/4.0/).


