Abstract
Lakes are vital components of the hydrosphere, holding both environmental and economic significance. In recent times, they have undergone transformations in one of their key characteristics—water temperature. Assessing the scale and pace of these changes depends on the length and accuracy of the available data. This study focuses on the two lakes in Poland (Białe Augustowskie and Studzieniczne) with the longest continuous water temperature records, ranging from 1954 to 2023. The results reveal a relatively stable thermal regime until the late 1980s (with changes that were statistically insignificant) and a significant shift over the past three decades, during which the water temperature increased at a rate of 0.5 °C per decade. Importantly, simulations indicate further warming of the water by the end of the 21st century. Depending on the chosen climate change scenario, the warming of both lakes is expected to continue, with the Shared Socioeconomic Pathways (SSP585) scenario projecting a steady increase of 0.5 °C per decade. Given the fundamental importance of water temperature in determining factors such as water quality, these future changes present a significant challenge for water management authorities in terms of maintaining and managing these ecosystems.
1. Introduction
The hydrosphere is clearly feeling the effects of global warming, which is evident in one of the key parameters, namely water temperature [1,2,3]. This is largely driven by strong correlations with air temperature, where changes have a rapid and clear impact on the thermal regime of aquatic ecosystems. Numerous studies indicate that the surface temperature of lakes is increasing. The scale and pace of this process vary, influenced by factors such as geographical location and local conditions. For example, results from Lake Mendota (USA) using an empirical approach suggest that surface layer temperatures rise by 0.5 to 1.0 °C for every 1.0 °C increase in air temperature [4]. An analysis of surface water temperatures in lakes in Chile, based on MODIS satellite imagery, revealed a statistically significant increase of 0.10 °C per decade from 2000 to 2016 [5]. Studies of the four largest French pre-Alpine lakes demonstrate that over the past thirty years, the temperature of the epilimnion has risen by 0.46 °C per decade [6]. Significantly, projections show that these changes are expected to continue into the latter part of the 21st century. A comparison of two periods for the Himajigawa Reservoir (1991–2001 and 2091–2100) indicates that the 10-year average surface water temperature in the second period will increase by approximately 3.4 °C [7]. Similarly, the surface water layer in Rawson Lake (Canada) is projected to be 3.7 °C higher in the 2090s compared to earlier decades (RCP 8.5) [8].
Most processes occurring in lakes are linked to the distribution and changes in water temperature, and this link is confirmed in relation to physical, chemical, and hydrobiological characteristics. For example, water quality parameters in Xukou Bay (Lake Taihu), such as total nitrogen, ammonia nitrogen, total phosphorus, chemical oxygen demand, and pH, were sensitive to high water temperatures [9]. The annual average biomass of phytoplankton in the shallow Lake Bassenthwaite (England) increased with rising temperatures and nutrient loading [10]. In Lake Tana (Ethiopia), the biomass of water hyacinth was positively correlated with water temperature [11]. Global warming will impact the thermal structure of Lough Feeagh (Ireland), where it is expected that stratification will occur earlier and be more stable, leading to a longer growing season [12]. Thus, the observed and projected increase in water temperature will significantly affect the transformation of lake ecosystems.
A crucial aspect of building a broader understanding of inland waters’ thermal dynamics is having access to appropriate datasets. In the context of assessing long-term changes, this typically involves several decades of data. As noted by Piccolroaz et al. [10,13], there is a good assessment of the increase in lake surface temperatures over recent decades; however, knowledge regarding long-term changes is relatively limited. Therefore, research is being conducted to reconstruct water temperatures, allowing for the evaluation of this parameter’s response to various climatic conditions [14]. In this context, lakes with detailed, actual field measurements of water temperature play a significant role, as they not only enable the assessment of change magnitude over a specific period, but also allow for an in-depth exploration of temperature dynamics over shorter intervals. This approach has been utilized in this study, which analyzes two lakes in Central Europe, Studzieniczne and Białe Augustowskie, which possess the longest continuous record of surface temperature observations in Poland, covering the last seventy years. Compared to previous studies conducted in this region [15,16], the inclusion of such an extensive timeframe represents a significant expansion of knowledge in this area. Consequently, the aim of this article is to analyze historical and future trends in inland waters in Central Europe, with a particular focus on determining their response to observed climate changes.
2. Materials and Methods
2.1. Study Area
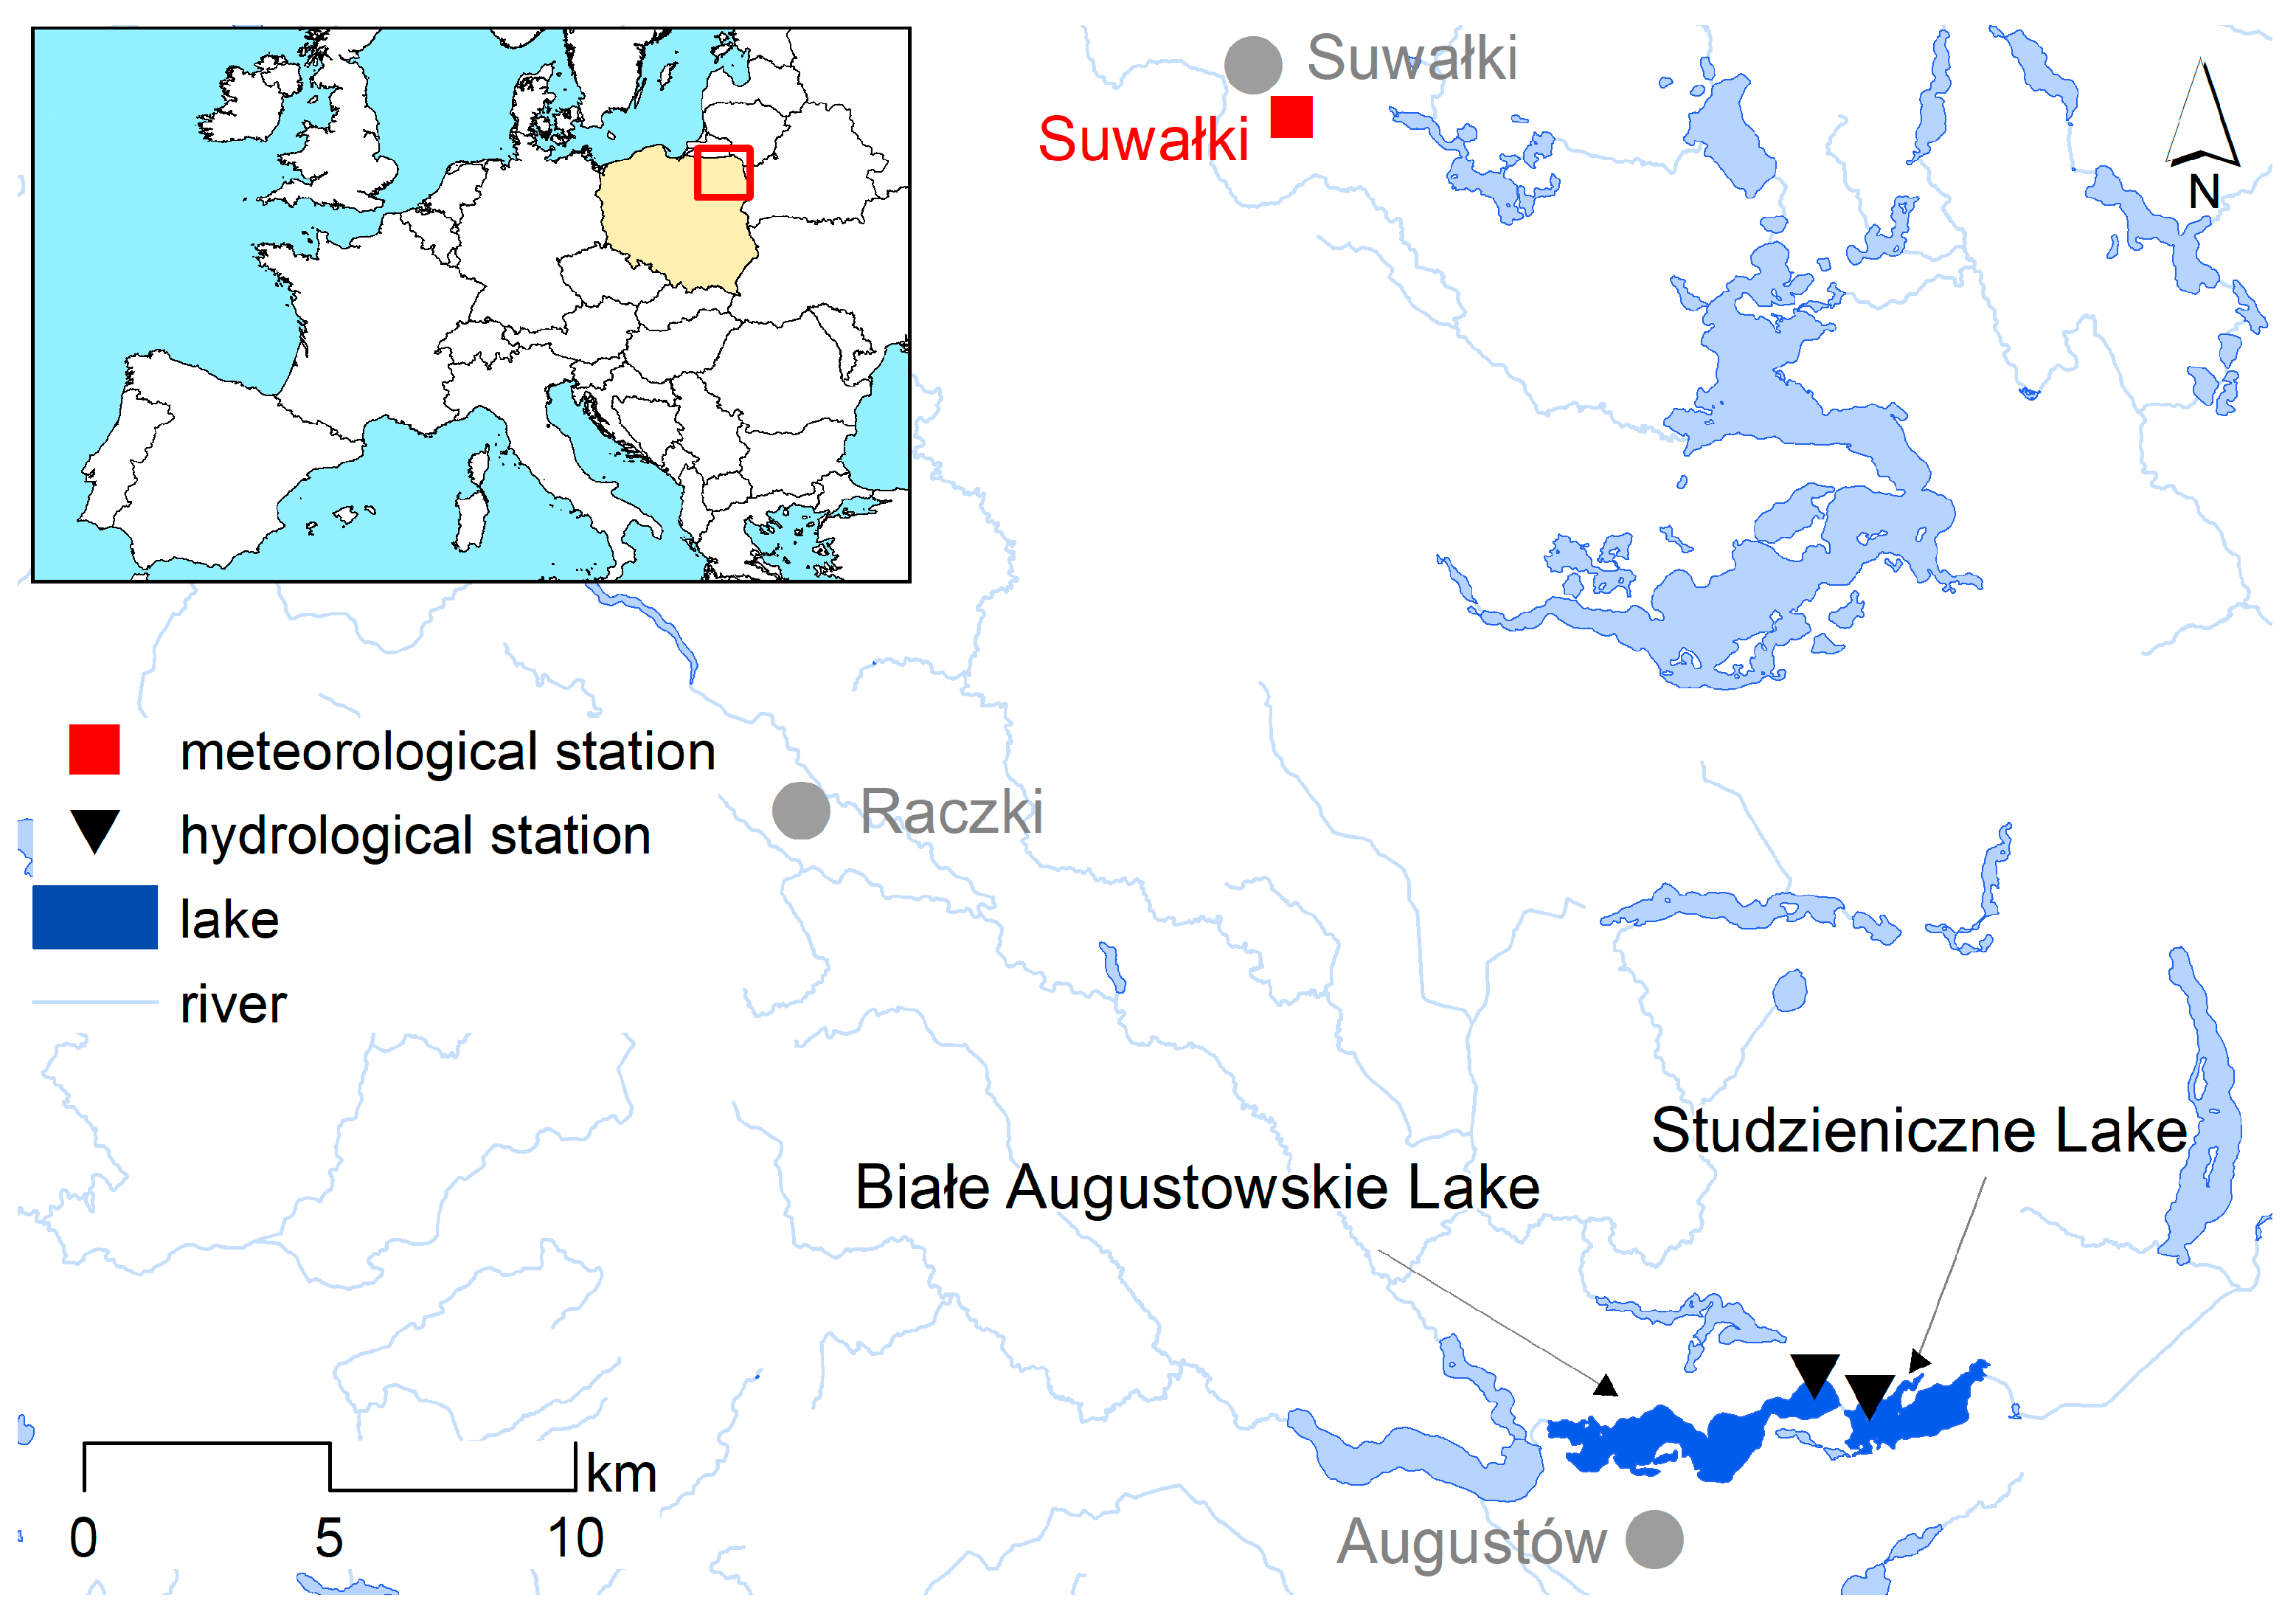
This study focuses on two lakes located in northeastern Poland (Figure 1): Białe Augustowskie and Studzieniczne. As previously emphasized, these lakes have the longest continuous dataset regarding water temperature, covering the years 1954–2023. Both lakes are situated within the town of Augustów (approximately 30,000 residents) and are part of the Augustów Canal, which connects the region’s rivers to the Niemen River and, subsequently, to the Baltic Sea. They are among the major tourist attractions in the area, offering opportunities for water sports, fishing, and tourism facilities along their shores. The genesis of the lakes is linked to the Scandinavian ice sheet, and as glacial lakes, they possess diverse morphometry. The basic parameters are summarized in Table 1.
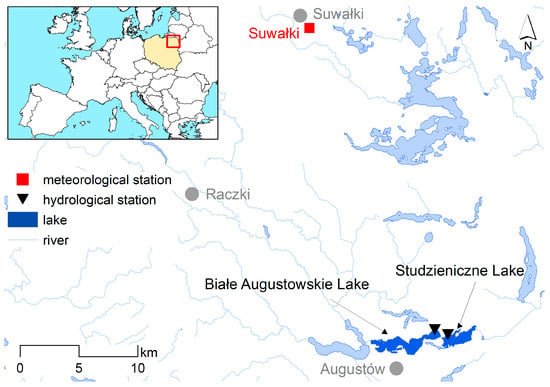
Figure 1.
Location of the research objects.

Table 1.
Characteristics of the analyzed lakes [17].
2.2. Materials
This article utilizes data resulting from observations conducted by the Institute of Meteorology and Water Management (in Poland). Water temperature measurements are taken daily at a depth of 0.4 m below the surface at a specific point near the water gauge. This has allowed for the collection of a detailed dataset, which includes over 25,500 records for each lake. The water gauge itself was established in 1926, initially measuring water levels. Data on air temperature were also obtained from the same institution, measured at the Suwałki station, located 30 km from both lakes. These measurements are typically taken in a meteorological shelter at a height of 2 m above ground level.
2.3. Methods
2.3.1. Historical Changes
To determine the direction of long-term changes in the average annual air and water temperatures in Lakes Białe Augustowskie and Studzieniczne, non-parametric Mann–Kendall [18] and Sen [19] tests were used. The trend analysis was performed using the Mann–Kendall test. The test assumes two hypotheses: the null hypothesis (H0) states that the data do not exhibit a trend, while the alternative hypothesis (HA) suggests that a trend exists. The magnitude of the changes in air and water temperatures was determined using the non-parametric Sen test, which is not sensitive to the presence of outliers. During the data analysis, a pre-whitening procedure was applied to remove autocorrelation from the data series [20]. The Mann–Kendall and Sen tests were performed using the modified “mk” R package developed by Patakamuri and O‘Brien [21]. The change points were detected using the “trend” R package developed by Pohlert [22].
2.3.2. Future Changes
To determine future changes in water temperature in Białe Augustowskie and Studzieniczne lakes, the air2water model was used. Air2water is a simple lumped model designed to predict lake surface water temperature based on air temperature [23]. The air2water model is also classified by Toffolon and Piccolroaz [24] as a hybrid model, which combines a physically-based equation with a stochastic calibration of model parameters. The air2water model is based on the volume-integrated equation of heat applied to the upper water lake volume, which links the heat exchanges with the atmosphere [25]:
where the following apply:
- ρ—water density (M·L−3);
- cp—specific heat capacity (L2·T−2·Θ−1);
- Vs—lake surface water volume (L3);
- Tw—lake surface water temperature (Θ);
- t—time (T);
- A—lake surface area of the (L2);
- Φnet—net heat flux into the upper lake water volume (M·T−3).
This study used a 6-parameter model version:
where the following apply:
- a1, a2, a3, a4, a5, a6—model parameters;
- ty—duration of the year (T);
- Ta—air temperature (Θ);
- δ—dimensionless volume (or depth) is calculated as the ratio of lake surface water volume vs. (L3) and a reference volume Vr (L3);
- Th reference value of deep water temperature (Θ).
Model parameters a1, a2, a3, a4, a5, and a6 were originally identified by Piccolroaz et al. [23] and redefined by Toffolon et al. [26]. The range of variation of model parameters for Lakes Studzieniczne and Białe Augustowskie was determined based on correlations specified by Piccolroaz [27]. Next, the model was tested based on available measurement data, i.e., air temperatures and lake water temperatures. The testing was conducted in two stages. In the first stage, the model calibration was performed using data from 1954–1988, and the model validation was conducted using data from 1989–2023. Next, the situation was reversed: calibration was based on data from 1989–2023, and validation was based on data from 1954–1988. In the second stage, the model was calibrated using all available data from the period 1954–2023. Based on the results obtained, model parameters from a1 to a6 were compared. Moreover, to evaluate model performance, five widely used metrics were employed, namely mean absolute error (MAE), root mean square error (RMSE), determination coefficient (R2), Nash–Sutcliffe efficiency (NSE) and Kling–Gupta efficiency (KGE). Finally, due to the satisfactory results obtained during the model testing phase, it was decided to use the calibrated models (based on data from 1954–2023) to predict daily lake water temperatures until 2100, considering two scenarios of Shared Socioeconomic Pathways, namely SSP245 and SSP585. These scenarios represent plausible future developments in greenhouse gas emissions and socioeconomic factors, as part of the Coupled Model Intercomparison Project Phase 6 (CMIP6). SSP245 assumes a stabilization of global emissions after moderate mitigation efforts, resulting in a radiative forcing of 4.5 W/m2 by the year 2100. In contrast, SSP585 represents a high-emissions pathway, leading to continued, unmitigated emissions growth and a radiative forcing of 8.5 W/m2 by the century’s end [28,29].
The strong and widespread dependence of water temperature on air temperature makes the latter a crucial element for predicting future changes in the thermal regimes of lakes. Therefore, selecting the appropriate method, and thus ensuring the accuracy of the results, is essential in such analyses. The temperature between 2024 and 2100 was utilized in multi-model ensembles (MMEs) while using the Bayesian model averaging (BMA) method to acquire surface air temperature data from several datasets of the Global Climate Model (GCM) according to Coupled Model Intercomparison Project Phase 6 (CMIP6), as listed in Table 2. MMEs are a remarkably effective approach for mitigating the uncertainty linked to individual models.

Table 2.
Global Climate Model (GCM) data in this study.
The NorESM2-MM data cover the time span from the pre-industrial era to the year 2100. The system operates on a grid resolution of approximately 1 × 1 degree, with a specific emphasis on marine biogeochemical processes. This model emphasizes the importance of marine biogeochemical processes within its framework [30]. The MPI-ESM1-2-HR dataset offers highly detailed climate forecasts on a 0.5-degree basis, covering the period from 1850 to 2100. This dataset exhibits remarkable expertise in establishing correlations between air measurements and ocean models [31]. The EC-Earth3 dataset covers the time range from 1850 to projections extending beyond 2100. The model has a grid spacing of approximately 1 × 1 degree and was designed specifically to replicate the climate and variability of Europe [32]. The AWI-CM-1-1-MR dataset provides essential information on polar processes, covering the period from the end of the 20th century to 2100. It has a resolution of approximately 1 degree [33]. The BCC-CSM2-MR model encompasses a broad spectrum of temporal intervals, commencing in 1850 and continuing until 2100, with a projected alteration of around 1 degree. It offers extensive details regarding the distinct climate attributes of East Asia and the West Pacific area [34]. The MRI-ESM2-0 dataset offers precise simulations of both atmospheric and oceanic interactions, with a grid resolution that varies from 0.5 to 1.5 degrees [35]. The GFDL-ESM4 dataset covers the time span from the pre-industrial era to the year 2100. This dataset efficiently integrates the carbon cycle alongside physical climate factors, hence providing useful insights into the processes of carbon responses [36]. The CESM2-WACCM dataset covers the time span from 1850 to 2100 and has a grid spacing up to 0.25 degrees. The model encompasses the entirety of the atmosphere [37]. The CMCC-CM2-SR5 model covers a wide range of historical periods, from the 20th century to potential future scenarios in the 21st century. It focuses specifically on the climate of the region around the Mediterranean [38].
This study uses Bayesian Model Averaging (BMA), as suggested by Hoeting et al. [39], to combine data obtained from multiple global climate models (GCMs). The Bayesian Model Analysis (BMA) is a statistical framework that allows for the combination of predictions produced by many models, using ideas derived from probability theory. The fundamental basis of this technique is the Bayes theorem, which may be formally represented within the context of model aggregating in the following form:
represents the posterior probability of model Mi given the data y. represents the likelihood of the data y under model Mi. represents the prior probability of model Mi. p(y) represents the marginal likelihood of the data y and is used as a normalizing constant. The posterior probabilities are then normalized, ensuring that the sum of the weights for all models equals 1. Models with better performance receive higher weights in the final ensemble forecast, allowing for a more robust prediction.
After implementing the MME approach, we employed the nearest neighbor methodology [40] to choose surface air temperature data for a specific geographic region. This method calculates the distance from the desired point to each grid location and selects the nearest grid point to best represent the desired location. The concept of the nearest neighbor was expressed by calculating the distance between the target point and every location within the grid.
The Euclidean distance, denoted as d, between a target point with geographic coordinates (xtarget, ytarget) and each grid point (xi, yi) in the data set can be computed using the following formula:
This study utilized a bias correction method based on Empirical Quantile Mapping (EQM) [41,42] to modify the air temperature data generated by the MME method, in order to align it more accurately with the observed historical climate data. EQM is a statistical bias correction technique commonly used to adjust climate model outputs to better match observed historical data. This method is particularly effective for correcting discrepancies in the distribution of climate variables, such as temperature or precipitation, between modeled and observed datasets. EQM involves calculating the empirical cumulative distribution functions (CDFs) for both observed and modeled data to determine their respective quantiles. For a given quantile p, the difference between the observed and modeled quantiles is calculated as ΔQ(p) = QO(p) − QM(p), where QO(p) and QM(p) represent the quantiles of the observed and modeled data, respectively. This difference is then used to construct a mapping function that aligns the modeled data distribution with the observed data distribution.
The bias correction is applied by adjusting each value in the modeled dataset according to its quantile difference, resulting in the corrected modeled data Mc = M + ΔQ(p), where M represents the original modeled data. The correction determined from the historical period is subsequently applied to future modeled projections to ensure that their distribution aligns with the observed data. Empirical Quantile Mapping thus preserves the distributional characteristics and variability of the observed climate while correcting biases in the model output.
To identify change points in the air temperature measurement series (1954–2023) and in the air temperature prediction series (2024–2100), the non-parametric Pettitt test was applied. The Pettitt test allows for the detection of single change points in time series [43]. This analysis revealed that considering the annual average values of air temperature, the change point in the measurement series occurs in 1988. For the annual average air temperature values from SSP245, the break point occurs in 2069, while for SSP585, it occurs in 2064. Consequently, long-term trend analyses were conducted for the historical period of 1954–2023 and for the future, for 2024–2100, under the SSP245 and SSP585 scenarios. Additionally, analyses were performed for the periods identified by the Pettitt test breakpoints, i.e., 1954–1987 and 1988–2023, for SSP245 for the periods 2024–2068 and 2069–2100, and for SSP585 for the periods 2024–2063 and 2064–2100.
3. Results
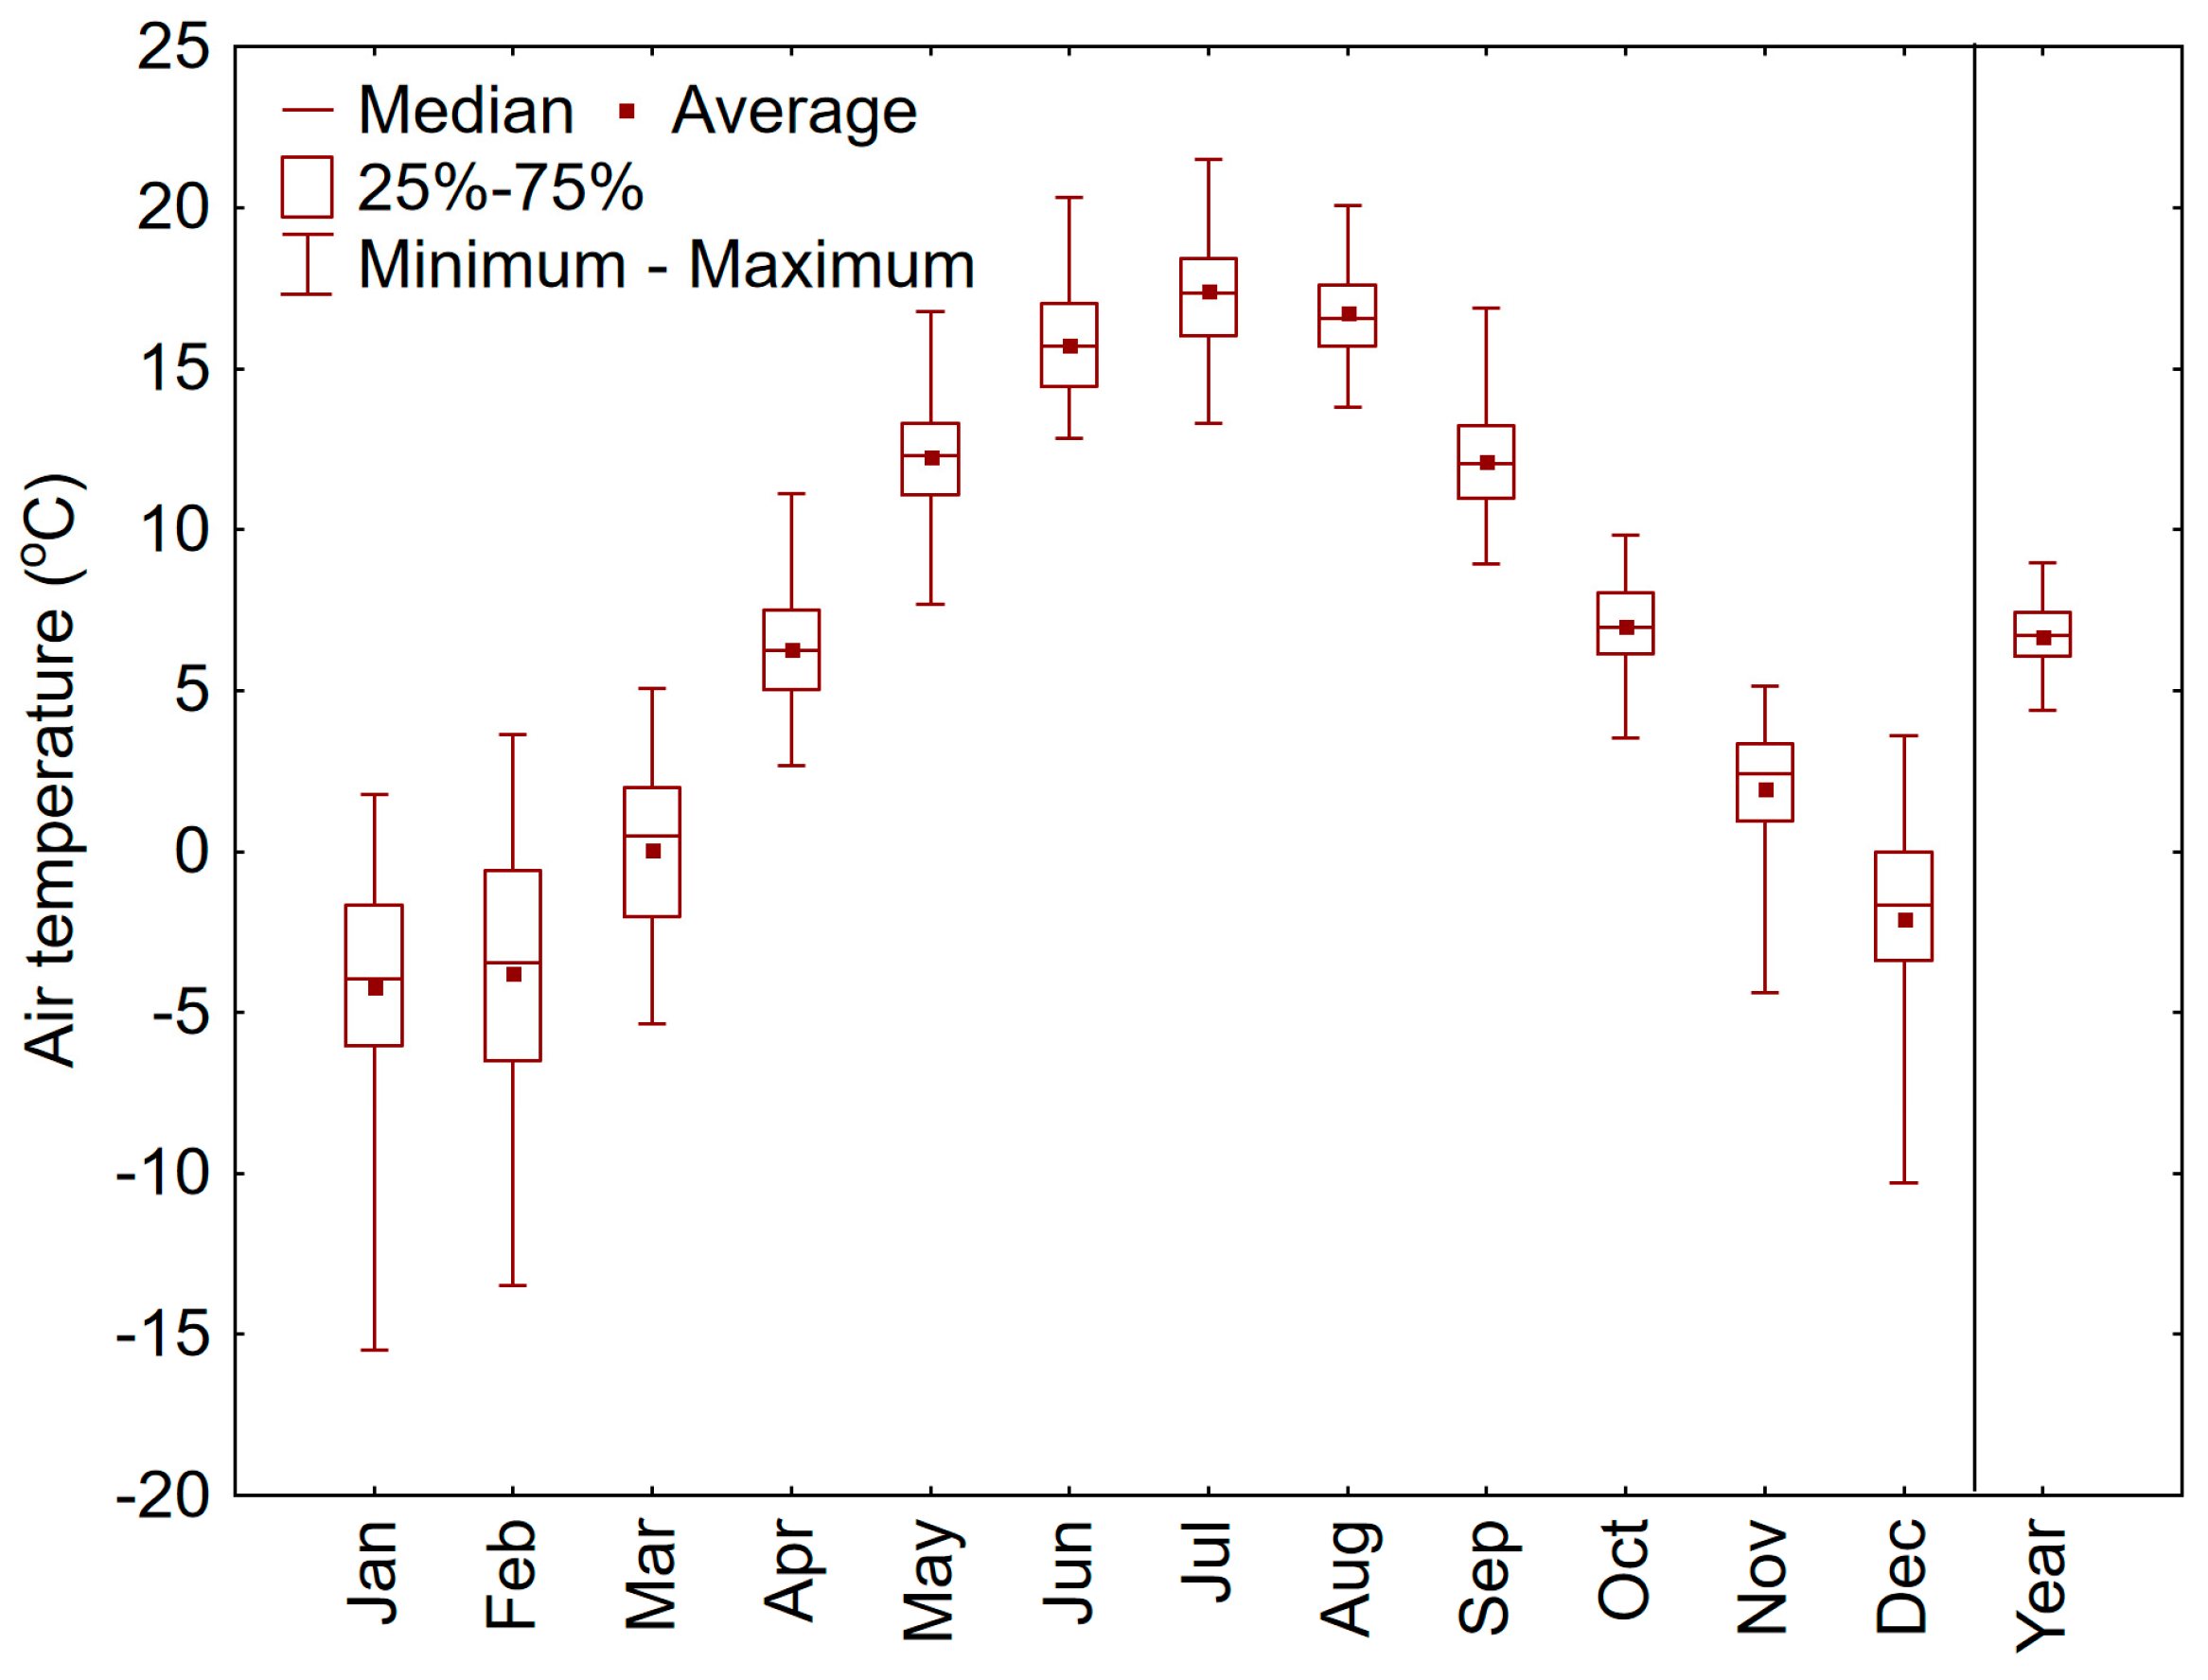
The average temperature at the meteorological station in Suwałki over the period from 1954 to 2023 was 6.7 °C, with variability ranging from 4.4 to 9.0 °C. Considering the average monthly temperatures, January is the coldest month, with a multi-year average temperature of −4.2 °C, while July is the warmest month, with an average temperature of 17.4 °C. The variability of the average monthly temperatures from 1954 to 2023 was highly diverse, ranging from 6.2 °C in August to as much as 17.3 °C in January (Figure 2).
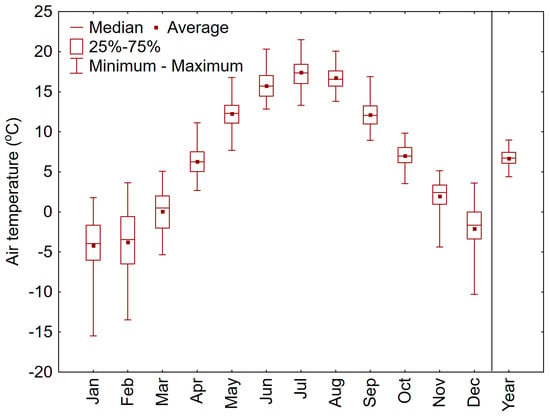
Figure 2.
Variability of average monthly and annual temperatures at the Suwałki meteorological station.
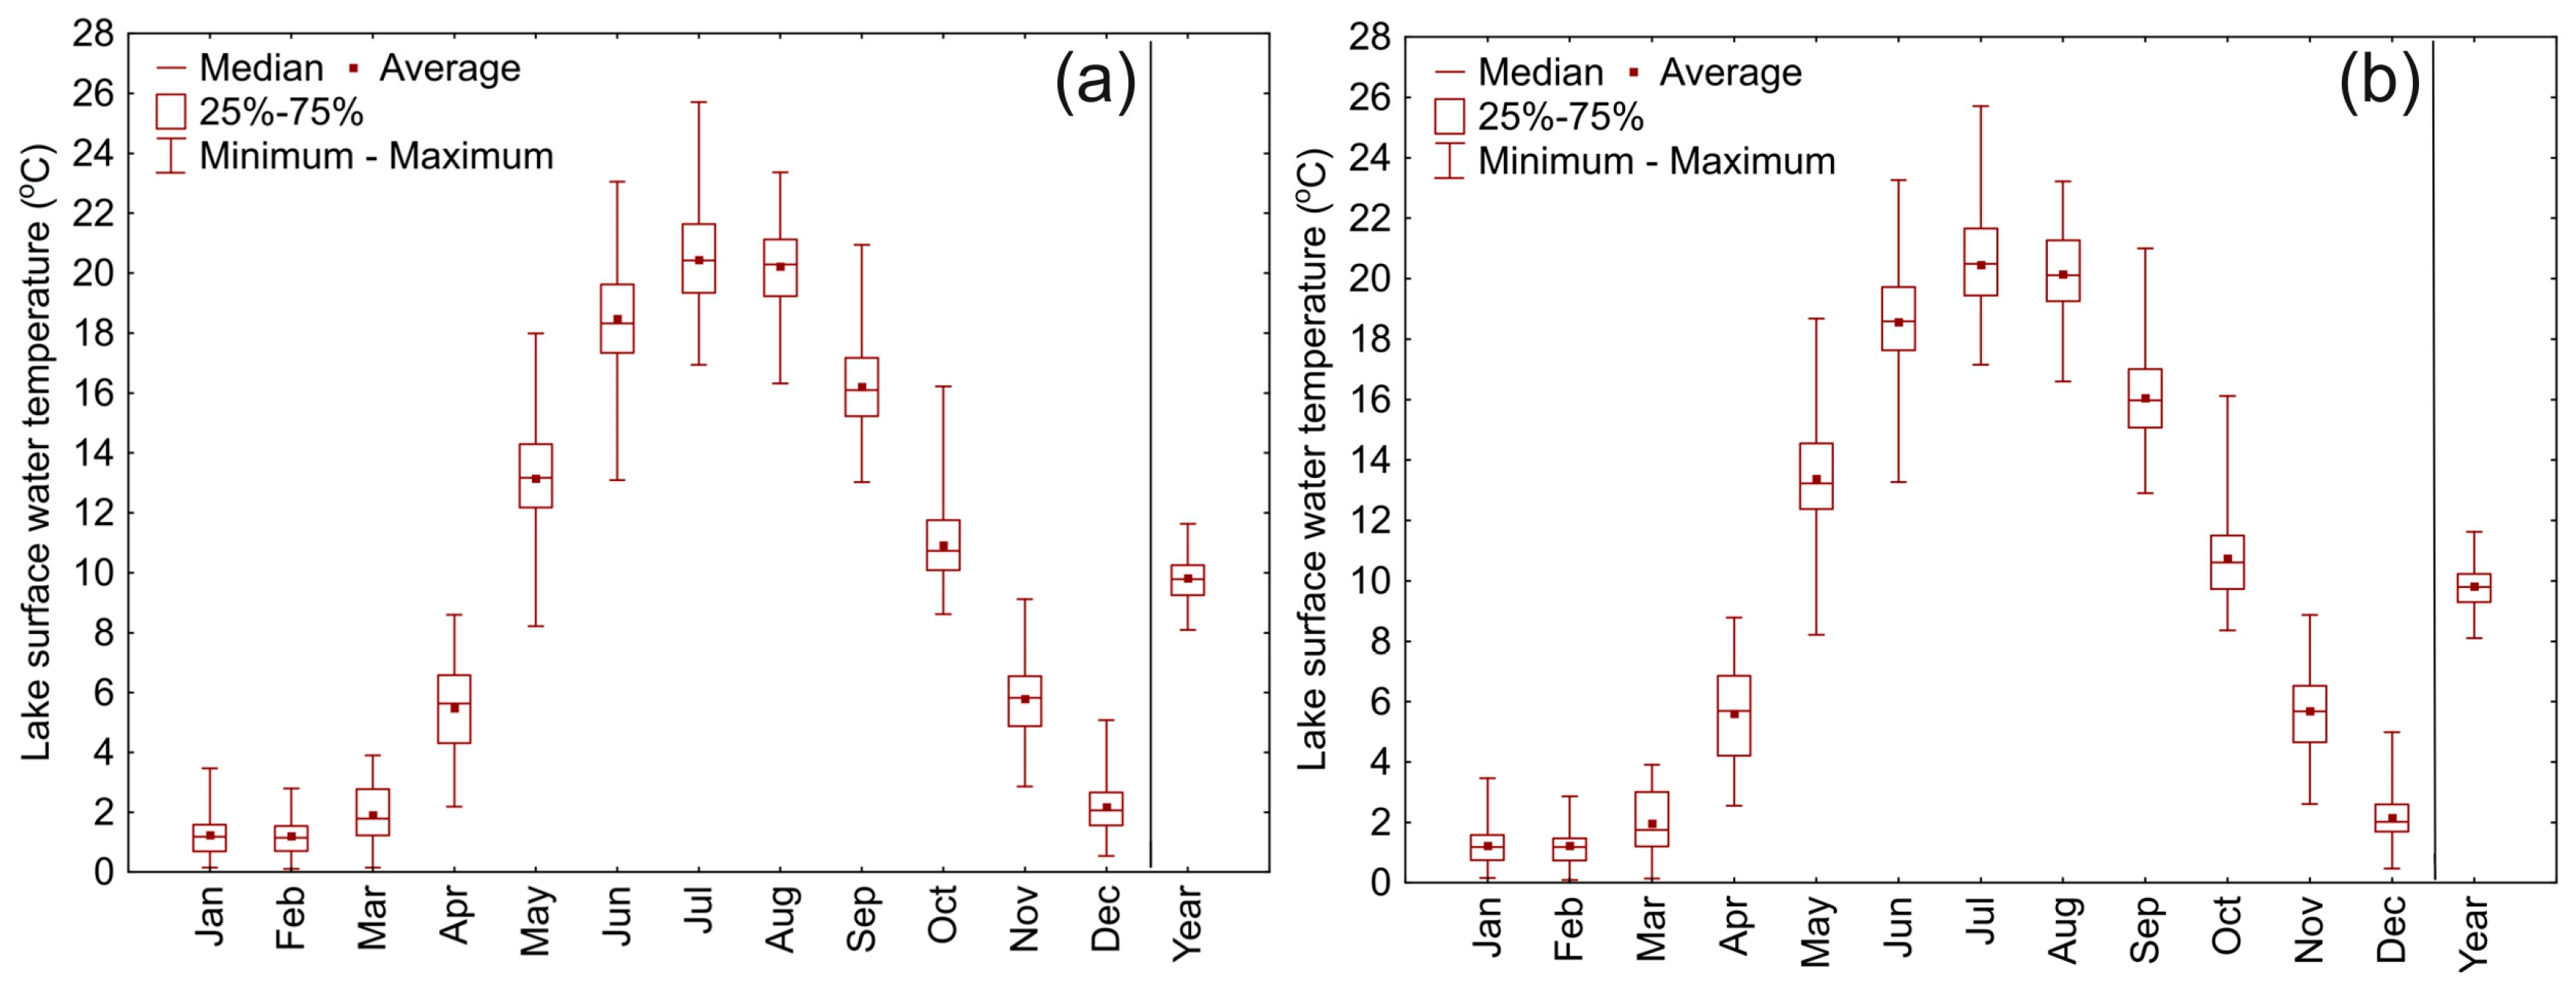
With this temperature trend, the average water temperature in Lake Białe Augustowskie from 1954 to 2023 was 9.8 °C, with variability ranging from 8.1 to 11.6 °C. The lowest water temperatures in the lake were recorded in February (average 1.2 °C), while the highest were in July (average 20.5 °C, Figure 3). The highest variability of average monthly temperatures occurred in June (with a range value of 10.0 °C and standard deviation of 1.8 °C), while the lowest was in February (with a range value of 2.7 °C and standard deviation 0.6 °C). The water temperatures in Lake Studzieniczne were at the same level, considering annual average values, and very similar when considering monthly values. In the lake, the lowest variability of average monthly water temperatures occurred in February, while the highest was in May.
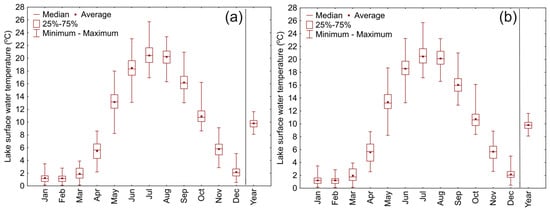
Figure 3.
Variability of average monthly and annual temperatures in Lakes Białe Augustowskie (a) and Studzieniczne (b) in the period 1954–2023.
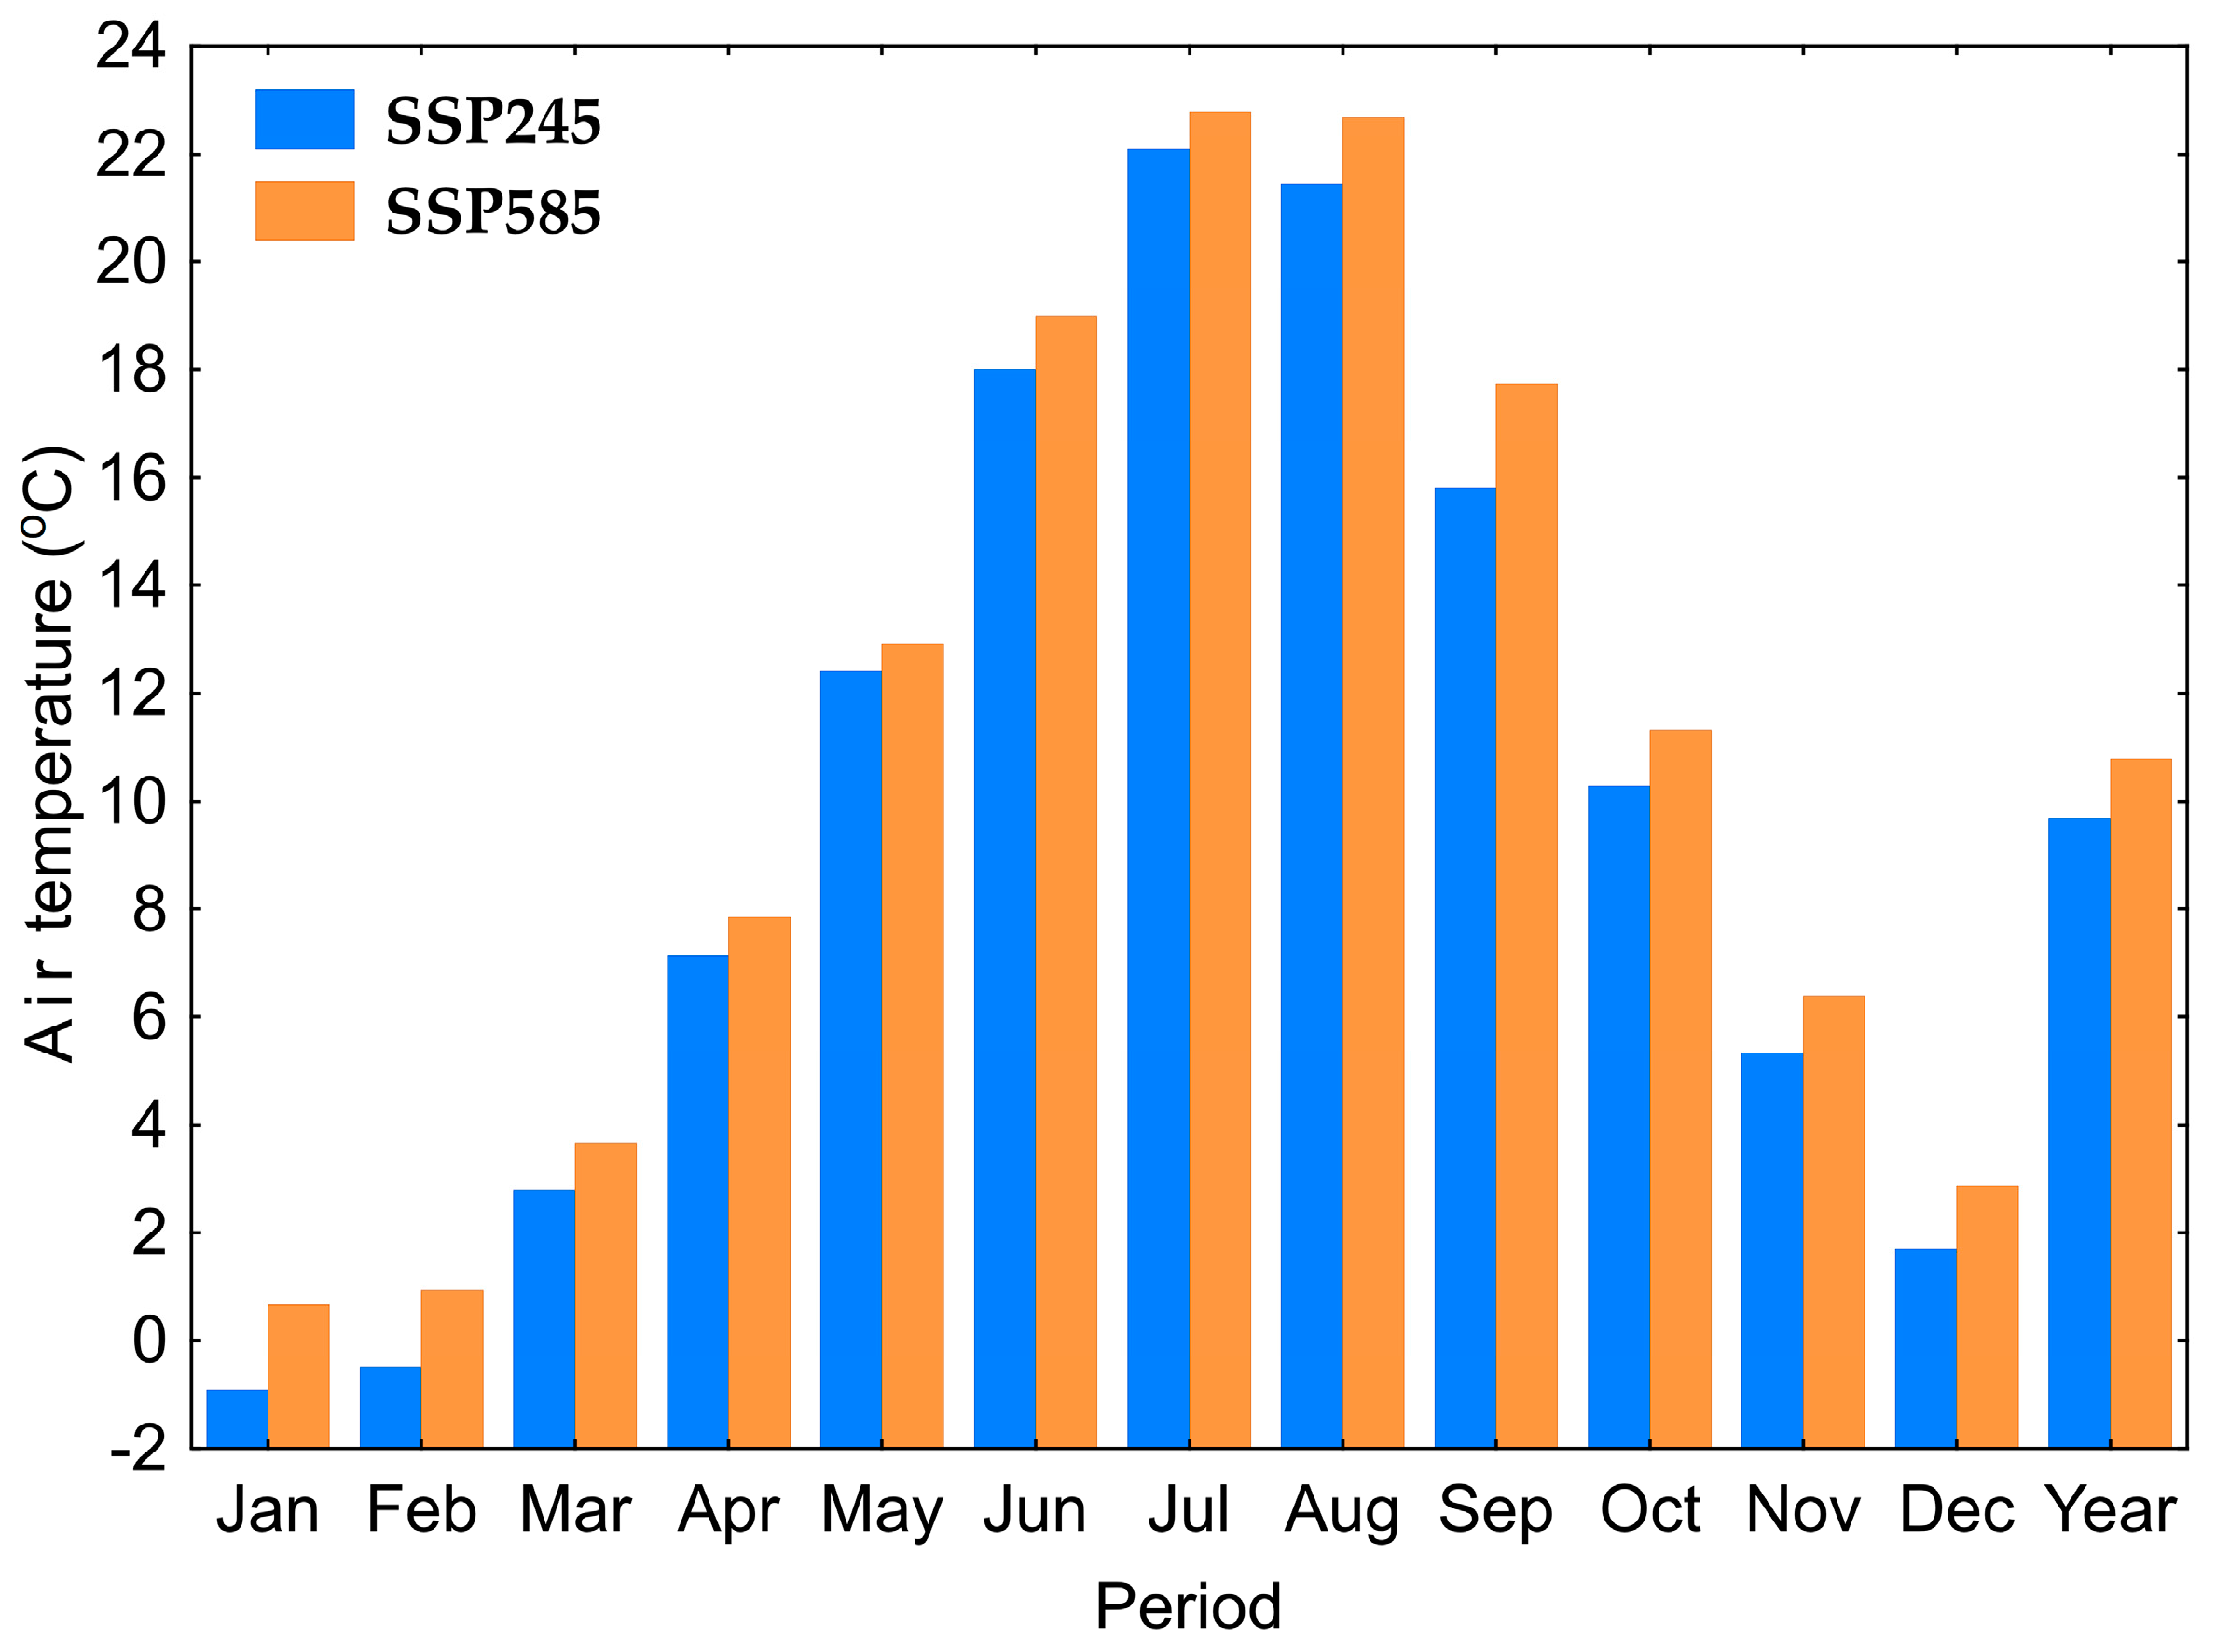
Considering the SSP245 scenario, the average annual air temperature at the Suwałki Station from 2024 to 2100 will be 9.7 °C, with variability ranging from 7.8 to 11.1 °C (Figure 4). The coldest month will be January, with an average temperature of −0.9 °C, while the warmest month will be July, with an average temperature of 22.1 °C. On the other hand, according to the SSP585 scenario, the average annual air temperature at the Suwałki Station from 2024 to 2100 will be 10.8 °C, with variability ranging from 7.7 to 13.3 °C (Figure 4). The coldest month will again be January, with an average temperature of 0.7 °C, while the warmest month will be July, with an average temperature of 22.8 °C.
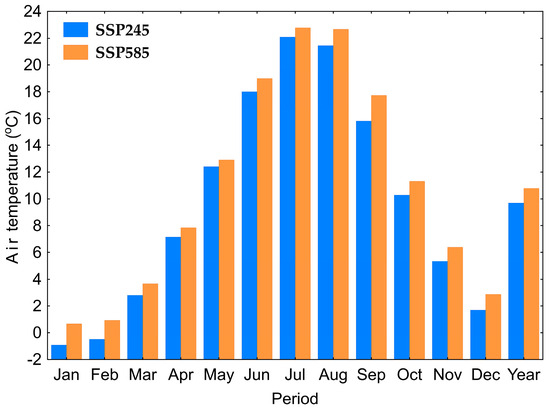
Figure 4.
Variability of average monthly and annual temperatures at the Suwałki meteorological station according to scenarios SSP245 and SSP585 in the period 2024–2100.
Comparing the average monthly and annual values from the periods 1954–2023 and 2024–2100 according to the SSP245 scenario, it was shown using the Student’s t-test that the differences are significant at the 0.05 level for almost all months except May. The rule is that the average monthly and annual temperatures from the period 2023–2100 will be higher than those recorded historically. In contrast, comparing the periods 1954–2023 and 2024–2100 according to the SSP585 scenario, it was found that in all cases, the average monthly and annual temperatures from the predictions were higher than the historical ones at the 0.05 significance level. Additionally, the average monthly and annual temperatures from the SSP585 scenario were significantly higher than those from the SSP245 scenario.
To predict water temperatures in lakes, the air2water model was used. In the first stage, it was tested based on data from the period 1954–2023 to assess the quality of predictions and the stability of the model parameters. The observational series was divided into two parts, 1954–1988 and 1989–2023, and testing was conducted using cross-validation. The values of the mean absolute error (MAE), root mean square error (RMSE), determination coefficient (R2), Nash–Sutcliffe efficiency (NSE), and Kling–Gupta efficiency (KGE) were calculated (Table 3).

Table 3.
Statistical values obtained in the stages of testing of the air2water model.
During the testing and validation stage of the model, similar values were obtained: the RMSE ranged from 1.07 to 1.27 °C, the MAE ranged from 0.84 to 0.96 °C, the average R2 was 0.98, the NSE values ranged from 0.974 to 0.981, and the KGE ranged from 0.938 to 0.963.
The comparison of the model parameters that were optimized in both trials showed that the values of a2 and a4 were at the same level, while the values of parameters a1, a3, and a6 differed by about 5%, and a5 differed by 14%. The above results are consistent with those obtained by Zhu et al. [44]. Therefore, it was concluded that these results are satisfactory, and it was decided to predict water temperatures in Lake Białe Augustowskie and Lake Studzieniczne using the air2water model with air temperatures from the SSP245 and SSP585 scenarios. For this purpose, in both cases, the model was calibrated based on measurement data from the period of 1954–2023. The calculated statistical test values for Lake Białe Augustowskie were RMSE 1.20 °C, MAE 0.93, R2 0.98, NSE 0.953, and KGE 0.952, while for Lake Studzieniczne, they were RMSE 1.16 °C, MAE 0.89, R2 0.98, NSE 0.956, and KGE 0.954.
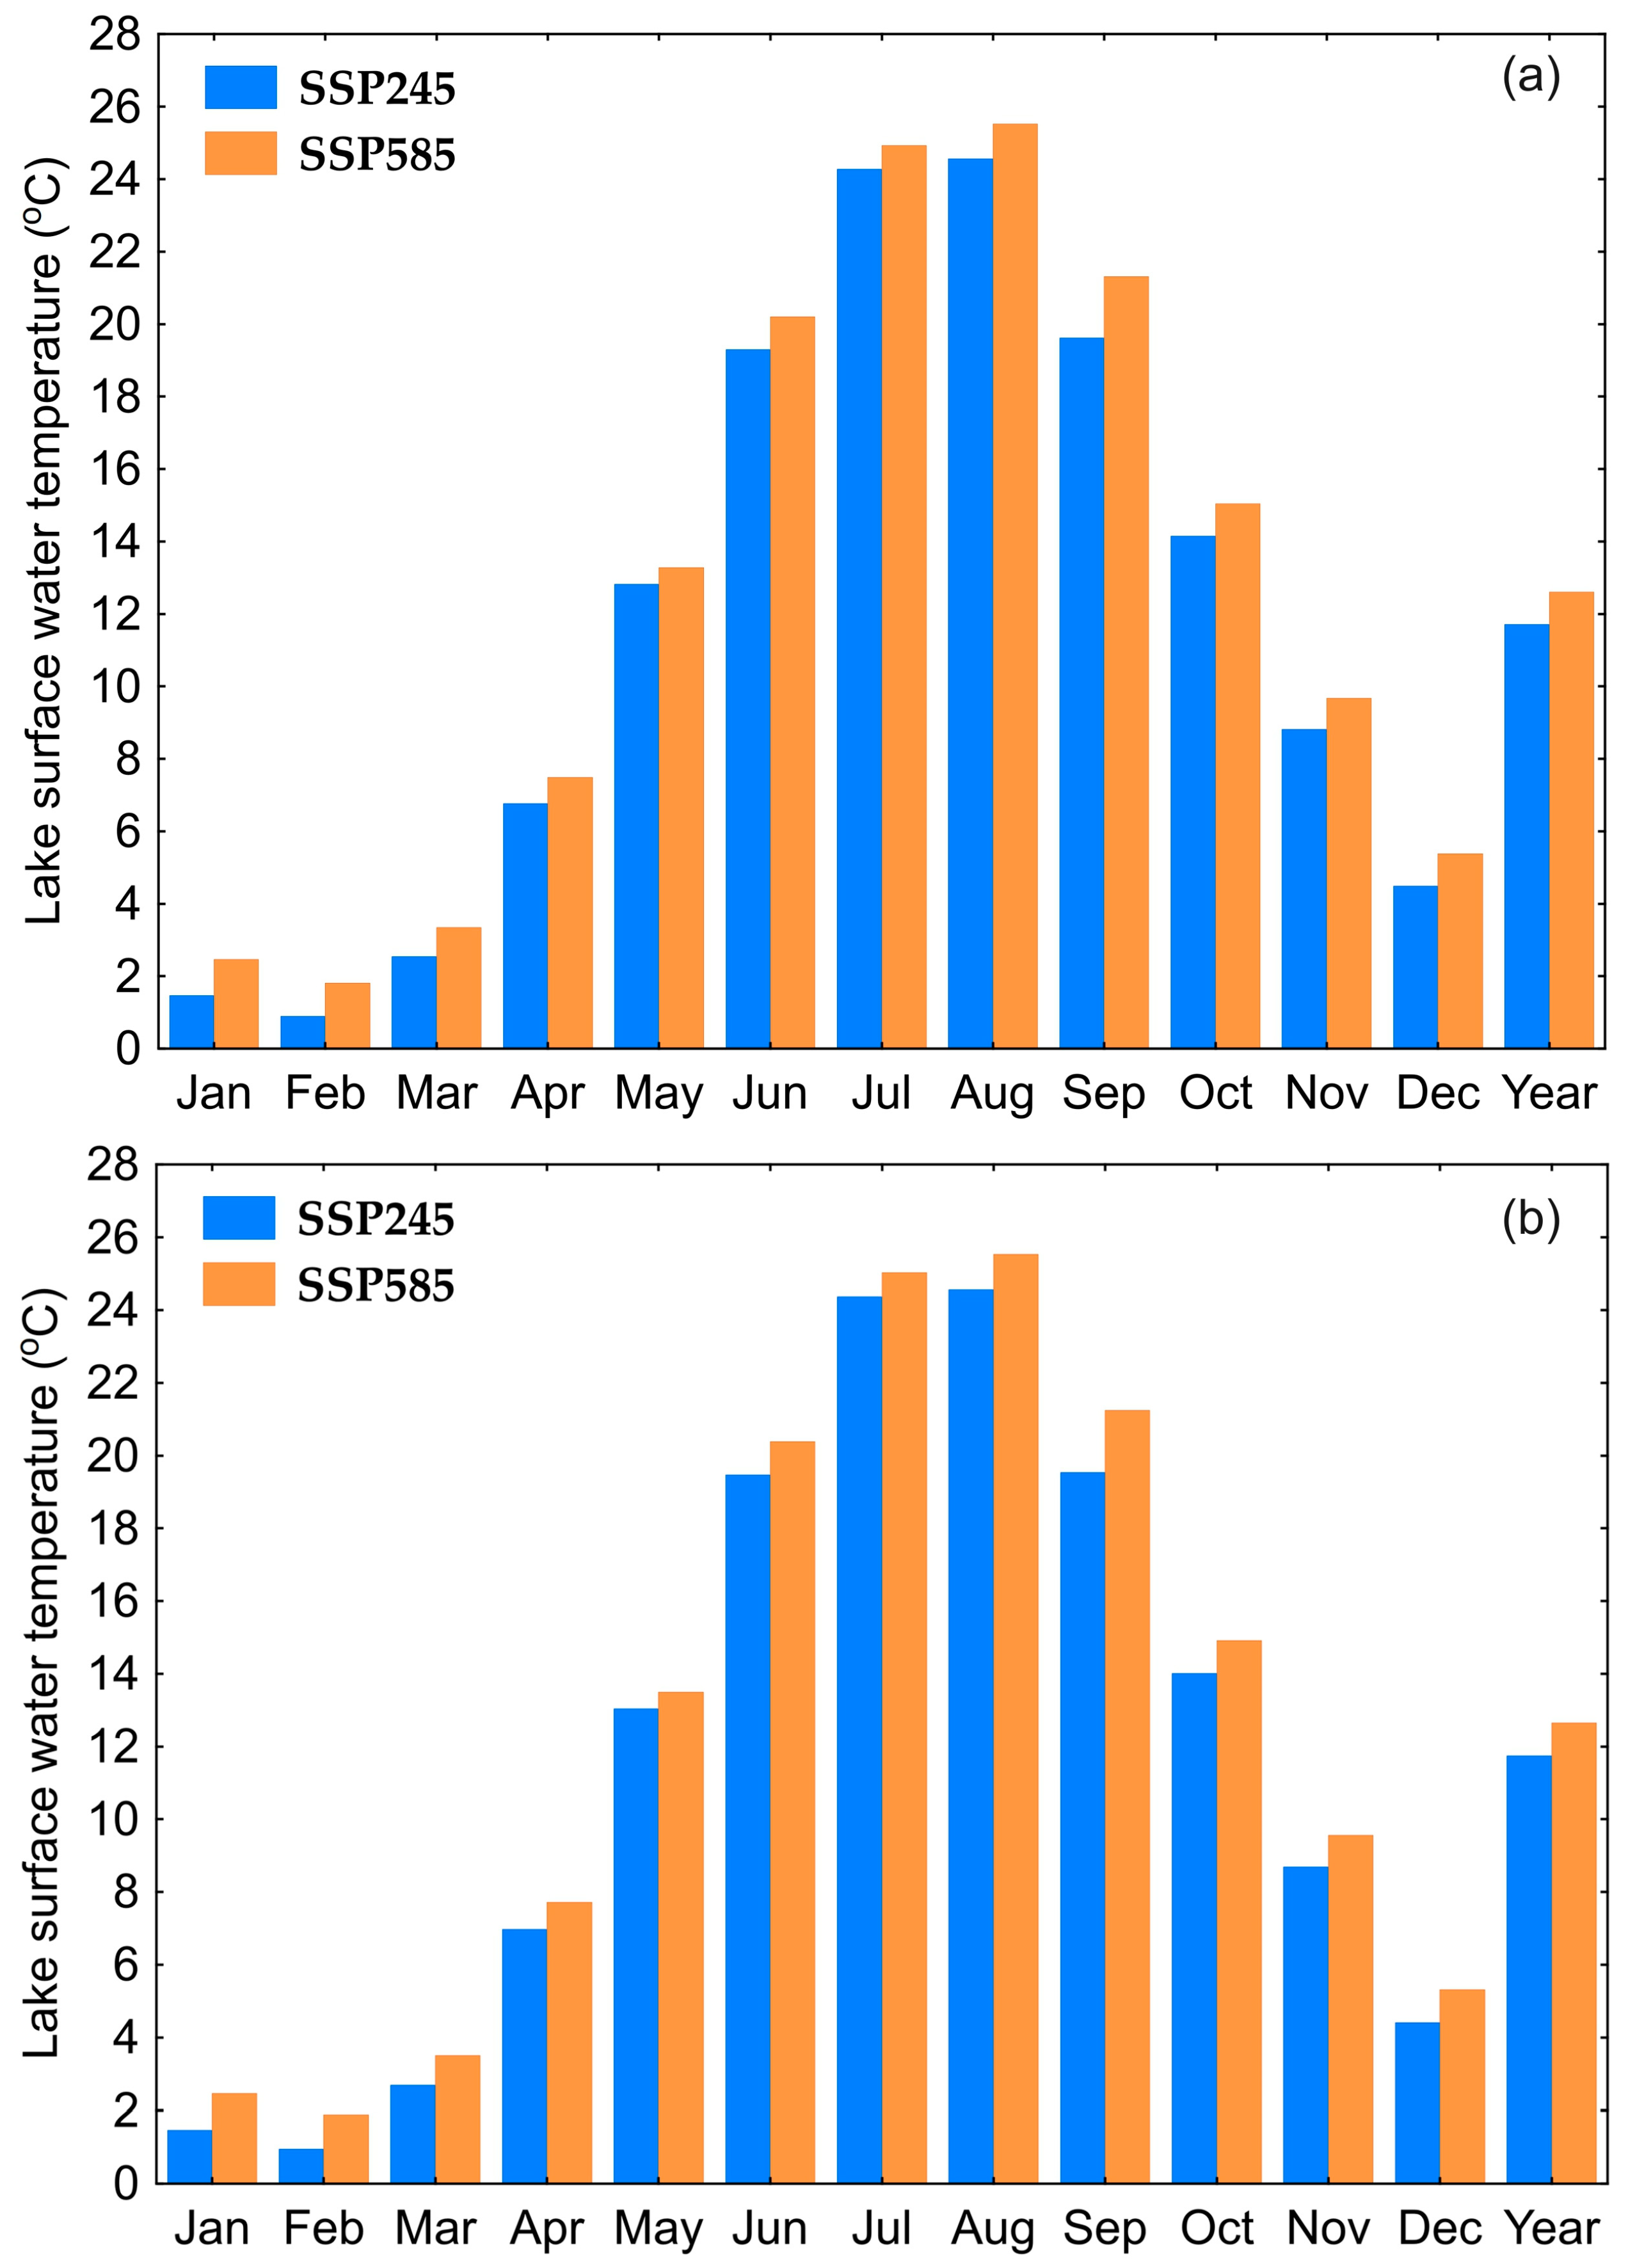
Based on daily water temperatures from the air2water model for the period of 2024–2100, average monthly and annual values were calculated for both lakes. In both lakes and for both scenarios, SSP245 and SSP585, water temperatures are higher than historical values (Figure 5). These differences are significant at the 0.05 level based on the Student’s t-test. The exception is May for the SSP245 scenario, for which water temperatures remain at a similar level, and February, for which water temperatures decrease by about 0.3 °C. In Lake Białe Augustowskie, the average annual temperature under the SSP245 scenario is expected to rise by an average of 1.8 °C, and by 2.8 °C for SSP585. The highest temperature increases will occur in the summer months (July–September), ranging from 3.4 to 4.3 °C for SSP245 and from 4.5 to 5.3 °C for SSP585. In Lake Studzieniczne, the increase in average annual temperature will be at the same level as in Lake Białe Augustowskie. The highest temperature increases will also occur in the summer months (July–September), ranging from 3.5 to 4.4 °C for SSP245 and from 4.6 to 5.4 °C for SSP585. The lowest changes in water temperature are expected in May.
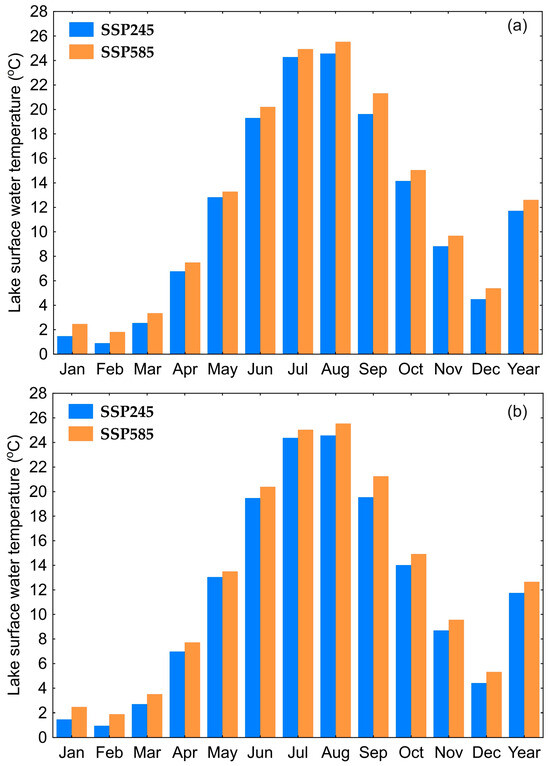
Figure 5.
Variability of average monthly and annual water temperatures in Lakes Białe Augustowskie (a) and Studzieniczne (b), according to scenarios SSP245 and SSP585.
In the final stage, an analysis of long-term changes in air temperature and surface water temperature in the lakes was conducted for the historical period of 1954–2023 and the future period of 2024–2100 for the SSP245 and SSP585 scenarios. Additionally, the analysis was performed for subperiods identified through the Pettitt test for breakpoints. For the historical periods, the analysis was conducted for the periods of 1954–1987 and 1988–2023; for SSP245, for the periods of 2024–2068 and 2069–2100; and for SSP585, for the periods of 2024–2063 and 2064–2100. The results of the analysis of the annual periods are presented in Table 4, while the complete summary of results for the monthly periods is presented in Tables S1–S3.

Table 4.
Results of trend analysis of average monthly and annual air temperatures and water temperatures.
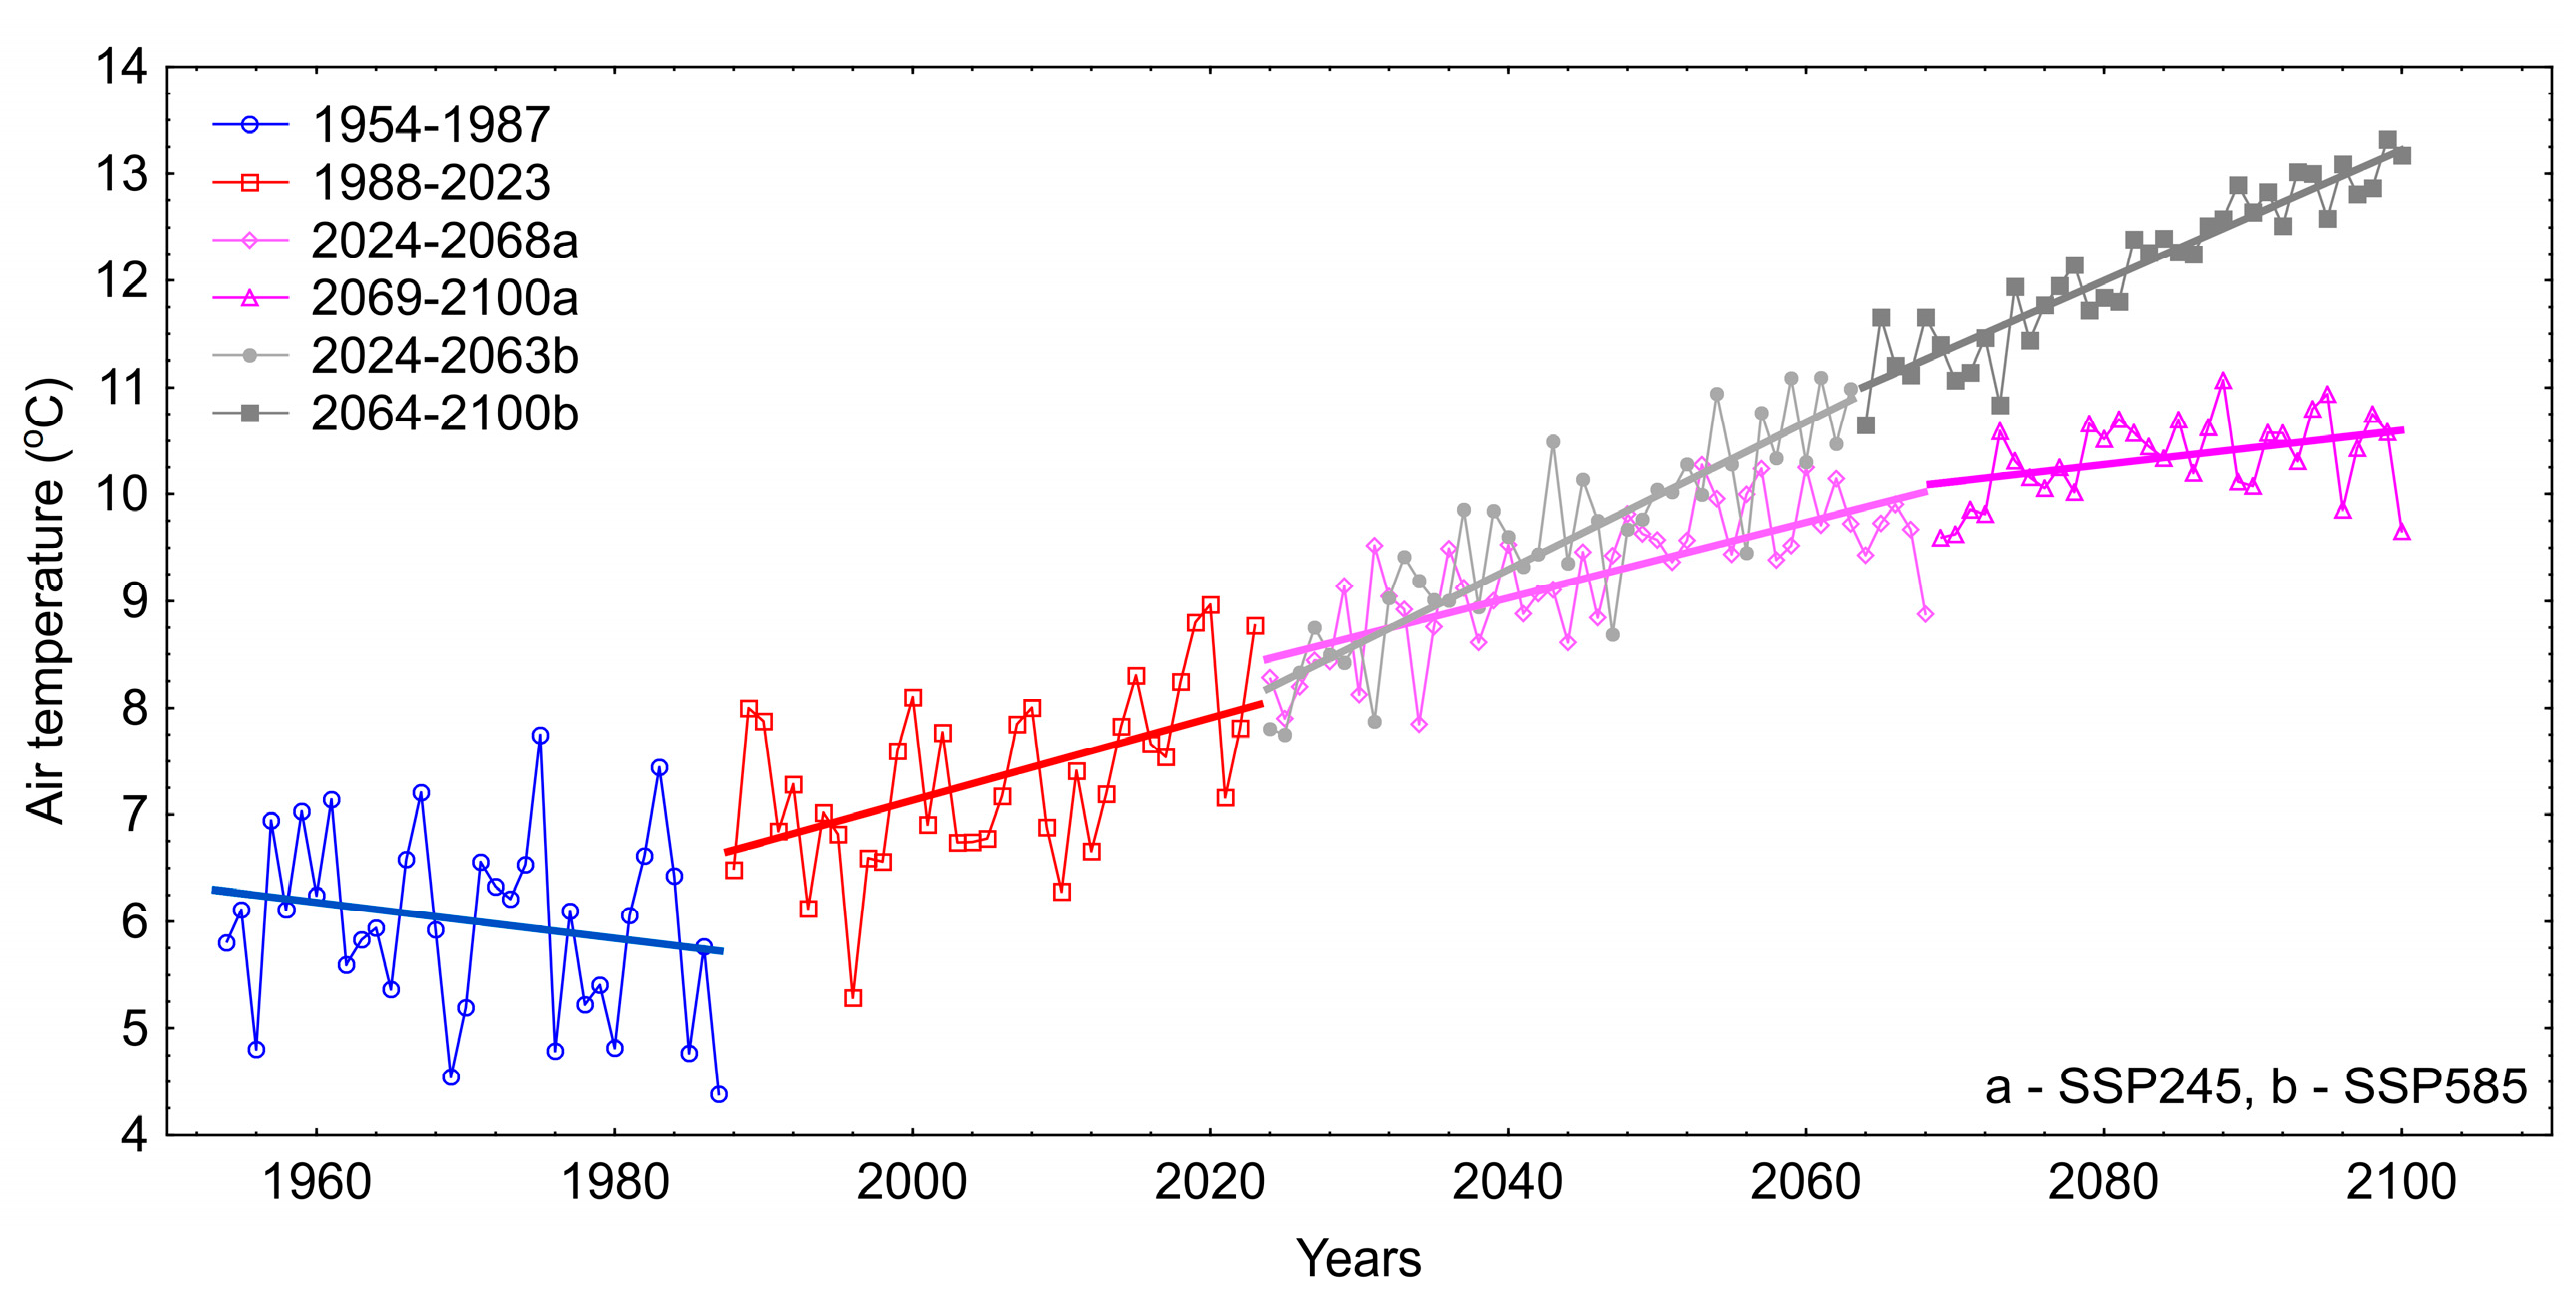
The obtained results indicate that during the period of 1954–2023, the air temperature increased by 0.33 °C per decade. Furthermore, in the future (2024–2100), there will also be an increase in air temperature at average rates of 0.29 and 0.65 °C per decade for SSP245 and SSP585, respectively. However, considering the subperiods determined based on the Pettitt test, it was shown that during the period of 1954–1987, the changes were not statistically significant, while during the period of 1988–2023, the temperature increased at a rate of 0.40 °C per decade. In the future (2024–2068), according to the SSP245 scenario, changes in air temperature will occur at an average rate of 0.35 °C per decade, while in the years 2069–2100, the changes will not be statistically significant. According to the SSP585 scenario, in both periods, there will be an increase in air temperature at rates of 0.66 and 0.59 °C per decade, respectively, for the years 2024–2063 and 2064–2100 (Figure 6).
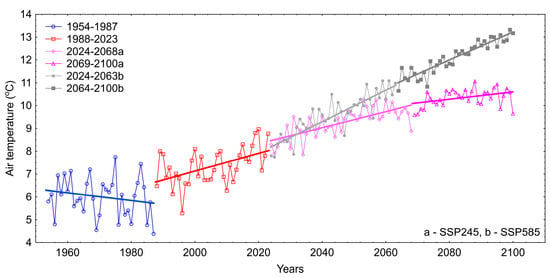
Figure 6.
Long-term changes in average annual air temperatures at the Suwałki station. Scenario SSP245 has been highlighted in pink and SSP585 has been highlighted in gray.
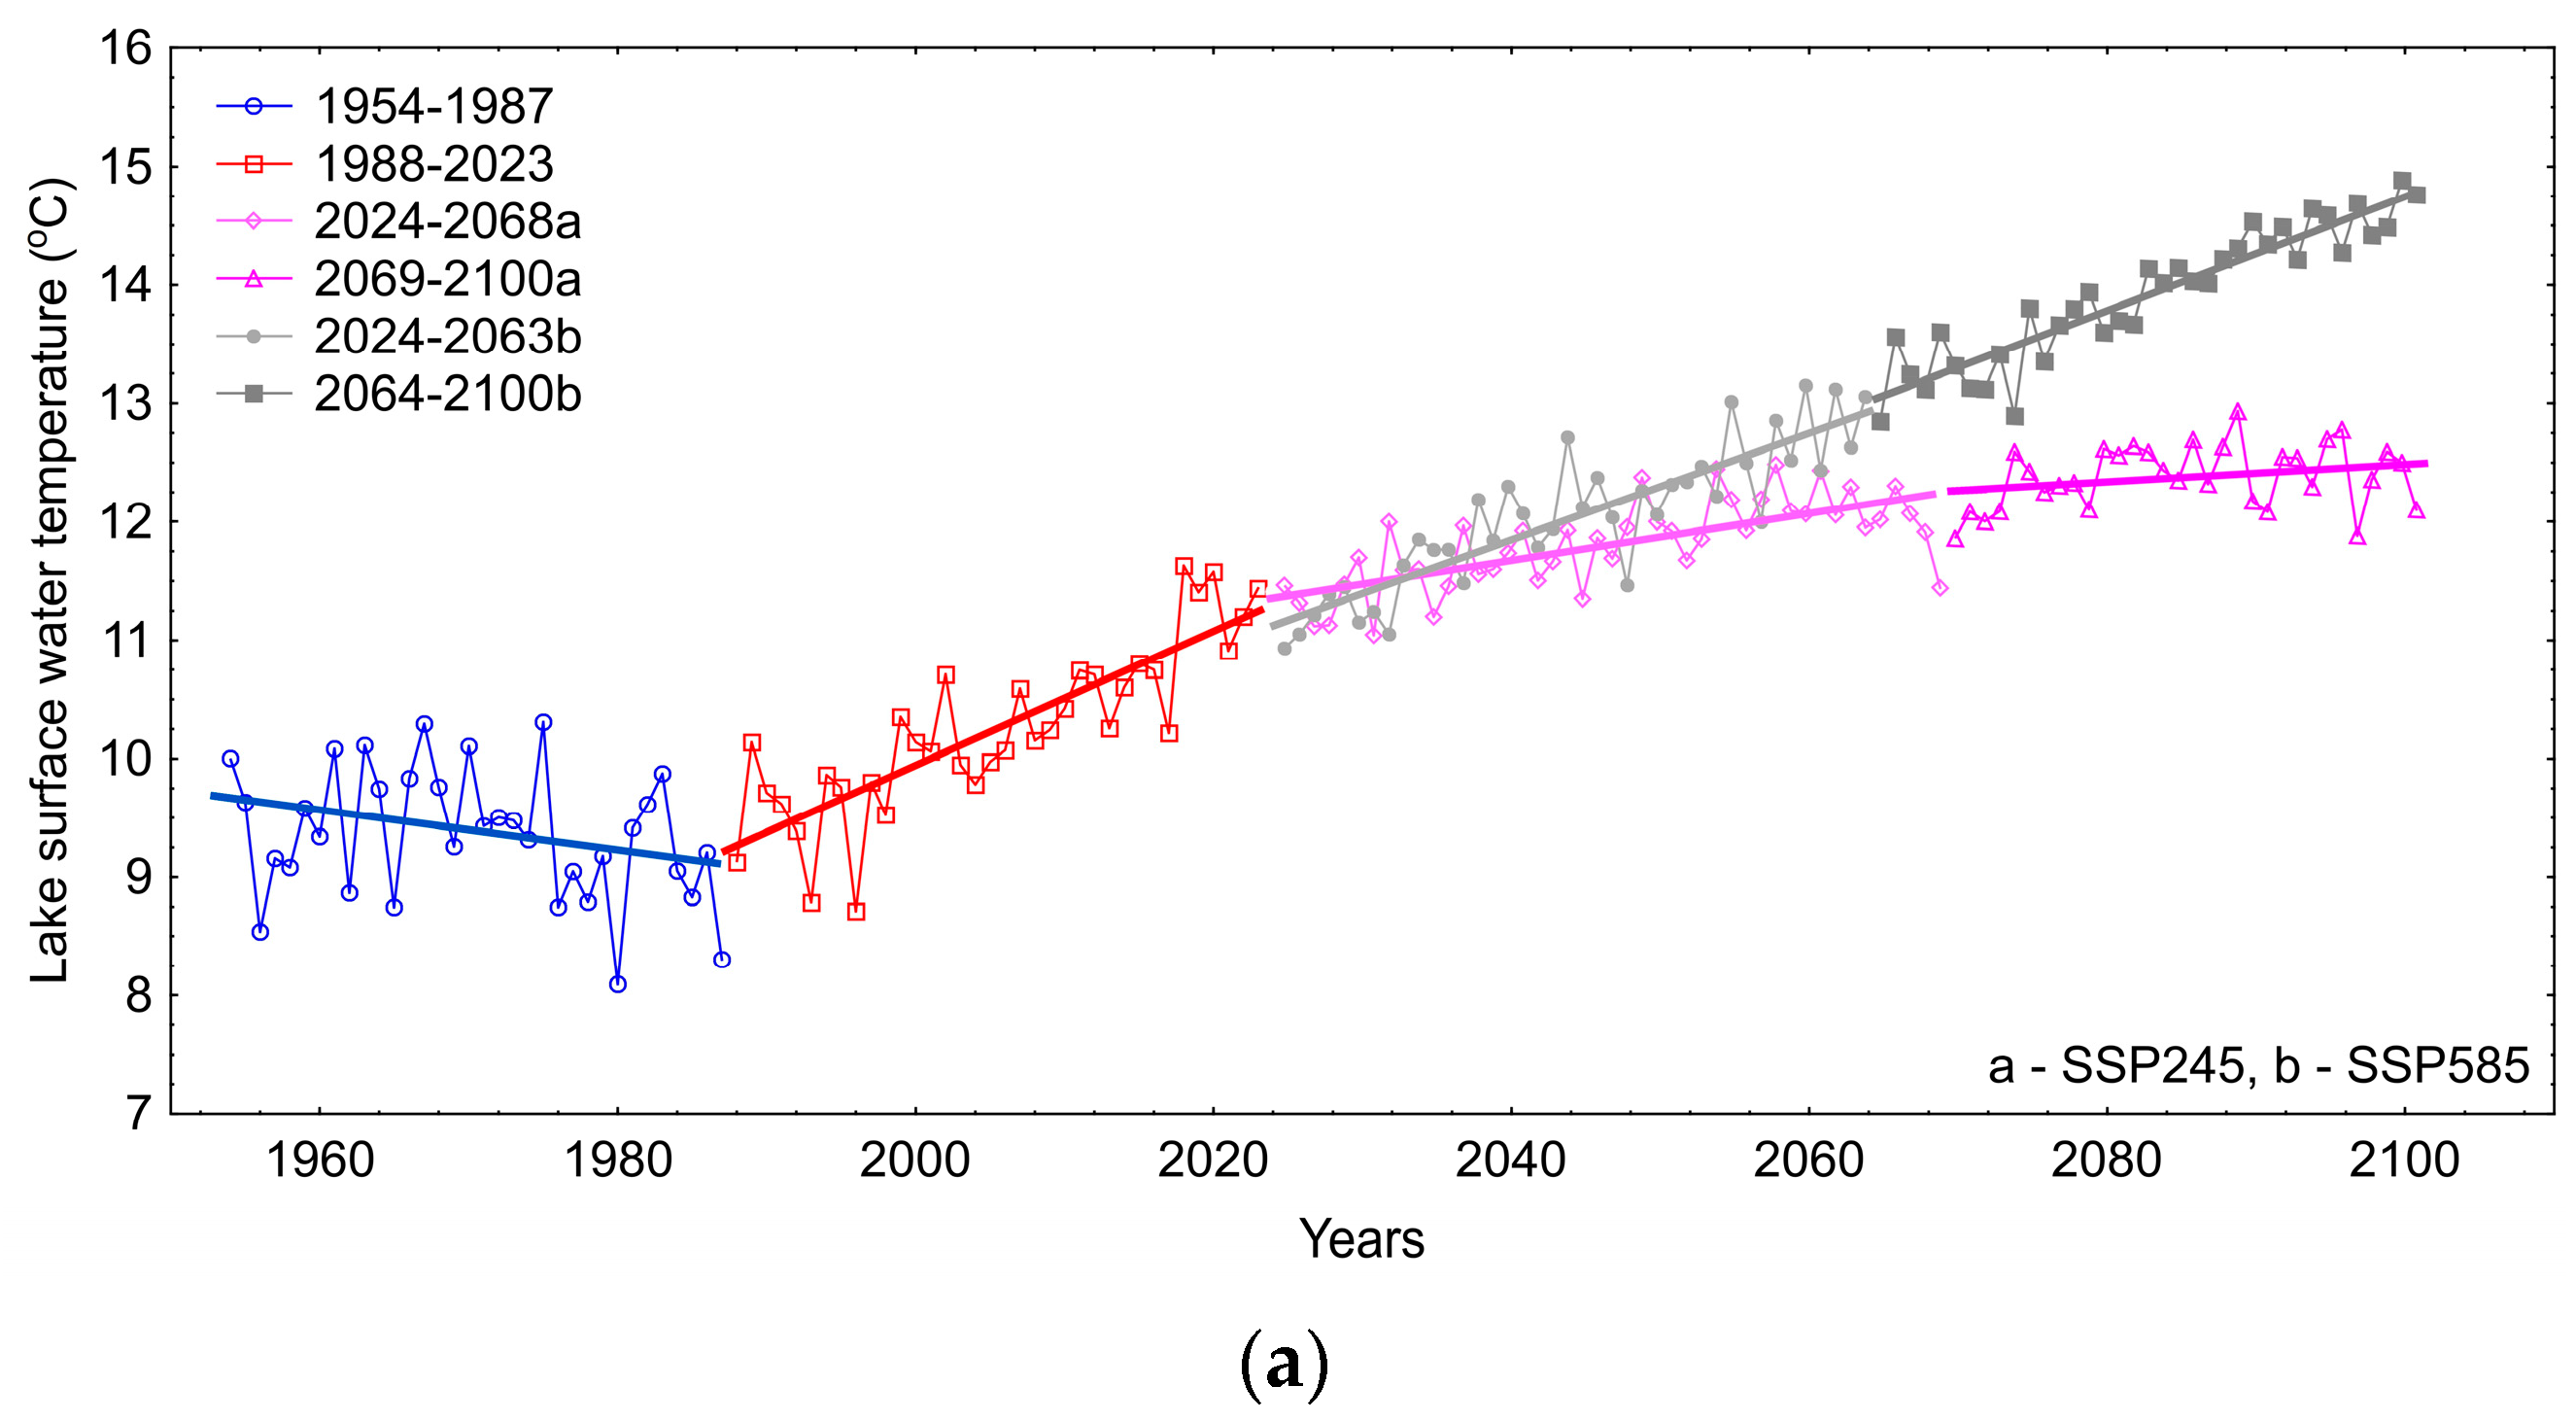
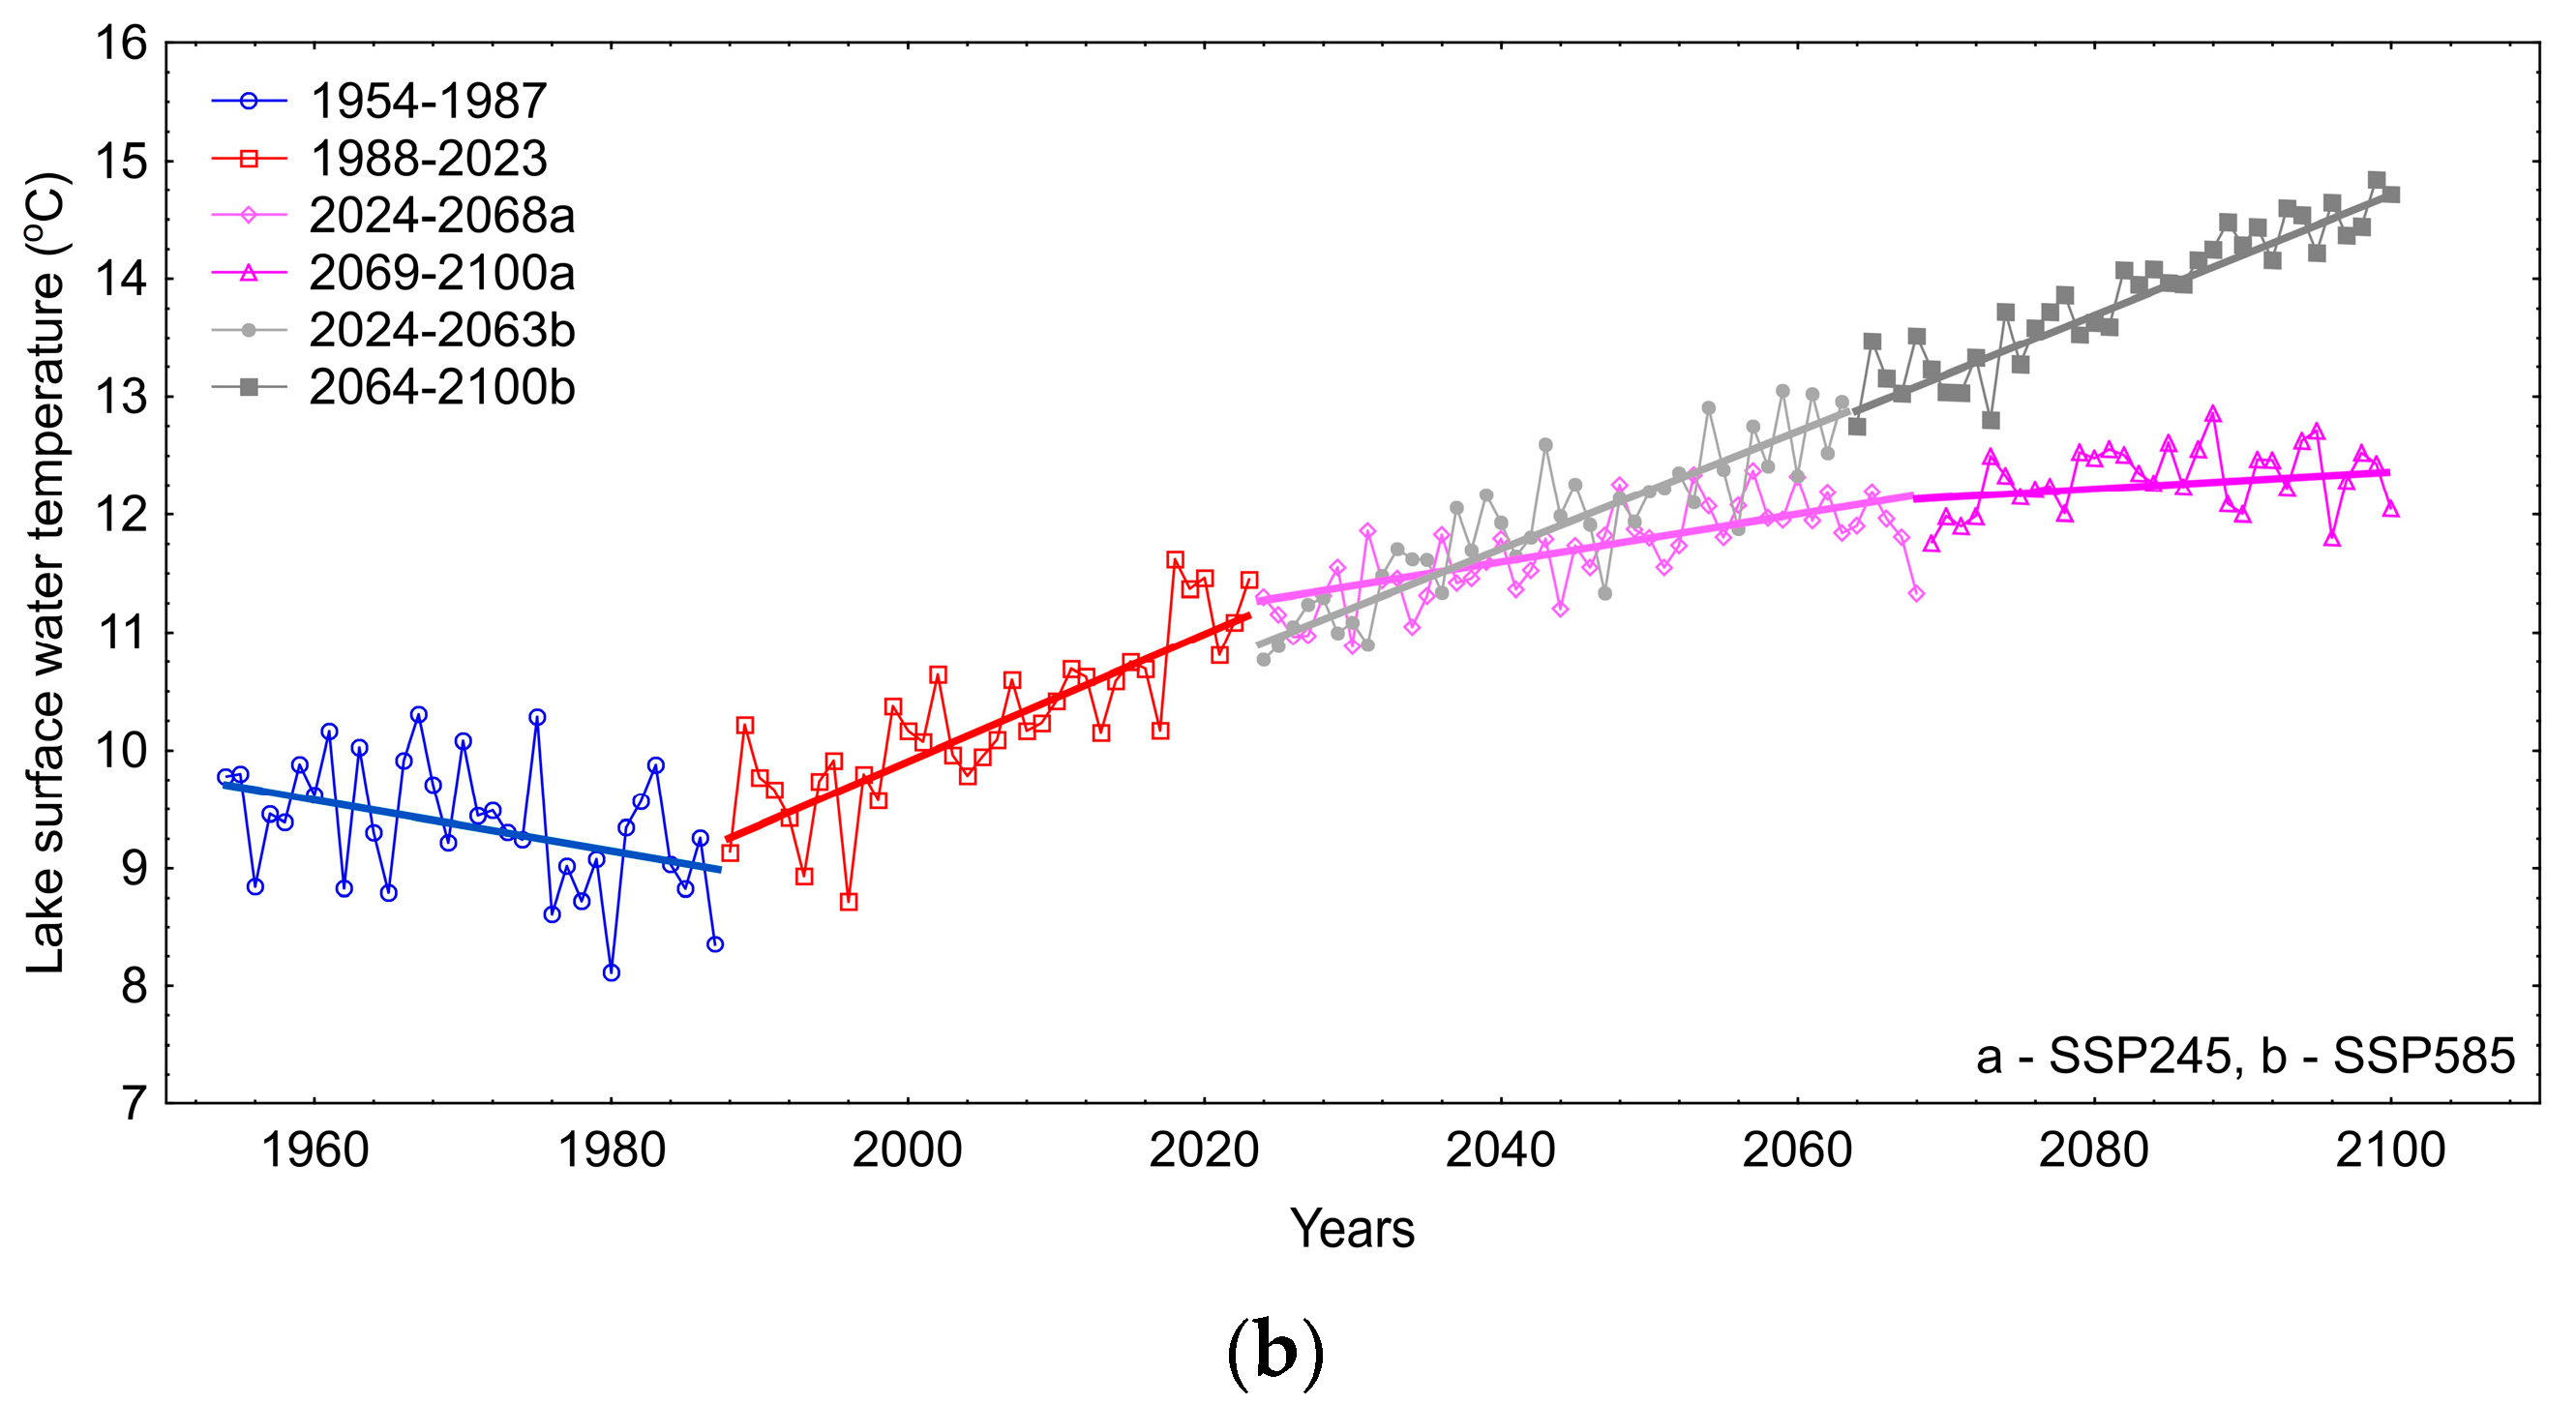
In Lakes Białe Augustowskie and Studzieniczne, a similar pattern of long-term changes in annual water temperatures was observed. In the historical period, the increase was at levels of 0.28 and 0.26 °C per decade, while in the future, according to the SSP245 scenario, it is projected to be 0.22 °C per decade and 0.54 and 0.55 °C per decade according to the SSP585 scenario. During the period from 1954 to 1987, the changes in the average annual water temperatures were not statistically significant. However, during the period from 1988 to 2023, there was an increase in average annual water temperatures in both lakes at rates of 0.55 and 0.49 °C per decade. In the future, further warming of the water in the lakes is expected. According to the SSP245 scenario, the average rates are projected to be 0.26 and 0.13 °C per decade. Greater changes are forecasted according to the SSP585 scenario, at levels exceeding 0.50 °C per decade. The trends in the water temperature changes for Lakes Białe Augustowskie and Studzieniczne are presented in Figure 7.
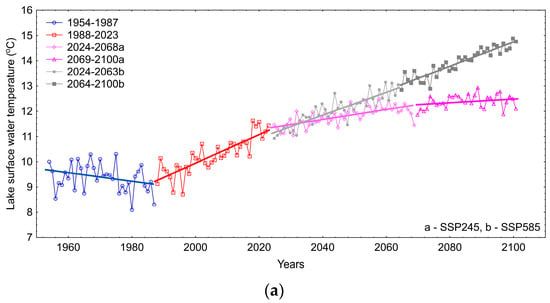
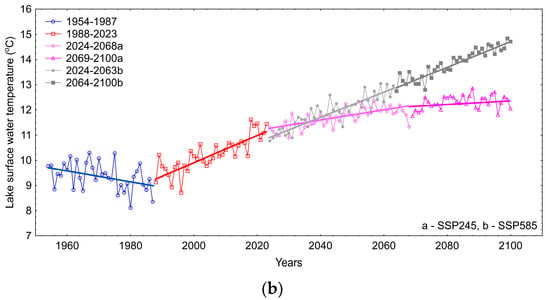
Figure 7.
Long-term changes in average annual water temperatures in Lakes Białe Augustowskie (a) and Studzieniczne (b). Scenario SSP245 has been highlighted in pink and SSP585 has been highlighted in gray.
Considering the average monthly values from 1954 to 2023 in Lake Białe Augustowskie, there was a significant increase in temperature in all months, ranging from 0.09 to 0.50 °C per decade. In Lake Studzieniczne, insignificant changes were observed in February and October, while significant temperature increases were recorded in the remaining months, ranging from 0.08 to 0.49 °C per decade. According to the SSP245 scenario, in Lake Białe Augustowskie, from 2024 to 2100, the changes in March and June will be insignificant, while in April and May, there will be a decrease in water temperature at rates of −0.08 and −0.14 °C per decade. In the remaining months, the water temperature will increase at an average rate ranging from 0.10 to 0.51 °C per decade. In contrast, according to the SSP585 scenario, there will be an increase in water temperatures in all months except May, at rates ranging from 0.15 to 1.14 °C per decade. A similar trend and rate of change will occur in Lake Studzieniczne. The directions and rates of changes in average monthly temperatures during the periods determined by breakpoints based on the Pettitt test are more varied (Tables S2 and S3).
4. Discussion
Water temperature is a key parameter for the processes occurring in aquatic ecosystems [45], and, thus an understanding of its changes in terms of scale and direction constitutes fundamental knowledge regarding both current and future transformations. The analysis conducted in this work aligns with the global trend of research assessing changes in the thermal regimes of lakes [46,47,48]. Numerous studies on this topic indicate the importance of further deepening our understanding, which is continuously being pursued while considering diverse factors. An important element is the inclusion of the longest possible observations of water temperature, providing a more comprehensive picture of the changes that have occurred. The historical analysis showed that significant changes in thermal conditions have taken place in both lakes over the last seven decades. It should be emphasized that these changes are unfavorable, with average annual temperatures in Lake Białe Augustowskie and Lake Studzieniczne being warmer by 1.9 °C and 1.8 °C, respectively. The results correspond to other studies in Europe, in which increases in lake water temperature are also recorded. For example, the interannual water temperature of Lake Balaton, located in Hungary, has risen by 0.7 °C/decade [49]. Pareeth et al. [50] analyzed five lakes in Italy and determined a warming trend during summer of 0.017 °C per year to 0.032 °C per year. The water temperature of Lake Peipsi (Estonia/Russia) has significantly increased in winter over the past decade (~0.5 °C) [51]. It is worth noting that the rate of temperature increase has clearly risen in recent times, averaging 0.55 °C/decade (Białe Augustowskie Lake) and 0.49 °C/decade (Studzieniczne Lake) over the last thirty years. According to the simulations performed, the warming process in both lakes will continue in the future. Depending on the climate change scenario adopted, by the end of the 21st century, the water temperature in Lake Białe Augustowskie will be higher by 1.8 °C (SSP245) or 3.5 °C (SSP285), while in Lake Studzieniczne, it will be warmer by 0.9 °C (SSP245) or 3.5 °C (SSP285). Similar to the historical period, the results for the upcoming decades of the 21st century confirm earlier predictions for other lakes in Europe. As stated by Brkić and Larva [52], the warming trend of water temperature in Vrana Lake (Croatia) from 2023 to 2070 will range from 0.2 °C/decade to 0.3 °C/decade. According to the RCP4.5 scenario, research results for several lakes in Germany have shown that they will warm by 0.10 to 0.11 °C/decade by the year 2100, representing 75% to 90% of the projected trend in air temperature [53].
As previously indicated, temperature is a fundamental parameter of water, directly or indirectly influencing the processes occurring in lakes. The decline of fish in Lake Võrtsjärv (Estonia) was triggered by a combination of consecutive and concurrent extreme water parameters, such as high water temperature, pH, and NH4-N [54]. The increase in water temperature in Lake Pyhäselkä (Finland) has favored perch populations, and in the future, warming may benefit zander [55]. Changes will occur in the mixing and retention times of lakes in Austria due to rising water temperatures [56]. Furthermore, modeling studies of lakes in Germany indicate that climate warming will lead to an extension of summer stratification, which will, in turn, result in a decrease in oxygen levels in the hypolimnetic zone [57]. Due to their morphometric parameters, both lakes analyzed in the article exhibit dimictic characteristics, with thermal stratification developing during the summer. Thus, it can be assumed that the changes related to water circulation and mixing will be similar to those described above for the lakes analyzed in this study. Research on four lakes in the discussed region (including Lake Białe Augustowskie and Lake Studzieniczne) demonstrates that the oxygen concentration in the hypolimnion rapidly decreased during thermal stratification. The early emergence of oxygen deficits indicates the eutrophic nature of the lakes [58]. The level of dissolved oxygen in water is crucial for living organisms, and also for the water quality itself [59]. Future changes in the thermal regimes of both lakes will therefore pose an important challenge in minimizing the impacts of climate change, particularly in the context of maintaining the high tourist values that both lakes provide in the region. One possibility for cooling surface waters is through the implementation of artificial destratification, as evidenced by studies on Santo Anastácio Lake, in Brazil [60]. While this concept is theoretically viable for mitigating future warming, its practical implementation would require comprehensive interdisciplinary studies. These would need to consider factors like water quality, hydrology, and hydrobiology, along with the economic feasibility of such solutions. Moreover, the economic factor will be of key importance. More broadly, this also highlights the scale of changes occurring in lakes in Poland with similar morphometric characteristics, both in relation to a relatively stable period concerning thermal changes (until the late 1980s) and in terms of the evident warming in the later period, which is expected to continue in the future. This knowledge can serve as a starting point when considering management plans for these ecosystems.
Based on the study by Piccolroaz et al. [28], the main limitation of the air2water model is that it does not directly take into account the effects of external forcing other than air temperature, such as wind speed, solar radiation, and humidity. In addition, the model does not take into account water transparency, which can affect the depth of the surface mixed layer. The model’s parameter values depend on lake conditions and climatic conditions during the calibration period. It was also confirmed that the model is able to explain much of the variability in water temperatures using air temperature alone, according to which the lake and climate conditions differ from those in the calibration period. It should be noted that the uncertainty that arises may be due to other factors not taken into account beyond the air temperature warming itself.
While analyzing the model outputs, we observed a tendency for the climate models to overestimate lower temperature values, particularly during the winter months. This bias is common in climate models and can affect the accuracy of projections for specific temperature ranges. To address this, we applied Empirical Quantile Mapping (EQM) as a bias correction technique. EQM adjusts the modeled data to better align with the observed temperature distribution by mapping the modeled quantiles to the observed quantiles. This approach effectively reduces systematic errors across the temperature spectrum. Despite the bias correction, some residual overestimation of low temperatures remains, especially at the lower end of the temperature distribution. However, the overall impact of this bias on our key results is minimal. The primary focus of our study is on long-term trends in water temperature under future climate scenarios, in which the projected warming is the dominant signal. The bias observed at low temperatures does not significantly affect these long-term warming projections. Consequently, the corrected model outputs still provide robust estimates of future temperature trends, allowing for reliable projections of how the thermal regimes of the lakes will evolve under different climate change scenarios.
5. Conclusions
Lakes, as important components of the hydrosphere, are undergoing transformation as a result of global warming. A key parameter is water temperature, on which most of the processes occurring in these ecosystems depend. The assessment of the direction and scale of these changes depends on data availability, particularly the length of the data series. This study analyzes the thermal regime of the two lakes in Poland that have the longest monitoring records of water temperature. It was established that from 1954 to 2023, there was an increase in the average annual water temperature in Lake Białe Augustowskie and Lake Studzieniczne. Importantly, a radical change in the trend of water temperature changes occurred in the late 1980s, which is in line with related research. Over the last few decades, the increase has been at a rate of 0.5 °C per decade. What is next? By the end of the 21st century, the increase in water temperature, under the SSP585 scenario, is expected to maintain a similar level. Based on the results obtained, both historically and in the context of future forecasts, these changes should be regarded as worrying. Considering the fundamental significance of water temperature, both lakes will undergo transformation, with the changes in water quality posing challenges for the authorities responsible for water management.
Supplementary Materials
The following supporting information can be downloaded at: https://www.mdpi.com/article/10.3390/resources13110149/s1, Table S1: Trend analysis results for Suwałki meteorological station, Table S2. Trend analysis results for Białe Augustowskie Lake, Table S3. Trend analysis results for Studzieniczne Lake.
Author Contributions
Conceptualization, M.P.; methodology, M.S., T.A. and M.P.; software, M.S. and T.A.; validation, M.S., T.A. and M.P.; formal analysis, M.P., M.S. and T.A.; investigation, M.P., M.S. and T.A.; resources, M.P., M.S. and T.A.; writing—original draft preparation, M.P., M.S. and T.A.; writing—review and editing, M.P., M.S. and T.A.; visualization, M.P., M.S. and T.A.; supervision, M.P.; project administration, M.P.; funding acquisition, M.P. All authors have read and agreed to the published version of the manuscript.
Funding
This research received no external funding.
Data Availability Statement
https://danepubliczne.imgw.pl/ (accessed on 9 August 2024).
Conflicts of Interest
The authors declare no conflicts of interest.
References
- Adrian, R.; O’Reilly, C.M.; Zagarese, H.; Baines, S.B.; Hessen, D.O.; Keller, W.; Livingstone, D.M.; Sommaruga, R.; Straile, D.; Van Donk, E.; et al. Lakes as sentinels of climate change. Limnol. Oceanogr. 2009, 54, 2283–2297. [Google Scholar] [CrossRef]
- van Vliet, M.T.H.; Franssen, W.H.P.; Yearsley, J.R.; Ludwig, F.; Haddeland, I.; Lettenmaier, D.P.; Kabat, P. Global river discharge and water temperature under climate change. Glob. Environ. Change 2013, 23, 450–464. [Google Scholar] [CrossRef]
- Ptak, M.; Wrzesiński, D.; Choiński, A. Long-term changes in the hydrological regime of high mountain lake Morskie Oko (Tatra Mountains, Central Europe). J. Hydrol. Hydromech. 2017, 65, 146–153. [Google Scholar] [CrossRef]
- Robertson, D.M.; Ragotzkie, R.A. Changes in the thermal structure of moderate to large sized lakes in response to changes in air temperature. Aquat. Sci. 1990, 52, 360–380. [Google Scholar] [CrossRef]
- Aranda, A.C.; Rivera-Ruiz, D.; Rodríguez-López, L.; Pedreros, P.; Arumí-Ribera, J.L.; Morales-Salinas, L.; Fuentes-Jaque, G.; Urrutia, R. Evidence of Climate Change Based on Lake Surface Temperature Trends in South Central Chile. Remote Sens. 2021, 13, 4535. [Google Scholar] [CrossRef]
- Desgué-Itier, O.; Melo Vieira Soares, L.; Anneville, O.; Bouffard, D.; Chanudet, V.; Danis, P.A.; Domaizon, I.; Guillard, J.; Mazure, T.; Sharaf, N.; et al. Past and future climate change effects on the thermal regime and oxygen solubility of four peri-alpine lakes. Hydrol. Earth Syst. Sci. 2023, 27, 837–859. [Google Scholar] [CrossRef]
- Komatsu, E.; Fukushima, T.; Harasawa, H. A modeling approach to forecast the effect of long-term climate change on lake water quality. Ecol. Model. 2007, 209, 351–366. [Google Scholar] [CrossRef]
- Dibike, Y.; Marshall, R.; de Rham, L. Climatic sensitivity of seasonal ice-cover, water temperature and biogeochemical cycling in Lake 239 of the Experimental Lakes Area (ELA), Ontario, Canada. Ecol. Model. 2024, 489, 110621. [Google Scholar] [CrossRef]
- Zhu, W.; You, X.-Y.; Duan, Z.-P.; Lü, Y.; Hou, H. Changes in the Water Quality and Its Responses to Temperature and Water Level in Xukou Bay of Lake Taihu during 2016–2022. J. Ecol. Rural Environ. 2024, 40, 469–477. [Google Scholar]
- Elliott, J.A.; Jones, I.D.; Thackeray, S.J. Testing the sensitivity of phytoplankton communities to changes in water temperature and nutrient load, in a temperate lake. Hydrobiologia 2006, 559, 401–411. [Google Scholar] [CrossRef]
- Bayable, G.; Cai, J.; Mekonnen, M.; Legesse, S.A.; Ishikawa, K.; Sato, S.; Kuwahara, V.S. Spatiotemporal variability of lake surface water temperature and water quality parameters and its interrelationship with water hyacinth biomass in Lake Tana, Ethiopia. Environ. Sci. Pollut. Res. 2024, 31, 45929–45953. [Google Scholar] [CrossRef] [PubMed]
- Ayala, A.I.; Eyto, E.; Jennings, E.; Goyette, S.; Pierson, D.C. Global warming will change the thermal structure of Lough Feeagh, a sentinel lake in the irish landscape, by the end of the twenty-first century. Biol. Environ. 2023, 123B, 145–163. [Google Scholar] [CrossRef]
- Piccolroaz, S.; Woolway, R.I.; Merchant, C.J. Global reconstruction of twentieth century lake surface water temperature reveals different warming trends depending on the climatic zone. Clim Change 2020, 160, 427–442. [Google Scholar] [CrossRef]
- Ptak, M.; Zhu, S.; Amnuaylojaroen, T.; Li, H.; Szyga-Pluta, K.; Jiang, S.; Wang, L.; Sojka, M. Utilizing Multi-Source datasets for the Reconstruction and Prediction of water temperature in Lake Miedwie (Poland). Remote Sens. 2024, 16, 2753. [Google Scholar] [CrossRef]
- Ptak, M.; Sojka, M.; Choiński, A.; Nowak, B. Effect of environmental conditions and morphometric parameters on surface water temperature in Polish lakes. Water 2018, 10, 580. [Google Scholar] [CrossRef]
- Ptak, M.; Sojka, M.; Nowak, B. Effect of climate warming on a change in thermal and ice conditions in the largest lake in Poland—Lake Śniardwy. J. Hydrol. Hydrodyn. 2020, 68, 260–270. [Google Scholar] [CrossRef]
- Jańczak, J. (Ed.) Atlas Jezior Polski. T. 3, Jeziora Pojezierza Mazurskiego i Polski Południowej; Wydawnictwo Naukowe: Poznań, Poland, 1999. [Google Scholar]
- Kendall, M.G.; Stuart, A. The Advanced Theory of Statistics, 3rd ed.; Charles Griffin Ltd.: Cheshire, UK, 1968. [Google Scholar]
- Gilbert, R.O. Statistical Methods for Environmental Pollution Monitorin; Van Nos-trand Reinhold Co.: New York, NY, USA, 1987. [Google Scholar]
- Yue, S.; Pilon, P.; Phinney, B.; Cavadias, G. The influence of autocorrelation on the ability to detect trend in hydrological series. Hydrol. Process. 2002, 16, 1807–1829. [Google Scholar] [CrossRef]
- Patakamuri, S.K.; O’Brien, N. Modified Versions of Mann Kendall and Spearman’s Rho Trend Tests, Version 1.6; 13 October 2022. Available online: https://cran.r-project.org/web/packages/modifiedmk/modifiedmk.pdf (accessed on 31 August 2024).
- Pohlert, T. Non-Parametric Trend Tests and Change-Point Detection, Version 1.1.6; 10 October 2023. Available online: https://cran.r-project.org/web/packages/trend/trend.pdf (accessed on 31 August 2024).
- Piccolroaz, S.; Toffolon, M.; Majone, B. A simple lumped model to convert air temperature into surface water temperature in lakes. Hydrol. Earth Syst. Sci. 2013, 17, 3323–3338. [Google Scholar] [CrossRef]
- Toffolon, M.; Piccolroaz, S. A hybrid model for river water temperature as a function of air temperature and discharge. Environ. Res. Lett. 2015, 10, 114011. [Google Scholar] [CrossRef]
- Piccolroaz, S.; Healey, N.C.; Lenters, J.D.; Schladow, S.G.; Hook, S.J.; Sahoo, G.B.; Toffolon, M. On the predictability of lake surface temperature using air temperature in a changing climate: A case study for Lake Tahoe (USA). Limnol. Oceanogr. 2018, 63, 243–261. [Google Scholar] [CrossRef]
- Toffolon, M.; Piccolroaz, S.; Majone, B.; Soja, A.M.; Peeters, F.; Schmid, M.; Wüest, A. Prediction of surface temperature in lakes with different morphology using air temperature. Limnol. Oceanogr. 2014, 59, 2185–2202. [Google Scholar] [CrossRef]
- Piccolroaz, S. Prediction of lake surface temperature using the air2water model: Guidelines, challenges, and future perspectives. Adv. Oceanogr. Limnol. 2016, 7, 1. [Google Scholar] [CrossRef]
- O’Neill, B.C.; Tebaldi, C.; van Vuuren, D.P.; Eyring, V.; Friedlingstein, P.; Hurtt, G.; Knutti, R.; Kriegler, E.; Lamarque, J.F.; Lowe, J.; et al. The Scenario Model Intercomparison Project (ScenarioMIP) for CMIP6. Geosci. Model Dev. 2016, 9, 3461–3482. [Google Scholar] [CrossRef]
- Riahi, K.; van Vuuren, D.P.; Kriegler, E.; Edmonds, J.; O’Neill, B.C.; Fujimori, S.; Bauer, N.; Calvin, K.; Dellink, R.; Fricko, O.; et al. The Shared Socioeconomic Pathways and their energy, land use, and greenhouse gas emissions implications: An overview. Glob. Environ. Change 2017, 42, 153–168. [Google Scholar] [CrossRef]
- Seland, Ø.; Bentsen, M.; Olivié, D.; Toniazzo, T.; Gjermundsen, A.; Graff, L.S.; Debernard, J.B.; Gupta, A.K.; He, Y.-C.; Kirkevåg, A.; et al. Overview of the Norwegian Earth System Model (NorESM2) and key climate response of CMIP6 DECK, historical, and scenario simulations. Geosci. Model Dev. 2020, 13, 6165–6200. [Google Scholar] [CrossRef]
- Müller, W.A.; Jungclaus, J.H.; Mauritsen, T.; Baehr, J.; Bittner, M.; Budich, R.; Bunzel, F.; Esch, M.; Ghosh, R.; Haak, H.; et al. A higher-resolution version of the Max Planck Institute Earth System Model (MPI-ESM1.2-HR). J. Adv. Model. Earth Syst. 2018, 10, 1383–1413. [Google Scholar] [CrossRef]
- Döscher, R.; Acosta, M.; Alessandri, A.; Anthoni, P.; Arneth, A.; Arsouze, T.; Bergmann, T.; Bernadello, R.; Bousetta, S.; Caron, L.P.; et al. The EC-Earth3 Earth system model for the Climate Model Intercomparison Project 6. Geosci. Model Dev. Discuss. 2021, 2021, 1–90. [Google Scholar]
- Semmler, T.; Danilov, S.; Gierz, P.; Goessling, H.F.; Hegewald, J.; Hinrichs, C.; Koldunov, N.; Khosravi, N.; Mu, L.; Rackow, T.; et al. Simulations for CMIP6 with the AWI climate model AWI-CM-1-1. J. Adv. Model. Earth Syst. 2020, 12, e2019MS002009. [Google Scholar] [CrossRef]
- Xin, X.; Wu, T.-W.; Zhang, J.; Zhang, F.; Li, W.-P.; Zhang, Y.-W.; Lu, Y.-X.; Fang, Y.-J.; Jie, W.-H.; Zhang, L.; et al. Introduction of BCC models and its participation in CMIP6. Adv. Clim. Change Res. 2019, 15, 533. [Google Scholar]
- Yukimoto, S.; Kawai, H.; Koshiro, T.; Oshima, N.; Yoshida, K.; Urakawa, S.; Tsujino, H.; Deushi, M.; Tanaka, T.; Hosaka, M.; et al. The Meteorological Research Institute Earth System Model version 2.0, MRI-ESM2.0: Description and basic evaluation of the physical component. J. Meteorol. Soc. Jpn. Ser. II 2019, 97, 931–965. [Google Scholar] [CrossRef]
- Dunne, J.P.; Horowitz, L.W.; Adcroft, A.J.; Ginoux, P.; Held, I.M.; John, J.G.; Krasting, J.P.; Malyshev, S.; Naik, V.; Paulot, F.; et al. The GFDL Earth System Model ver-sion 4.1 (GFDL-ESM 4.1): Overall coupled model description and simulation characteristics. J. Adv. Model. Earth Syst. 2020, 12, e2019MS002015. [Google Scholar] [CrossRef]
- Lauritzen, P.H.; Nair, R.D.; Herrington, A.R.; Callaghan, P.; Goldhaber, S.; Dennis, J.M.; Bacmeister, J.T.; Eaton, B.E.; Zarzycki, C.M.; Taylor, M.A.; et al. NCAR release of CAM-SE in CESM2.0: A reformulation of the spectral element dynamical core in dry-mass ver-tical coordinates with comprehensive treatment of condensates and energy. J. Adv. Model. Earth Syst. 2018, 10, 1537–1570. [Google Scholar] [CrossRef]
- Cherchi, A.; Fogli, P.G.; Lovato, T.; Peano, D.; Iovino, D.; Gualdi, S.; Masina, S.; Scoccimarro, E.; Materia, S.; Bellucci, A.; et al. Global mean climate and main patterns of variability in the CMCC-CM2 coupled model. J. Adv. Model. Earth Syst. 2019, 11, 185–209. [Google Scholar] [CrossRef]
- Hoeting, J.A.; Madigan, D.; Raftery, A.E.; Volinsky, C.T. Bayesian model averaging: A tutorial. Stat. Sci. 1999, 14, 382–417. [Google Scholar]
- Cover, T.M.; Hart, P.E. Nearest Neighbor Pattern Classification. IEEE Trans. Inf. Theory 1967, 13, 21–27. [Google Scholar] [CrossRef]
- Panofsky, H.A.; Brier, G.W. Some Applications of Statistics to Meteorology; Mineral Industries Extension Services, College of Mineral Industries; Pennsylvania State University: University Park, TX, USA, 1958. [Google Scholar]
- Gudmundsson, L.; Bremnes, J.B.; Haugen, J.E.; Engen-Skaugen, T. Downscaling RCM precipitation to the station scale using statistical transformations—A comparison of methods. Hydrol. Earth Syst. Sci. 2012, 16, 3383–3390. [Google Scholar] [CrossRef]
- Pettitt, A.N. A non-parametric approach to the changepoint problem. Appl. Stat. 1979, 28, 126–135. [Google Scholar] [CrossRef]
- Zhu, S.; Ptak, M.; Sojka, M.; Piotrowski, A.P.; Luo, W. A simple approach to estimate lake surface water temperatures in Polish lowland lakes. J. Hydrol. Reg. Stud. 2023, 48, 101468. [Google Scholar] [CrossRef]
- Ptak, M. Long-term temperature fluctuations in rivers of the Fore-Sudetic region in Poland. Geografie 2018, 123, 279–294. [Google Scholar] [CrossRef]
- Dobiesz, N.E.; Lester, N.P. Changes in mid-summer water temperature and clarity across the Great Lakes between 1968 and 2002. J. Great Lakes Res. 2009, 35, 371–384. [Google Scholar] [CrossRef]
- Haddout, S.; Priya, K.L.; Boko, H. Thermal response of Moroccan lakes to climatic warming: First results. Ann. Limnol. Int. J. Limnol. 2018, 54, 2. [Google Scholar] [CrossRef]
- Zhu, S.; Ptak, M.; Choiński, A.; Wu, S. Exploring and quantifying the impact of climate change on surface water temperature of a high mountain lake in Central Europe. Environ. Monit. Assess. 2020, 192, 7. [Google Scholar] [CrossRef] [PubMed]
- Li, H.; Somogyi, B.; Tóth, V. Exploring spatiotemporal features of surface water temperature for Lake Balaton in the 21st century based on Google Earth Engine. J. Hydrol. 2024, 640, 131672. [Google Scholar] [CrossRef]
- Pareeth, S.; Bresciani, M.; Buzzi, F.; Leoni, B.; Lepori, F.; Ludovisi, A.; Morabito, G.; Adrian, R.; Neteler, M.; Salmaso, N. Warming trends of perialpine lakes from homogenised time series of historical satellite and in-situ data. Sci. Total Environ. 2017, 578, 417–426. [Google Scholar] [CrossRef] [PubMed]
- Öğlü, B.; Möls, T.; Kaart, T.; Cremona, F.; Kangur, K. Parameterization of surface water temperature and long-term trends in Europe’s fourth largest lake shows recent and rapid warming in winter. Limnologica 2020, 82, 125777. [Google Scholar] [CrossRef]
- Brkić, Z.; Larva, O. Impact of climate change on the Vrana Lake surface water temperature in Croatia using support vector regression. J. Hydrol. Reg. Stud. 2024, 54, 101858. [Google Scholar] [CrossRef]
- Shatwell, T.; Thiery, W.; Kirillin, G. Future projections of temperature and mixing regime of European temperate lakes. Hydrol. Earth Syst. Sci. 2019, 23, 1533–1551. [Google Scholar] [CrossRef]
- Kangur, K.; Ginter, K.; Kangur, P.; Kangur, A.; Nõges, P.; Laas, A. Changes in water temperature and chemistry preceding a massive kill of bottom-dwelling fish: An analysis of high-frequency buoy data of shallow Lake Võrtsjärv (Estonia). Inland Waters 2016, 6, 535–542. [Google Scholar] [CrossRef]
- Voutilainen, A.; Huuskonen, H. Long-term changes in the water quality and fish community of a large boreal lake affected by rising water temperatures and nutrient-rich sewage discharges—With special emphasis on the European perch. Knowl. Manag. Aquat. Ecosyst. 2010, 397, 3. [Google Scholar] [CrossRef][Green Version]
- Dokulil, M.T. Predicting summer surface water temperatures for large Austrian lakes in 2050 under climate change scenarios. Hydrobiologia 2014, 731, 19–29. [Google Scholar] [CrossRef]
- Schwefel, R.; Nkwalale, L.G.T.; Jordan, S.; Rinke, K.; Hupfer, M. Temperatures and hypolimnetic oxygen in German lakes: Observations, future trends and adaptation potential. Ambio 2024. [Google Scholar] [CrossRef] [PubMed]
- Biedka, P. Sezonowe zmiany stężenia tlenu i potencjału oksydoredukcyjnego w hypolimnionach wybranych jezior Pojezierza Suwalsko-Augustowskiego. Infrastrukt. I Ekol. Teren. Wiej. 2012, 3, 225–232. [Google Scholar]
- Ptak, M.; Nowak, B. Variability of oxygen-thermal conditions in selected lakes in Poland. Ecol. Chem. Eng. S 2016, 23, 639–650. [Google Scholar] [CrossRef]
- Lima Neto, I.E. Impact of artificial destratification on water availability of reservoirs in the Brazilian semiarid. An. Acad. Bras. Ciênc. 2019, 91, e20171022. [Google Scholar] [CrossRef] [PubMed]
Disclaimer/Publisher’s Note: The statements, opinions and data contained in all publications are solely those of the individual author(s) and contributor(s) and not of MDPI and/or the editor(s). MDPI and/or the editor(s) disclaim responsibility for any injury to people or property resulting from any ideas, methods, instructions or products referred to in the content. |
© 2024 by the authors. Licensee MDPI, Basel, Switzerland. This article is an open access article distributed under the terms and conditions of the Creative Commons Attribution (CC BY) license (https://creativecommons.org/licenses/by/4.0/).

