
Utilization of Biomass Waste at Water Treatment
 , , ,
, , ,  and
and
Abstract
:1. Introduction
2. Materials and Methods
2.1. Pre-Treatment of Natural Adsorbents
2.2. Activated Carbon Production
2.3. Adsorbent Characterization
2.4. Dyes Adsorption
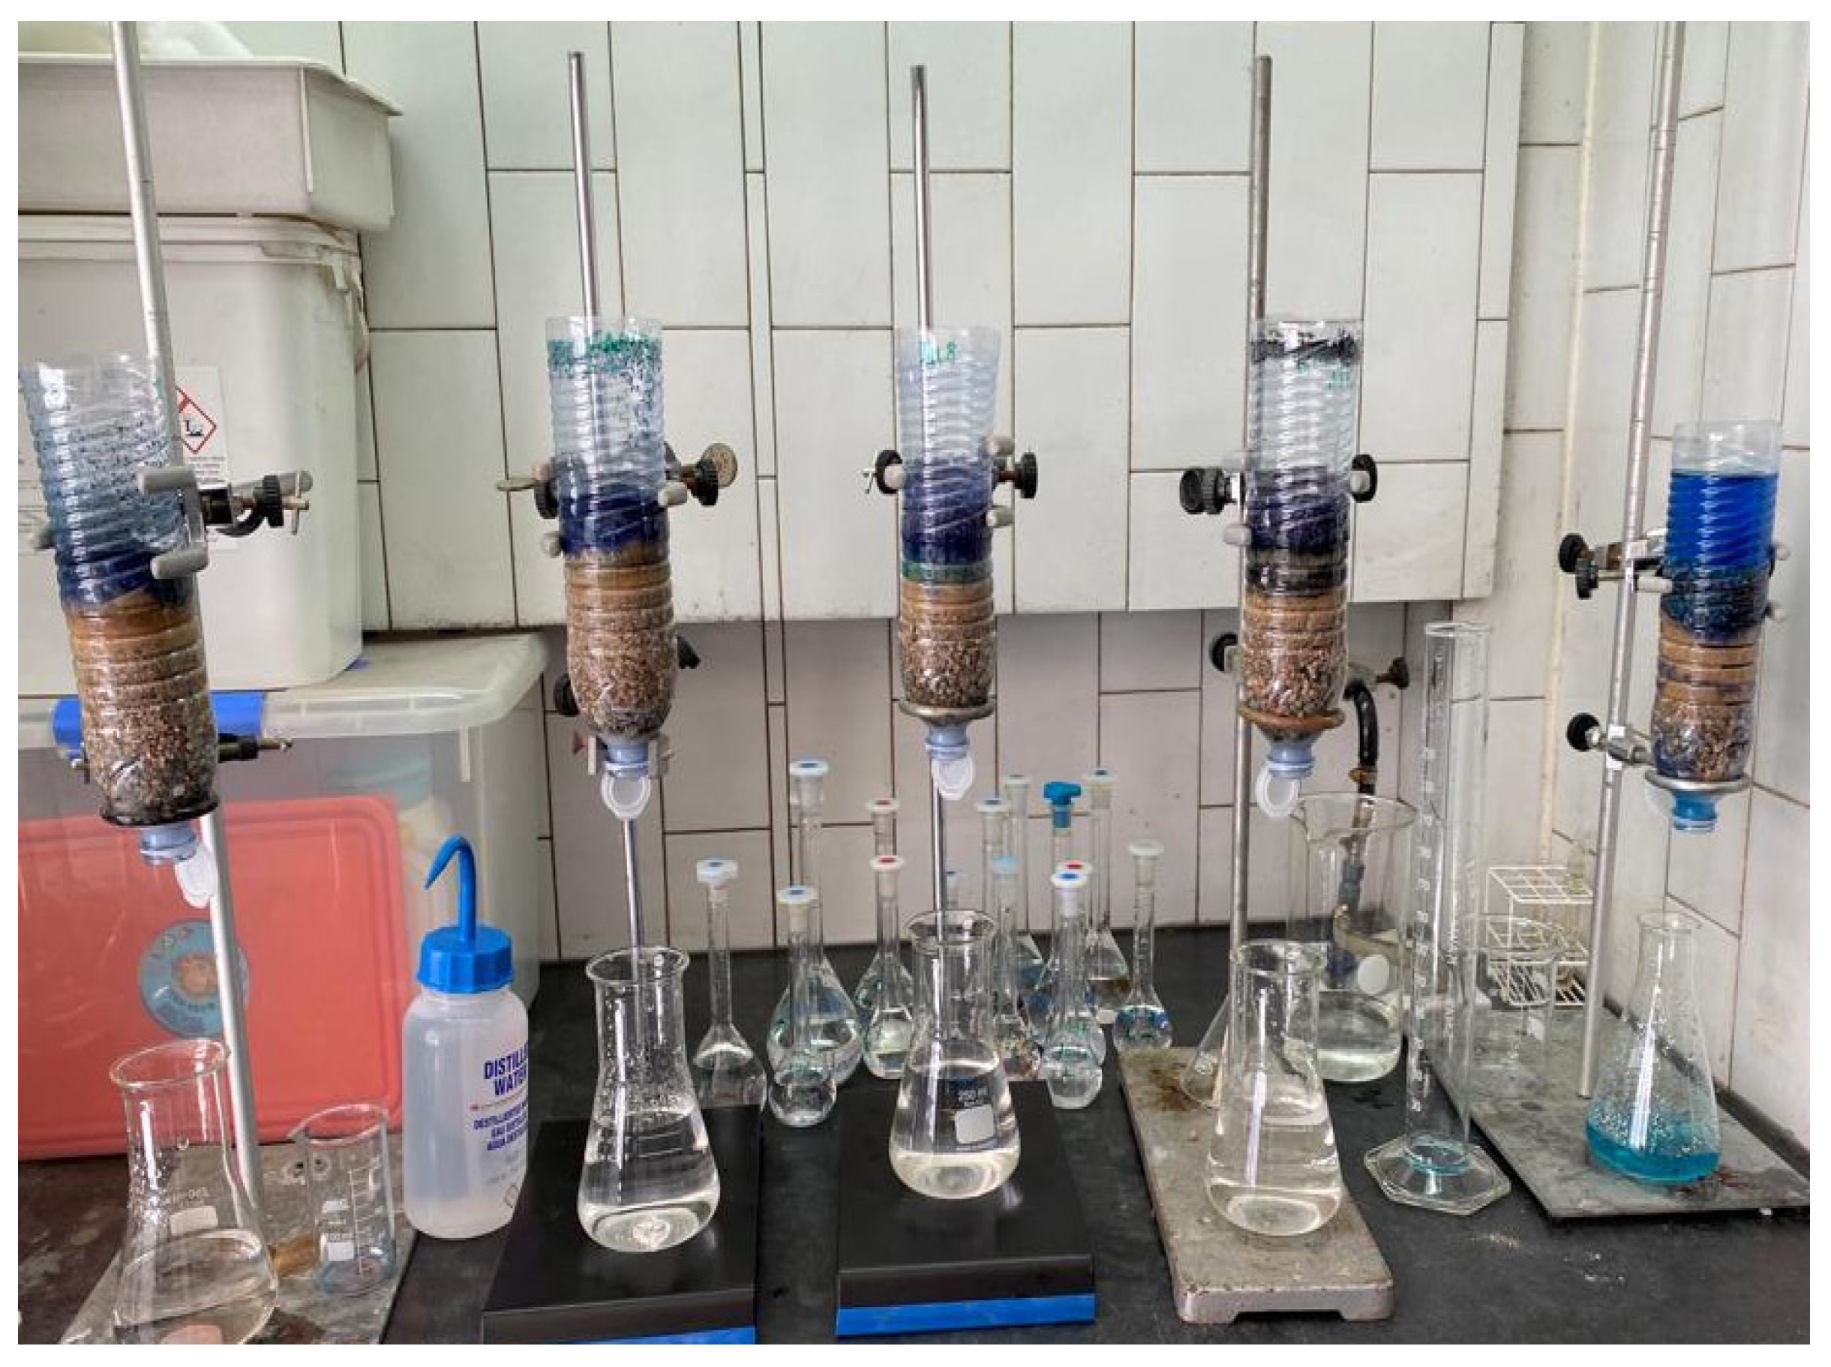
2.5. Preparation of Filters Containing Natural Adsorbents or ACs
3. Results
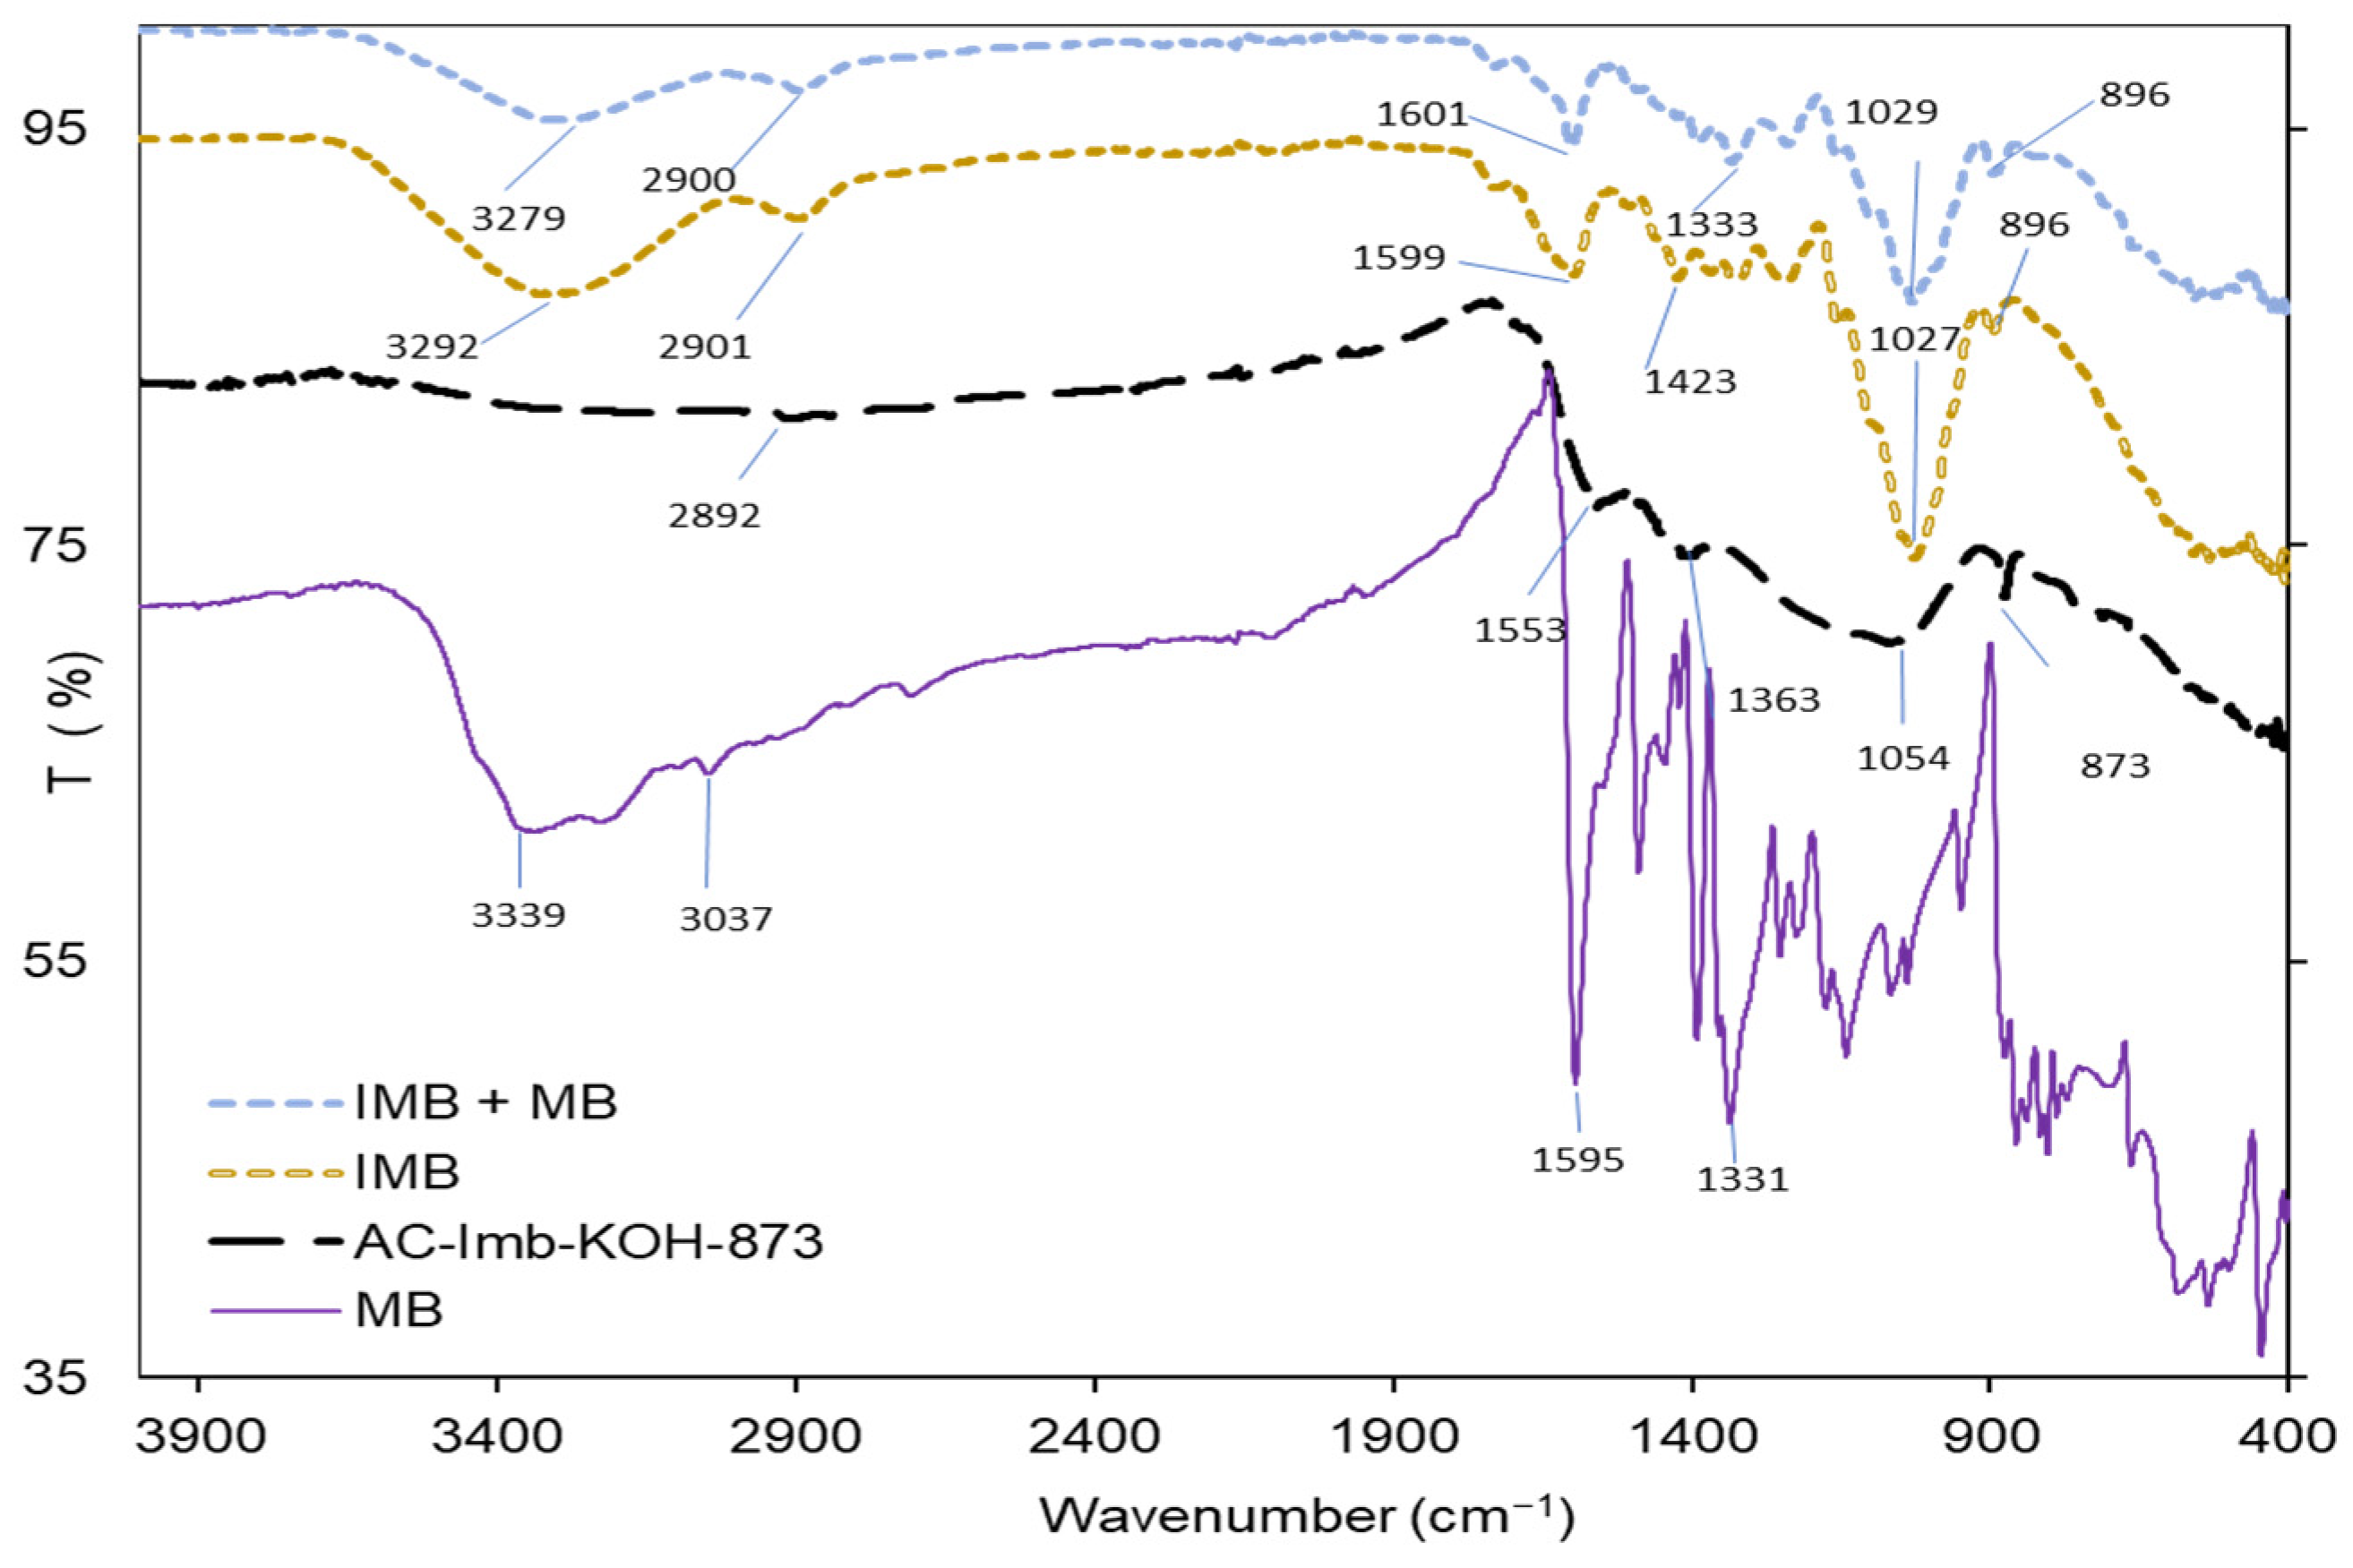
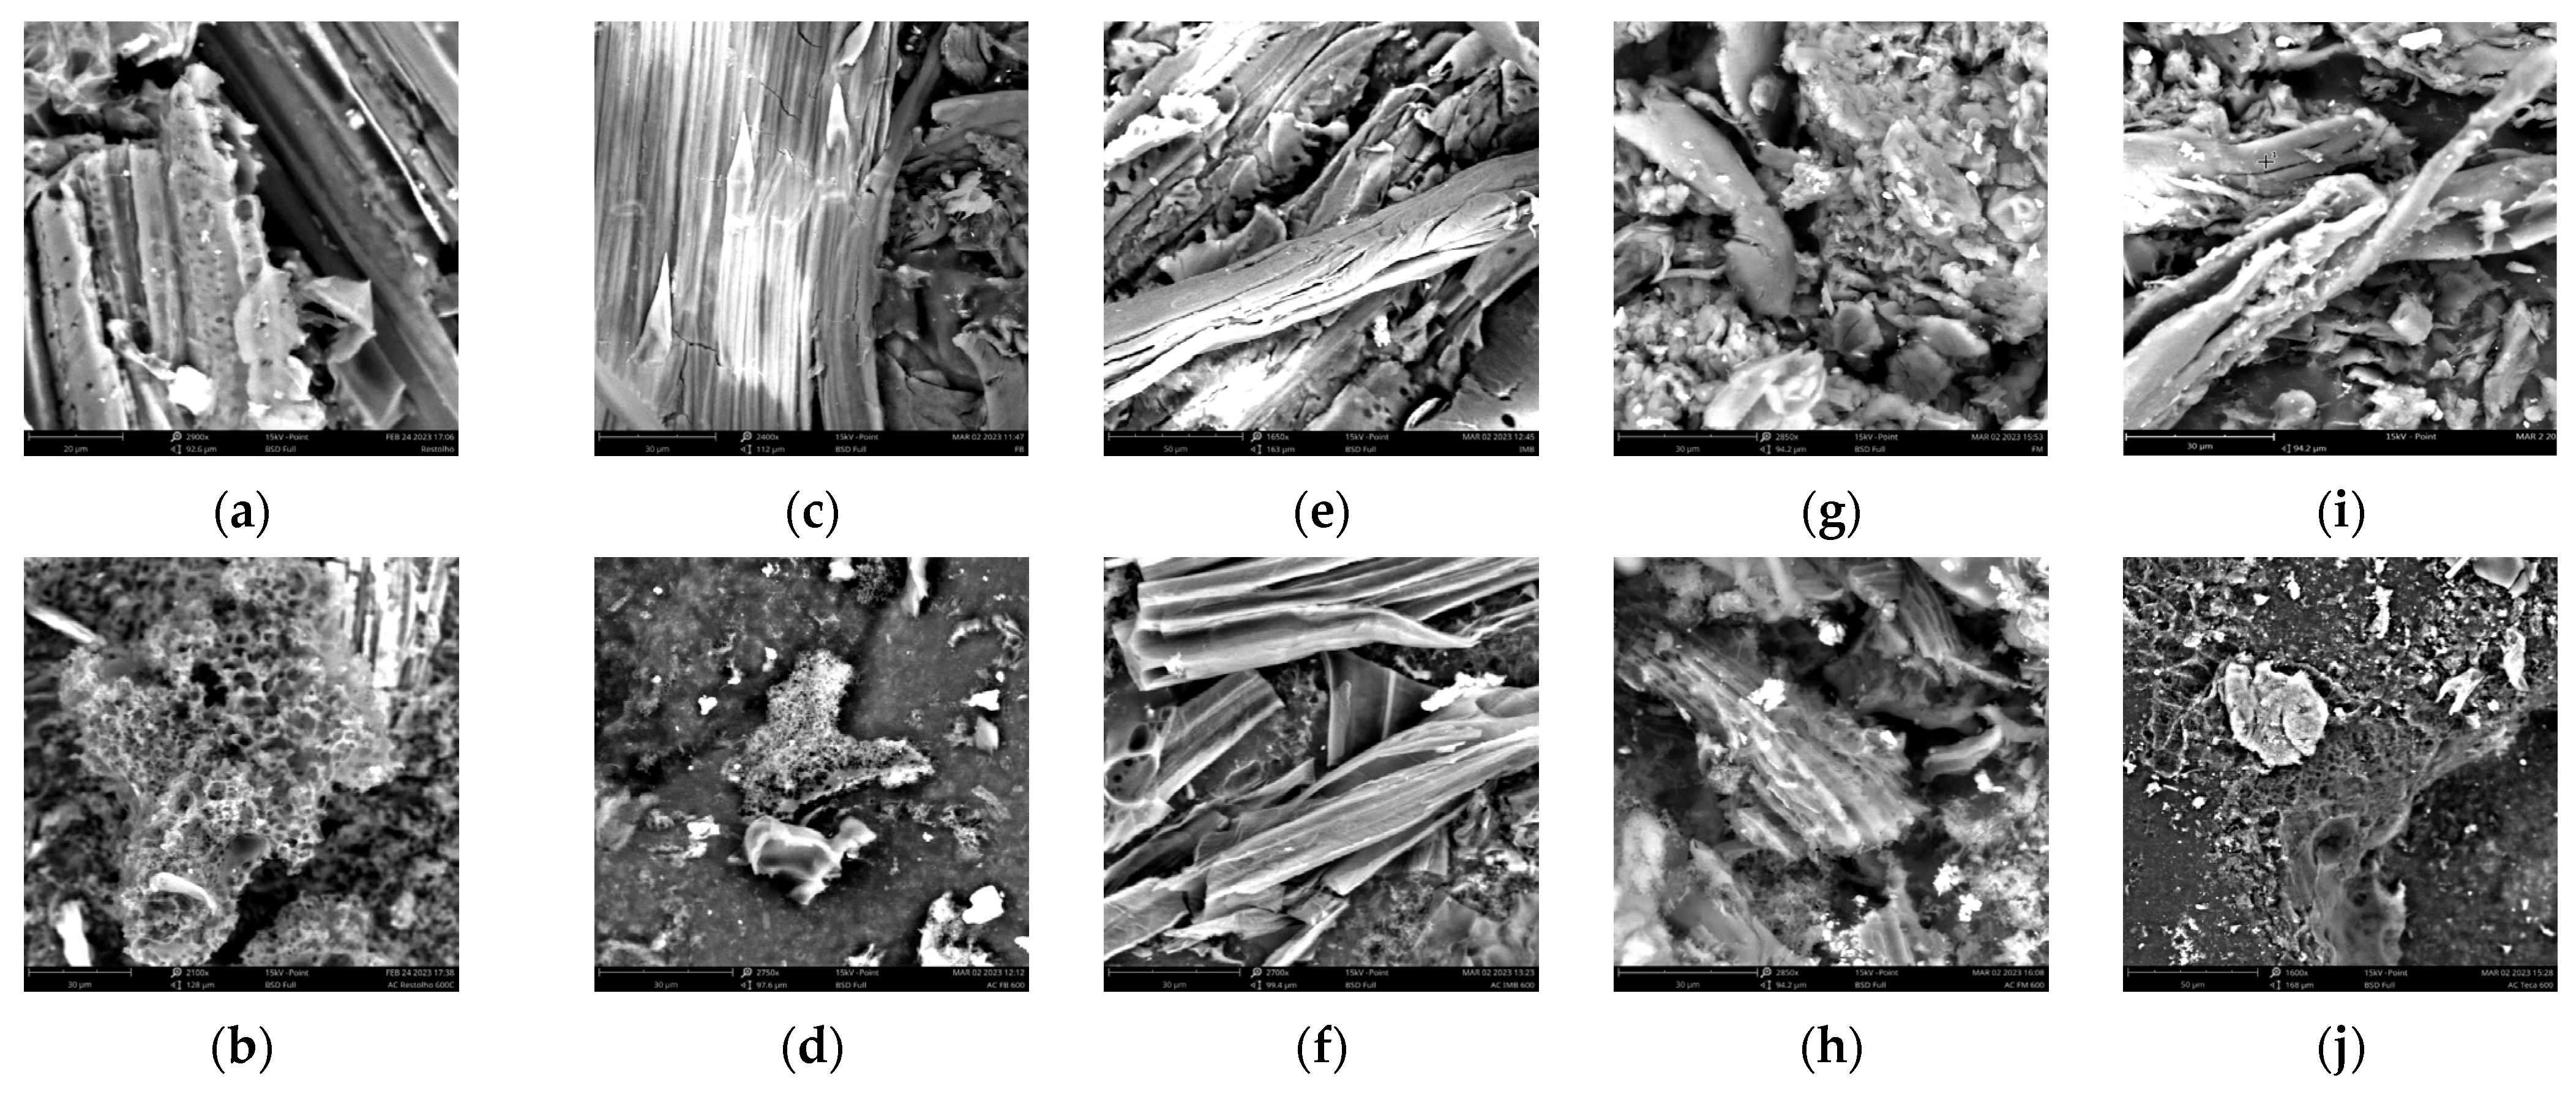
3.1. Adsorbent Characterization
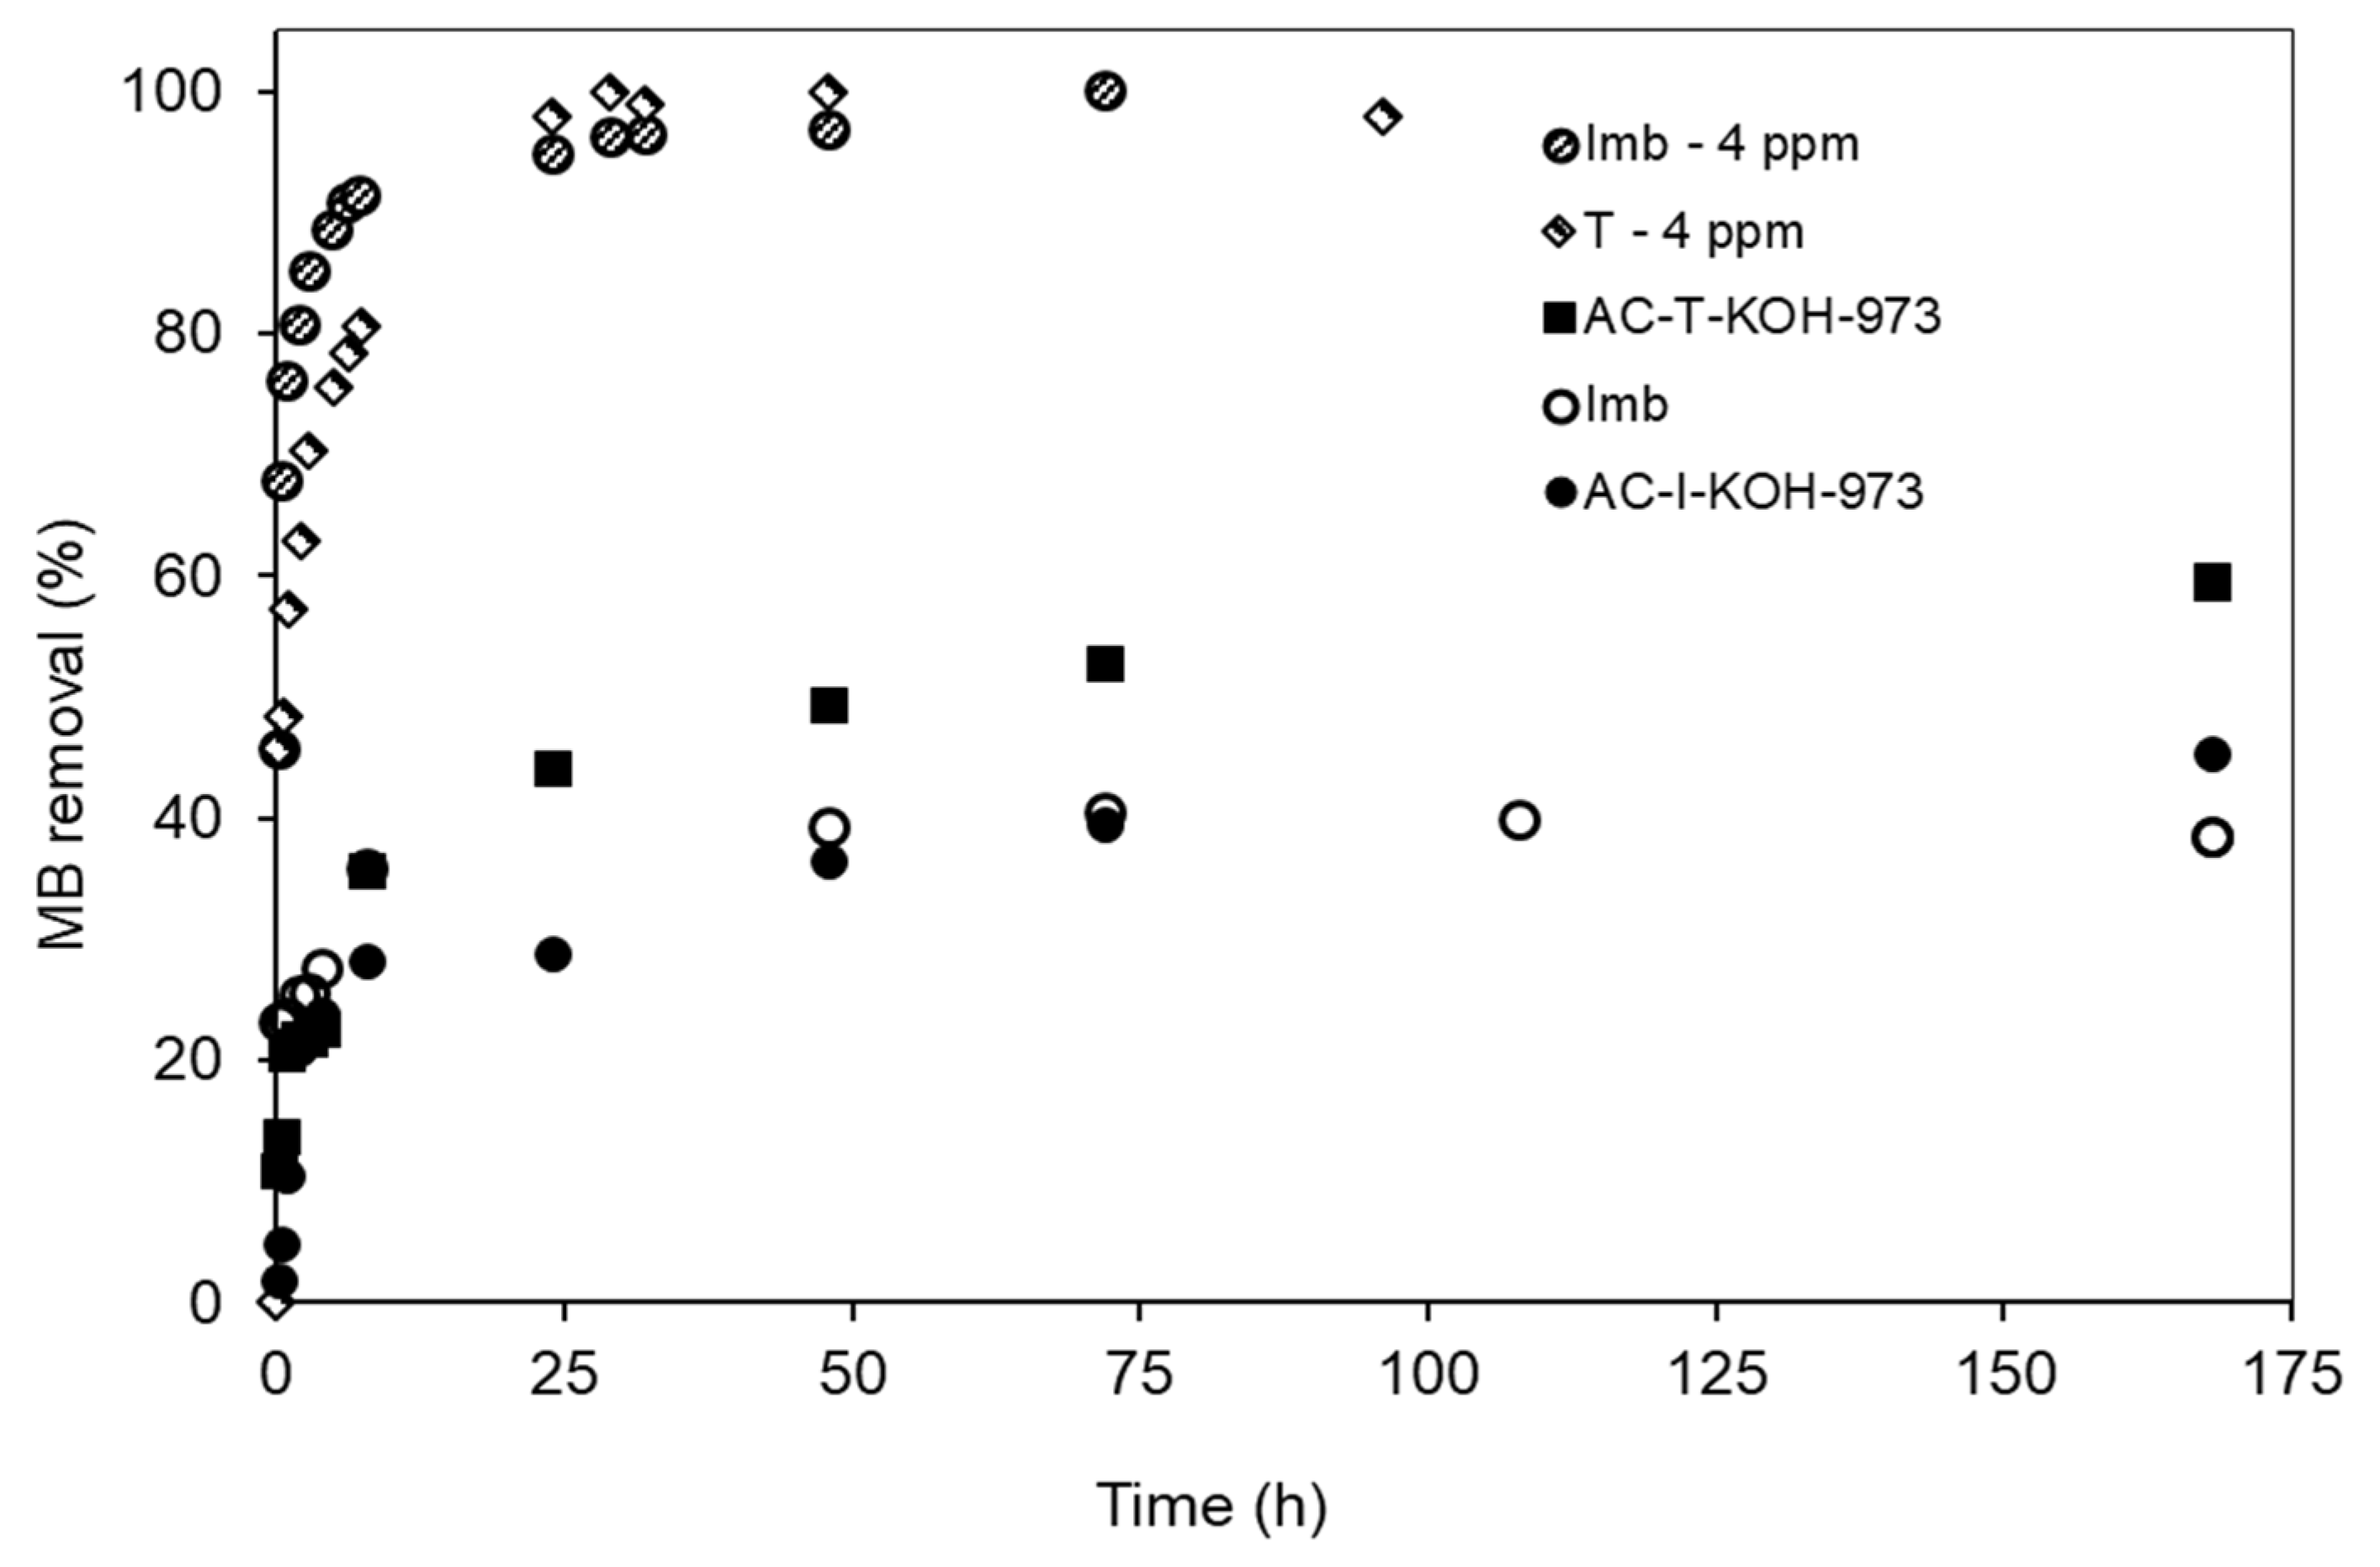
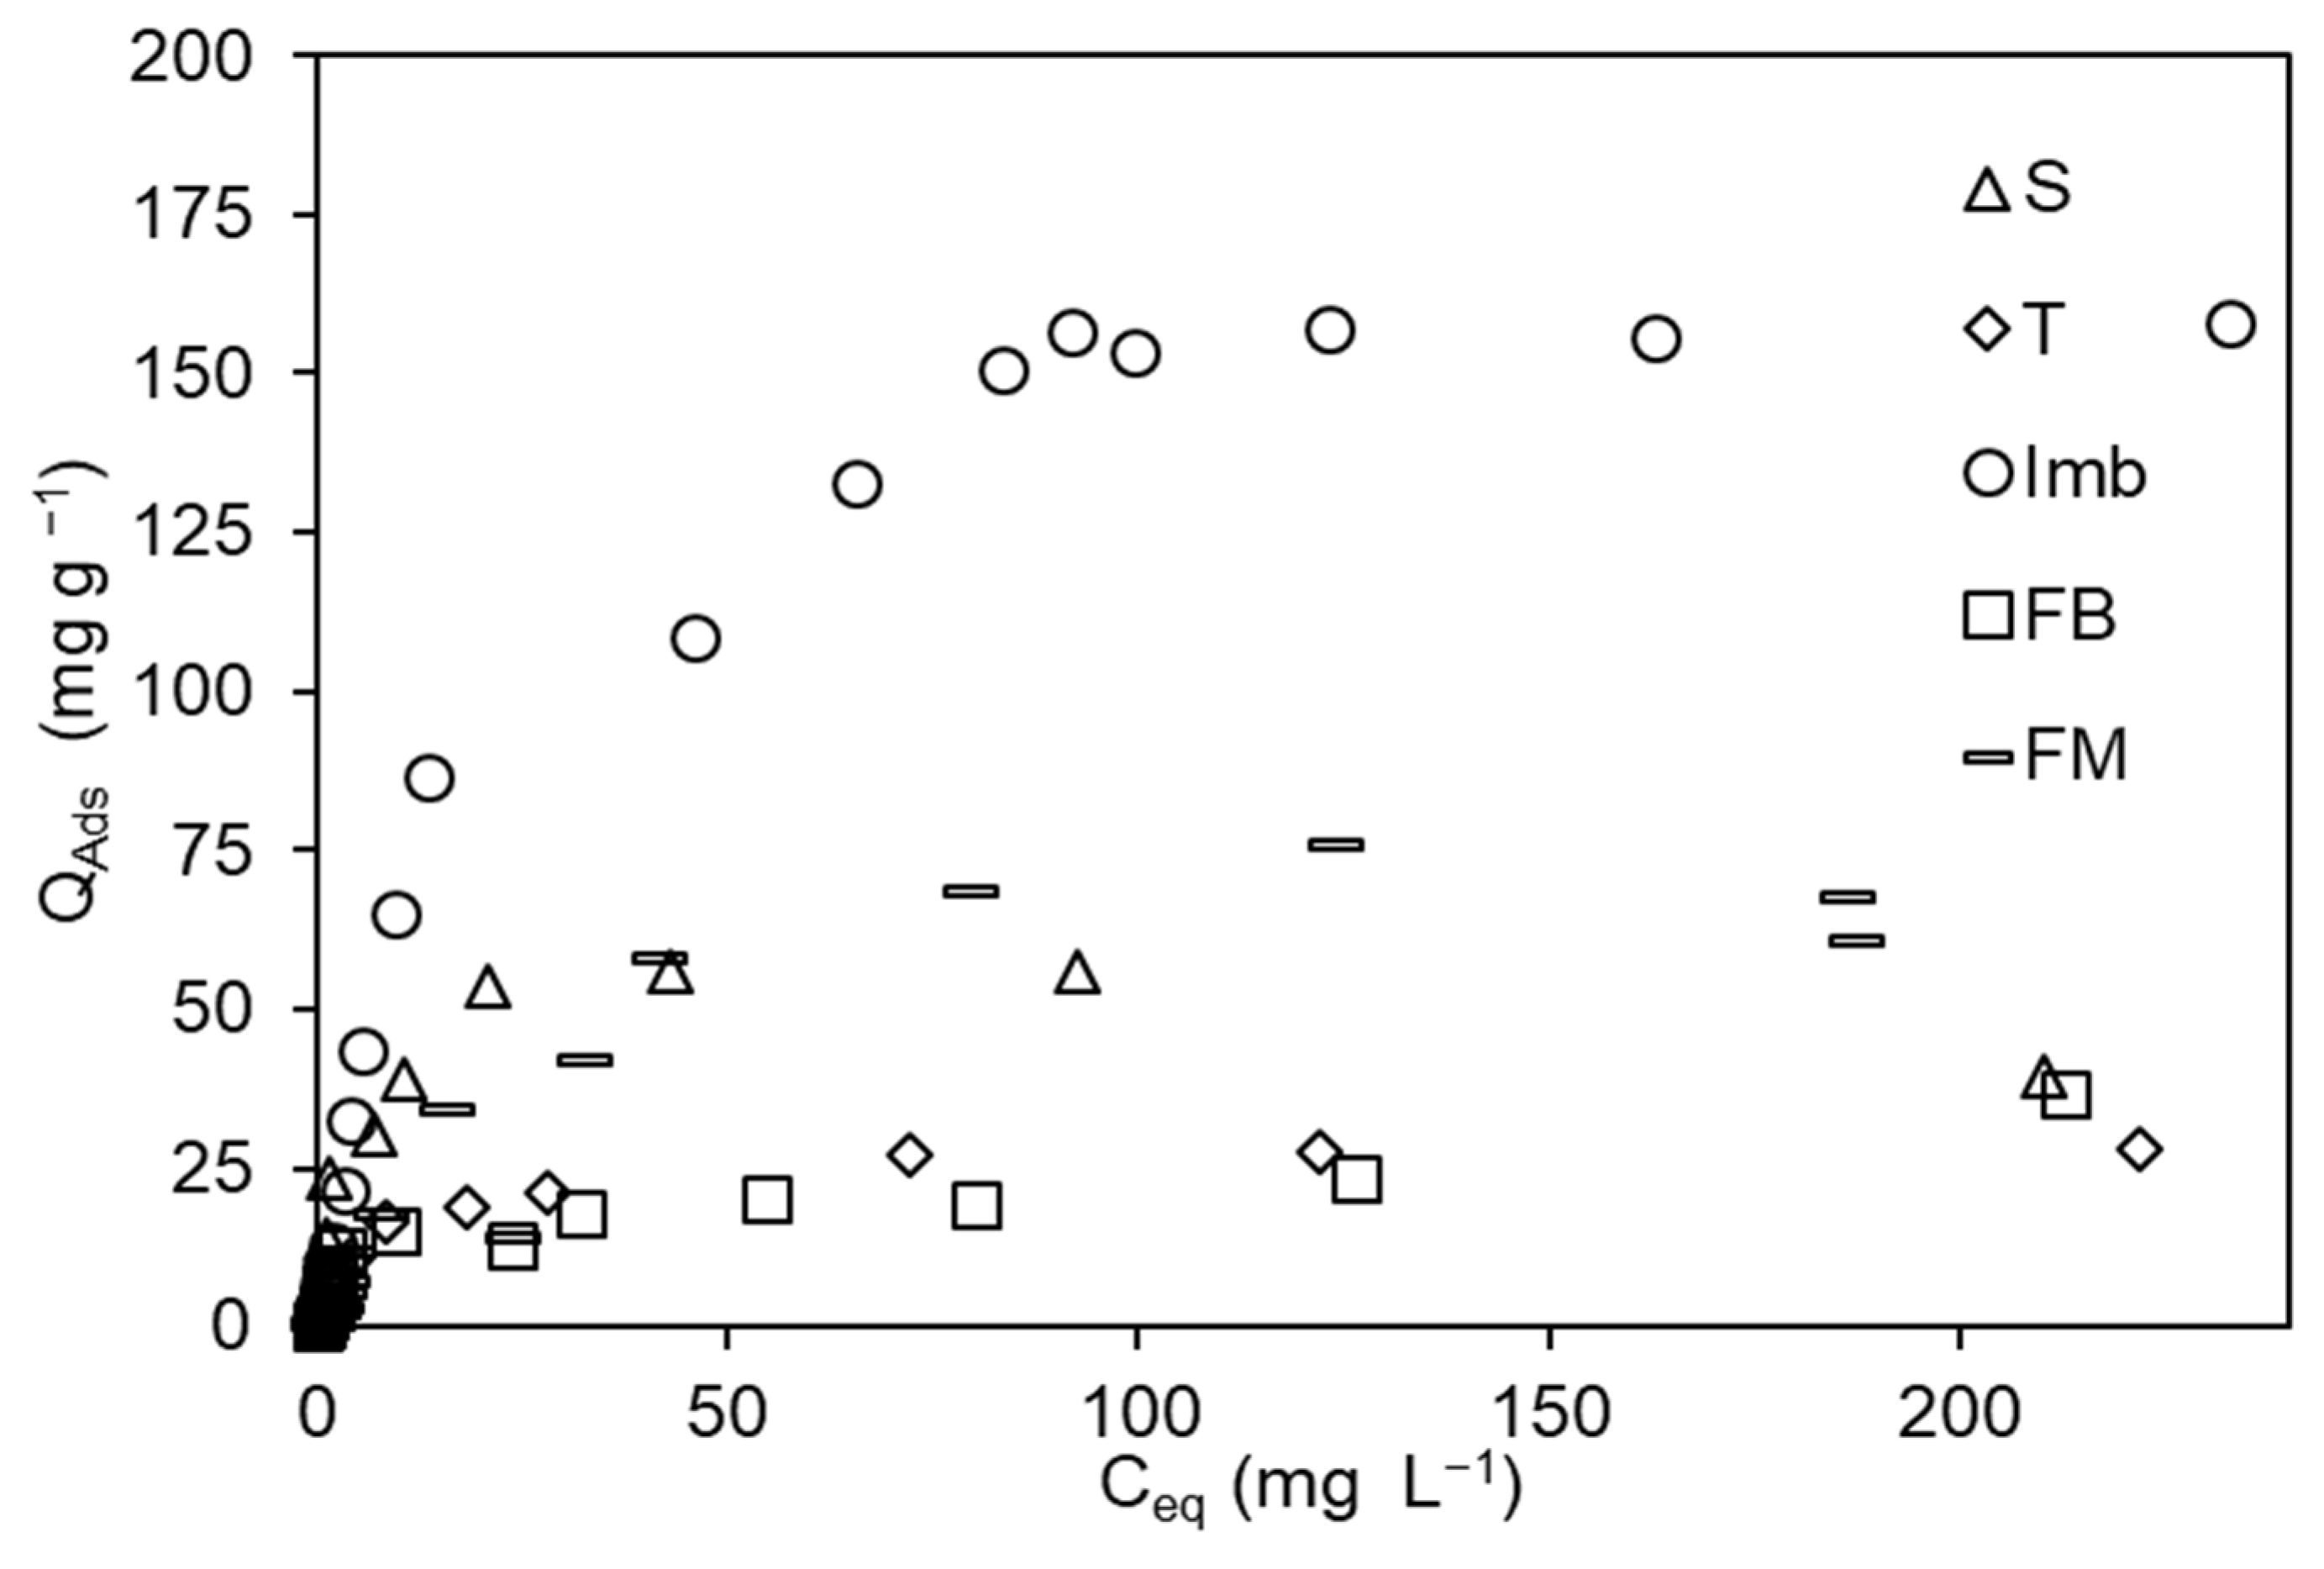
3.2. MB Adsorption on Natural Low-Cost Adsorbents
3.3. The Sevond Figure Has a Minus Signal
4. Conclusions
Author Contributions
Funding
Institutional Review Board Statement
Informed Consent Statement
Data Availability Statement
Acknowledgments
Conflicts of Interest
References
- Organisation des Nations Unies. Rapport Mondial des Nations Unies Sur la Mise en Valeur des Ressources en Eau, la Valeur de L’eau. UNESCO, Paris. Article Viewer|United Nations iLibrary. 2012. Available online: https://www.un-ilibrary.org/ (accessed on 23 April 2023).
- Water Supply Overview. Available online: https://www.worldbank.org (accessed on 21 April 2023).
- Drinking-Water. Available online: https://www.who.int (accessed on 28 April 2023).
- Ighalo, J.O.; Adeniyi, A.G. A Comprehensive review of water quality monitoring and assessment in Nigeria. Chemosphere 2020, 260, 127569. [Google Scholar] [CrossRef] [PubMed]
- IANAS. Water Reuse, Potential for Expanding the Nation’s Water Supply through the Reuse of Municipal Wastewater; The National Academies Press: Washington, DC, USA, 2012; Available online: https://ianas.org/wp-content/uploads/2020/07/wbp05.pdf (accessed on 21 April 2023).
- Tchikuala, E.; Mourão, P.; Nabais, J. Valorisation of Natural Fibres from African Baobab Wastes by the Production of Activated Carbons for Adsorption of Diuron. Procedia Eng. 2017, 200, 399–407. [Google Scholar] [CrossRef]
- Kulaishin, S.A.; Vedenyapina, M.D.; Kurmysheva, A.Y. Influence of the Surface Characteristics of Activated Carbon on the Adsorption of Herbicides (A Review). Solid Fuel Chem. 2022, 56, 181–198. [Google Scholar] [CrossRef]
- Cansado, I.P.P.; Mourão, P.A.M.; Belo, C.R. Using Tectona Grandis Biomass to Produce Valuable Adsorbents for Pesticide Removal from Liquid Effluent. Materials 2022, 15, 5842. [Google Scholar] [CrossRef]
- Mekuria, D.; Mekuria, D.A.; Melak, F.; Asere, T.G. Adsorptive removal of methylene blue dye using biowaste materials: Barley Bran and Enset Midrib leaf. Hindawi J. Chem. 2022, 13, 4849758. [Google Scholar] [CrossRef]
- Cansado, I.P.P.; Mourão, P.A.M.; Castanheiro, J.E. Performance of regenerated activated carbons on pesticides removal from the aqueous phase. Processes 2023, 11, 2496. [Google Scholar] [CrossRef]
- Georgin, J.; Franco, D.S.F.; Meili, L.; Dehmani, Y.; dos Reis, G.S.; Lima, E.C. Main advances and future prospects in the remediation of the antibiotic amoxicillin with a focus on adsorption technology: A critical review. J. Water Process Eng. 2023, 56, 104407. [Google Scholar] [CrossRef]
- Aragaw, T.A.; Bogale, F.M. Biomass-based adsorbents for removal of dyes from wastewater: A Review. Front. Environ. Sci. 2021, 9, 764958. [Google Scholar] [CrossRef]
- Mohammed, M.A.; Shitu, A.; Ibrahim, A. Removal of methylene blue using low-cost adsorbent: A review. Res. J. Chem. Sci. 2014, 4, 91–102. [Google Scholar]
- Katubi, K.M.; Amari, A.; Harharah, H.N.; Eldirderi, M.M.; Tahoon, M.A.; Ben Rebah, F. Aloe vera as a promising material for water treatment: A review. Processes 2021, 9, 782. [Google Scholar] [CrossRef]
- Mohammed, K.; Noor, A.; Hayder, A.; Al-Furaiji, M. Removal of dyes by agricultural waste. Sustain. Chem. Pharm. 2020, 16, 100259. [Google Scholar] [CrossRef]
- Gouamid, M.; Ouahrani, M.R.; Bensaci, M.B. Adsorption equilibrium, kinetics and thermodynamics of methylene blue from aqueous solutions using date palm leaves. Energy Procedia 2013, 36, 898–907. [Google Scholar] [CrossRef]
- Kong, L.; Gong, L.; Wang, J. Removal of methylene blue from wastewater using fallen leaves as an adsorbent. Desalination Water Treat. 2013, 53, 2489–2500. [Google Scholar] [CrossRef]
- Andrade Siqueira, T.C.; Zanette da Silva, I.; Rubio, A.J.; Bergamasco, R.; Gasparotto, F.; Aparecida de Souza Paccola, E.; Ueda Yamaguchi, N. Sugarcane bagasse as an efficient biosorbent for methylene blue removal: Kinetics, isotherms and thermodynamics. Int. J. Environ. Res. Public Health 2020, 17, 526. [Google Scholar] [CrossRef] [PubMed]
- Srinivasan, A.; Viraraghavan, T. Decolorization of dye wastewaters by biosorbents: A review. J. Environ. Manag. 2010, 91, 1915–1929. [Google Scholar] [CrossRef] [PubMed]
- Chin, J.Y.; Chng, L.M.; Leong, S.S.; Yeap, S.P.; Yasin, N.H.M.; Toh, P.Y. Removal of synthetic dye by Chlorella vulgaris Microalgae as natural adsorbent. Arab. J. Sci. Eng. 2020, 45, 7385–7395. [Google Scholar] [CrossRef]
- Malik, D.S.; Jain, C.K.; Yadav, A.K.; Kothari, R.; Pathak, V.V. Removal of methylene blue dye in aqueous solution by agricultural waste. Int. Res. J. Innov. Eng. Technol. 2016, 3, 1–7. [Google Scholar]
- Sun, Y.; Zhang, B.; Zheng, T.; Wang, P. Regeneration of activated carbon saturated with chloramphenicol by microwave and ultraviolet irradiation. Chem. Eng. J. 2017, 320, 264–270. [Google Scholar] [CrossRef]
- Alfredo, A.P.C.; Gonçalves, G.C.; Lobo, V.S.; Montanher, S.F. Adsorção de Azul de Metileno em Casca de Batata Utilizando Sistemas em Batelada e Coluna de Leito Fixo. Rev. Virtual Quim. 2015, 7, 1909–1920. [Google Scholar] [CrossRef]
- Ramezani, H.; Azizi, S.N.; Cravotto, G. Improved removal of methylene blue on modified hierarchical zeolite Y: Achieved by a destructive-constructive method. Green Process. Synth. 2019, 8, 730–741. [Google Scholar] [CrossRef]
- Jawada, A.H.; Kadhumb, A.K.; Ngohc, Y.S. Applicability of dragon fruit (Hylocereus polyrhizus) peels as low-cost biosorbent for adsorption of methylene blue from aqueous solution: Kinetics, equilibrium and thermodynamics studies. Desalination Water Treat. 2018, 109, 231–240. [Google Scholar] [CrossRef]
- Meissner, P.E.; Mandi, G.; Coulibaly, B.; Witte, S.; Tapsoba, T.; Mansmann, U.; Rengelshausen, J.; Schiek, W.; Jahn, A.; Walter-Sack, I.; et al. Methylene blue for malaria in Africa: Results from a dose-finding study in combination with chloroquine. Malar. J. 2006, 5, 84. [Google Scholar] [CrossRef]
- Karthi, S.; Sangeetha, R.K.; Arumugam, K.; Karthika, T.; Vimala, S. Removal of methylene blue dye using shrimp shell chitin from Industrial Effluents. Mater. Today Proc. 2022, 66, 1945–1950. [Google Scholar] [CrossRef]
- Carrott, P.J.M.; Roberts, R.A.; Sing, K.S.W. Adsorption of nitrogen by porous and non-porous carbons. Carbon 1987, 25, 59–68. [Google Scholar] [CrossRef]
- Carrott, P.J.M.; Cansado, I.P.P.; Ribeiro Carrott, M.M.L. On the Lo /σ Range of the TVFM. Adsorpt. Sci. Technol. 2006, 24, 205–213. [Google Scholar] [CrossRef]
- Selmi, T.; Seffen, M.; Celzard, A.; Fierro, V. Effect of the adsorption pH and temperature on the parameters of the Brouers–Sotolongo models. Environ. Sci. Pollut. Res. 2020, 27, 23437–23446. [Google Scholar] [CrossRef] [PubMed]
- Jahan, K.; Singh, V.; Mehrotra, N.; Verma, V. Development of activated carbon from KOH activation of pre-carbonized chickpea peel residue and its performance for removal of synthetic dye from drinking water. Biomass Convers. Biorefinery 2023, 13, 6913–6923. [Google Scholar] [CrossRef]
- Fito, J.; Abraham, S.; Angassa, K. Adsorption of methylene blue from textile industrial wastewater onto activated carbon of Parthenium hysterophorus. Int. J. Environ. Res. 2020, 14, 501–511. [Google Scholar] [CrossRef]
- Hashem, A.H.; Saied, E.; Hasanin, M.S. Green and ecofriendly bio-removal of methylene blue dye from aqueous solution using biologically activated banana peel waste. Sustain. Chem. Pharm. 2020, 18, 100333. [Google Scholar] [CrossRef]
- Oladoye, P.O.; Ajiboye, T.O.; Omotola, E.O.; Oyewola, O.J. Methylene blue dye: Toxicity and potential elimination technology from wastewater. Results Eng. 2022, 16, 100678. [Google Scholar] [CrossRef]
- Jawad, A.H.; Rashid, M.R.A.; Ishak, A.M.; Ismail, K. Adsorptive removal of methylene blue by chemically treated cellulosic wastebanana (Musa sapientum) peels. J. Taibah Univ. 2018, 12, 809–919. [Google Scholar] [CrossRef]
- Jawad, A.H.; Rashid, R.A.; Ishak, M.A.M.; Wilson, L.D. Adsorption of methylene blue onto activated carbon developed from biomass waste by H2SO4 activation: Kinetic, equilibrium and thermodynamic studies. Desalination Water Treat. 2016, 57, 25194–25206. [Google Scholar] [CrossRef]


| Adsorbents | Qads mg g−1 | pH | Equilibrium Time h | Reference |
|---|---|---|---|---|
| Barley bran | 63.2 | 5.07 | 4 | [9] |
| Enset midrib leaf | 35.5 | 5.66 | 1 | [9] |
| Sugarcane bagasse | 9.4 | 24 | [18] | |
| Chlorella vulgaris microalgae | 275 | -- | 72 | [20] |
| Corn husk | 30.3 | 6.2 | 0.25 | [21] |
| Ficus carica bast treated with H2SO4 | 55.56 | 7.8 | 1.33 | [22] |
| Natural adsorbents (review) | -- | -- | -- | [12,13] |
| Potato peel | 48.7 | -- | 1.0 | [23] |
| Date palm leaves | 43.1 | 6.5 | 2.7 | [16] |
| Modified zeolites | 133.1 | [24] | ||
| Hylocereus undatus (dragon fruit peels) | 192.31 | 5.6 | 0.15–2 | [25] |
| Adsorbents | EA | EDX | pHpzc | ||||
|---|---|---|---|---|---|---|---|
| N | C | H | C | O | N | ||
| Stubble (S) | -- | -- | -- | 34.4 | 66.6 | 3.5 | 4.4 |
| Teak (T) | -- | -- | -- | 32.1 | 67.9 | -- | 4.7 |
| Imbondeiro (Imb) | -- | -- | -- | 34.1 | 65.9 | -- | 5.4 |
| Bamboo flower (FB) | -- | -- | -- | 27.1 | 66.6 | 6.3 | 5.1 |
| Mayan flower (FM) | -- | -- | -- | 26.0 | 68.1 | 5.9 | 4.6 |
| AC-S-KOH-873 | 0.7 | 69.3 | 0.1 | 41.7 | 58.3 | -- | 7.4 |
| AC-T-KOH-873 | 0.4 | 78.3 | 1.2 | 48.1 | 51.9 | -- | 7.1 |
| AC-Imb-KOH-873 | 0.6 | 72.1 | -- | 44.4 | 55.6 | -- | 6.9 |
| AC-FB-KOH-873 | 1.3 | 70.5 | 0.1 | 42.8 | 57.2 | -- | 6.7 |
| AC-FM-KOH-873 | 2.7 | 70.5 | 0.9 | 46.4 | 53.6 | -- | 7.7 |
| Samples | ƞ | ABET | αs | DR | |||
|---|---|---|---|---|---|---|---|
| % | m2 g−1 | As | Vs | V0 | E0 | L0 | |
| m2 g−1 | cm3 g−1 | cm3 g−1 | kJ mol−1 | nm | |||
| AC-T-KOH-1-1-873 | 20.4 | 581 | 21 | 0.20 | 0.15 | 25.40 | 0.77 |
| AC-T-KOH-1-1-973 | 19.1 | 908 | 57 | 0.40 | 0.33 | 17.40 | 1.79 |
| AC-T-K2CO3-1-1-873 | 16.0 | 554 | 32 | 0.23 | 0.14 | 21.7 | 1.17 |
| AC-T-K2CO3-1-1-973 | 15.1 | 1736 | 27 | 0.79 | 0.44 | 19.0 | 1.43 |
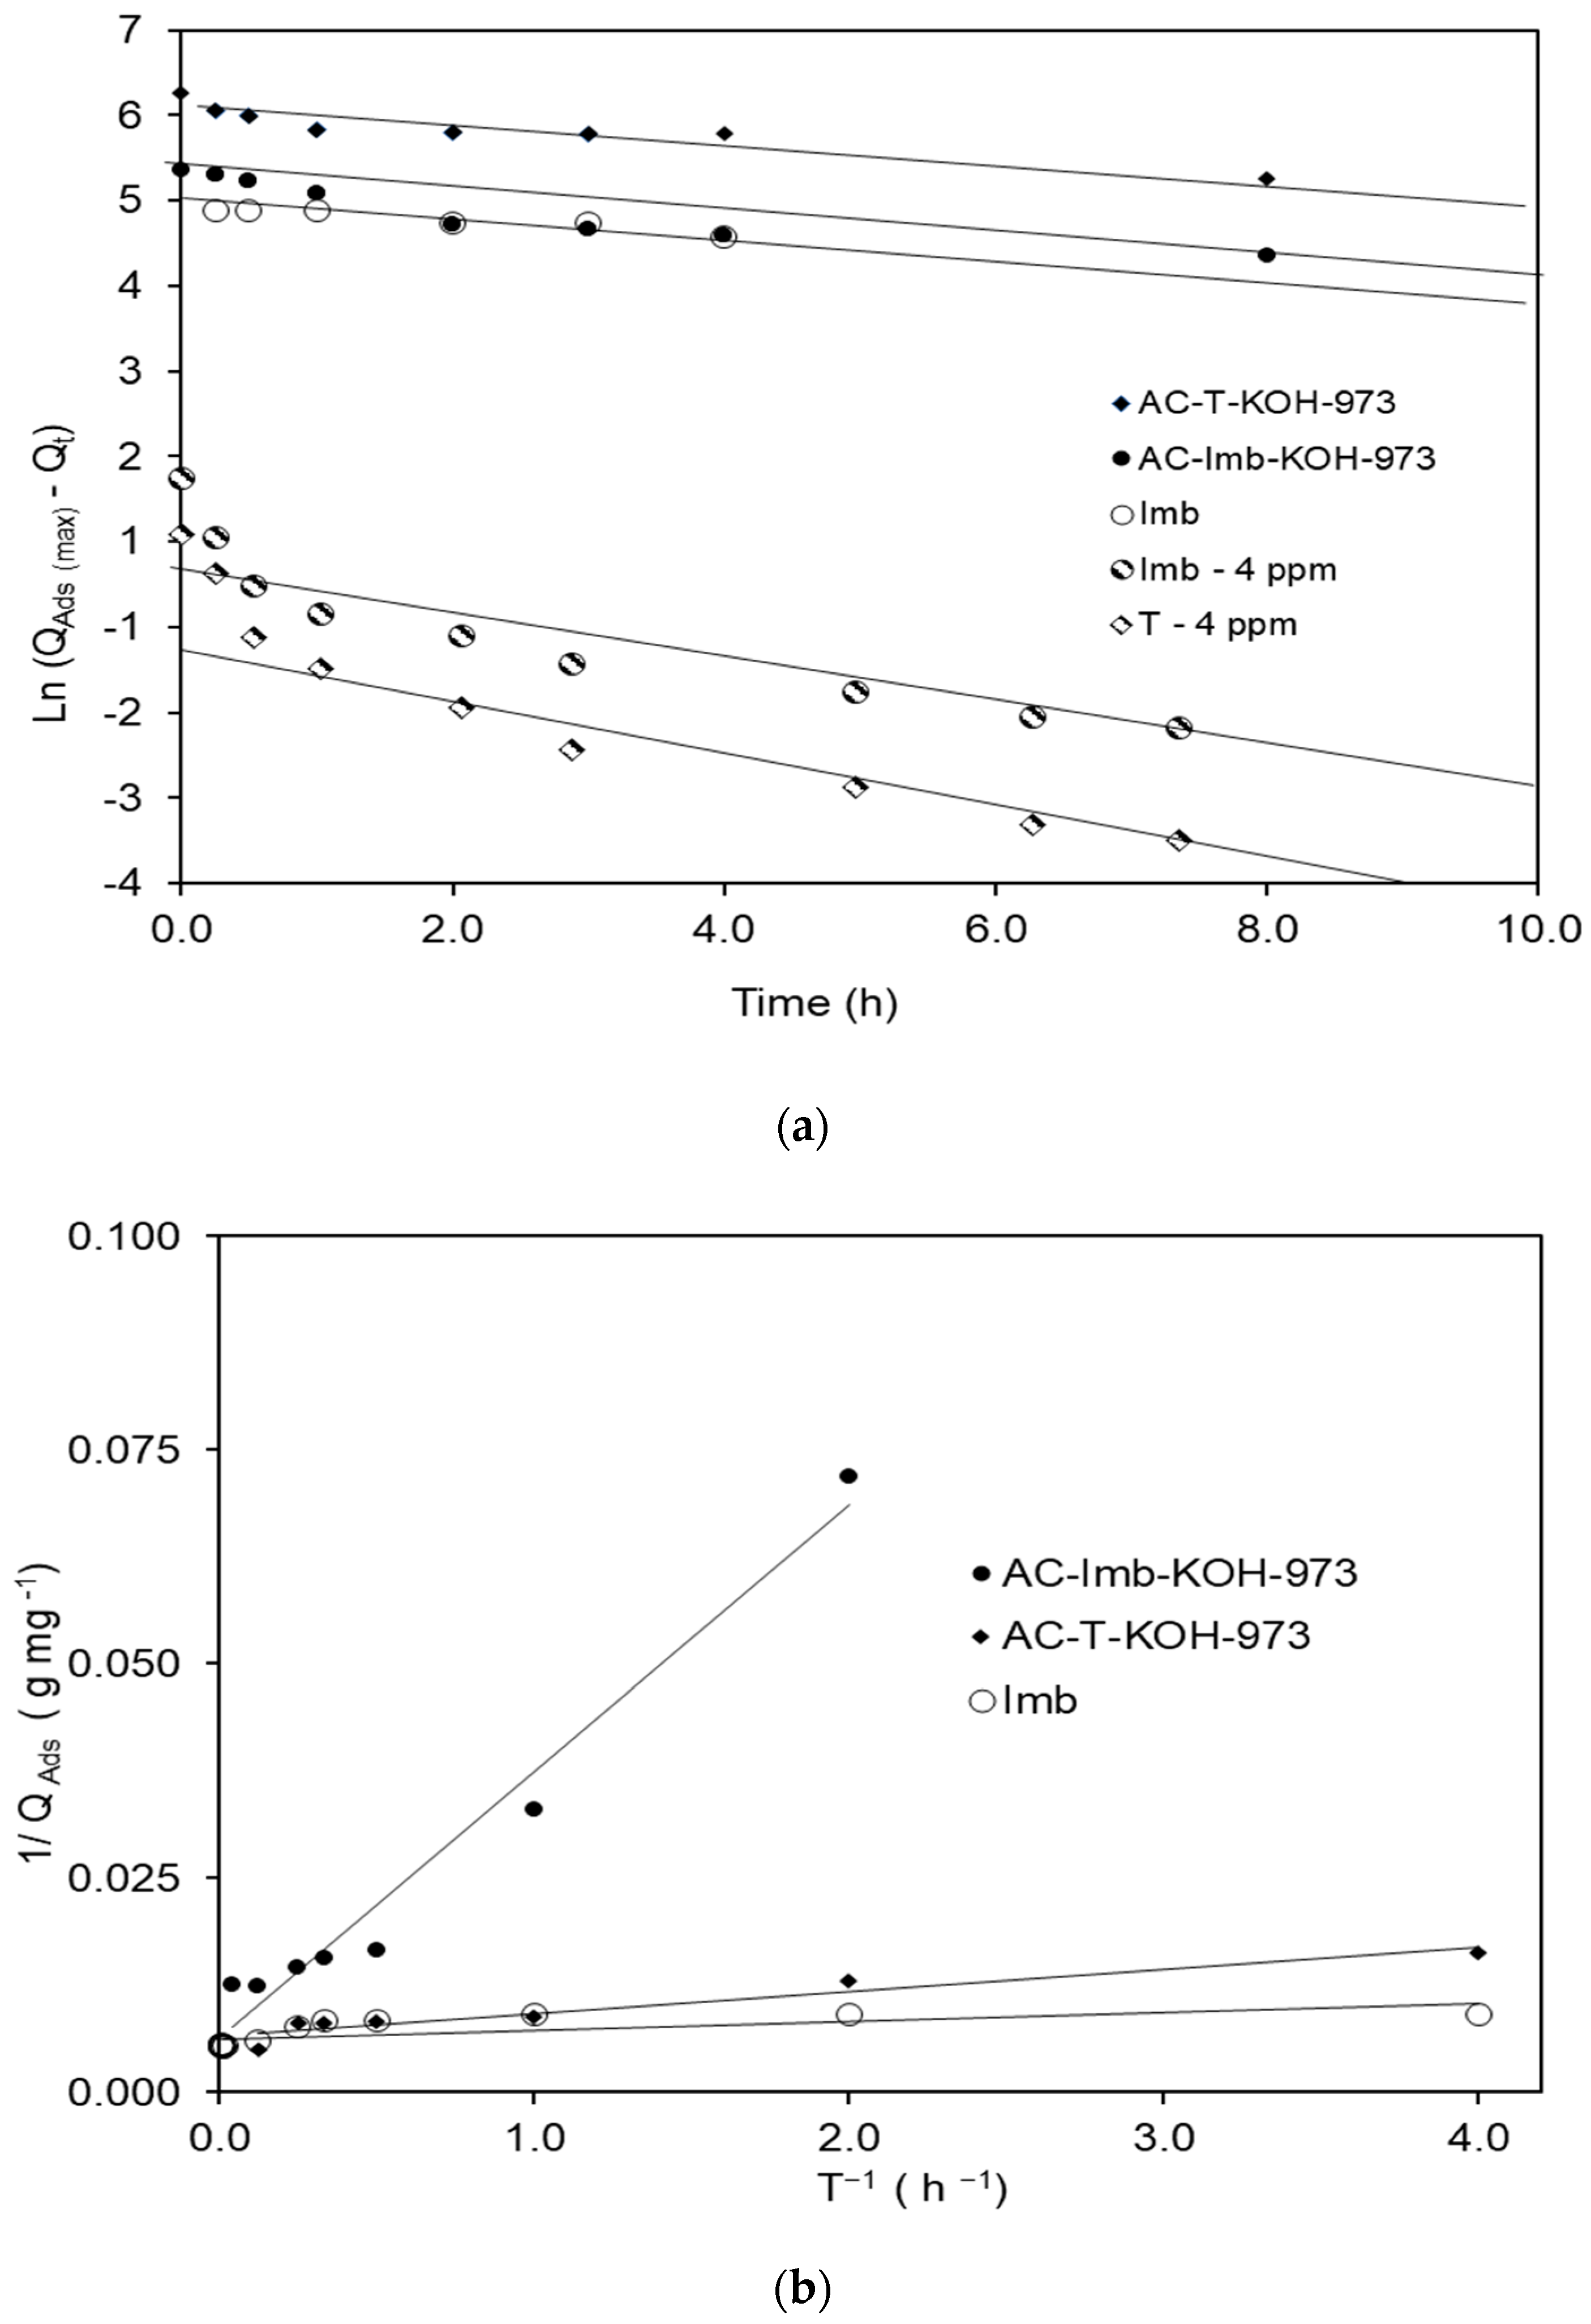
| Adsorbents | Qmax, exp Qmax (Exp) mg g−1 | Pseudo-First-Order Model | Pseudo-Second-Order Model | |||||
|---|---|---|---|---|---|---|---|---|
| Qmax1, cal1 mg g−1 | K1 h−1 | R2 | Qmax, cal2 mg g−1 | V0 mg g−1 h−1 | K2 h−1 | R2 | ||
| Imb—4 ppm | 3.3 | 1.27 | 0.34 | 0.89 | 3.2 | 14.2 | 1.23 | 0.97 |
| T—4 ppm | 3.2 | 0.54 | 0.36 | 0.96 | 3.2 | 3.2 | 0.32 | 0.97 |
| Imb | 188.3 | 83.3 | 0.0792 | 0.92 | 175.5 | 227.3 | 0.007 | 0.83 |
| AC-Imb-KOH-973 | 123.4 | 120.7 | 0.0209 | 0.91 | 142.9 | 32.7 | 0.020 | 0.92 |
| AC-T-KOH-973 | 156.1 | 249.1 | 0.0924 | 0.85 | 149.3 | 400 | 0.018 | 0.97 |
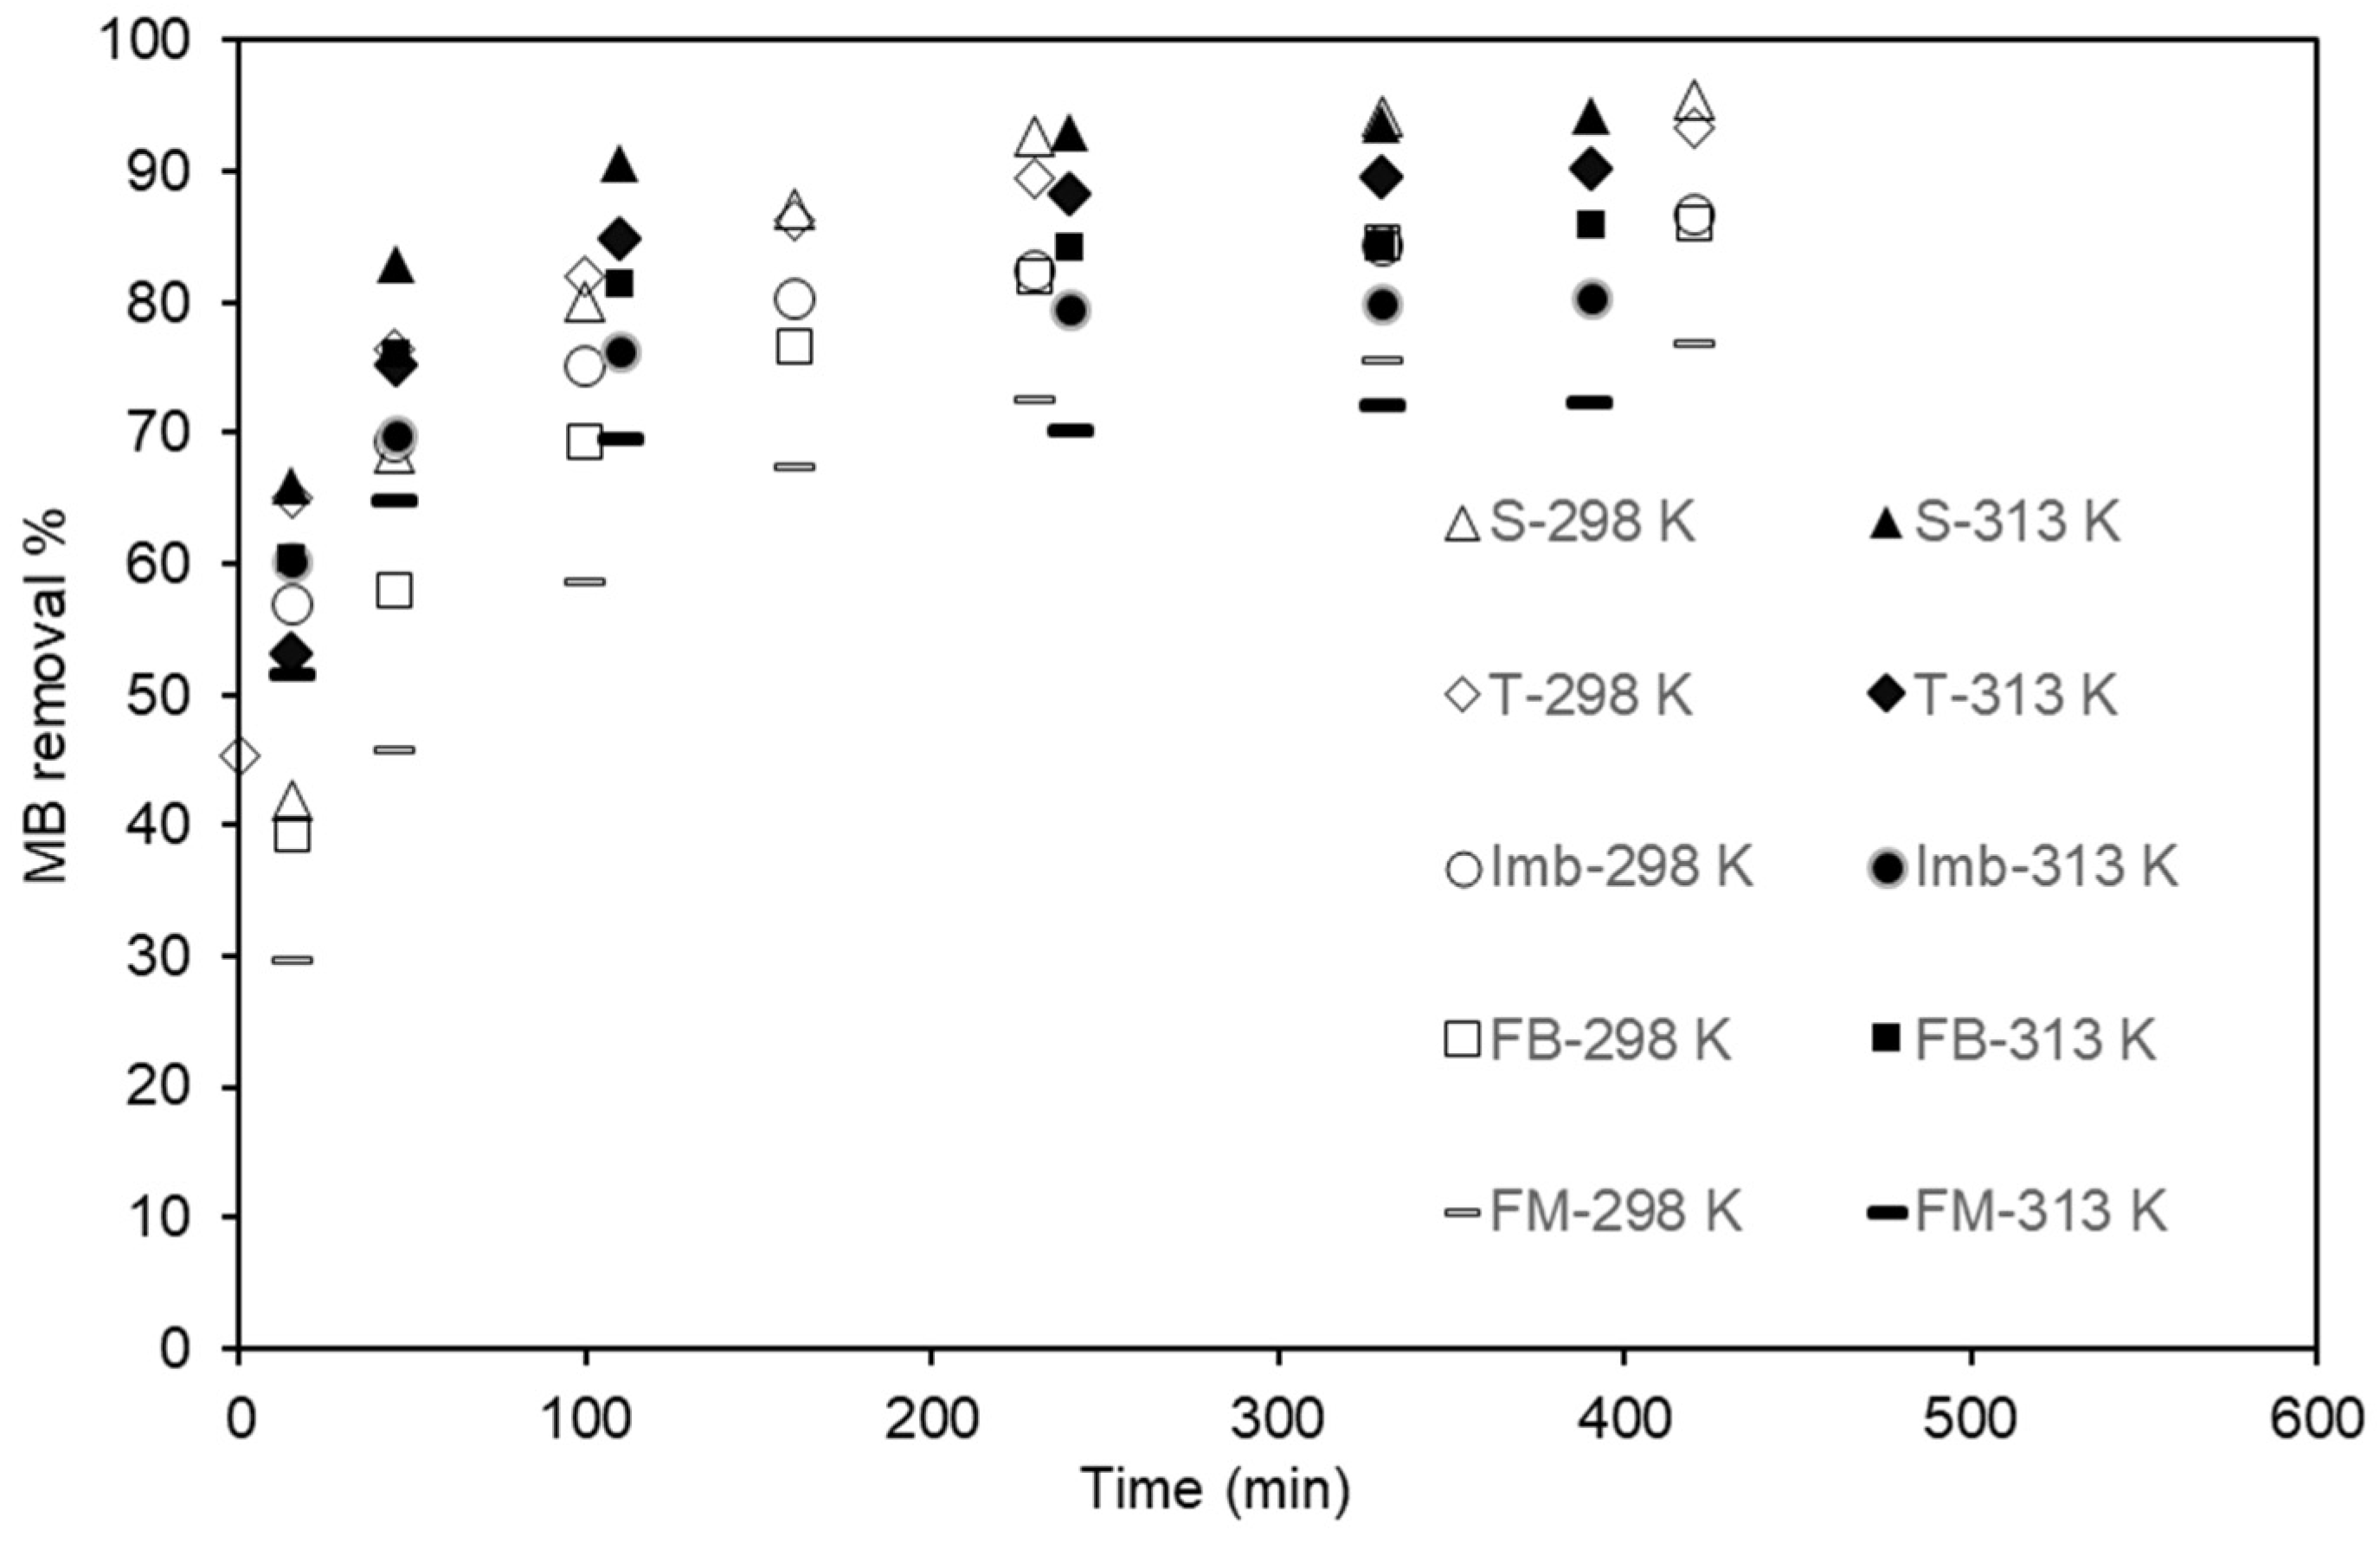
| Samples | T (K) | Kd | ΔG° (KJ mol−1) | ΔH° (KJ mol−1) | ΔS° (J K mol−1) | R2 |
|---|---|---|---|---|---|---|
| 298.15 | 6.80 | −4.76 | ||||
| Imb | 303.15 | 7.02 | −4.93 | −18.83 | −46.67 | 0.75 |
| 313.15 | 4.89 | −5.22 | ||||
| 298.15 | 7.76 | −5.08 | ||||
| FB | 303.15 | 8.88 | −5.51 | 12.76 | 60.05 | 0.98 |
| 313.15 | 10.03 | −6.01 |
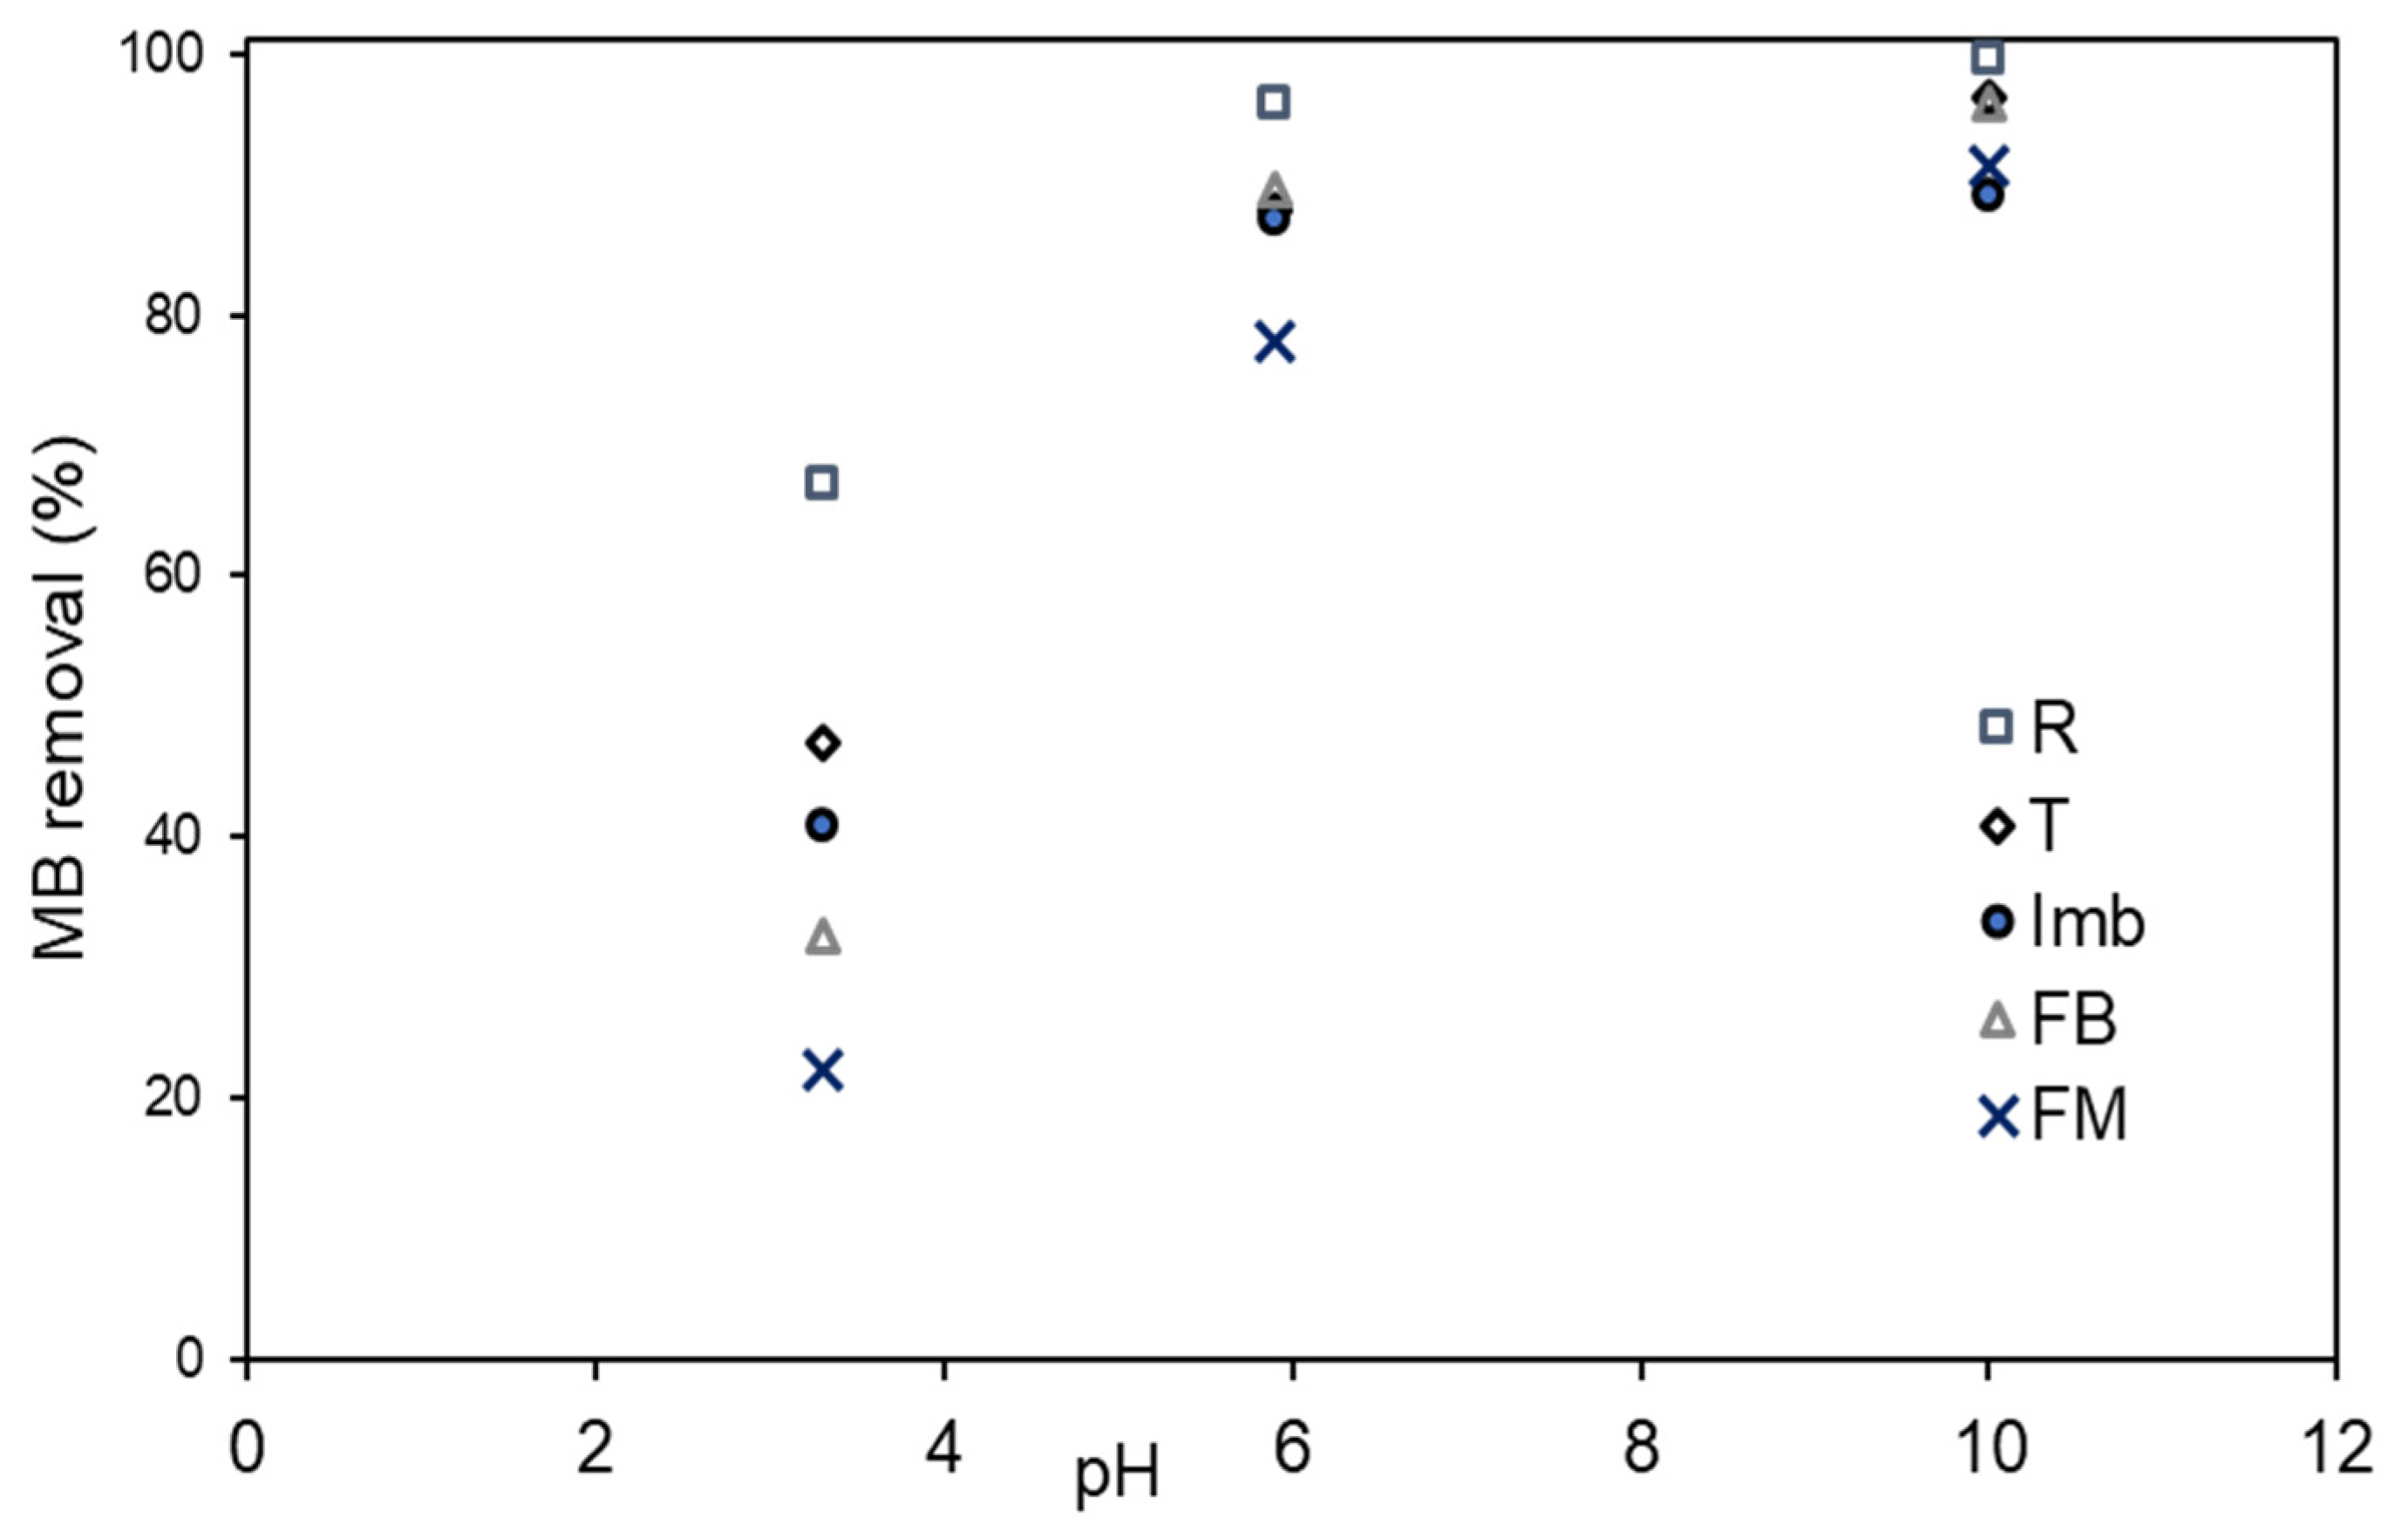
| Adsorbents | MB at pH 6.0 mg g−1 | Adsorbents | MB at pH 6.0 g g−1 |
|---|---|---|---|
| S | 63.7 | AC-S-KOH-873 | 110.4 |
| T | 27.9 | AC-T-KOH-873 | 82.7 |
| Imb | 156.8 | AC-Imb-KOH-873 | 123.3 |
| FB | 42.8 | AC-FB-KOH-873 | 118.0 |
| FM | 69.8 | AC-FM-KOH-873 | 95.7 |
| --- | --- | AC-Imb-KOH-973 | 156.9 |
| --- | --- | AC-T-KOH-973 | 159.7 |
| --- | --- | AC-T-K2CO3-973 | 248.4 |
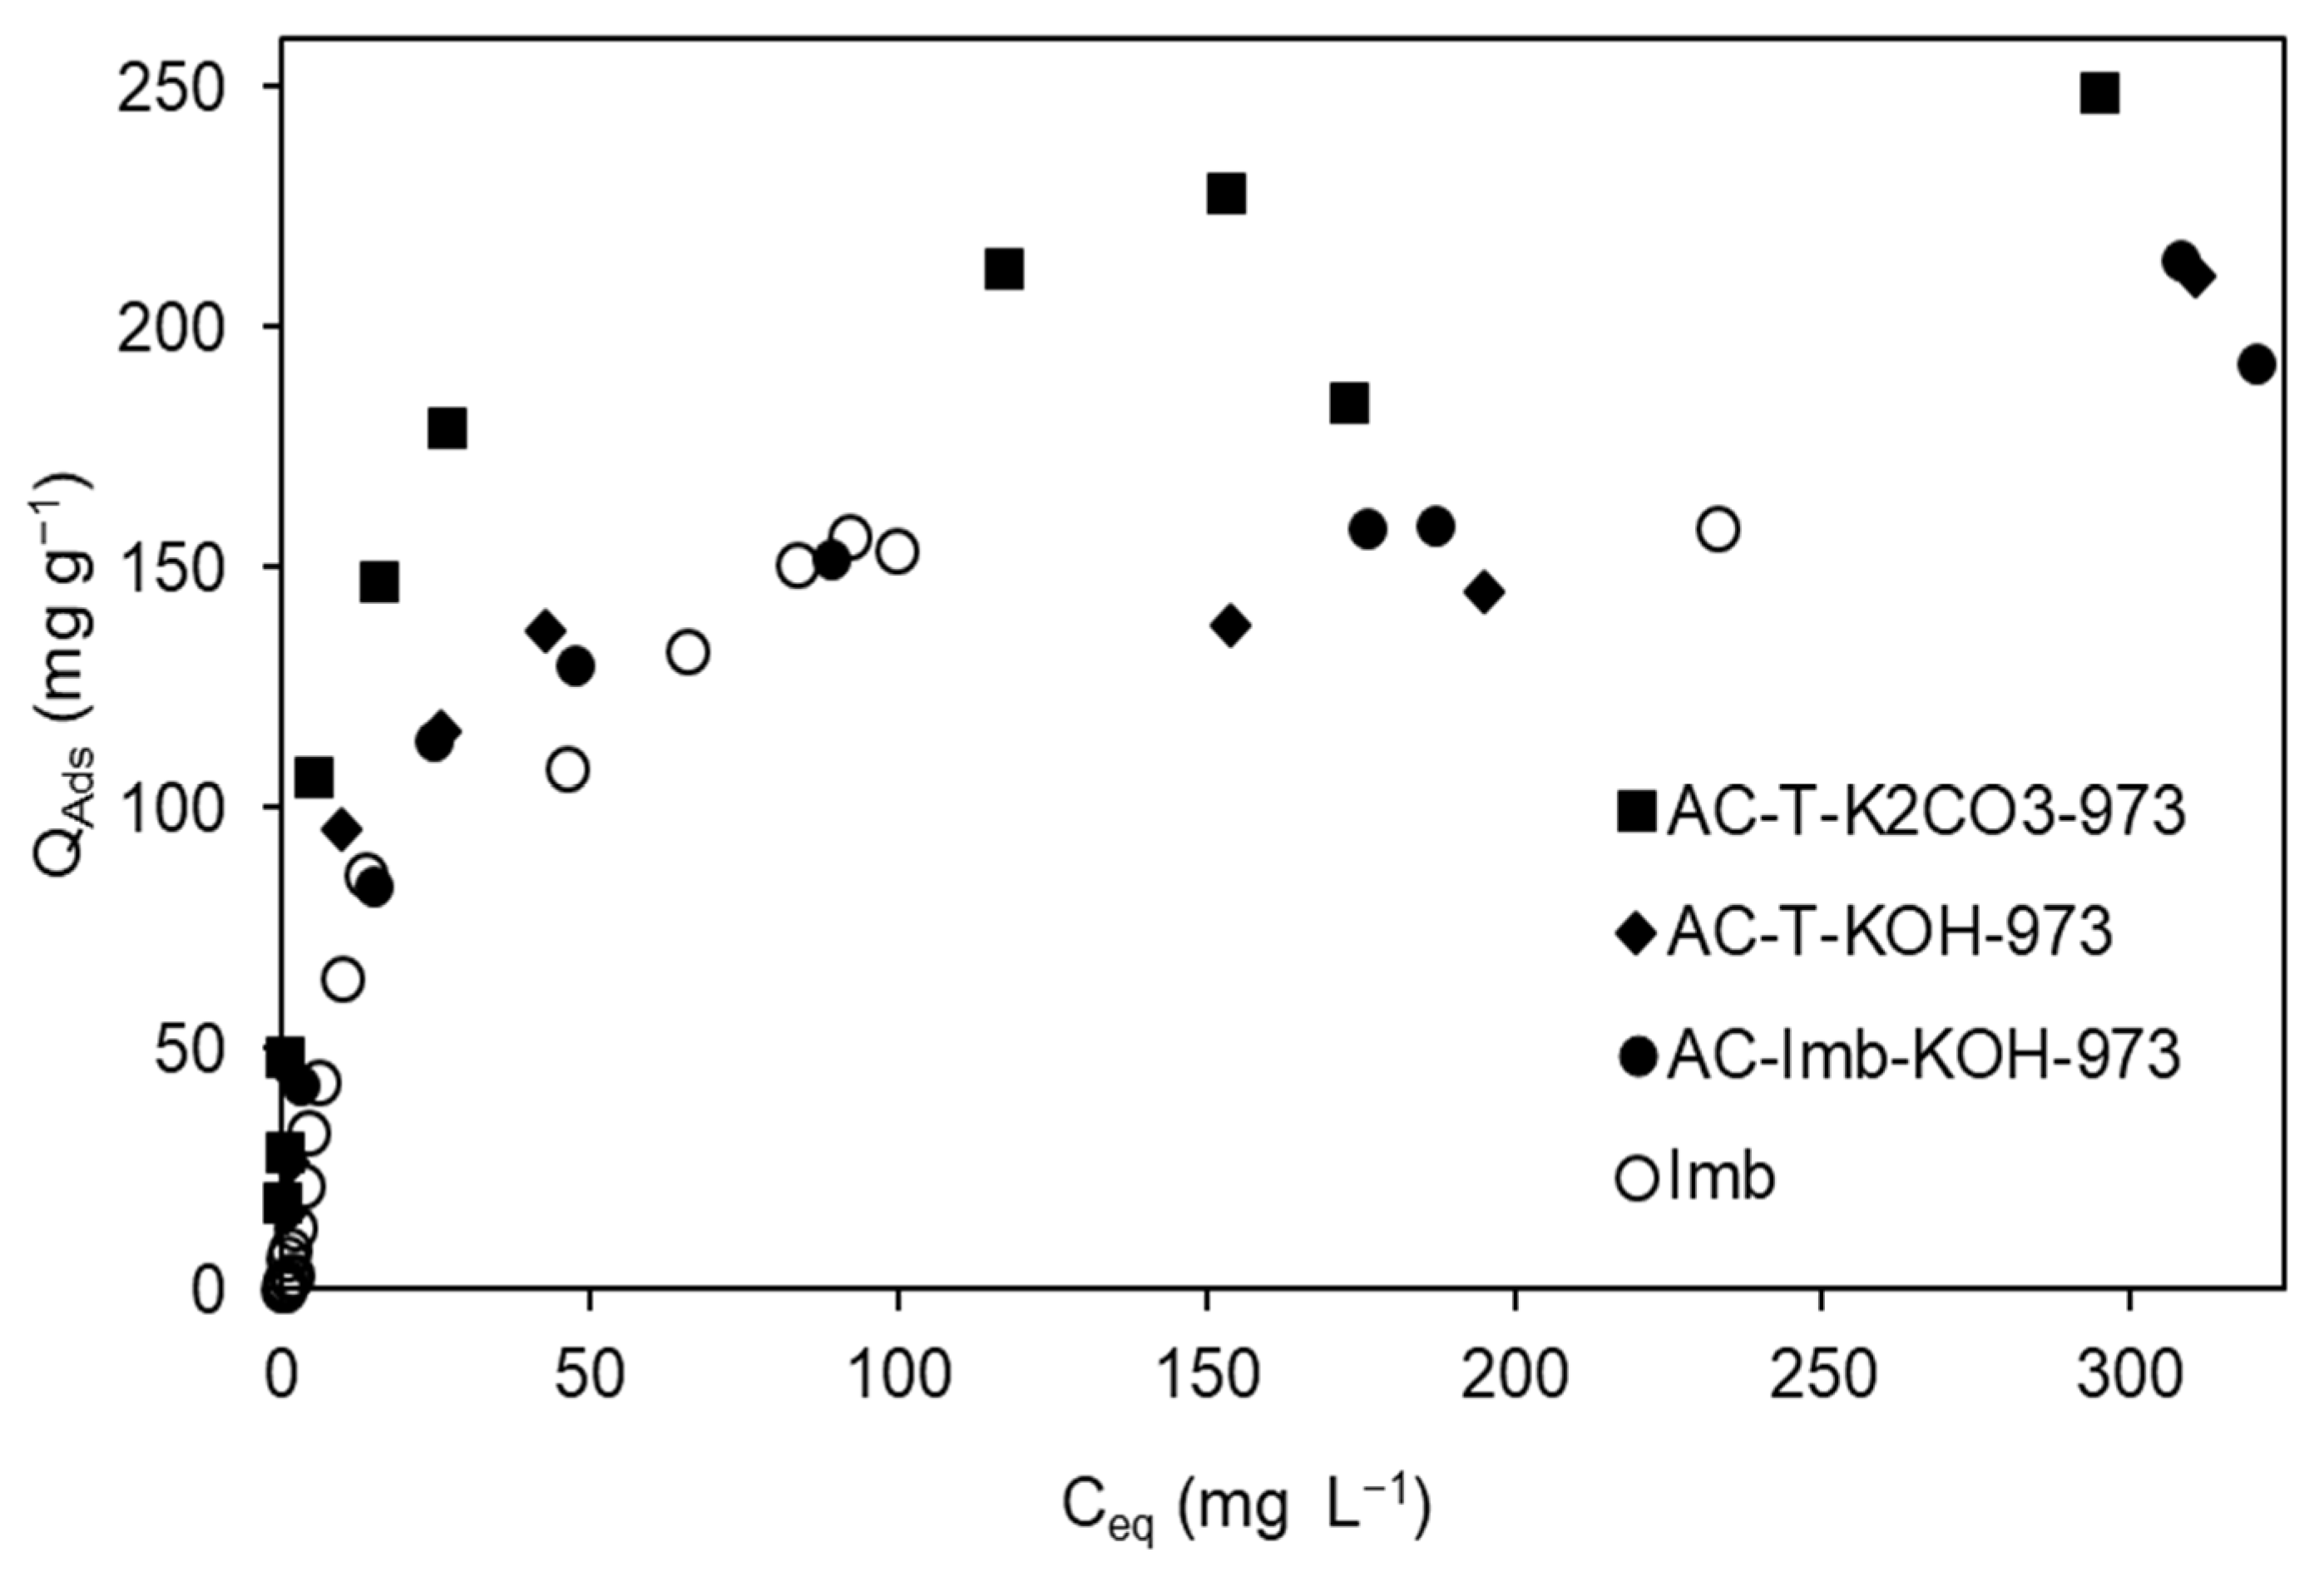
| Adsorbents | nmax mg g−1 | nmL mg g−1 | KL L mmol−1 | R2 | KF mmolg−1 [L mmol−1]1/nF | nF | R2 |
|---|---|---|---|---|---|---|---|
| Imb | 156.8 | 153.8 | 14.1 | 0.99 | 1.01 | 1.69 | 0.94 |
| AC-Imb-KOH-973 | 156.9 | 169.5 | 12.3 | 0.97 | 0.84 | 3.36 | 0.94 |
| AC-T-KOH-973 | 159.7 | 147.1 | 4.93 | 0.95 | 0.84 | 2.91 | 0.94 |
| AC-T-K2CO3-973 | 248.4 | 250.2 | 7.65 | 0.99 | 0.97 | 3.09 | 0.97 |
| Adsorbent | Methylene Blue at pH 6.0 (Batch Mode) mg g−1 | Methylene Blue at pH 6.0 (Continuous Mode) g g−1 |
|---|---|---|
| S | 63.7 | 24.7 |
| T | 27.9 | 18.2 |
| Imb | 156.8 | 49.8 |
| AC-T-KOH -973 | 159.7 | 49.1 |
Disclaimer/Publisher’s Note: The statements, opinions and data contained in all publications are solely those of the individual author(s) and contributor(s) and not of MDPI and/or the editor(s). MDPI and/or the editor(s) disclaim responsibility for any injury to people or property resulting from any ideas, methods, instructions or products referred to in the content. |
© 2024 by the authors. Licensee MDPI, Basel, Switzerland. This article is an open access article distributed under the terms and conditions of the Creative Commons Attribution (CC BY) license (https://creativecommons.org/licenses/by/4.0/).
Share and Cite
Cansado, I.P.d.P.; Geraldo, P.F.; Mourão, P.A.M.; Castanheiro, J.E.; Carreiro, E.P.; Suhas. Utilization of Biomass Waste at Water Treatment. Resources 2024, 13, 37. https://doi.org/10.3390/resources13030037
Cansado IPdP, Geraldo PF, Mourão PAM, Castanheiro JE, Carreiro EP, Suhas. Utilization of Biomass Waste at Water Treatment. Resources. 2024; 13(3):37. https://doi.org/10.3390/resources13030037
Chicago/Turabian StyleCansado, Isabel Pestana da Paixão, Pedro Francisco Geraldo, Paulo Alexandre Mira Mourão, José Eduardo Castanheiro, Elisabete Palma Carreiro, and Suhas. 2024. "Utilization of Biomass Waste at Water Treatment" Resources 13, no. 3: 37. https://doi.org/10.3390/resources13030037