Abstract
The present study aimed at testing the benefits of protecting woodchips with an acrylic crusting product developed for the coal energy industry. In the test carried out, four conical wood chips piles were built, two consisting of fresh biomass, the other two of dry wood chips. A fourth larger pile was built as a reference. One dry and one fresh pile were superficially treated with 25 kg of protective acrylic solution diluted in 250 L of water, providing an average application of coating agent of approximately 85 g m−2, while the other two worked as controls. To monitor the piles’ temperature variation, thermal sensors were placed in the inner part of the five piles during their construction. Moisture content (MC) and dry matter (DM) variations in woodchip piles were recorded. The piles treated with the coating agent did not show any significant differences with the untreated piles: in wet material, the protective film slightly reduced the moisture dispersal from the pile from evaporation rather than limiting water intake from rain; in dry material, this confirms the inability of the coating agent to limit water intake from rainfall.
1. Introduction
The management of large quantities of woody biomass is a complex activity and an issue of the utmost importance for optimizing the efficiency of bioenergy facilities. Wood is a biological material, which can be degraded by a large variety of microorganisms, particularly when the physical protection of bark is removed [1]. The necessity to simplify logistics and storage of the feedstock generally leads to comminution of the tree parts early in the supply chain [2]. Once comminuted, either by chipping or shredding, wood tissues are greatly exposed to microbial attack [3] and exothermic oxidation processes [4,5], consuming the biomass starting from the simpler chemical constituents (sugars). In the second stage, it the degradation of the main components of wood occurs: cellulose, hemicellulose and even lignin by the activity of specialized fungi [6], which can bring to an increase in ash contents in the feedstock [7]. This process leads to a monthly loss of dry matter (DM) that can vary from 1.0% to up 6.5% of mass fraction on dry basis [8]. Biomass degradation also produces heat, which reduces the moisture content (MC) of the biomass vaporizing part of the water, which is driven away from the biomass pile by heat convective movements. When wood is used as a fuel, this process may offset the loss of DM, since it increases the heating value of the remaining biomass. This balance is clearly positive when the biomass is sheltered under cover, but it may be very unfavorable for piles stored outdoors in humid and rainy weather conditions [9]. The woodchip particle size and level of pile compaction as well as tree species and part of the tree used as a feedstock are considered, among other factors, responsible for the increase in DM in comminuted material piled in uncovered yards.
In outdoor storage of wood chips, the use of protective covers with fleece (polypropylene non-woven fabric) proved to be an effective solution to maintain or even enhance the energy content of wet biomass, particularly when used during rainy and cold periods [9]. Some authors [10] found that woodchips covered by a breathable tarp showed a decreasing content of MC uniformly inside the pile throughout the storage observation period. According to [11], this storage system is the most convenient for balancing direct storage costs and energy content variations in the biomass. Yet, deploying the system at an industrial scale is challenging. In fact, covering the stored woodchips is an expensive and cumbersome operation, which is seldom performed in storage yards of large biomass facilities where piles may extend over areas exceeding one hectare.
An alternative solution could be provided by crusting compounds currently used as a protective coating for coal fuel stored in stockpiles in large energy facilities. These are essentially glue-based products applied by spraying directly on the surface to be protected. In the original application, these coatings are used to control dust emissions of large stockpiles, but also to limit rewetting due to exposure to rain [12]. Originally composed mainly of latex, a variety of crusting compounds had been developed to reduce production and usage costs and increase applying efficacy and environmental performance [13]. Furthermore, being developed for solid fuels, these compounds do not significantly alter the combustion performance and emissions of the facilities fed with the treated feedstock.
The possibility to spray a protective layer directly on the pile built in the yard is also an attractive option for the bioenergy sector. This would greatly simplify the operation and its costs, making it much more effective than plastic and fabric covers, which need careful application (largely manual) and even more careful removal when the pile is being consumed. At present, crusting compounds are used to protect mineral materials (e.g., coal) with relatively low initial moisture contents. Thus, their efficacy when used on fresh wood chips is unknown. On the one hand, a complete and non-permeable film would limit water intake from rainfall, but, if thoroughly laid, it could also impede to expel the water vapor produced by the microbial activity heating the pile, reducing its capacity to self-dry during storage [14]. On the other hand, wood chips are a much coarser and more porous material than the coal used in power plants, and the irregular surface of the biomass piles could reduce the effectiveness of the crusting agent with gaps that allow rainfall and runoff water to penetrate the pile. These same conditions could be beneficial if porosity allows water vapor to be expelled while limiting, even partially, the superficial permeability to rain or humidity, for instance, creating a hydrophobic but porous superficial layer. A similar phenomenon was observed by [15] using a water-resistant but breathable cover, which reduced the MC of the stored biomass, while the fully waterproof covers lead to an overall increase in MC.
Considering the above, the present study aimed at testing the benefits of protecting woodchips with an acrylic crusting developed for the coal energy industry. More specifically, the main goals of the study were as follows:
- -
- To quantify the protection capacity against rainfall for uncovered piles of dry and fresh woody biomass in winter Mediterranean conditions, typically characterized by high intense rainfall and relatively high temperatures, factors leading to high biomass losses due to microbial degradation;
- -
- To determine the possible benefits in terms of heating value increase or preservation after the storage period provided by a coating application feasible in common biomass yard management.
2. Material and Methods
2.1. Woodchips Piles
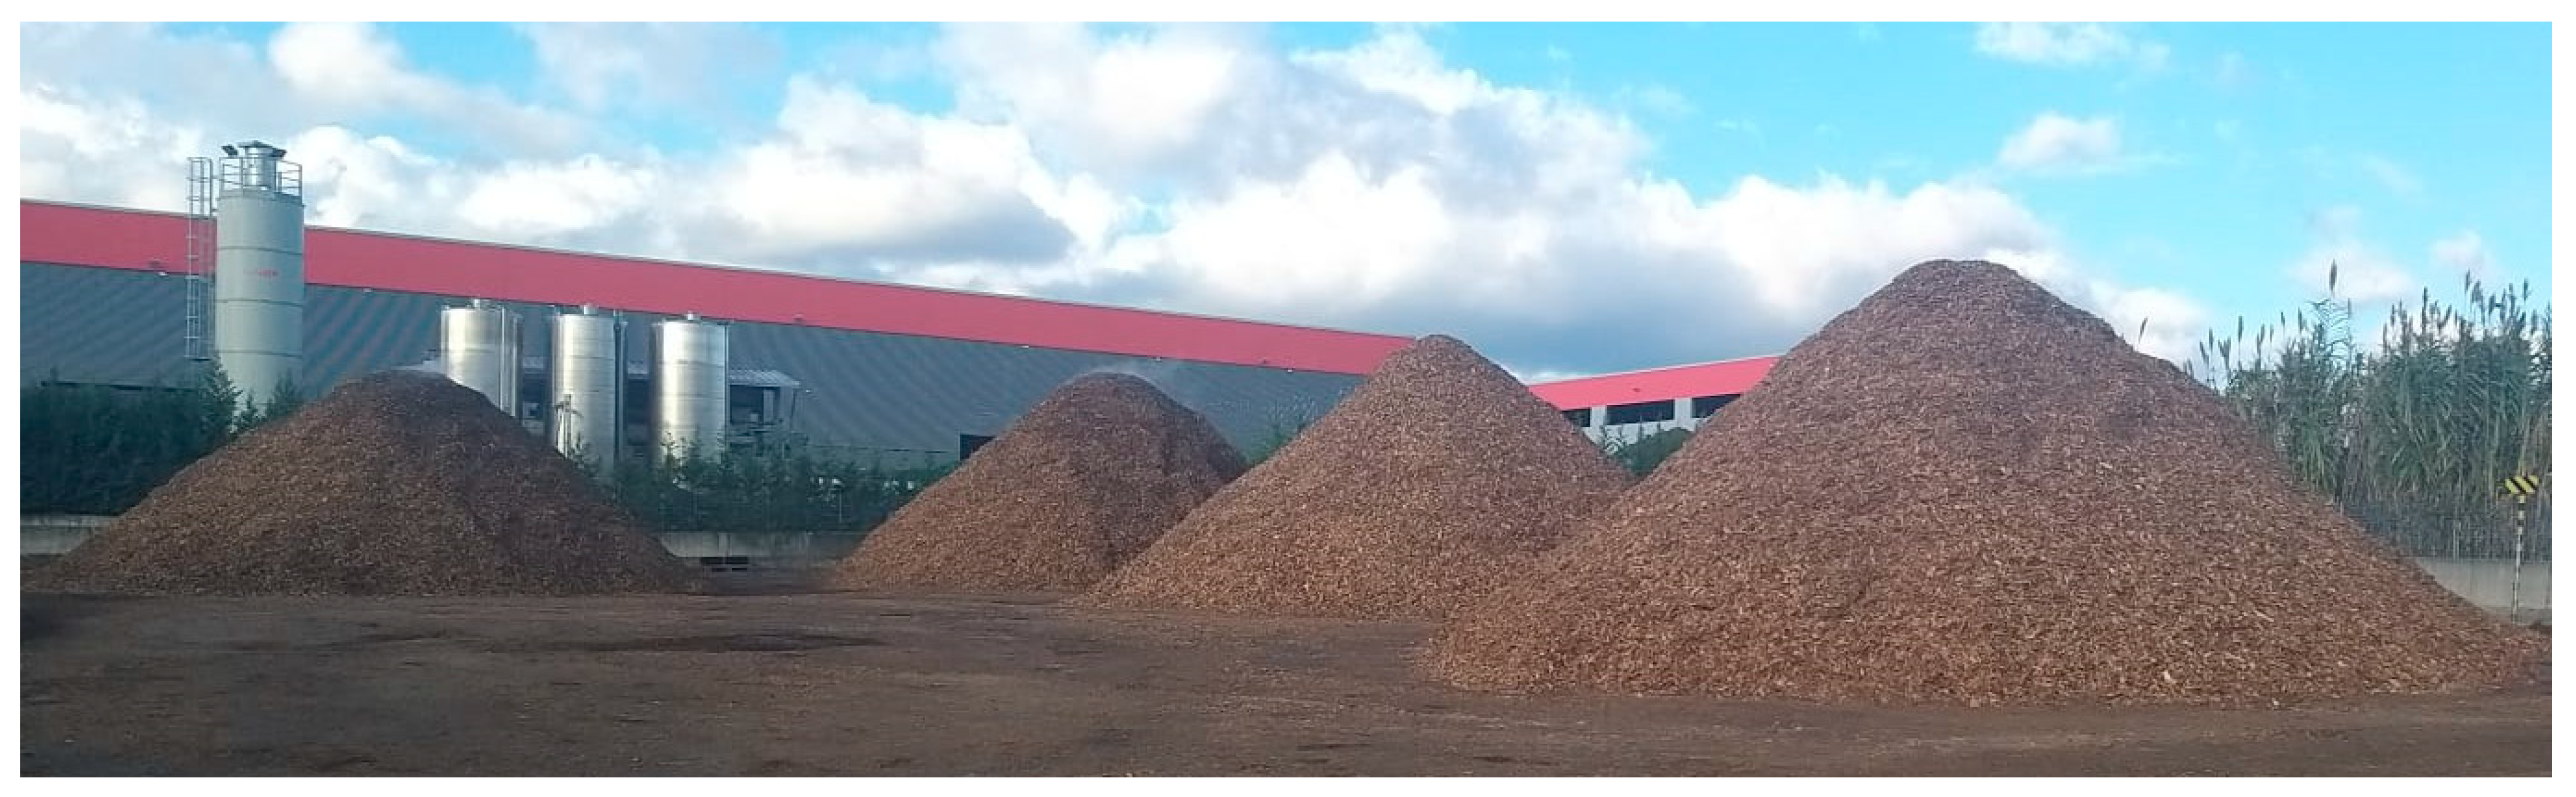
The test was carried out from the 15 December 2020 to the 19 January 2021 on the paved storage yard of a power plant located in the Calabria region, Southern Italy (33.37 N, 16.24 E). Four conical wood chips piles were built with diameters and heights, respectively, of approximately 12 and 6 m, resulting in an exposed area of approximately 639 m2 and a total volume of approximately 904 m3 (Figure 1):
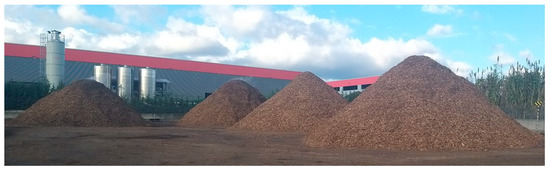
Figure 1.
Layout of the test piles just after their construction. The wet biomass composing the two piles in the background is already steaming, while the two dry piles in the forefront show no sign of heat development.
- -
- Two piles (Pile 1 and Pile 2) were built with the fresh biomass delivered within the routinely fuel procurement of the facility. The wood material was a mix of conifers (Pinus spp.) and broadleaves (Quercus spp. and Castanea sativa Mill.). To minimize the differences between the piles, three pairs of loads from the same site and contractor were selected among the daily arrivals.
- -
- Two piles (Pile 3 and Pile 4) were prepared with dry wood chips from the facility’s roofed fuel storage. This biomass was composed of a similar mix of conifer and broadleaves material, delivered as fresh wood chips in July–August 2020 and stored for 4–5 months.
Due to the different initial moisture content (MC), fresh and dry piles of similar volume had a total weight of approximately 97 and 67 tons (t), respectively.
Both dry and wet biomass were carried to the test site with trucks. The payload was determined by means of the certified weighbridge of the facility, which had a 20 kg resolution. The weight of truckloads was used to determine the total mass of each pile. The MC was measured on samples collected just after unloading the trucks. For fresh biomass, five samples per load were collected, delivered by 90 m3 semitrailers. For dry biomass, one sample per truck was considered sufficient due to the smaller size (approximately 20–25 m3) of the vehicles used to displace the dry wood chips from the roofed storage to the test area.
Before creating the piles, the biomass was mixed with a front loader. An excavator was deployed to further mix the biomass, arrange the heaps in similar conical shape and compact the woodchips. The latter action was necessary to emulate the normal storage condition of wood chips in the power plant, where the transit of heavy machinery over the pile during its construction compresses the lower layers of biomass.
As well as the four test piles, a larger reference pile was built using the remaining feedstock delivered by the biomass suppliers during the day (Figure 2). This pile was 8 m high, with a total mass of 1167.67 t, and was used as a reference to compare the evolution of its inner temperature during storage with the temperature of the other piles stored in the facility. Real piles are composed of over 10,000 m3 of wood chips [16] and are built in flat-topped heaps with an initial height of 12 m (subsiding to 10 m during storage) and an average permanence in the yard of 3 months.
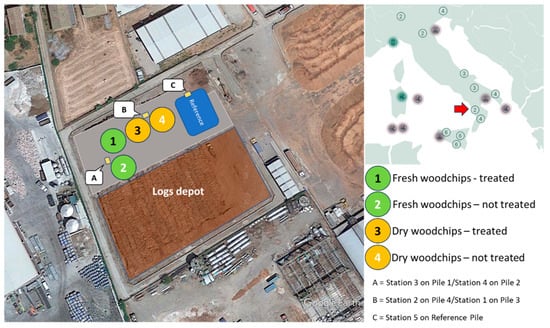
Figure 2.
Layout of the test site: numbers from 1 to 4 refer to test piles; letters from A to D refer to thermal sensor stations. The red arrow at the top right in the picture shows the energy plant position on the Italian map. Circles on the map refer to the bioenergy facilities of the country.
To monitor the piles’ temperature variation, helpful for providing information about the microbial activity and degradation rate, thermal sensors were placed in the inner part of the five piles during their construction (Figure 2 shows piles 1 to 4, plus the reference pile, pictured as a blue rectangle) at an approximate height of 1.5 m off the ground.
Once completed, one dry and one wet pile (piles 1 and 3, respectively, in Figure 2) were superficially treated with 25 kg of protective acrylic solution diluted in 250 L of water, providing an average application of coating agent of approximately 85 g m−2. This concentration was double compared to that commonly used on coal piles, since a single treatment was preferred to the common double coating treatment with a lighter solution. The coating agent was applied with an agricultural sprayer equipped with a manual nozzle gun (Figure 3). The spraying procedure was conducted in a quick and easy way, thought to be more of a running custom at biomass energy plants than a lab activity. This is why neither the particle size of woodchips nor the spraying time were measured.

Figure 3.
The spraying of woodchip piles by means of a common agricultural sprayer.
2.2. Sampling of Stored Biomass
After five weeks of storage, a telescopic handler equipped with a 2 m3 bucket was used to gradually disassemble the pile and carefully load the biomass on trucks for weighting.
The distribution of sampling spots and their relative number was designed to represent the MC of the different areas of the pile after storage and their expected relative weight over the total MC of the pile. This solution was adopted to cope with the tendency of MC layering into the stored biomass, as observed by Heinek et al. [17], who described the creation of three well-differentiated areas in the pile section, as demonstrated in Figure 4: (1) the outer layer is described as the “weather belt” and represents the area with a higher MC due to the intake of rainfall and condensation of the water vapor rising from the inner and warmer layers; (2) the “aerobic layer” is the main part of the pile, with partial oxygen presence, relative microbial activity and biomass drying favored by the heat generated in the (3) inner core area called the “anaerobic layer”, which produces the higher temperatures and experiences the maximum DM losses.
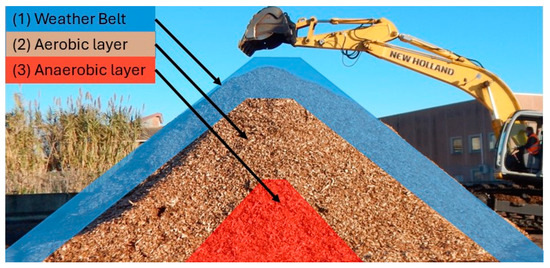
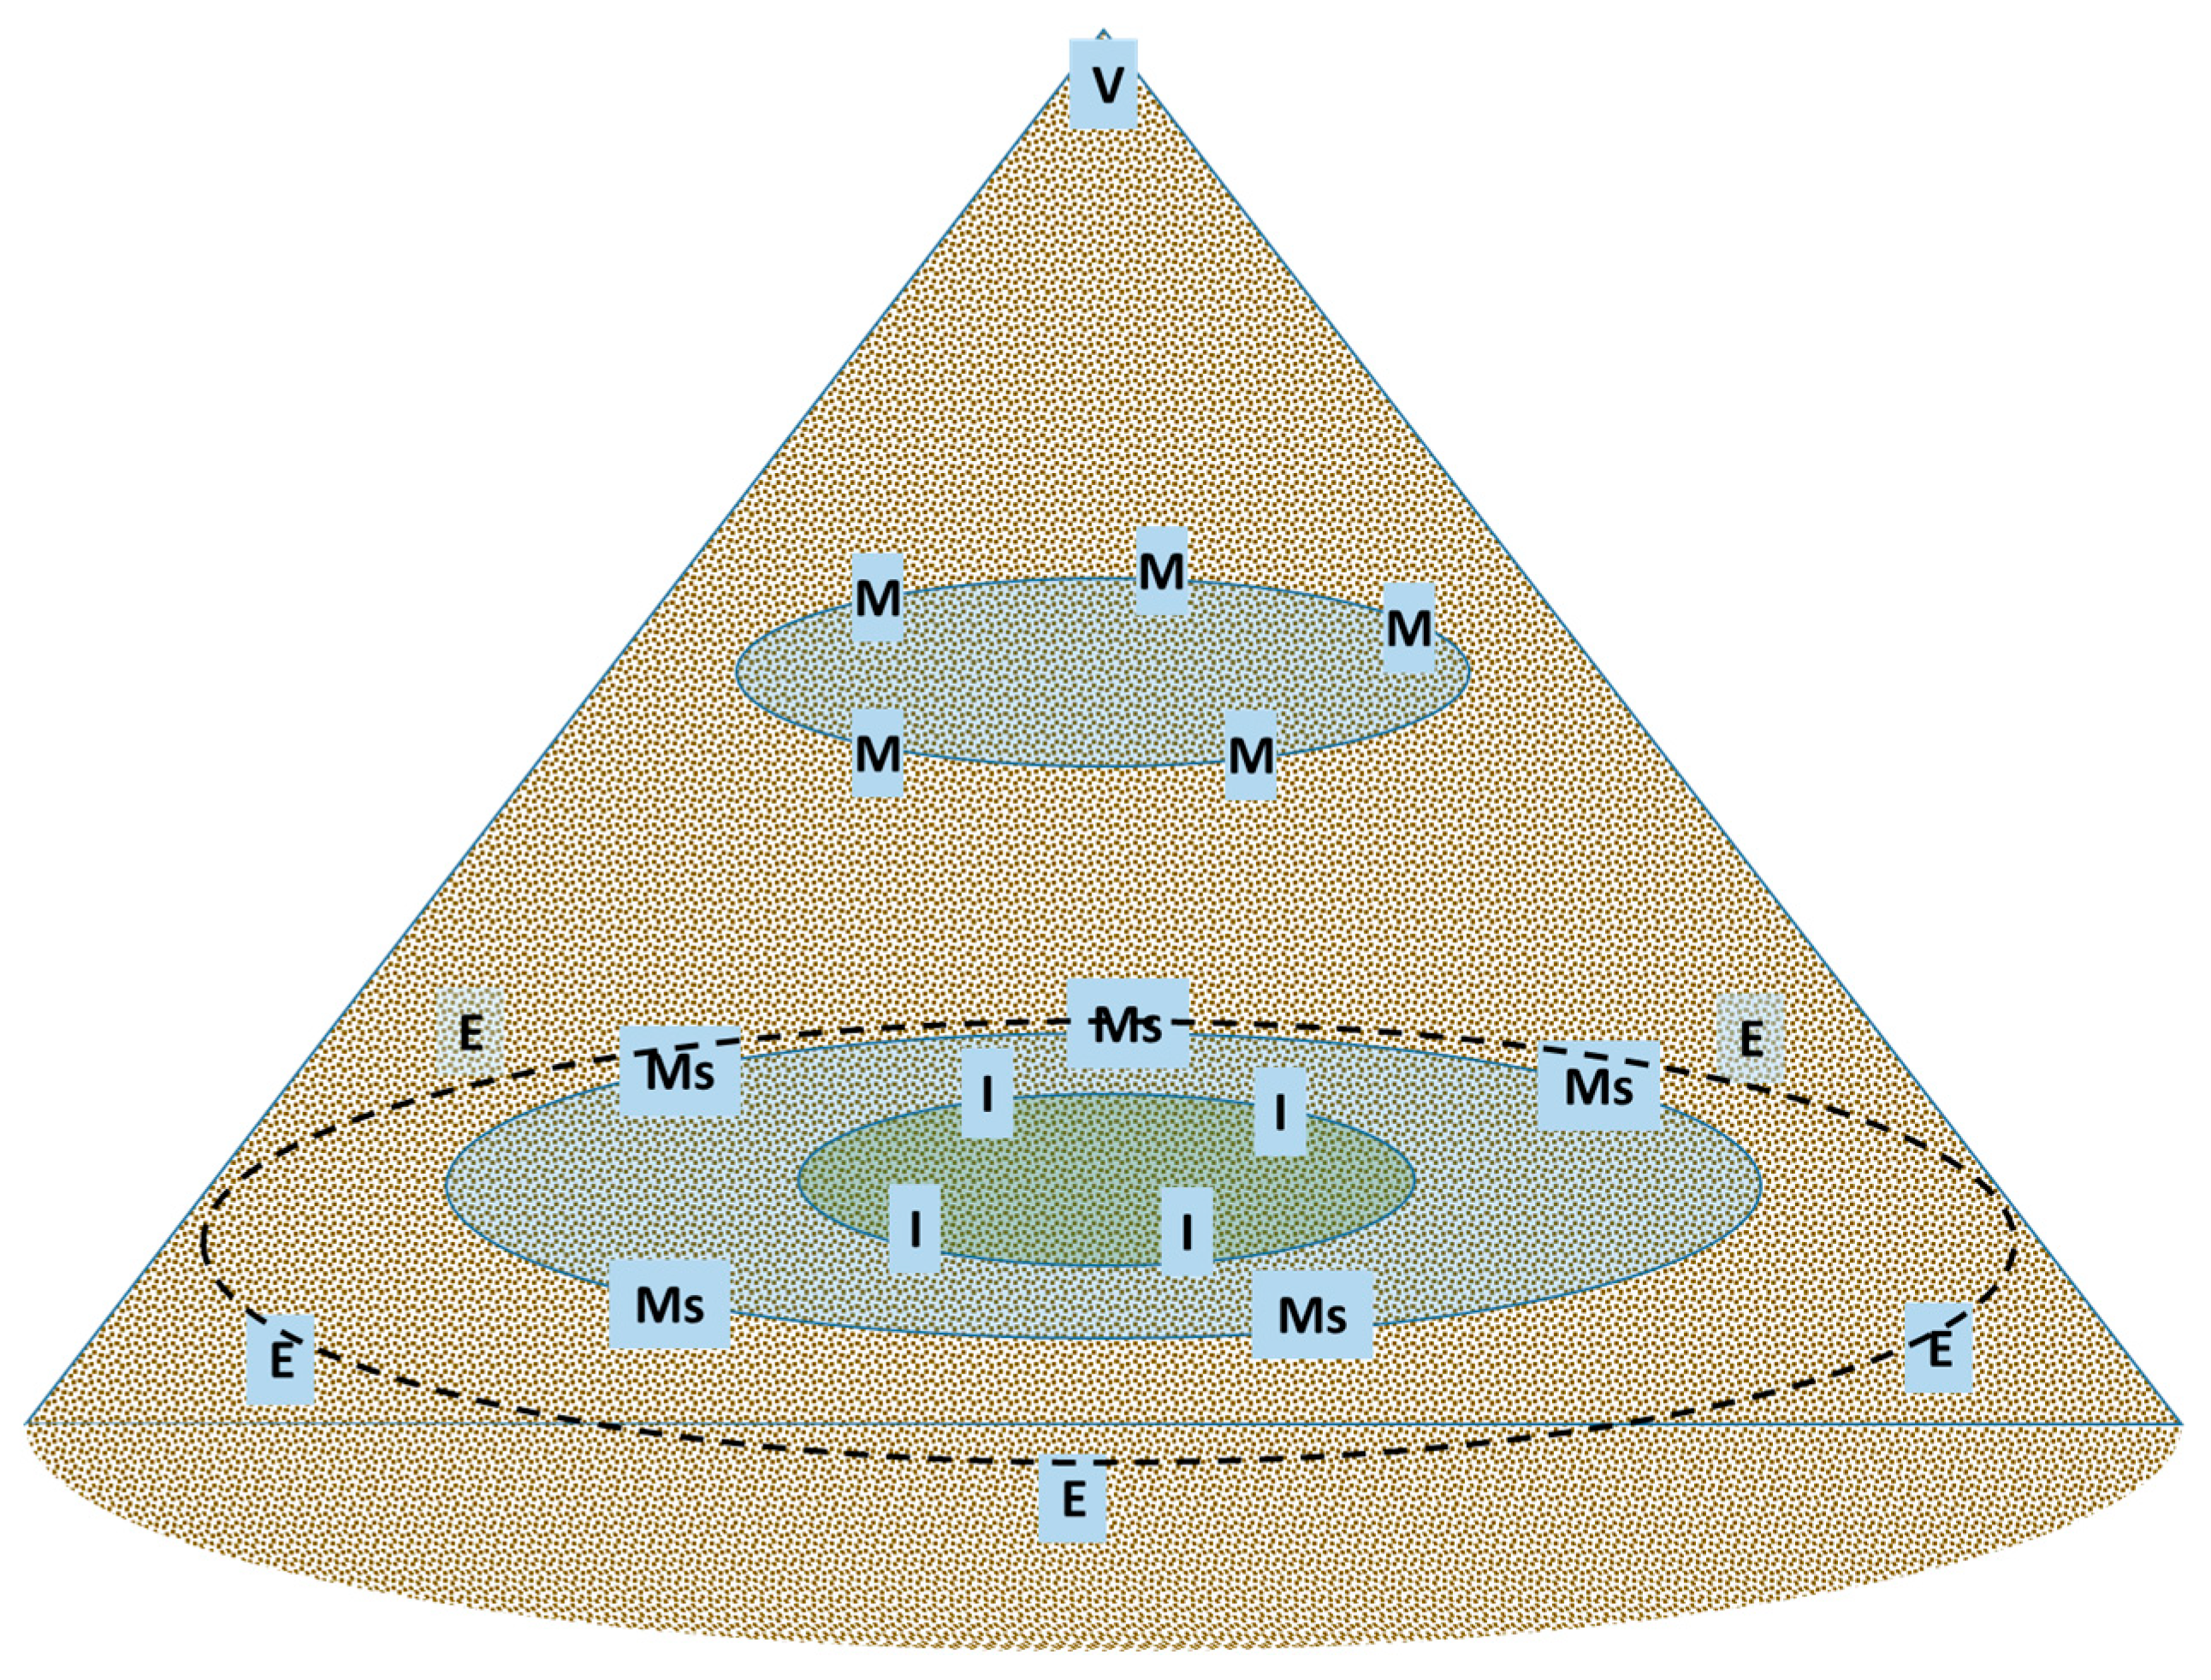
Figure 4.
Model of the vertical profile of a woodchip pile after open-air storage according to [17].
While the previous description returns a composition of close-to-geometric layers, easy to quantify in terms of the relative volume over the total pile’s bulk, Lenz et al. [18] reported that meteoric water and internal steam condensation generate a much more unpredictable dynamic of MC allocation within the pile. This is determined by factors such as the shape and size of the pile, the type of biomass, its granulometry and initial MC as well as the air temperatures and rainfall intensity, making impossible to precisely determine the share of each layer within the pile.
To capture this internal variability, 20 samples per pile were collected (Figure 5), differentiating 5 sampling areas visible in Figure 6 and identified as follows:
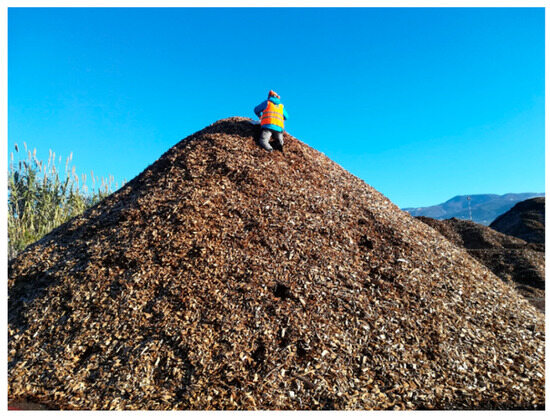
Figure 5.
Sampling the biomass piles.
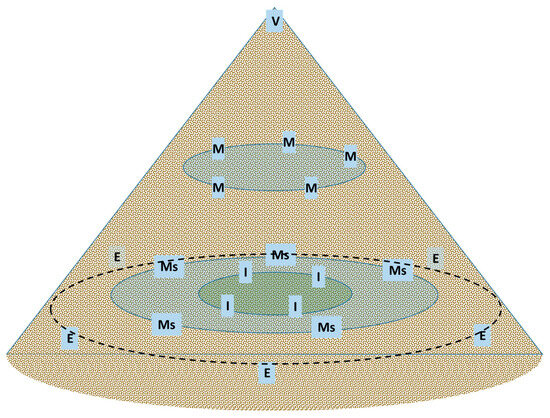
Figure 6.
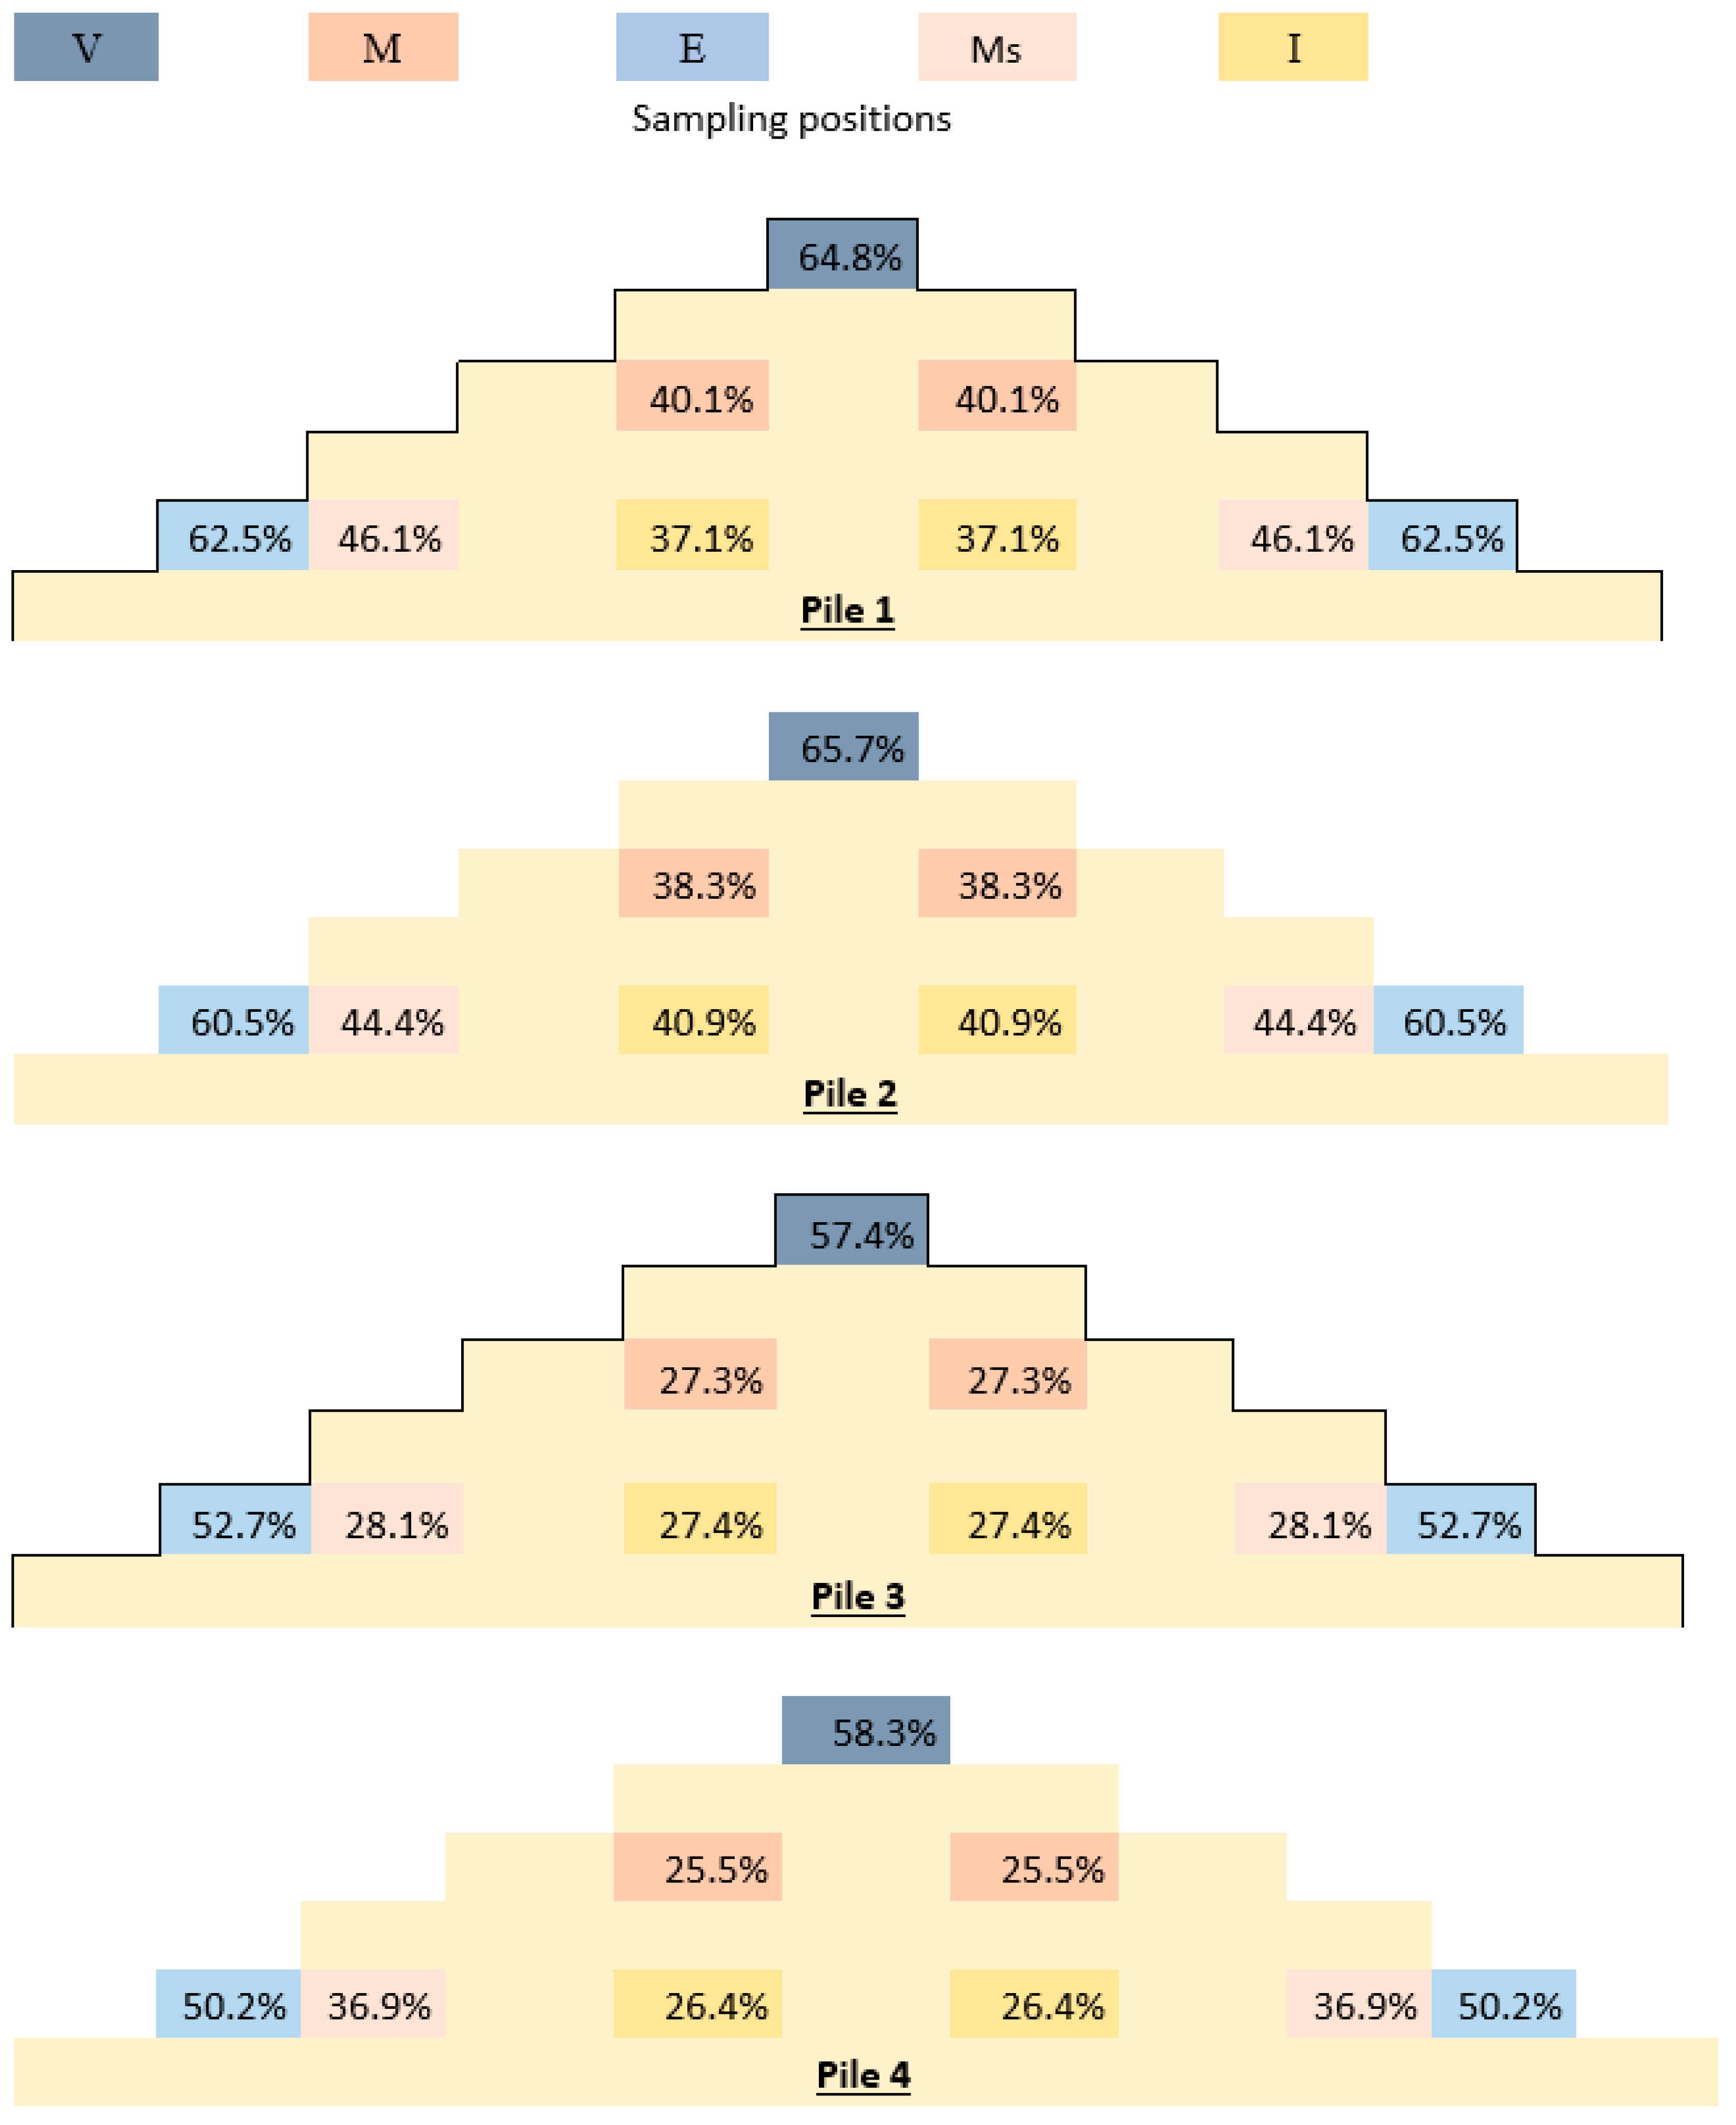
Sampling position within the biomass piles. V = top sample; M = internal samples at middle height of the pile (about 3 m off the ground); Ms = internal samples external to core (about 1.5 m–1.8 m off the ground); I = inner core samples (about 1.5 m–1.8 m off the ground); E = external samples from the surface of the pile (about 1.3 m off the ground).
V—one sample collected at the top of the cone (5 m) at a depth of approximately 20 cm below the surface.
M—five replicates collected over an ideal circumference located at approximately 3 m off the ground and with a radius approximately 0.8 m–1.0 m shorter than the section of the cone at this height (i.e., internally and with a horizontal orientation).
Ms—five replicates collected as above on a circumference, located at a height of 1.5 m–1.8 m off the ground and 1 m shorter than the cone radius.
I—four replicates collected at the same height as above, but in a more inner position, corresponding to a circumference with a radius 3 m shorter than the total cone section.
E—five replicates collected at the surface of the pile, at a depth of 20 cm and a height off the ground of approximately 1.3 m.
The sampling design was also meant to provide a weighted average of MC, considering the different share represented by the three layers: the external layer or “weather belt” was represented by six samples (V and E), the medium (Aerobic) layer was represented by ten samples (M and Ms), and the inner (Anaerobic) core was represented by four samples (I).
For each pile, the MC was calculated as an average of all the samples collected in that pile. The dry matter content (DM) was calculated as the difference between the total mass of the pile and the mass of the water contained in it (according to the estimated MC value). The energy content of the piles before and after storage was calculated according to the following formula:
where:
EC = ((18.5 × (100 − MC)) − (2.44 × MC)) × 10 × Weight
- EC = energy content expressed as MJ t−1;
- MC = average moisture content of the pile expressed as a percentage on a wet basis;
- Weight = weight of the pile expressed in t;
- The values 18.5 and 2.44 are, respectively, the calorific value of 1 kg of dry wood and the energy required to evaporate 1 kg of water, both expressed in MJ.
Rainfall and air temperature records for the test period were extracted from the database of the Calabria region, collected by a weather station located approximately 15 km from the test site.
2.3. Moisture Content Measurement
Biomass samples were tipped into paper bags with a tare weight of 4 g and weighed using a precision scale for measuring wet mass. Afterwards, the bags were closed and transported to a laboratory for determining the oven dry mass according to standard method (thermogravimetric method) [19]. A laboratory scale with a precision of 0.01 g was used for weighing all samples.
2.4. Statistical Analysis
The test was designed as a factorial completely randomized experiment. The assumption of homogeneity of variances between the pile sections was tested using Levene’s test. Analysis of variance (ANOVA) was performed using a general linear model (GLM) followed by Tukey’s highly significant difference (HSD) test.
3. Results
3.1. Initial Moisture Content
The initial MC of the test piles is shown in Table 1. Due to the intrinsic variability of wood chips, the average MC of the piles is slightly different even between piles of similar material.

Table 1.
Initial moisture content values of the test piles.
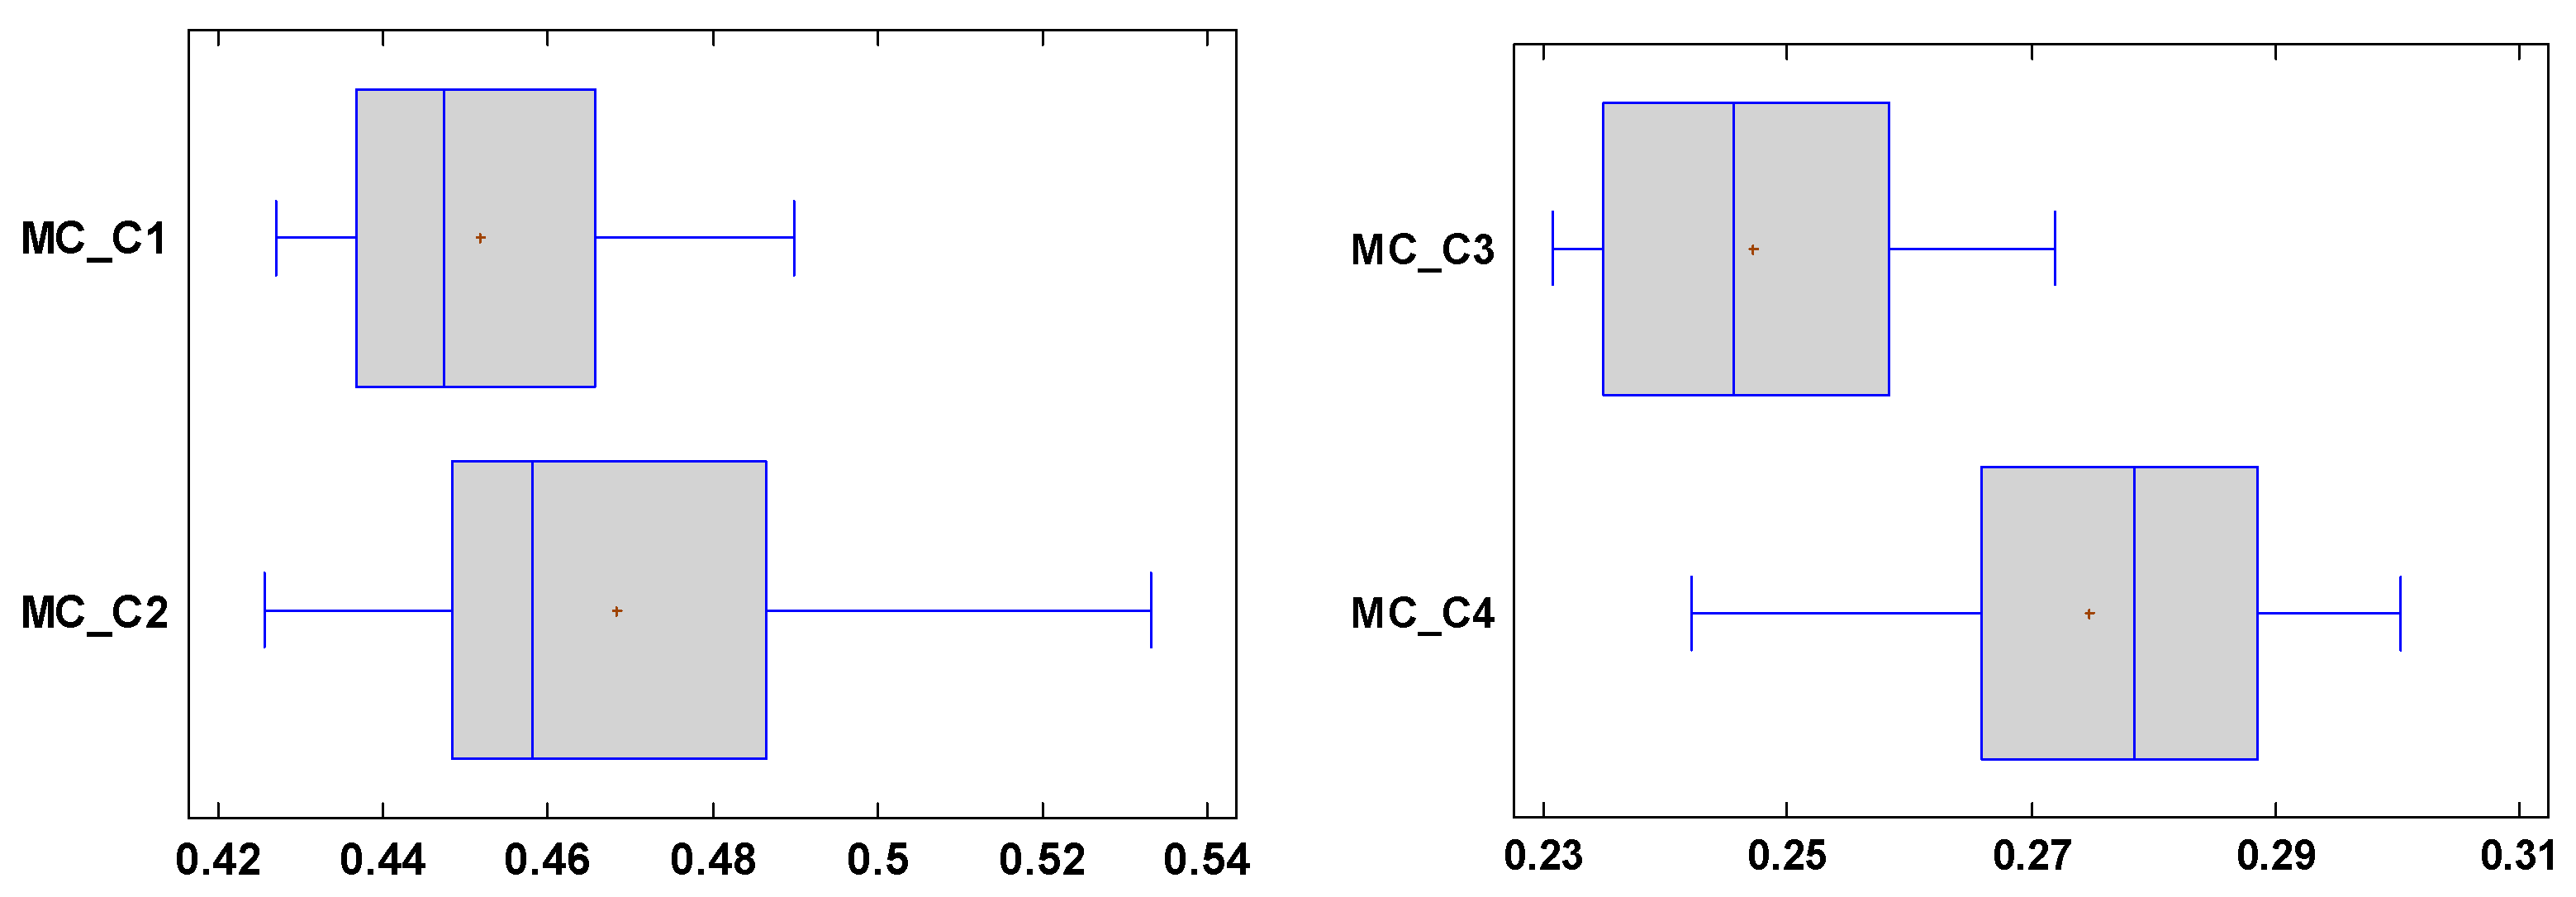
This difference is not statistically significant for the wet piles, while is significant for the dry piles, made with stored biomass (Figure 7).
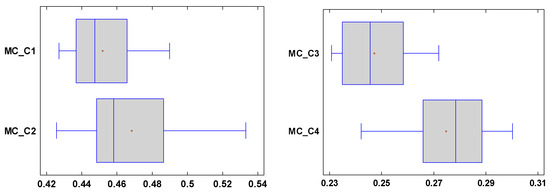
Figure 7.
Box-and-whisker plot comparing the average MS values at the inner sampling positions comparing Pile 1 vs. Pile 2 (left) and Pile 3 vs. Pile 4 (right). MC-C1 = moisture content of Pile1; MC-C2 = moisture content of Pile2; MC-C3 = moisture content of Pile3; MC-C4 = moisture content of Pile4.
Yet, this difference is small and both dry piles feature an MC below 30%, which is considered as a threshold below which microbial activity is very limited [3]. Thus, both piles can be considered as initially “not active” from the biological degradation point of view.
3.2. Temperature and Weather Conditions
During the five-week storage time, total rainfall amounted to 149 mm, showing the typical intensity of winter meteoric events in Mediterranean mountain areas. Accordingly, average daily temperatures recorded by the weather station of Cosenza were always above 0 °C (Figure 8). No snow events were recorded.
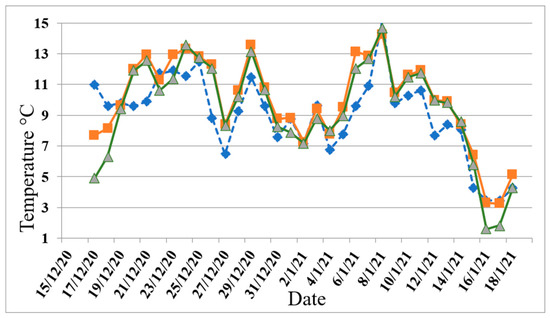
Figure 8.
External average air daily temperatures recorded by the two operative stations (orange line = Pile 2 and green line = reference pile) compared to the data recorded by the weather station of Cosenza (dotted blue line).
Due to a software malfunction in thermal sensor dataloggers, just two stations out of four gathered useful data. Although this is a clear loss of information, the main target of temperature measurement was fulfilled. In fact, the two operative dataloggers were the one installed on the untreated pile of wet biomass and the one in the large reference pile.
Temperature development during the storage interval showed a different pattern between the test and the reference piles (Figure 9). In the large reference pile, the temperature evolution was consistent with what was observed in other studies comparing different sized heaps [20]. It features an activation period with stable low temperature lasting approximately a week followed by an exponential increase that exceeds 50 °C in approximately 5–7 days and stabilizes to approximately 65 °C for the remaining time (a slight decreasing trend can be recognized). In contrast, the small pile showed completely different behavior, with an immediate temperature increase that reached a maximum of 57 °C in 6 days and a gradual declining trend after two weeks. This rapid heat development can be explained by the presence of biomass already “activated” in the small pile. In fact, one of the three trucks used to compose Piles 1 and 2 was delivered in the early morning biomass with a temperature of 18 °C (against 8 °C of the remaining material), when the air still had a temperature below 0 °C.
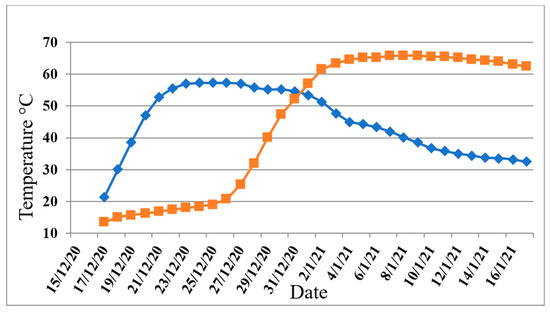
Figure 9.
Temperature values recorded within the test of fresh-treated biomass in Pile 1 (blue line) and the reference large pile (orange line).
3.3. Moisture and Energy Content Evolution with Storage
After 5 weeks of storage, Piles 1 and 2 (composed initially of fresh biomass) showed little overall variation in terms of total MC (Table 2), with the untreated Pile 2 resulting in a slightly higher MC loss of 1.8% points. Nevertheless, comparing the replicates of the same sampling position in different piles (e.g., Mpile1 vs. Mpile2), no significant differences could be detected.
Table 2.
Initial and final values of moisture content (MC), mass, dry matter (DM) and energy content for the tested piles.
The MCs of Piles 3 and 4, composed initially of dry biomass, increased by 9%. In this case, the comparison of MC values of the different sampling positions showed a significant difference for Ms samples, with Mspile3 and Mspile4 having average MCs of 28.1% and 36.9%, respectively (Figure 10). These figures correspond to an MC increase of 3.4% and 9.4%, respectively, for Piles 3 and 4.

Figure 10.
Average MC values at the different sampling positions after 5 weeks storage. NOTE: the position in the figure is simply indicative of the actual sampling position; values in the same pile are symmetrically repeated on the same sampling position on the left and right. Underlined text indicates the pile depicted.
The variations in total mass of the piles were quite similar to those described for the MC, apart from Pile 2, where the weight decreased by 3.44 t more than that of Pile 1. Dry Piles 3 and 4 showed a similar pattern, with a mass gain of over 9 t.
The variations in DM were on average 2.5 t for Piles 1 and 2, corresponding to approximately −5% of the initial DM mass, which is quite high compared to the findings in other research, such as those reported in [21], where woodchips stored for a period of 6–9 months had recorded energy losses of between 6.8 and 21.4%; or those stated by [22], where, after a total storage period of approximately 9 months, dry matter losses were between 22% and 21%, depending on the particle size distribution of the feedstock. This confirms the vigorous microbial activity recorded as heat development and visually observed as steam rising from the piles (Figure 1). In the dry piles, the DM variation was −0.95 t and +0.12 t for Pile 3 and 4, respectively. The latter is clearly a biased result since no increase in DM can occur in dead tissues such as wood chips. Given the small magnitude of the figure, it could be argued that it is due to a measurement error (e.g., in weighing the total mass before and after storage). Nevertheless, similar unexpected values can be found in previous studies where the total mass of the pile had been measured before and after the study, such as in [17]. The cause of this error is probably due to the limited reliability of the current MC estimation procedures, which could not be detected in previous studies lacking the total pile mass variation (generally, only the mass variation in the samples is measured). This hypothesis seems to be confirmed for Pile 3, where, according to the present estimate, the MC increase corresponds to almost 10.3 t of water, while the overall weight variation is just 9.3 t. According to the usual assumptions, the difference would be explained as DM loss (1 t). Yet, the dry piles did not show any sign of microbial activity such as steam emissions or heat development (the latter was manually detected during sampling as the thermocouple data were lost); thus, the loss of DM seems an unlikely event.
Given the above observations, the relative weight of each sampling area was reconsidered. In particular, the superficial samples V and E together represent 24% of the total samples collected (6/25) and have a higher MCs than the inner areas of the piles (Figure 8). Nevertheless, during sampling, the “wet” external layer, darker in color, appeared to have a depth of approximately 30 cm, which, extended to the whole surface of the pile, would represent approximately 10% of the total pile’s volume (22.6 m3 vs. 226 m3 total). Even assuming a depth of 50 cm, the external layer would represent just 16% of the total volume (36.16 m3).
Thus, to reduce the relative weight of the external samples in the estimation of the total MC of piles, the latter value was recalculated, including just part of the samples. For fresh piles, two E samples were used (thus calculating the MC as average of 22 samples), and in dry piles, 3 E samples were used (resulting in an average of 23 samples). The different approach used between fresh and dry piles is a tentative solution to express the different capacity to adsorb water of wood chips with high and low initial moisture content but is clearly an arbitrary choice. The adjusted estimates obtained with this procedure are shown in Table 3.
Table 3.
Initial values of moisture content (MC) and adjusted final values of moisture content (MC), mass, dry matter (DM) and energy content for the tested piles.
4. Discussion
The piles treated with the coating agent did not show any significant differences to the untreated piles. Some trends could be detected by the moisture content dynamics:
- -
- In wet material, the results suggest that the protective film slightly reduced the moisture dispersal from the pile from evaporation rather than limit water intake from rain;
- -
- Dry material confirms the inability of the coating agent to limit water intake from rainfall. This is probably due to the water runoff, which facilitates the transit on porous areas among the wood chips where the water can cross the surface and soak the outer layers of the pile.
This result confirms one of the initial hypotheses: the coarse structure of a wood chip pile presents a porous surface, which cannot be effectively impermeabilized by a sprayed product. This is particularly relevant in large biomass facilities such as the one hosting the test, where the wood chips delivered generally showed large granulometry. This would explain why dry piles featured a very similar water intake: the heavy rainfalls produced rivulets on the slopy surface of the pile, allowing water to find its way towards the inner layers of the stored biomass through the interstices among wood chips. This was the same dynamic in wet piles, where the coating product appeared to slightly limit the natural air drying on clear windy days. In fact, the fresh piles showed intense microbial activity, with a loss of approximately 5% of the initial DM mass in five weeks. This figure is quite high if compared with the values reported by Thornqvist [21] wherein woodchips were stored for a period of 6–9 months, with recorded energy losses between 6.8 and 21.4%; or those stated by Lenz et al. [22], where, after a total storage period of approximately nine months, dry matter losses amounted to between 22 and 21%, depending on the particle size distribution of the feedstock. Additionally, Kuptz et al. [23] found that approximately 7% of dry matter was lost in five months storing forest residues and woodchips. Yet, it is worth highlighting that the studies above were conducted in Central or Northern Europe, with much colder and relatively drier weather, which provides less favorable conditions for the microbial activity.
For the dry piles, we can assume that the microbial activity and dry matter losses were minimal due to the a low initial MC and the low air temperatures, representing limiting factors for microbial development [6], as also demonstrated by Dumfort et al. [24] through respirometric tests, indicating lower production of CO2 when the MC decreased below 35%. Thus, the unique cause for mass variation is an increased MC, which caused an important reduction in the energy content of the dry piles (approximately −2.8%).
The dynamic observed in the test piles can also be considered valid for the larger standard piles of the facility. In fact, the maximum temperature of the large reference pile is consistent with the results of [17] and 8 °C higher than the smaller pile. However, this difference is relatively low considering the height and mass of the reference pile and allows the results to be extended to more compressed and higher piles, confirming that the coating agent would not provide significant benefits in terms of MC reduction and energy content increase.
The storage issue is something that many practitioners and scientists have confronted, searching for a compromise between feasibility and affordability. Kuptz et al. [23] carried out tests for storing woodchips of various origins both in anaerobic and aerobic conditions, concluding that, for many applications, aerobic storage in fleece-covered piles seems preferable to anaerobic storage. In this case, the results outdoor were good, but the piles were small (90 m3), so the economic cost and feasibility of covering big piles stored in industrial plants with fleece must be considered. To improve the storage of fresh wood chips by changing the growing conditions for wood decaying microbes, some authors suggested using additives such as CaCO3 on straw [25] or reed canary grass [26]. Another approach to overcome the problem was modifying the average particle size distribution by deploying innovative chipping technologies [9] or by screening the woodchips to reduce the share of fine particles [27,28]. However, this choice would entail changing the supply chain by selecting different producers, likely at a higher cost.
The test also proved that the current method for MC estimation is unreliable. And since the energy content is calculated upon MC and total mass variations, the whole energy balance is biased. In our test, applying a different weighting of the sampled MC (thus assigning a different share of the total to the layers of the piles), rather different results can be returned. Focusing on fresh biomass, the main feedstock of the facility, the energy balance varies from −4.9% to −2.4%, respectively, for the treated and untreated piles and from −0.4% to +0.7% for the same piles.
While the general conclusions regarding the coating agent do not change (the untreated pile always performs better), it highlights the necessity to adopt a different sampling strategy. With the present tools, the unique solution for a higher degree of precision would be a higher sampling intensity. This is extremely costly if thoroughly conducted on a large scale, making it unviable. Further research should be conducted in this sense, for instance, evaluating the suitability of in-line sensors capable of returning a high density of MC measurements, such as on biomass transferred with belts.
5. Conclusions
Woodchip coating has not proved successful in the coal sector, probably due to the inherent nature of wood, specifically its rough and fibrous texture, which does not facilitate applying protective layers. Under-roof storage is still the best option if the facility structure and organization allow the arrangement of a system of sheds. As woodchip storage at energy facilities is crucial for optimizing economic and logistics management, MC measurement procedures need to be improved, both in biomass sampling and weighing. More reliable methods and instruments are equally necessary to save money and time. Many studies in the literature have not considered the real allocation of woodchip MC within stocked piles, so new sampling methods are needed to overcome biased measurement.
Author Contributions
Conceptualization, G.P. and A.C.; methodology, G.P. and L.B.; sensors supervision, L.B.; investigation, G.P. and C.N.; resources, A.C.; data curation, G.P., C.N. and L.B.; writing—original draft preparation, G.P.; writing—review and editing, A.C. and C.N.; final approval of the version to be published, G.P., C.N., L.B. and A.C.; funding acquisition, A.C.; agreement to be accountable for all aspects of the work in ensuring that questions related to the accuracy or integrity of any part of the work are appropriately investigated and resolved, all authors. All authors have read and agreed to the published version of the manuscript.
Funding
We would like to thank ECOSESTO SPA for providing resources and the necessary areas and organization for the execution of the experiment.
Data Availability Statement
Data are contained within the article.
Conflicts of Interest
The authors declare that this study received funding from ECOSESTO SPA. The funder was not involved in the study design; collection, analysis, and interpretation of data; writing of this article; or the decision to submit it for publication.
References
- Dossa, G.G.O.; Schaefer, D.; Zhang, J.-L.; Tao, J.-P.; Cao, K.-F.; Corlett, R.T.; Cunningham, A.B.; Xu, J.-C.; Cornelissen, J.H.C.; Harrison, R.D. The Cover Uncovered: Bark Control over Wood Decomposition. J. Ecol. 2018, 106, 2147–2160. [Google Scholar] [CrossRef]
- Kärhä, K. Industrial Supply Chains and Production Machinery of Forest Chips in Finland. Biomass Bioenergy 2011, 35, 3404–3413. [Google Scholar] [CrossRef]
- Whittaker, C.; Yates, N.E.; Powers, S.J.; Misselbrook, T.; Shield, I. Dry Matter Losses and Greenhouse Gas Emissions From Outside Storage of Short Rotation Coppice Willow Chip. Bioenergy Res. 2016, 9, 288–302. [Google Scholar] [CrossRef] [PubMed]
- Noll, M.; Jirjis, R. Microbial Communities in Large-Scale Wood Piles and Their Effects on Wood Quality and the Environment. Appl. Microbiol. Biotechnol. 2012, 95, 551–563. [Google Scholar] [CrossRef] [PubMed]
- Ferrero, F.; Malow, M.; Noll, M. Temperature and Gas Evolution during Large Scale Outside Storage of Wood Chips. Eur. J. Wood Prod. 2011, 69, 587–595. [Google Scholar] [CrossRef]
- Krigstin, S.; Wetzel, S. A Review of Mechanisms Responsible for Changes to Stored Woody Biomass Fuels. Fuel 2016, 175, 75–86. [Google Scholar] [CrossRef]
- Whittaker, C.; Yates, N.E.; Powers, S.J.; Misselbrook, T.; Shield, I. Dry Matter Losses and Quality Changes during Short Rotation Coppice Willow Storage in Chip or Rod Form. Biomass Bioenergy 2018, 112, 29–36. [Google Scholar] [CrossRef]
- Pecenka, R.; Lenz, H.; Idler, C. Influence of the Chip Format on the Development of Mass Loss, Moisture Content and Chemical Composition of Poplar Chips during Storage and Drying in Open-Air Piles. Biomass Bioenergy 2018, 116, 140–150. [Google Scholar] [CrossRef]
- Hofmann, N.; Mendel, T.; Schulmeyer, F.; Kuptz, D.; Borchert, H.; Hartmann, H. Drying Effects and Dry Matter Losses during Seasonal Storage of Spruce Wood Chips under Practical Conditions. Biomass Bioenergy 2018, 111, 196–205. [Google Scholar] [CrossRef]
- Afzal, M.T.; Bedane, A.H.; Sokhansanj, S.; Mahmood, W. Storage of Comminuted and Uncomminuted Forest Biomass and Its Effect on Fuel Quality. BioResources 2010, 5, 55–69. [Google Scholar] [CrossRef]
- Sahoo, K.; Bilek, E.M.; Mani, S. Techno-Economic and Environmental Assessments of Storing Woodchips and Pellets for Bioenergy Applications. Renew. Sustain. Energy Rev. 2018, 98, 27–39. [Google Scholar] [CrossRef]
- Epshtein, S.; Gavrilova, D.; Kossovich, E.; Nesterova, V.; Nikitina, I.; Fedorov, S. Technologies of Coatings Employment for Coals Oxidation Resistance Improvement. AIMS Energy 2019, 7, 20–30. [Google Scholar] [CrossRef]
- Zhou, G.; Fan, T.; Ma, Y. Preparation and Chemical Characterization of an Environmentally-Friendly Coal Dust. J. Chem. Technol. Biotechnol. 2017, 92, 2699–2708. [Google Scholar] [CrossRef]
- Wetzel, S.; Volpe, S.; Damianopoulos, J.; Krigstin, S. Can Biomass Quality Be Preserved through Tarping Comminuted Roadside Biomass Piles? Forests 2017, 8, 305. [Google Scholar] [CrossRef]
- Anerud, E.; Bergström, D.; Routa, J.; Eliasson, L. Fuel Quality and Dry Matter Losses of Stored Wood Chips-Influence of Cover Material. Biomass Bioenergy 2021, 150, 106109. [Google Scholar] [CrossRef]
- Sahoo, K.; Mani, S. Techno-Economic Assessment of Biomass Bales Storage Systems for a Large-Scale Biorefinery. Biofuels Bioprod. Biorefining 2017, 11, 417–429. [Google Scholar] [CrossRef]
- Heinek, S.; Polanz, S.; Huber, M.; Hofmann, A.; Monthaler, G.; Fuchs, H.; Larch, C.; Giovannini, A. Biomass Conditioning: Degradation of Biomass during the Storage of Woodchips. In Proceedings of the 21st European Biomass Conference and Exhibition, Copenhagen, Denmark, 3–7 June 2013; ETA-Florence: Copenhagen, Denmark, 2013; Volume 2, pp. 147–150. [Google Scholar]
- Lenz, H.; Pecenka, R.; Idler, C.; Dumfort, S.; Whittaker, C.; Ammon, C.; Hartung, E. Continuous Weighing of a Pile of Poplar Wood Chips—A Comparison of Methods to Determine the Dry Matter Losses during Storage. Biomass Bioenergy 2017, 96, 119–129. [Google Scholar] [CrossRef]
- ISO 18134-1:2022; Solid Biofuels, Determination of Moisture Content, Oven Dry Method. Part 1: Total Moisture Reference Method. International Organization for Standardization: Geneva, Switzerland, 2022.
- Jirjis, R. Effects of Particle Size and Pile Height on Storage and Fuel Quality of Comminuted Salix Viminalis. Biomass Bioenergy 2005, 28, 193–201. [Google Scholar] [CrossRef]
- Thornqvist, T. Drying and Storage of Forest Residues for Energy Production. Biomass 1985, 7, 125–134. [Google Scholar] [CrossRef]
- Lenz, H.; Idler, C.; Hartung, E.; Pecenka, R. Open-Air Storage of Fine and Coarse Wood Chips of Poplar from Short Rotation Coppice in Covered Piles. Biomass Bioenergy 2015, 83, 269–277. [Google Scholar] [CrossRef]
- Kuptz, D.; Lesche, S.; Mendel, T.; Mack, R.; Rist, E.; Schön, C.; Hartmann, H. Fuel Properties, Dry Matter Losses and Combustion Behavior of Wood Chips Stored at Aerobic and Anaerobic Conditions. Biomass Bioenergy 2020, 142, 105745. [Google Scholar] [CrossRef]
- Dumfort, S.; Kirchmair, C.; Floerl, K.; Larch, C.; Rupprich, M. Storage as the Weak Link of the Biomass Supply Chain. In Africa-EU Renewable Energy Research and Innovation Symposium 2018 (RERIS 2018); Mpholo, M., Ed.; Springer: Berlin/Heidelberg, Germany, 2018; pp. 117–125. [Google Scholar]
- Bozaghian, M.; Rebbling, A.; Larsson, S.H.; Thyrel, M.; Xiong, S.; Skoglund, N. Combustion Characteristics of Straw Stored with CaCO3 in Bubbling Fluidized Bed Using Quartz and Olivine as Bed Materials. Appl. Energy 2018, 212, 1400–1408. [Google Scholar] [CrossRef]
- Xiong, S.; Bozaghian, M.; Lestander, T.A.; Samuelsson, R.; Hellqvist, S.; Öhman, M. Calcium Oxide as an Additive for Both Conservation and Improvement of the Combustion Properties of Energy Grass: A Preliminary Study. Biomass Bioenergy 2017, 99, 1–10. [Google Scholar] [CrossRef]
- Kuptz, D.; Schreiber, K.; Schulmeyer, F.; Lesche, S.; Zeng, T.; Ahrens, F.; Zelinski, V.; Schön, C.; Pollex, A.; Borchert, H.; et al. Evaluation of Combined Screening and Drying Steps for the Improvement of the Fuel Quality of Forest Residue Wood Chips—Results from Six Case Studies. Biomass Convers. Biorefinery 2019, 9, 83–98. [Google Scholar] [CrossRef]
- Mendel, T.; Hofmann, N.; Schulmeyer, F.; Borchert, H.; Kuptz, D.; Hartmann, H. Fuel Quality Changes during the Storage of Wood Chips in Large Piles. Eur. Biomass Conf. Exhib. Proc. 2016, 2016, 53–59. [Google Scholar] [CrossRef]


Disclaimer/Publisher’s Note: The statements, opinions and data contained in all publications are solely those of the individual author(s) and contributor(s) and not of MDPI and/or the editor(s). MDPI and/or the editor(s) disclaim responsibility for any injury to people or property resulting from any ideas, methods, instructions or products referred to in the content. |
© 2024 by the authors. Licensee MDPI, Basel, Switzerland. This article is an open access article distributed under the terms and conditions of the Creative Commons Attribution (CC BY) license (https://creativecommons.org/licenses/by/4.0/).