Abstract
Carbonate rocks are important for the petroleum industry, as they contribute significantly to hydrocarbon reserves, although their analysis is complex due to the high cost of core sampling and their high heterogeneity; for this, synthetic rocks aim to provide relatively homogeneous samples with analogous characteristics to natural rocks. In this research, synthetic carbonate rocks were produced by mixing a fixed ratio between limestone powder, obtained from limestone mining waste, and epoxy resin as a cementing material, using compaction energy for consolidation. The work aimed to produce homogeneous samples with high strength, reproducing the intergranular pore system for future applications in rock–fluid interaction analysis. The characteristics and structure of the samples were investigated through X-ray computed microtomography, petrographic images, petrophysical, chemical and geomechanical tests. Results showed a direct increasing relationship between porosity and permeability and a tendency for mechanical strength (UCS) to decrease with increasing porosity. When compared with the natural carbonate rocks, these presented similarities in their mechanical properties and petrophysical measurements, showing that the methodology can be considered as an alternative for the obtention of a realistic material that can be used for future experiments regarding rock mechanics and rock–fluid interaction for prediction of carbonate rocks’ behavior.
1. Introduction
Carbonate rock reservoirs are economically important as they contribute approximately 70% of the world’s oil and gas resources and about 50% of global recoverable oil, with 96.8% of their production widely distributed in the Middle East, North America and Central Asia regions [1,2,3]. Carbonate reservoirs are heterogeneous double-porosity systems in which the fractures system controls the fluid flow due to the greater facility of fluid transmission, while the matrix system shows the major storage space [4].
However, the interest in the mechanical and petrophysical properties of sandstones and carbonates and the behavior of rocks due to rock and fluid interaction leads to demand for rock sampling. It is not always possible to extract a sufficient quantity of samples in the field, due to lack of availability, and the limited samples available are inconvenient for laboratory tests that require a significant number of samples to represent a given problem, especially for geomechanical destructive tests [5,6,7]. Furthermore, due to the complex porous system and its heterogeneities, carbonate reservoirs [8] cause experimental uncertainties, making it difficult to obtain comparable and reproducible results [5,9,10,11]. Then, the high cost of core sampling makes it challenging to obtain a sufficient number of samples for quantification of these systems, and with this, it is necessary to develop synthetic porous media in the laboratory, representing analogous characteristics of natural rocks. As long as synthetic rocks are produced with materials and methodologies that efficiently represent natural rocks and control the conditions of interest, they can be applied, for example, in studies to better understand the petrophysical properties of rocks [12,13,14,15,16,17], the influence of micrite content on the geomechanical properties and acoustic velocity of carbonates [13], the impact of cracks on rock structure [18], wettability studies [19] and the effects of mineral dissolution after acidification processes in carbonates [20].
The rock production process involves a cementing agent to bind the particles. Portland cement represents one of the most used, combined with materials for matrix rock constitution, such as sand, calcite grains and water [12] and Halimeda grains [13]. Some studies used epoxy resin combined with calcite grains [14,15] to produce the rock matrix. One study [16] combined dolomite fragments with a controlled particle size with amide wax powder as a binding agent for their samples.
Regarding the methodologies available for the synthesis and consolidation of synthetic rocks, the mechanism using a compaction pressure is the most used, where the material is compacted and molded under different energies and geometries, followed by thermal treatment in an oven or muffle according to the material used [12,14,17,18,19].
As a methodology for preparing synthetic rocks, [13] applied a cold uniaxial stress of 8 MPa on a mixture of Halimeda grains with different grain sizes for seven days for sample consolidation and then removed it from the molds, obtaining uniform rocks; the authors also produced samples with Halimeda grains, water and Portland cement, applying a stress of 2 MPa for one day, and dried them in an oven for two days so that the cement could harden, to obtain consolidated carbonate rocks. To manufacture carbonate rocks, [20] compacted a mixture of calcite (Halimeda) and sand with calcium hydroxide Ca(OH)2 to a compressive stress of 15 MPa, which were then subjected to a CO2 injection applied at a pressure of 100 kPa to cement the samples; the synthetic rocks were then dried in an oven for 24 h and de-molded after the consolidation procedure.
Three-dimensional printing has been presented as an alternative for producing carbonate rocks, reproducing calcium carbonate parts and contributing to the development of artificial rocks [21,22,23], where the resolution of the printers and the lack of commercial materials to mimic the rock mineralogy are considered limitation factors [24,25].
According to [26], the production of synthetic rocks allows controlling rock reservoir properties such as porosity, permeability and compressive strength, aiming to help petroleum engineering in analyses of the relationships between physical and geomechanical parameters of reservoir rocks under different conditions and for various hydrocarbon production processes.
This study presents a methodology for producing synthetic carbonate rocks, using a combination of limestone powder and epoxy resin, to reproduce rock samples with reasonably homogeneous petrophysical and geomechanical properties regarding the range of these values found in natural carbonate reservoir rocks for further use in rock–fluid interaction investigations. X-ray computed microtomography, petrographical images, porosity, permeability, mineralogical/chemical analyses and geomechanical tests were performed for their characterization, whose results were compared with the properties of natural and synthetic rocks reported in the literature [12,13,15]. Then, this work aims to present the manufacturing technique and characterization protocol leading to the reproducibility of produced samples. An important aspect is adopting rock from mining waste limestone (Crato Formation) from mines in the Araripe Basin in northeast Brazil as a natural carbonate base.
2. Materials and Methods
2.1. Materials
The materials used to synthesize carbonate rocks were analog rock powder from limestone rock fragments (limestone powder) and epoxy resin as binder/cementing material.
Limestone powder was obtained from rock waste of laminated limestone outcrops (carbonate deposits) from the Crato Formation, located in the Araripe Basin, between the cities of Santana do Cariri and Nova Olinda, state of Ceará, generated from mining activity by the extraction of limestone for Portland cement fabrication [27,28].
These carbonate deposits are considered analogous carbonate intervals of the Pre-Salt reservoir from marginal basins of southeastern Brazil in petrophysical, depositional and geochronological terms [29,30,31]. The region comprises laminites with lithofacies consisting mainly of micritic calcite with occurrence of dolomite and silica, presenting grain size mostly less than 20 µm, with millimeter and centimeter laminations of light-yellow and dark-gray color [32]. Due to its analogous characteristics and composition, the material was chosen for producing synthetic rocks, providing the samples with petrophysical and geomechanical characteristics similar to carbonate reservoir rocks, approximating the reproduction of natural carbonate plugs. The limestone powder constituting the synthetic carbonate rocks of this research was made by pulverizing the dark-gray colored limestone; however, materials from the Crato Formation of other lithofacies can be used in this methodology, with variations in their geomechanical properties.
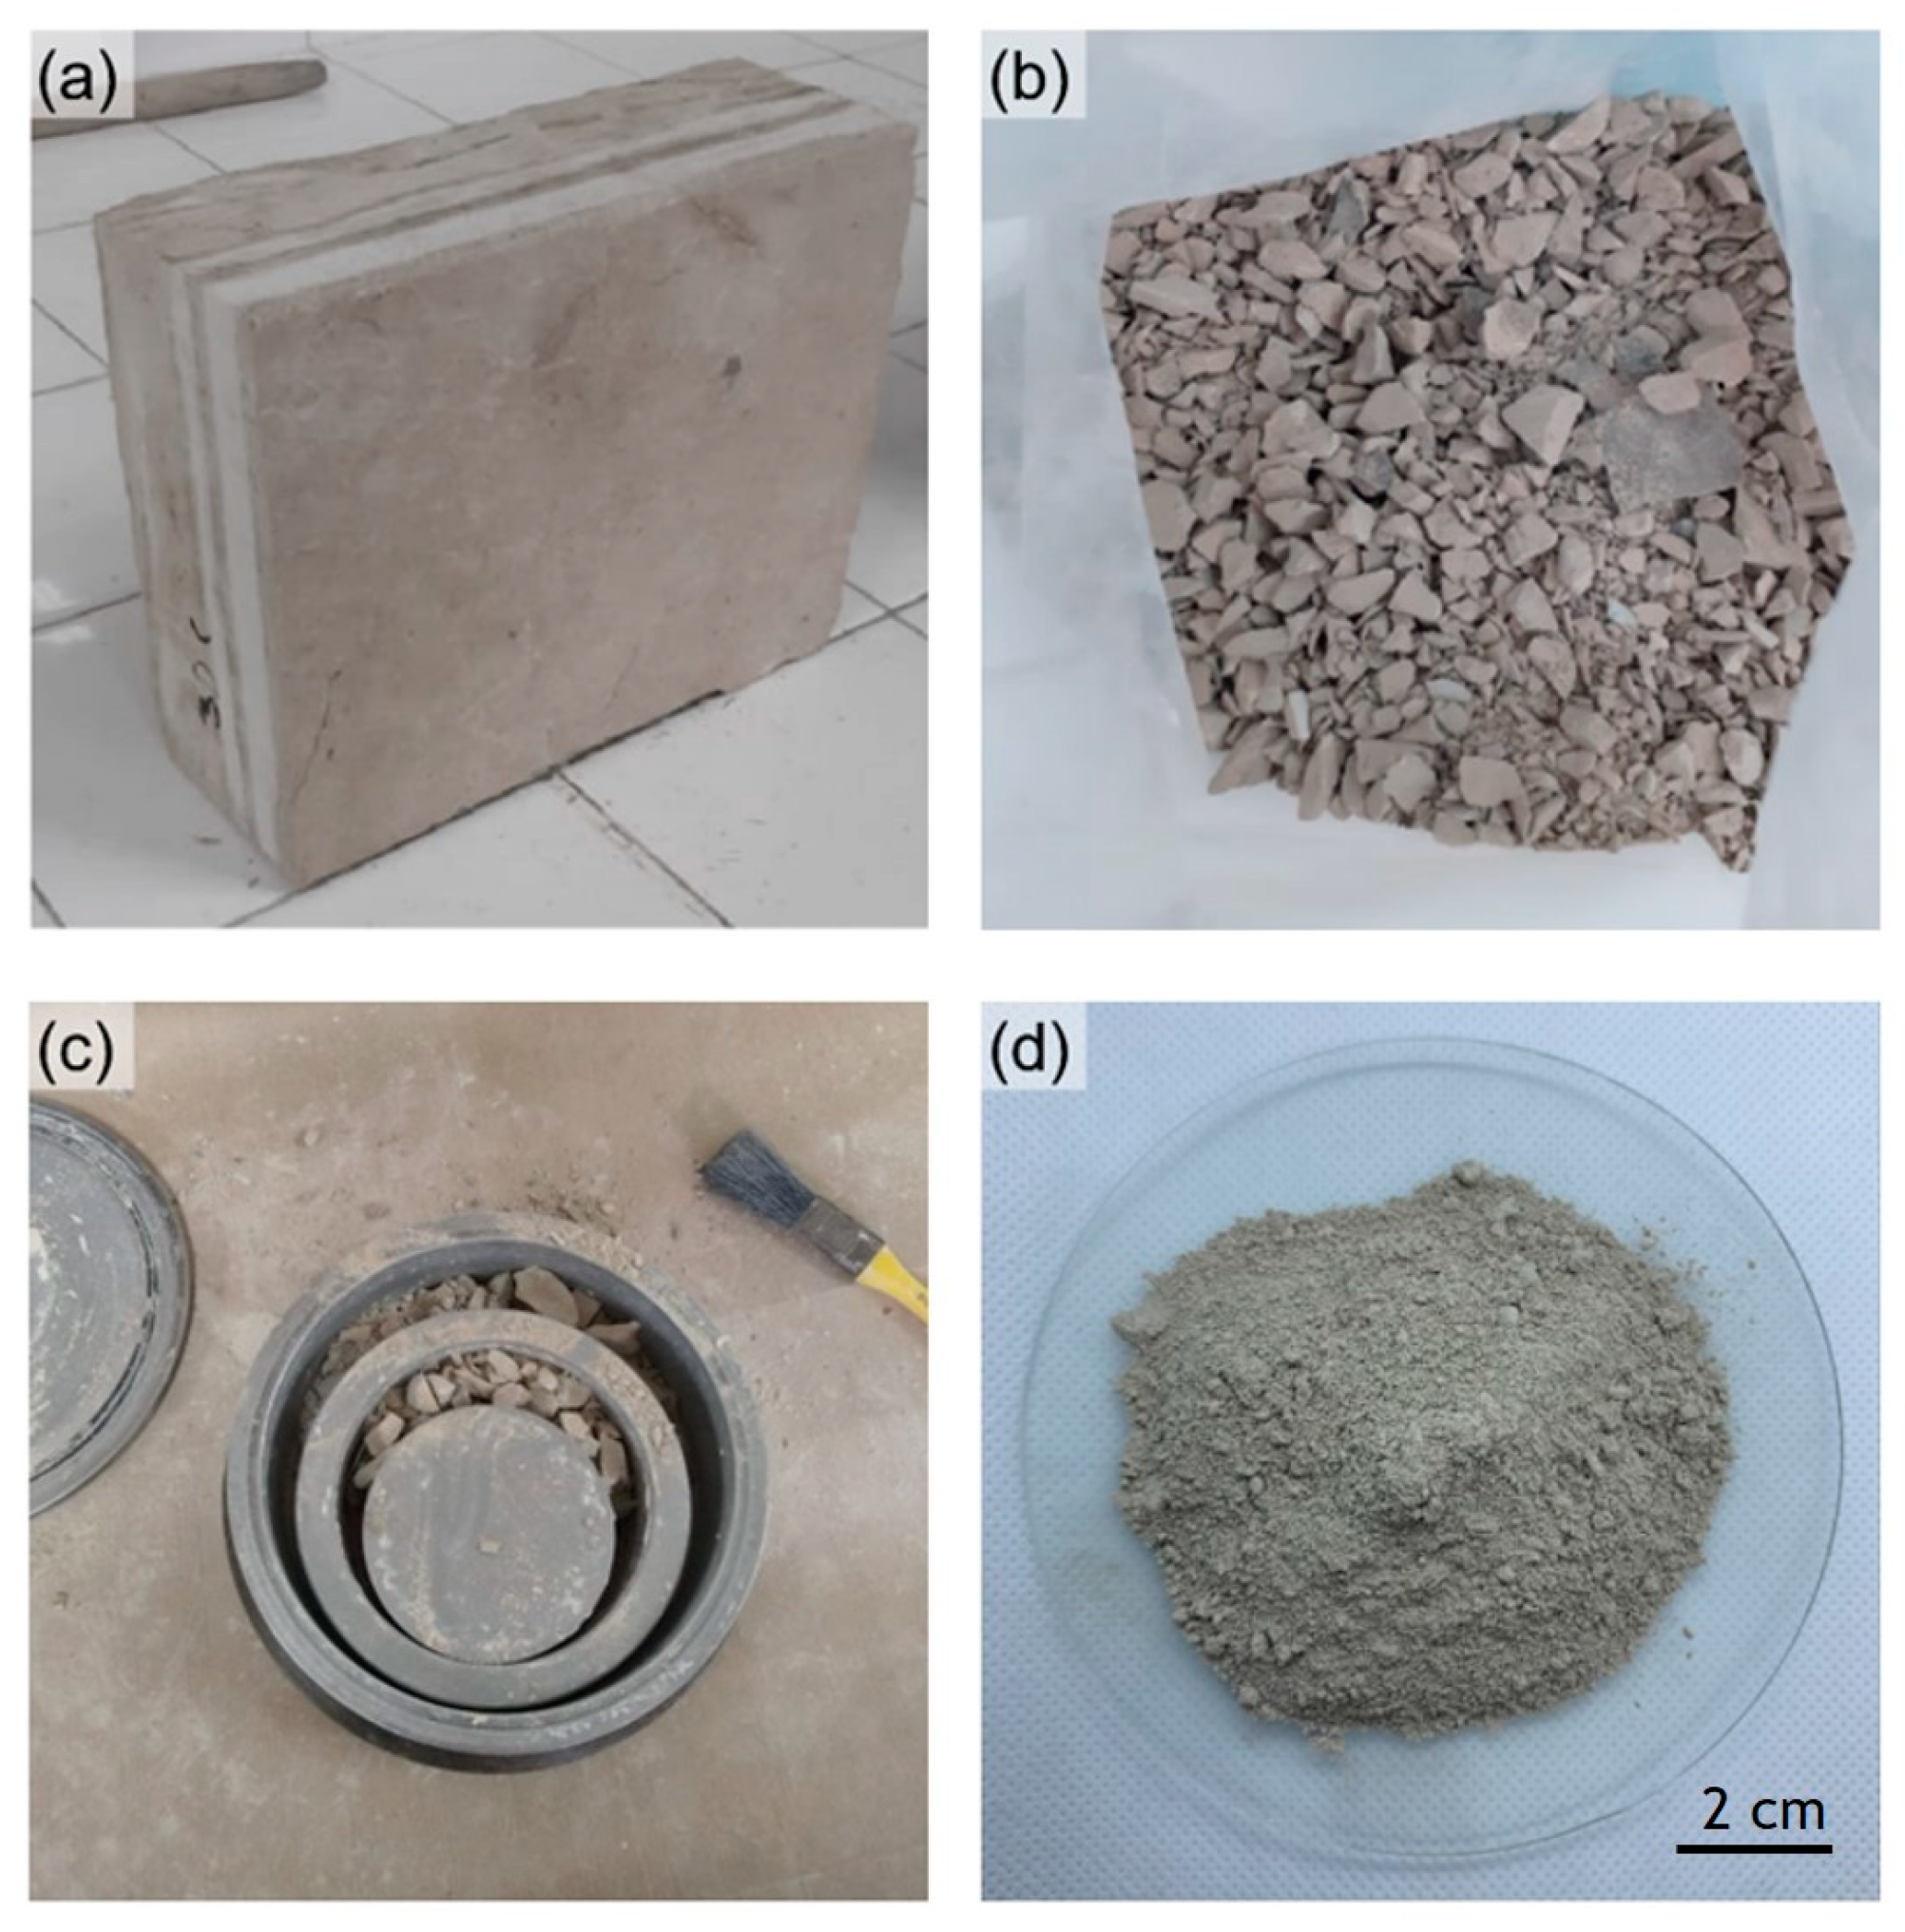
For limestone powder preparation, carbonate outcrop samples were collected in small blocks of distinct dimensions (Figure 1a), and subsequently fragmented into smaller pieces using a jaw crusher machine (Figure 1b). Then, the material was pulverized with a disc mill machine (Figure 1c) in successive portions for 40 s until the desired particle size was reached for this step. Finally, the pulverized material was sieved using a sieve series and shaker, selecting all powder passing a 425 µm sieve (Figure 1d). The pulverized material has a grain density of 2.79 g/cm3.
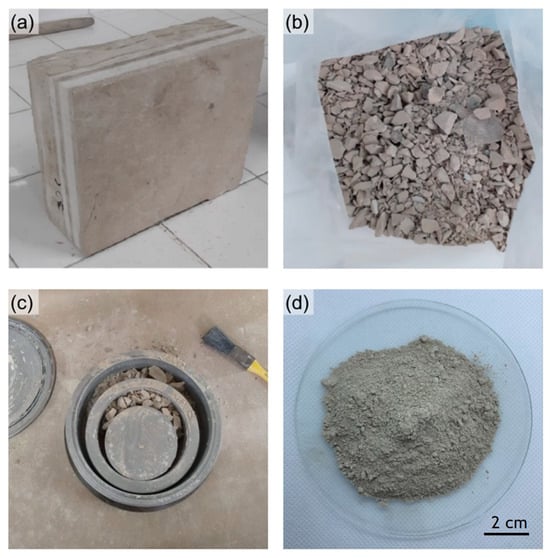
Figure 1.
Limestone powder preparation: (a) limestone block; (b) fragmented limestone; (c) pulverization of limestone with disc mill machine and (d) limestone powder (<425 µm).
Two-component epoxy (low-viscosity resin and curing agent) was used in a 2:1 ratio (resin/curing agent) as a binder for rock solid matrix as observed in other works [14,15,19,33,34]. The binder was chosen because it presents high mechanical strength and chemical resistance, low shrinkage, good adhesion, stability to thermal cycles and impacts, good fluidity and does not release by-products in its use, desirable properties when preparing synthetic rocks.
2.2. Synthetic Rock Production Protocol
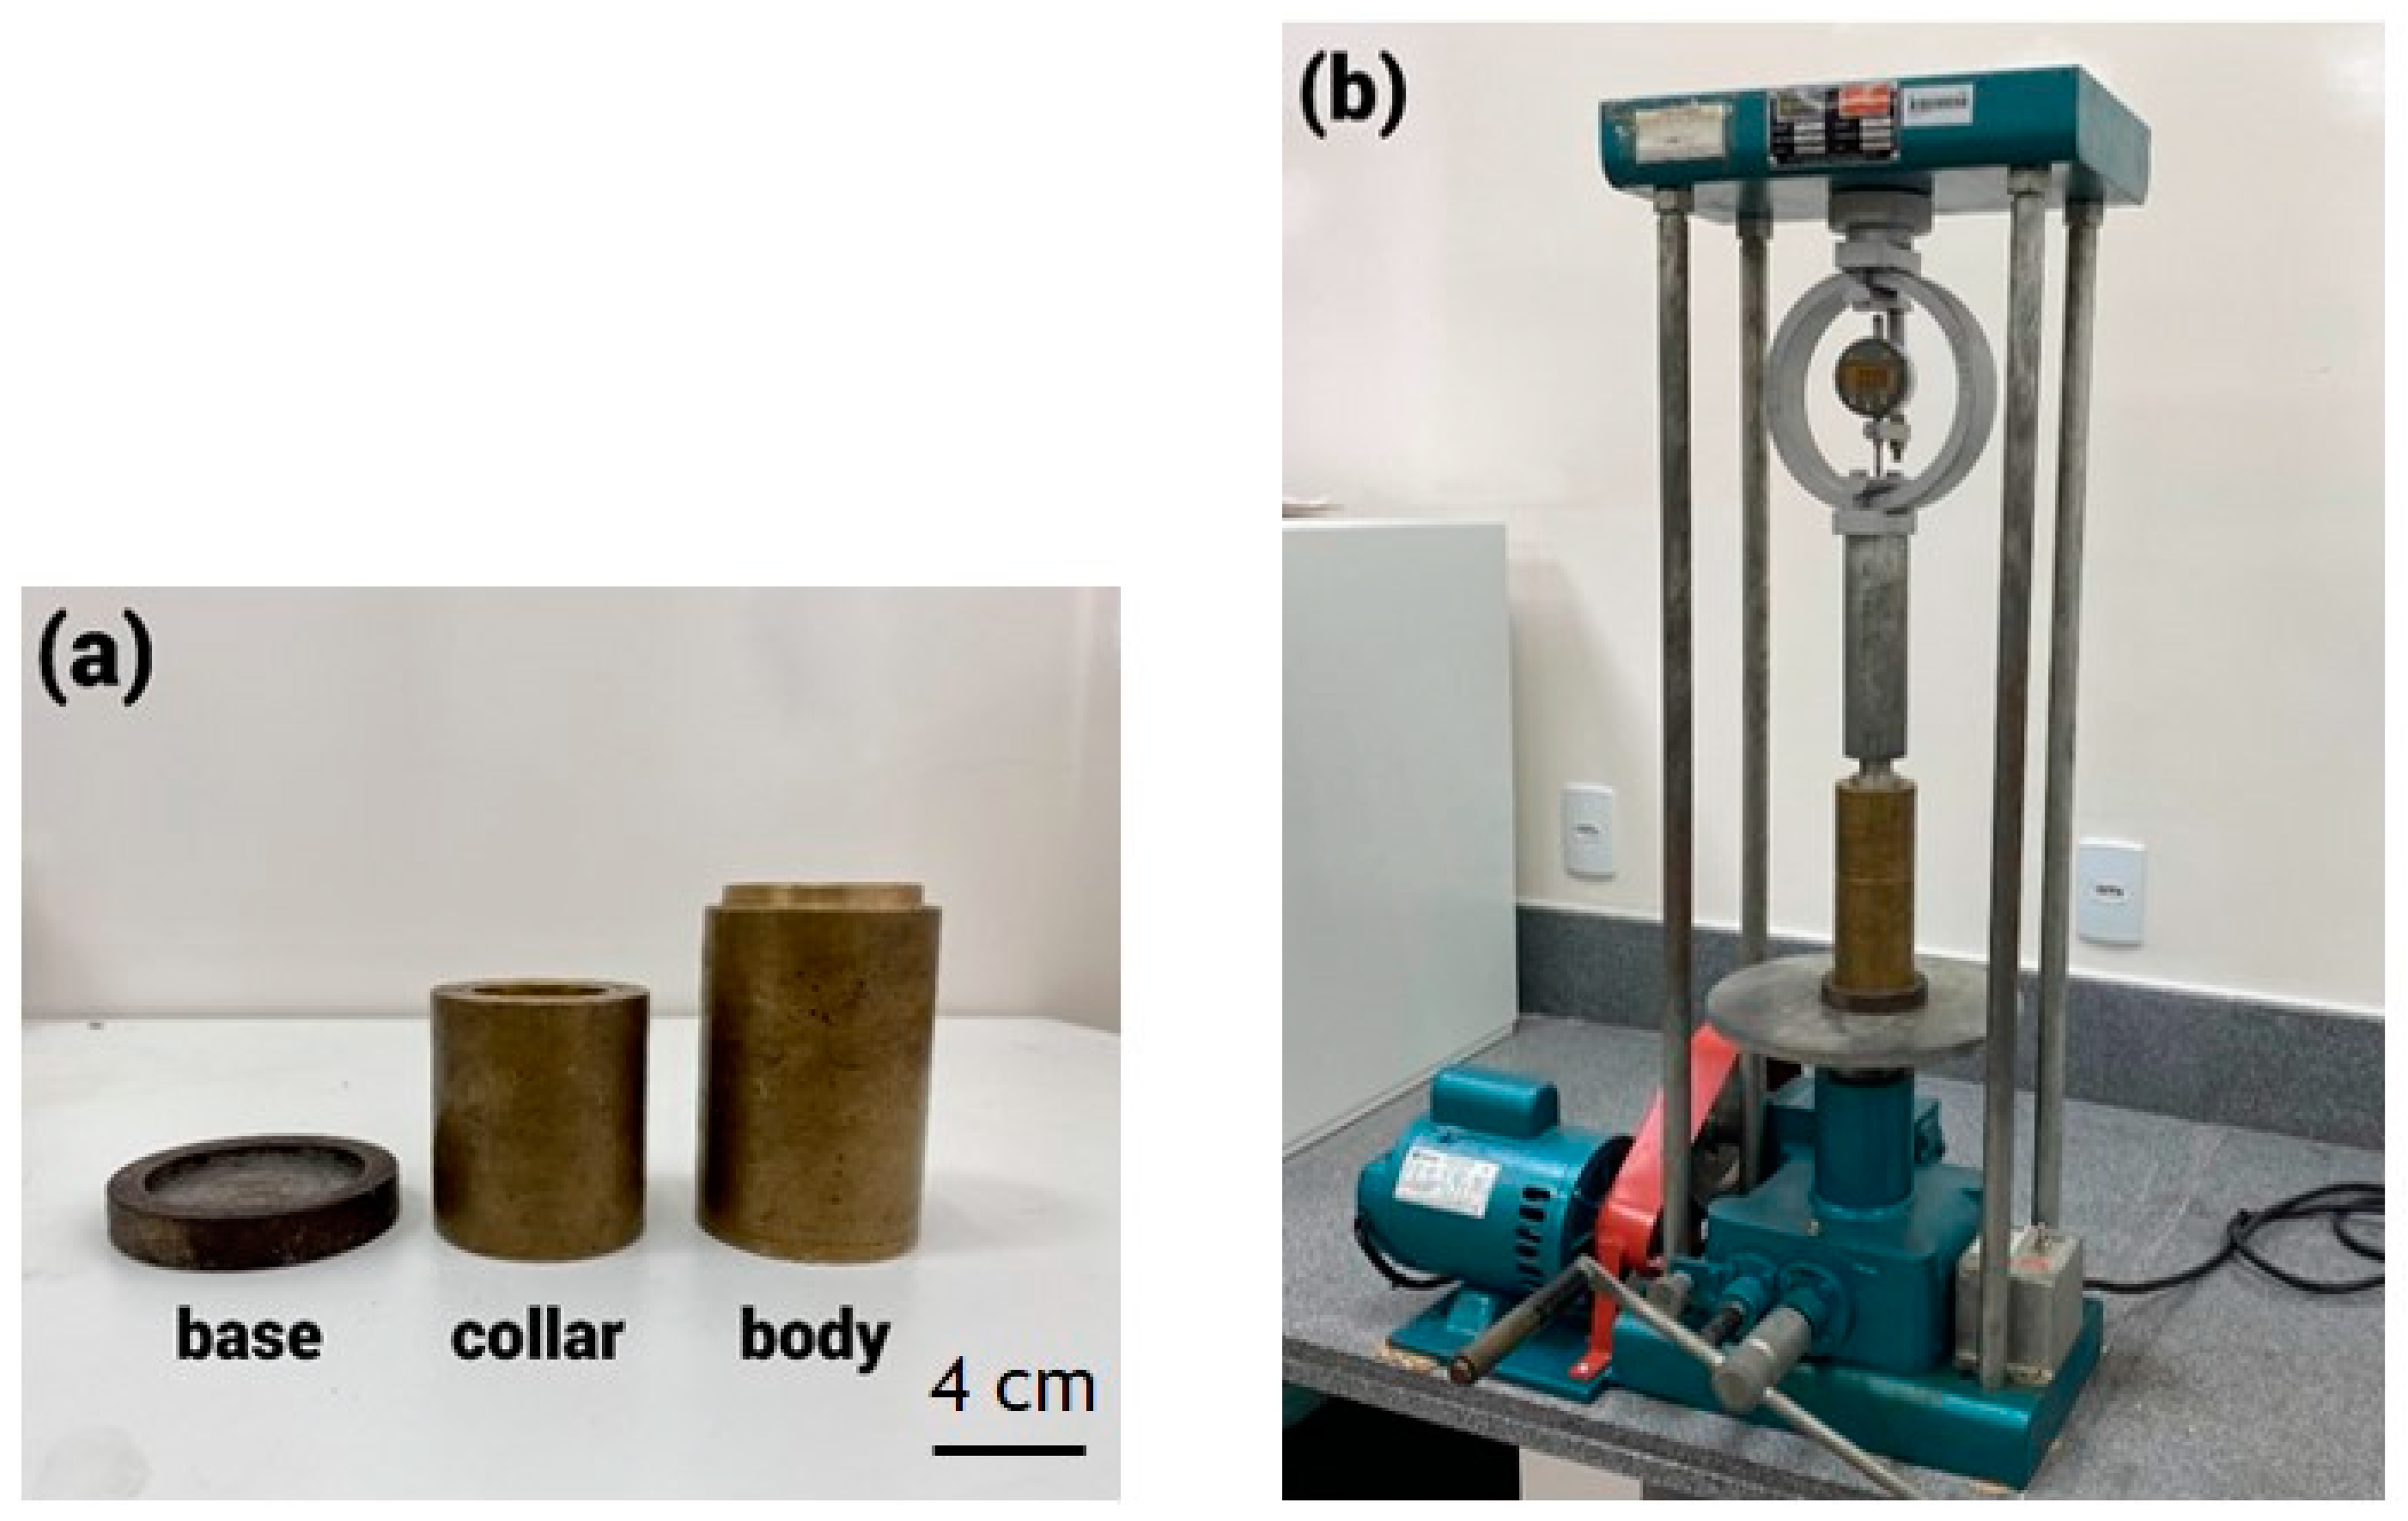
The synthetic rocks were produced using a compaction process, widely reported in the literature for sample consolidation [12,13,14,17,18,19,33,34], applying vertical compressive stress to the mixture of limestone powder and epoxy resin that was placed in a cylindrical metal mold composed of base, collar and body (Figure 2a) with dimensions of 3.80 cm (diameter) and 7.60 cm (height).
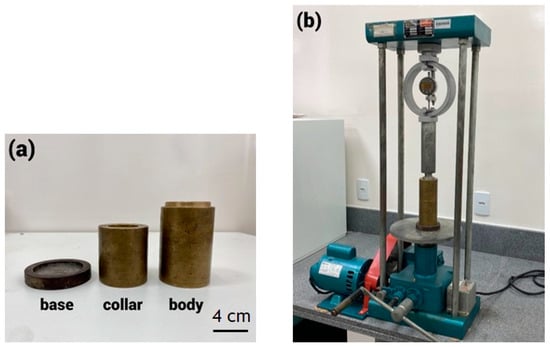
Figure 2.
Rock production: (a) cylindrical metal mold composed of base, collar and body; (b) sample compaction process applying vertical compressive stress to the material inside the mold.
The amounts of limestone powder and epoxy resin used were varied to adjust and establish a density value that would make it possible to produce samples with the height of the mold dimensions and a consolidated aspect, without surface voids and irregularities along its length, with mechanical strength and petrophysical properties compatible with natural carbonate rocks; after tests, a proportion of 90% limestone powder and 10% epoxy was established for core production. The resin and curing agent were previously combined in a 2:1 ratio and then mixed with the limestone powder until the mixture became homogeneous, and no long mixing periods were allowed due to the rapid hardening reaction between the two components of epoxy. The mixture was then passed through a sieve to remove the larger lumps of remaining material, leaving a uniform preparation, and then placed inside the mold, where it was coated with a demolding agent (solid Vaseline) to facilitate the extraction of the sample during the demolding process. The collar, on the other hand, ensured that the mixture was placed in a single layer inside the mold, which, because it was still unconsolidated, occupied a larger volume than the final volume of the rock.
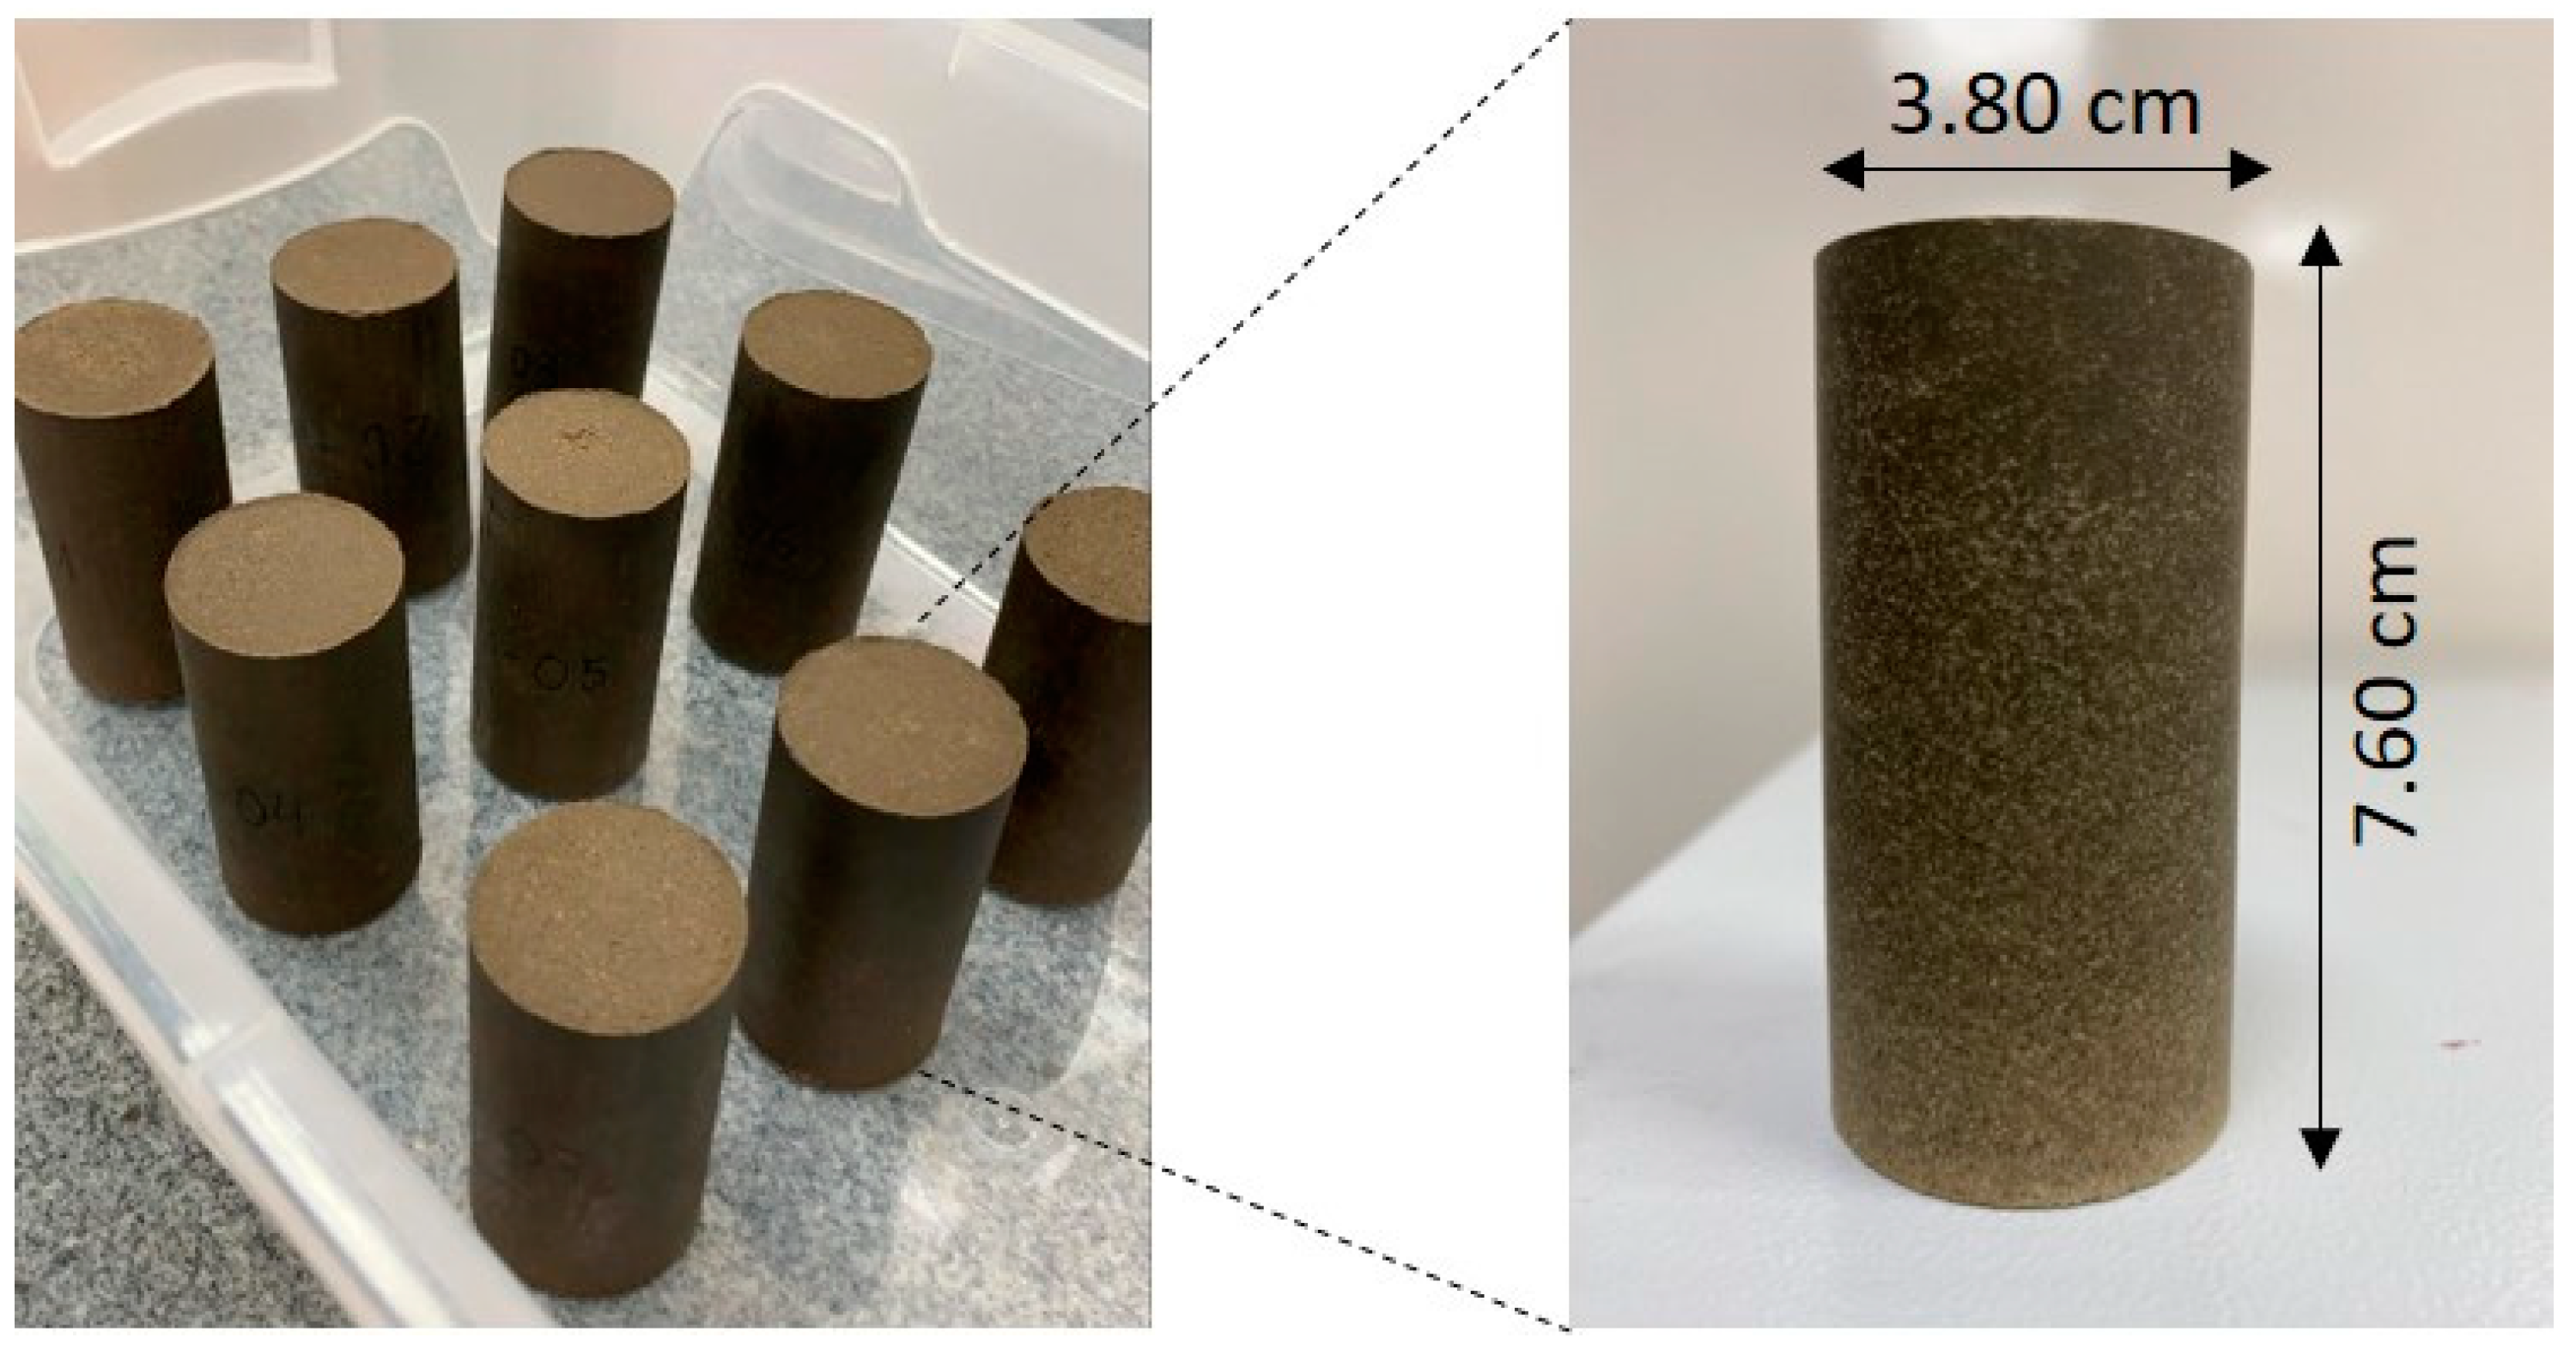
The mixture was compacted in a single layer (Figure 2b), using a compression press at 20 MPa, until the sample reached the defined height, keeping the vertical stress applied for 10 min. Filter paper discs were placed at the bottom and top of the sample so that no portion of the mixture would stick to the mold during compaction. After this time, the sample was removed from the mold and taken to the oven at a temperature of 60 °C (recommended by the epoxy resin manufacturer), where it remained for 24 h to complete its consolidation and stiffness gain process (Figure 3).
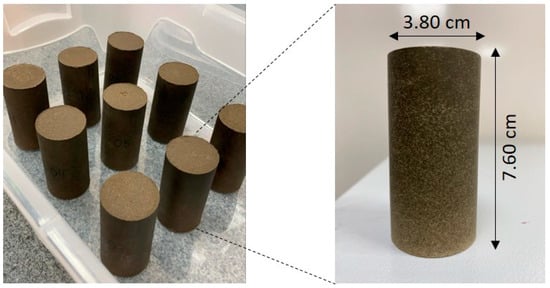
Figure 3.
Rock samples after consolidation process.
2.3. Chemical/Mineralogical Characterization
The synthetic carbonate rocks were characterized using X-ray fluorescence (XRF) and X-ray diffraction (XRD) techniques in order to verify the chemical/mineralogical composition of the samples. The X-ray fluorescence (XRF) test, which is a quantitative technique, aimed to determine the chemical composition of the samples, using a PRIMINI model spectrometer (Rigaku®, The Woodlands, TX, USA). The X-ray diffraction test (XRD), a qualitative method, aimed to identify the minerals present in the rock produced, using an X-ray diffractometer model D 5000 (SIEMENS®, Munich, Bavaria, Germany) and a copper (Cu) filter; the analyses of the peak intensities of the minerals present in the diffractograms were refined using the Rietveld method using the Maud software (version 2.9993). For both tests, a powder obtained from fragments of the synthetic rocks was prepared using a pestle and porcelain mortar, until a material with a grain size that passed the No. 200 mesh sieve (0.075 mm) was obtained. The powder was then packaged and prepared according to the methodology required to carry out the XRF and XRD tests.
2.4. Petrophysical (Permeability and Porosity Tests) and Petrographic Characterization
Permeability of N2 axial flow in samples with 7.60 cm in length by 3.80 cm in diameter was measured using a steady-state permeameter (DCI Test Systems®, North Salt Lake, UT, USA) at a confining pressure of 300 PSI and pore pressure gas (N2) of 50 PSI. The measurements were performed, and the permeability coefficients k were calculated according to Darcy’s equation (Equation (1)) and the Klinkenberg corrections [35].
where k is the gas permeability, L is the length of the sample, A is the cross-sectional area of the cylindrical sample, μ is the gas viscosity, Q is the flow rate, p is the mean pressure, p1 is the inlet pressure and p2 is the outlet pressure.
The pore volume was determined based on Boyle’s Law, using a helium porosimeter (Core Laboratories®, Houston, TX, USA) model ULTRA-PORE 300, whose porosity values (Φ) were determined in fraction (%) (Equation (2)) for the produced samples, applying pore pressure gas of 150 PSI.
where Φ is the porosity, Vp is the pore volume and Vt is the total volume of rock.
Φ (%) = (Vp/Vt) × 100,
For the petrographic study, it was necessary to produce thin laminae taken from the central part of a synthetic rock. The laminae were then analyzed using a petrographic microscope with polarized light and integrated camera (ZEISS®, Oberkochen, Baden-Wurttemberg, Germany) model Axioscope 5, and images were generated to represent the structure and description in terms of mineralogy, texture and porosity (voids).
X-ray computed microtomography for 2D analysis of samples was performed, subdividing the synthetic rock into slices, using industrial tomograph equipment (Nikon Metrology®, Minato-ku, Tokyo, Japan) model XT H 225, voltage of 150 kV, current 63 uA and exposure time of 500 ms, where the internal morphology of the produced rocks was verified in terms of homogeneity and presence of pores in the structure, consisting of a non-destructive analysis. The tomographic scans were performed on sample P-01, which divided its length into 1490 slices with a resolution of 55 µm, using CT PRO 3D XT 3.0.3 for image reconstruction; for image visualization, ImageJ® and VG Studio® (version 3.4) software were used.
2.5. Geomechanical Characterization
The geomechanical characterization initially consisted of carrying out the unconfined compressive strength test (UCS), according to ASTM D2938, applying a vertical uniaxial load using a hydraulic press (capacity of 1000 kN). Axial and radial displacements were measured using strain gauges, to determine the stress-strain behavior and the strength parameters of the synthetic rocks.
Next, the Brazilian test was carried out on five synthetic carbonate rock samples to determine their tensile strength indirectly, which consists of applying a uniaxial diametrical load, compressing it until it breaks. This was carried out in accordance with ASTM D3967 and tested in a hydraulic compression press with a capacity of 1000 kN by applying a load P in the horizontal position of the sample, transmitted to the sample along its length L in an area of width equivalent to the product between the length of its cross section and longitudinal section until it broke, generating induced tensile stresses. An extensometer was used to take radial displacement readings throughout the test, until rupture, forming a vertical crack in the middle portion of the rocks, determining the tensile strength according to Equation (3):
where σt is the diametral compressive strength (tensile), P is the applied load, D is the diameter of the sample and L is the length of the sample.
σt = 2·P/(π·D·L),
The triaxial compressive strength test was carried out following the procedures described by ASTM D2664, using an RTR-1000 triaxial compression press (GCTS Testing Systems®, Tempe, AZ, USA), with a capacity of 70 MPa to determine the stress-strain behavior and geomechanical and strength parameters of the rocks. To achieve this, three samples of synthetic carbonate rock were prepared and named A-1, A-2 and A-3, instrumented with axial and radial LVDTs to record the displacements suffered by the samples during the tests. The confinement jacket was filled with oil, responsible for applying the confining stress (σ3) in all directions of the samples, constant throughout the test. The σ3 values adopted were 2.2 MPa, 5.0 MPa and 10 MPa, respectively, for samples A-3, A-2 and A-1. An axial load was applied in the vertical direction, at a constant strain rate of 0.005%, increasing the value of the axial stress (σ1) corresponding to the application of the deviatoric stress Sd (Equation (4)):
where Sd is the deviatoric stress, σ1 is the axial stress and σ3 is the confining stress.
Sd = σ1 − σ3,
During the triaxial test, the deviatoric and confining stress, axial, radial and volumetric strain data were obtained, in order to obtain the stress-strain behavior, the geomechanical parameters of Young’s modulus Es (in this case, Sec, equal to the slope of the secant line between the origin and the rupture point) and shear modulus (G), Poisson’s ratio, volumetric deformation, total (p × q) and effective (p′ × q) stress trajectory and obtaining the cohesion and friction angle parameters by the Mohr–Coulomb resistance envelope (Equation (5)).
where τ is the shear stress, ϕ is the friction angle, σ is the normal stress and c is the cohesion.
τ = tgϕ × σ + c,
3. Results
For the analyses described below, a total of 15 synthetic carbonate rocks were produced, distributed as follows: six samples (named P-01 to P-06) for UCS tests and petrophysical characterization (X-ray computed microtomography, gas porosity and gas permeability), five samples (named t-01 to t-05) for tensile strength tests, three samples (named A-01, A-02 and A-03) for triaxial compressive strength tests and one sample (I-01) for petrographic analyses. The analyses relating to chemical/mineralogical characterization were carried out on rock fragments obtained after the geomechanical tests. The samples have a height of 7.60 cm and a diameter of 3.80 cm, with a total volume of 86.20 cm3 and an average grain density of 2.43 g/cm3.
3.1. Chemical/Mineralogical Analyses
Table 1 shows the quantitative (%) chemical components present in the produced rock, obtained through XRF tests.

Table 1.
XRF results.
Calcium in the form of calcium oxide (CaO) is found in the highest proportion (82.02%), followed by iron (III) oxide (Fe2O3), magnesium oxide (MgO), silica (SiO2), manganese oxide (MnO) and other components in smaller proportions.
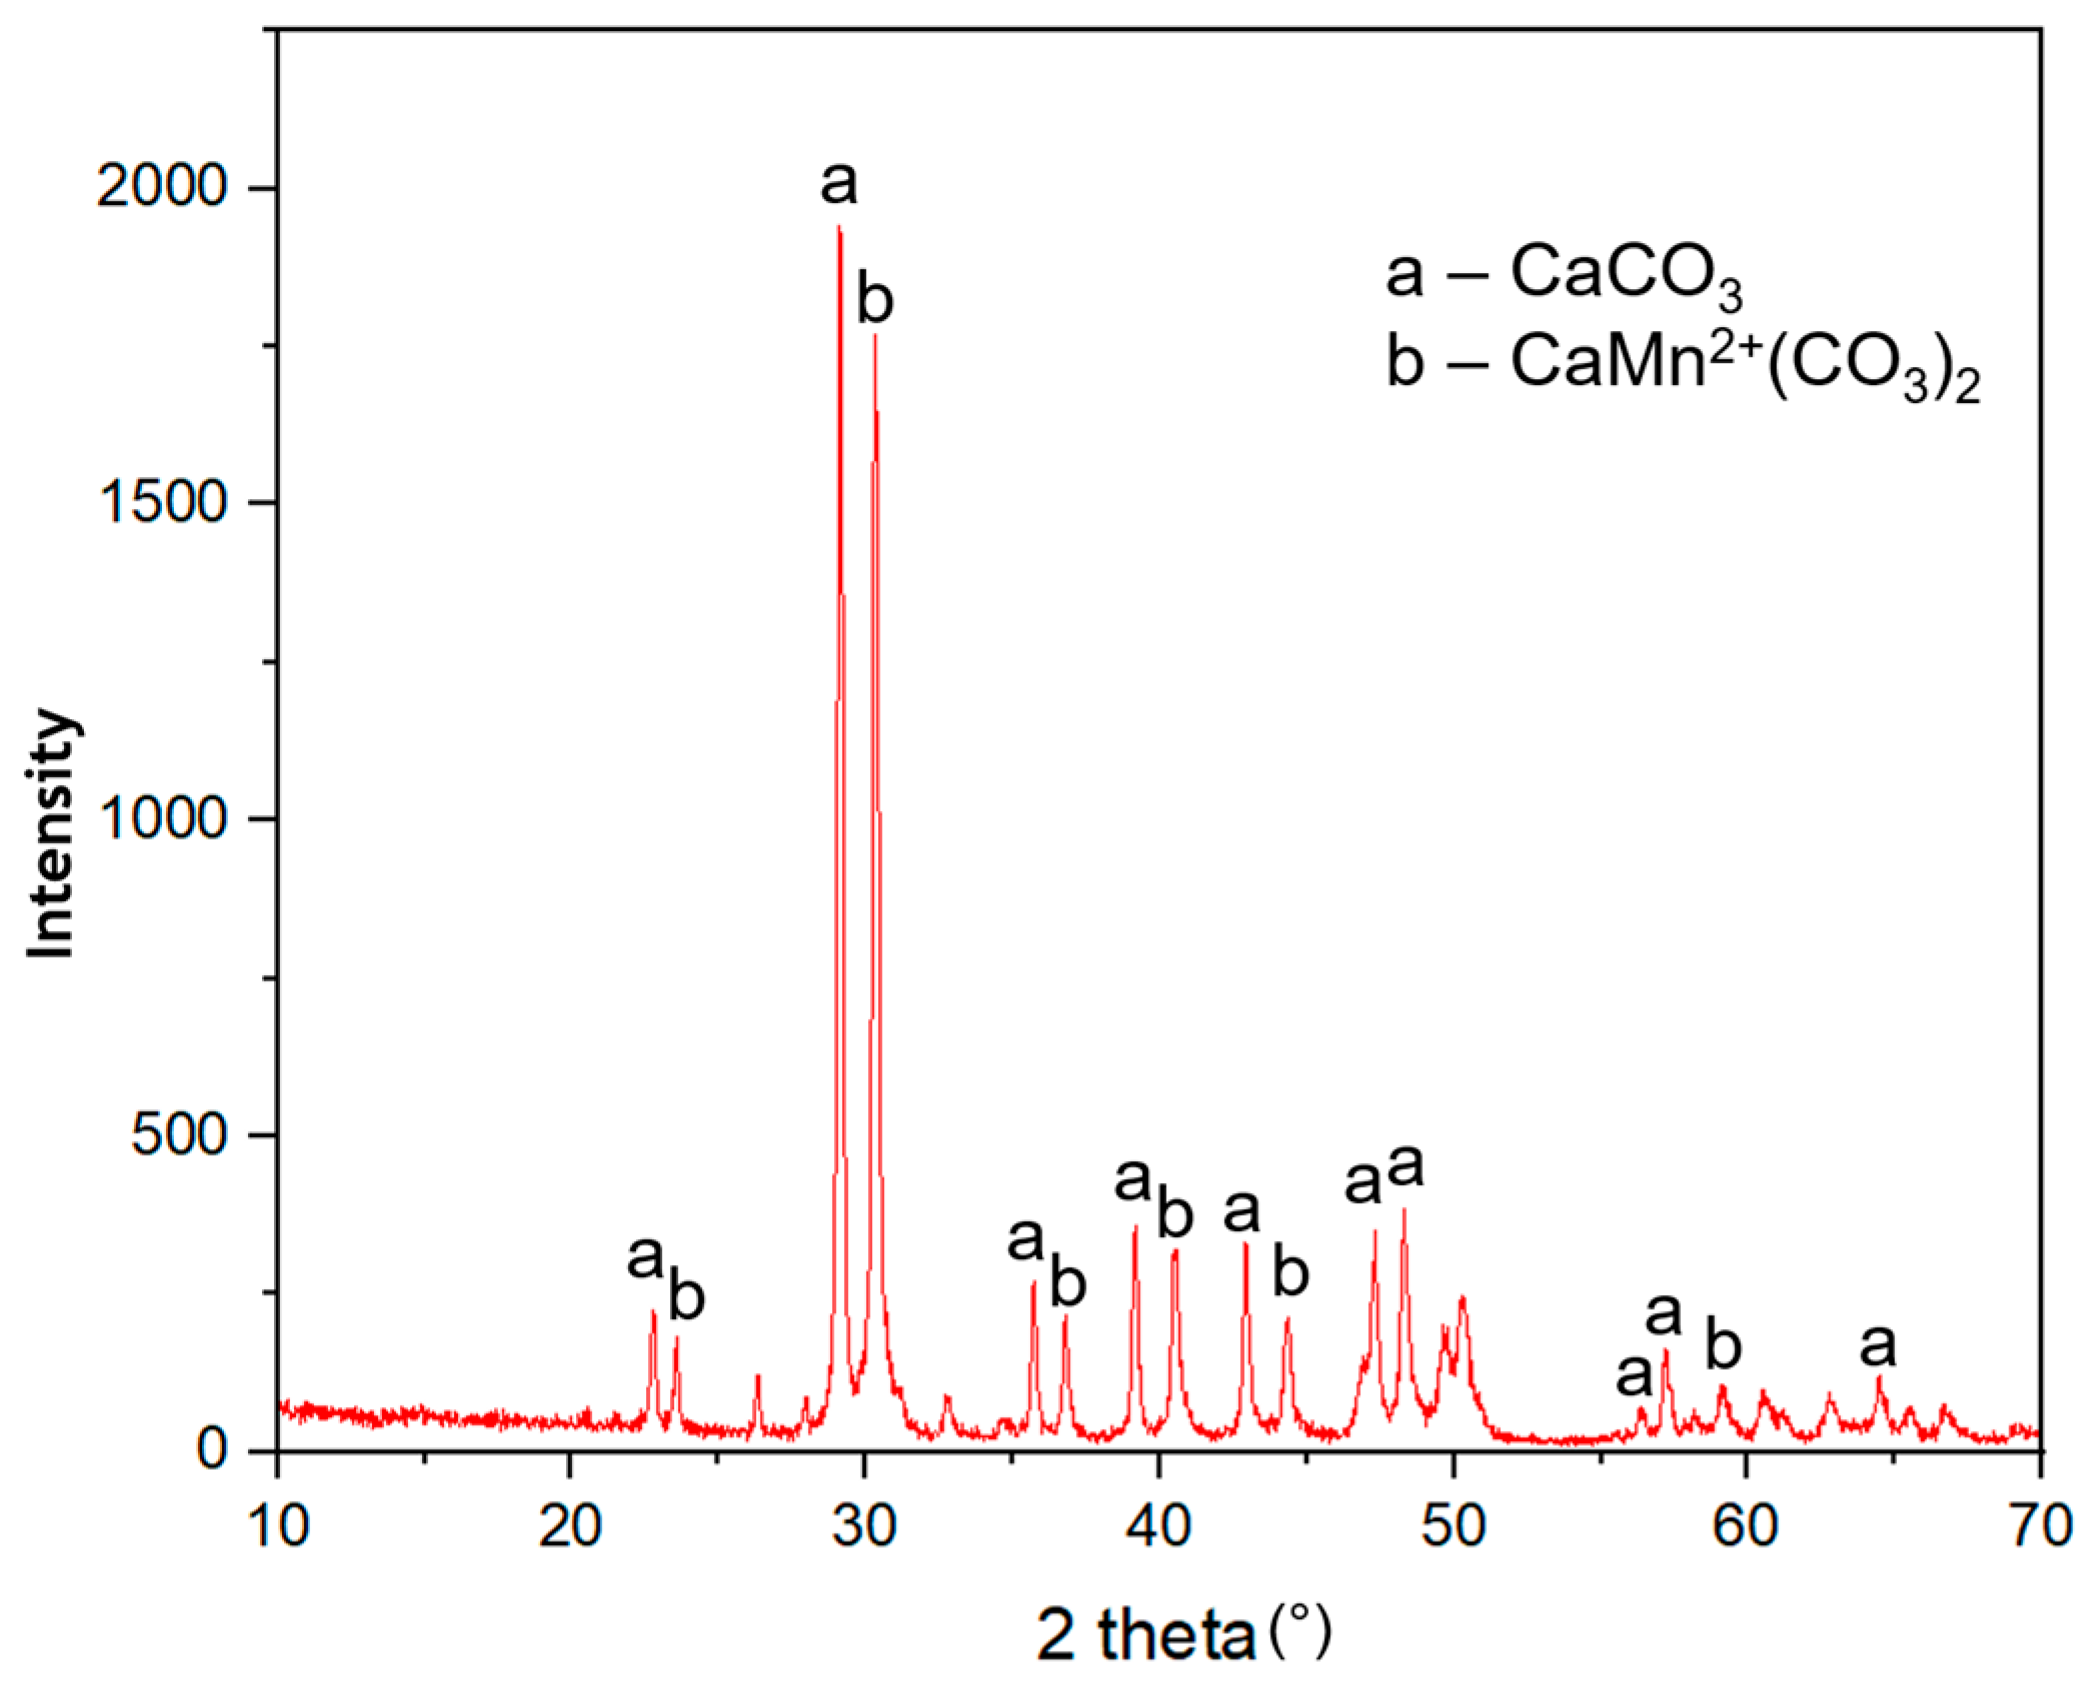
Figure 4 shows the X-ray diffractogram of the sample, relating the angle 2 theta (°) to the intensity of the diffracted peaks. The presence of the minerals calcite (a—CaCO3) and kutnohorite (b—CaMn2+(CO3)2), a calcium manganese (Mn) carbonate belonging to the dolomite group, was identified.
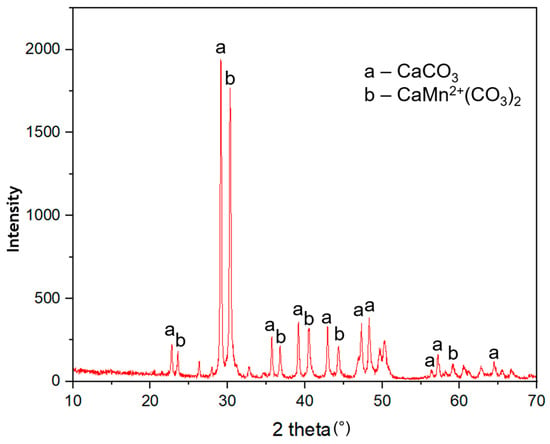
Figure 4.
X-ray diffractogram (XRD) of the synthetic rock.
Based on the Crystallography Open Database (COD), it can be seen that the characteristic calcite (no. #900-9667) peak (a) shows greater intensity in 29.24° (2 theta), while the characteristic kutnohorite (no. #900-1047) peak (b) shows greater intensity in 30.44° (2 theta); in addition, the presence of the minerals identified by XRD confirms the quantitative XRF results in Table 1, which indicate the presence of calcium (Ca) and manganese (Mn) in the composition of the rock.
These minerals originate from the limestone powder used in the synthetic rocks’ production, obtained by extracting samples of limestone rock from the outcrop of the Crato Formation [32], providing mineralogical characteristics similar to natural carbonate rocks, due to the diversity of components present in the source material, highlighting this as a positive point from a chemical point of view when manufacturing synthetic carbonate rocks with this type of material.
3.2. Petrophysical and Petrographic Results
3.2.1. X-ray Computed Microtomography (µCT)
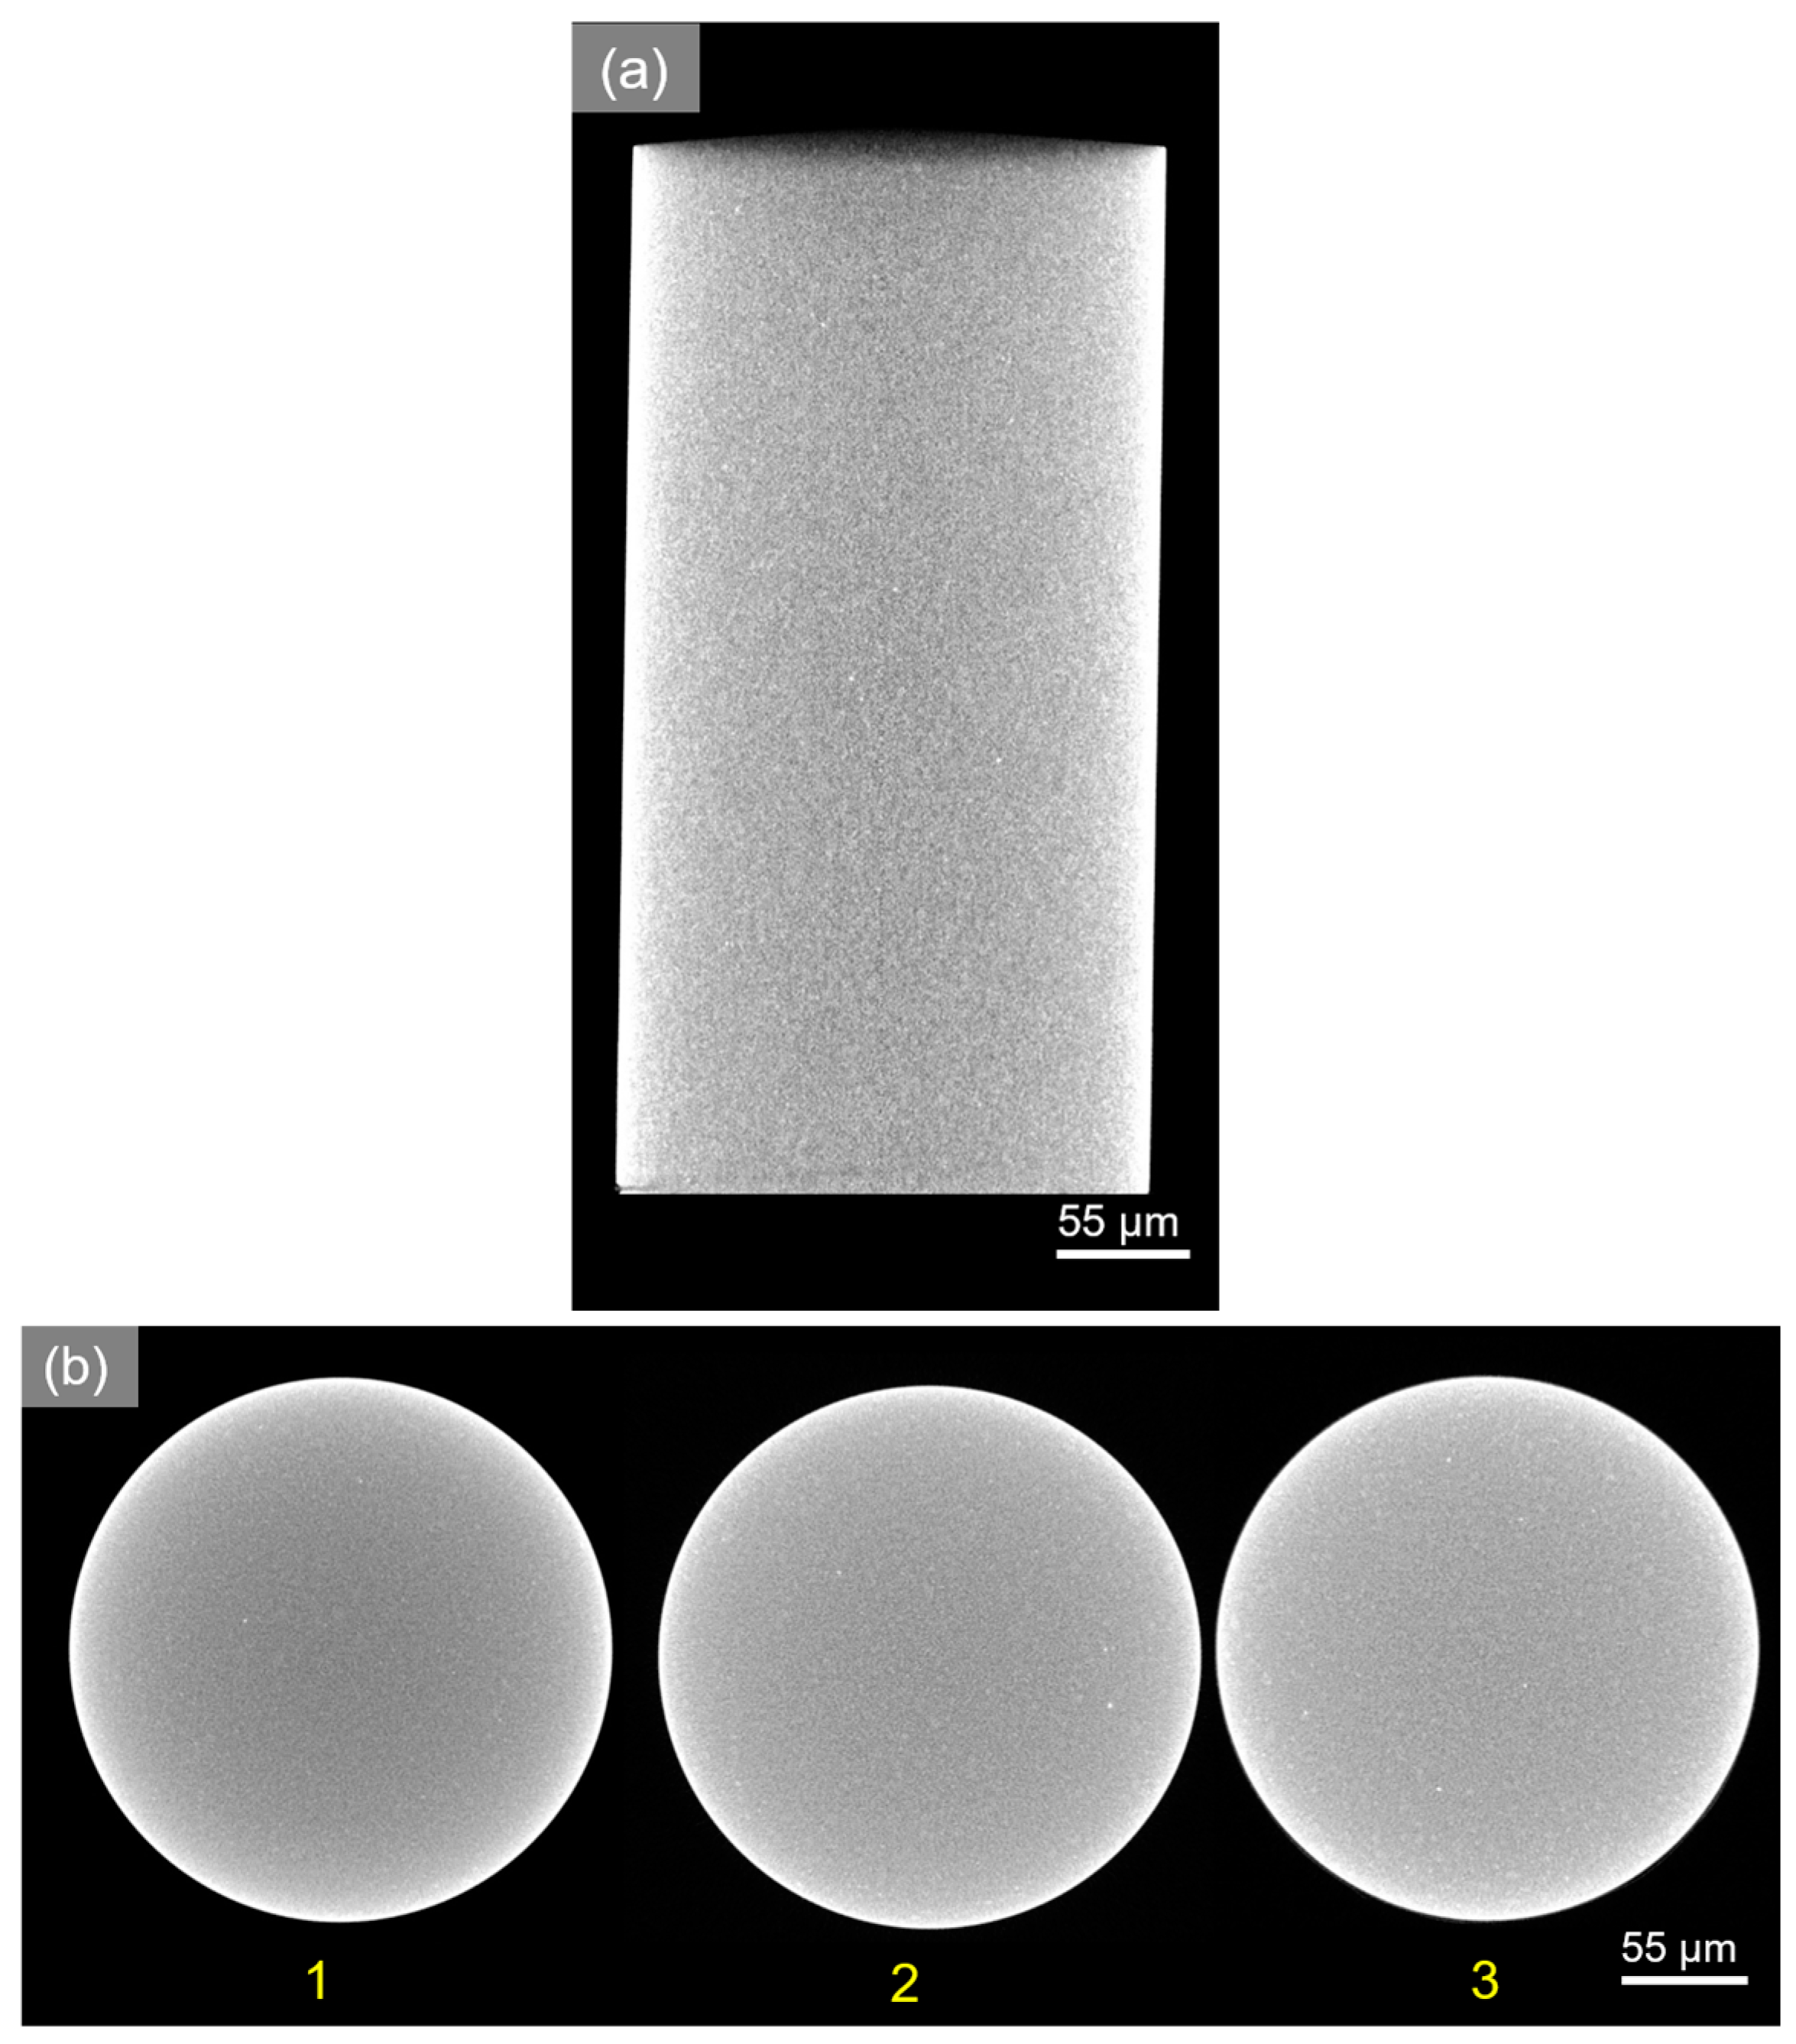
Analyzing the images generated by the µCT, extracted from the central portion of the sample, homogeneity of the rock is observed (Figure 5a,b—top (1), central (2) and base (3)), with an intact internal structure, without discontinuities along its height and diameter.
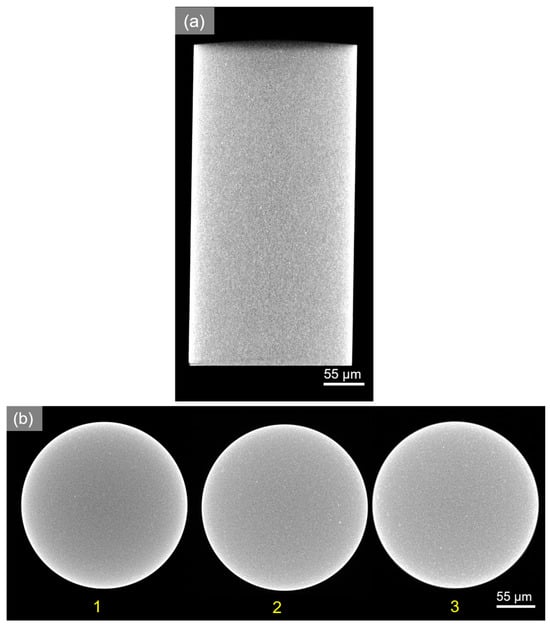
Figure 5.
Computed microtomography of synthetic carbonate rock (P-01): (a) longitudinal section and (b) cross-section—top (1), middle (2) and base (3).
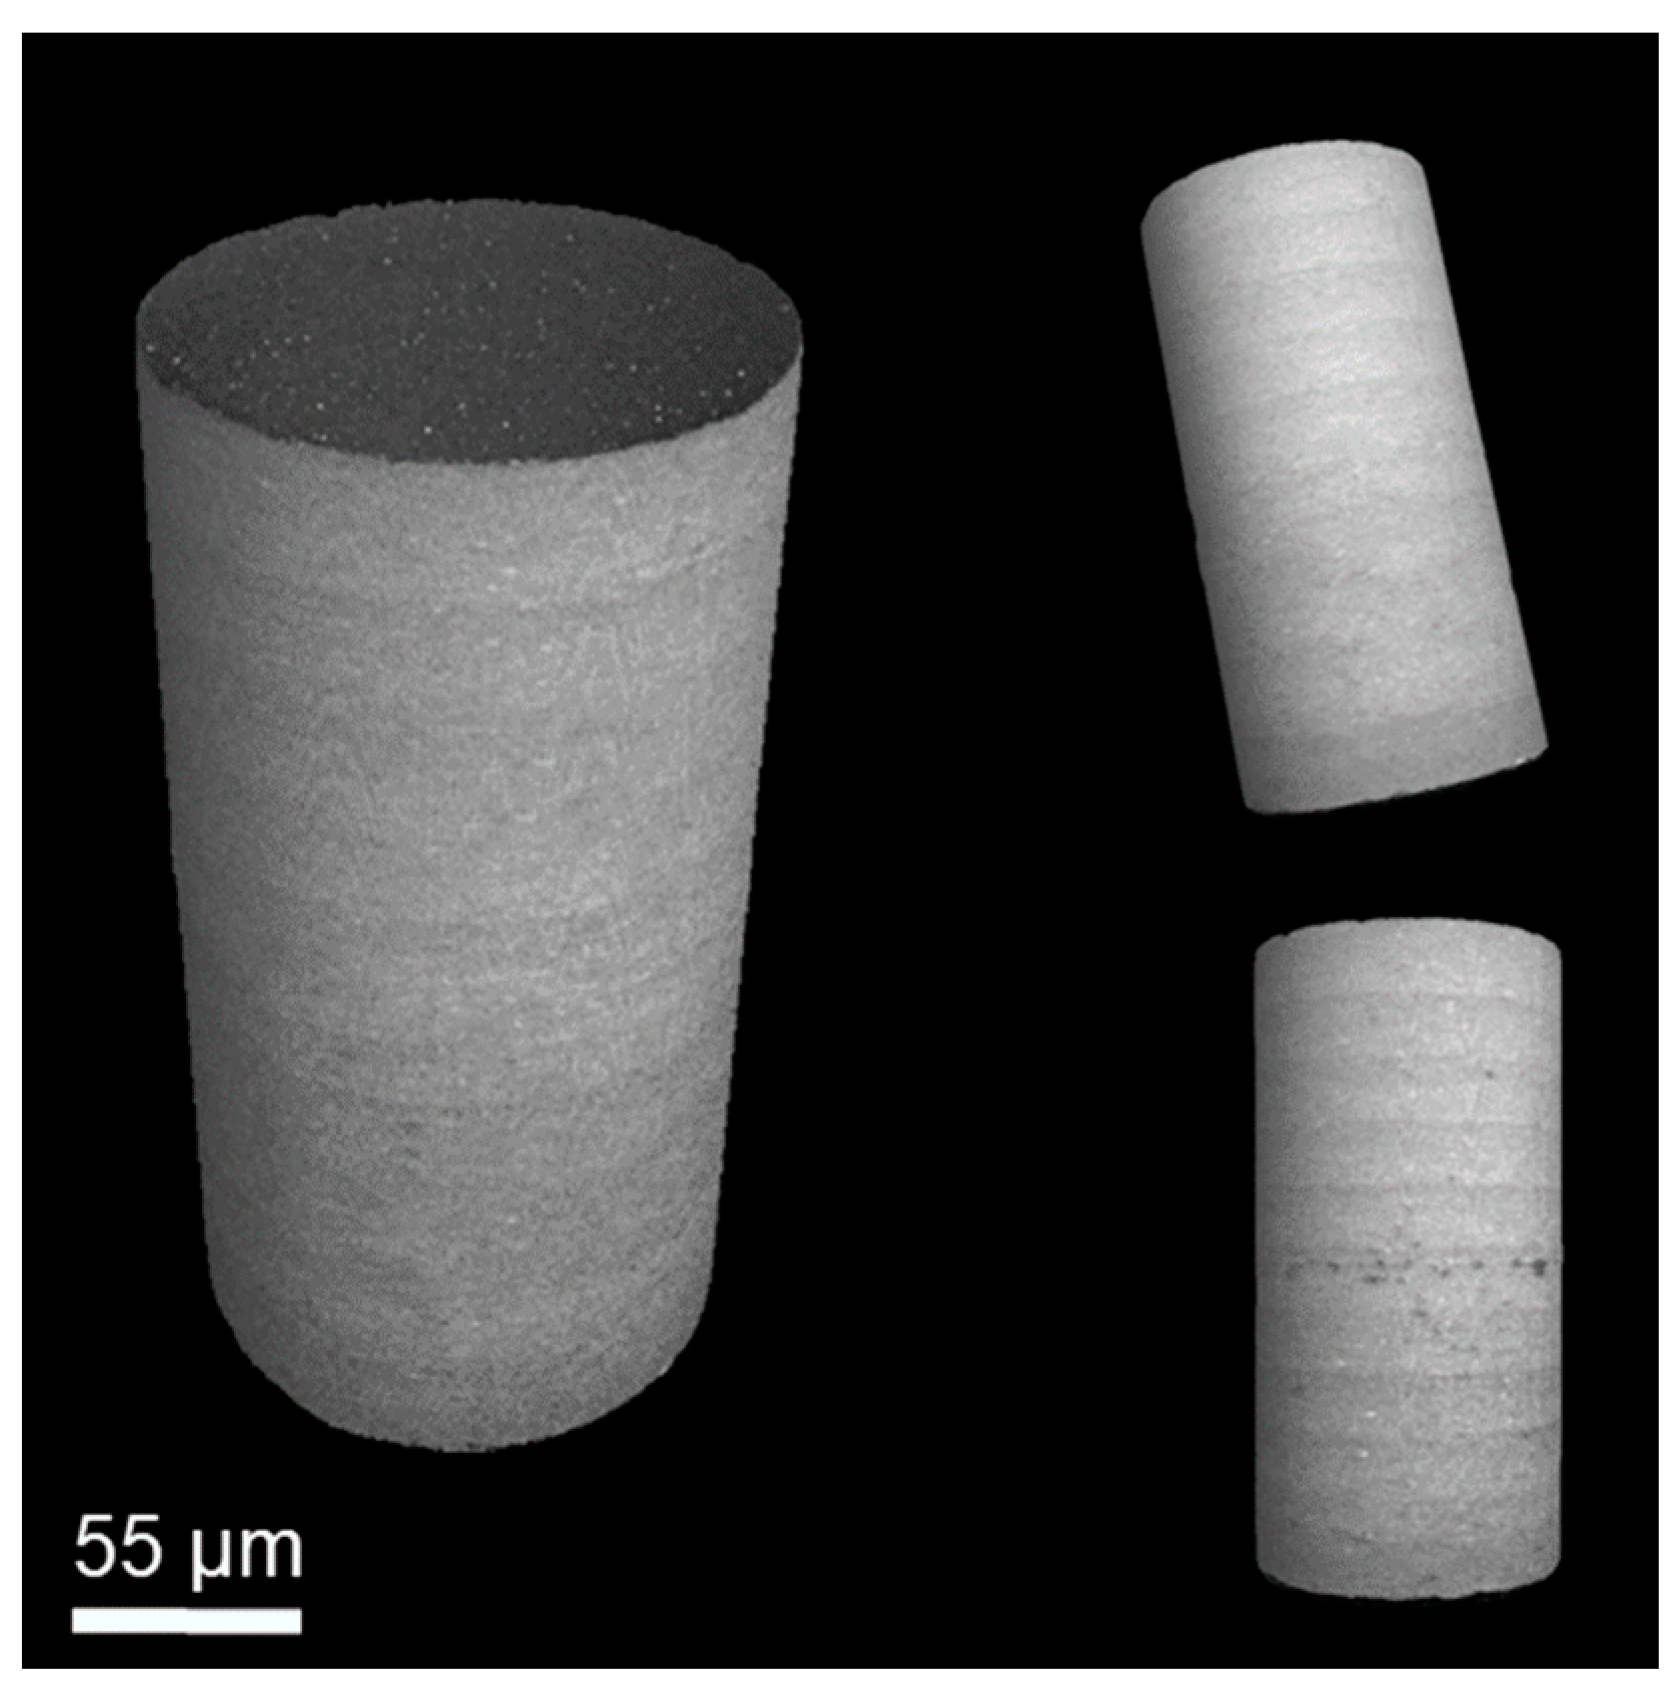
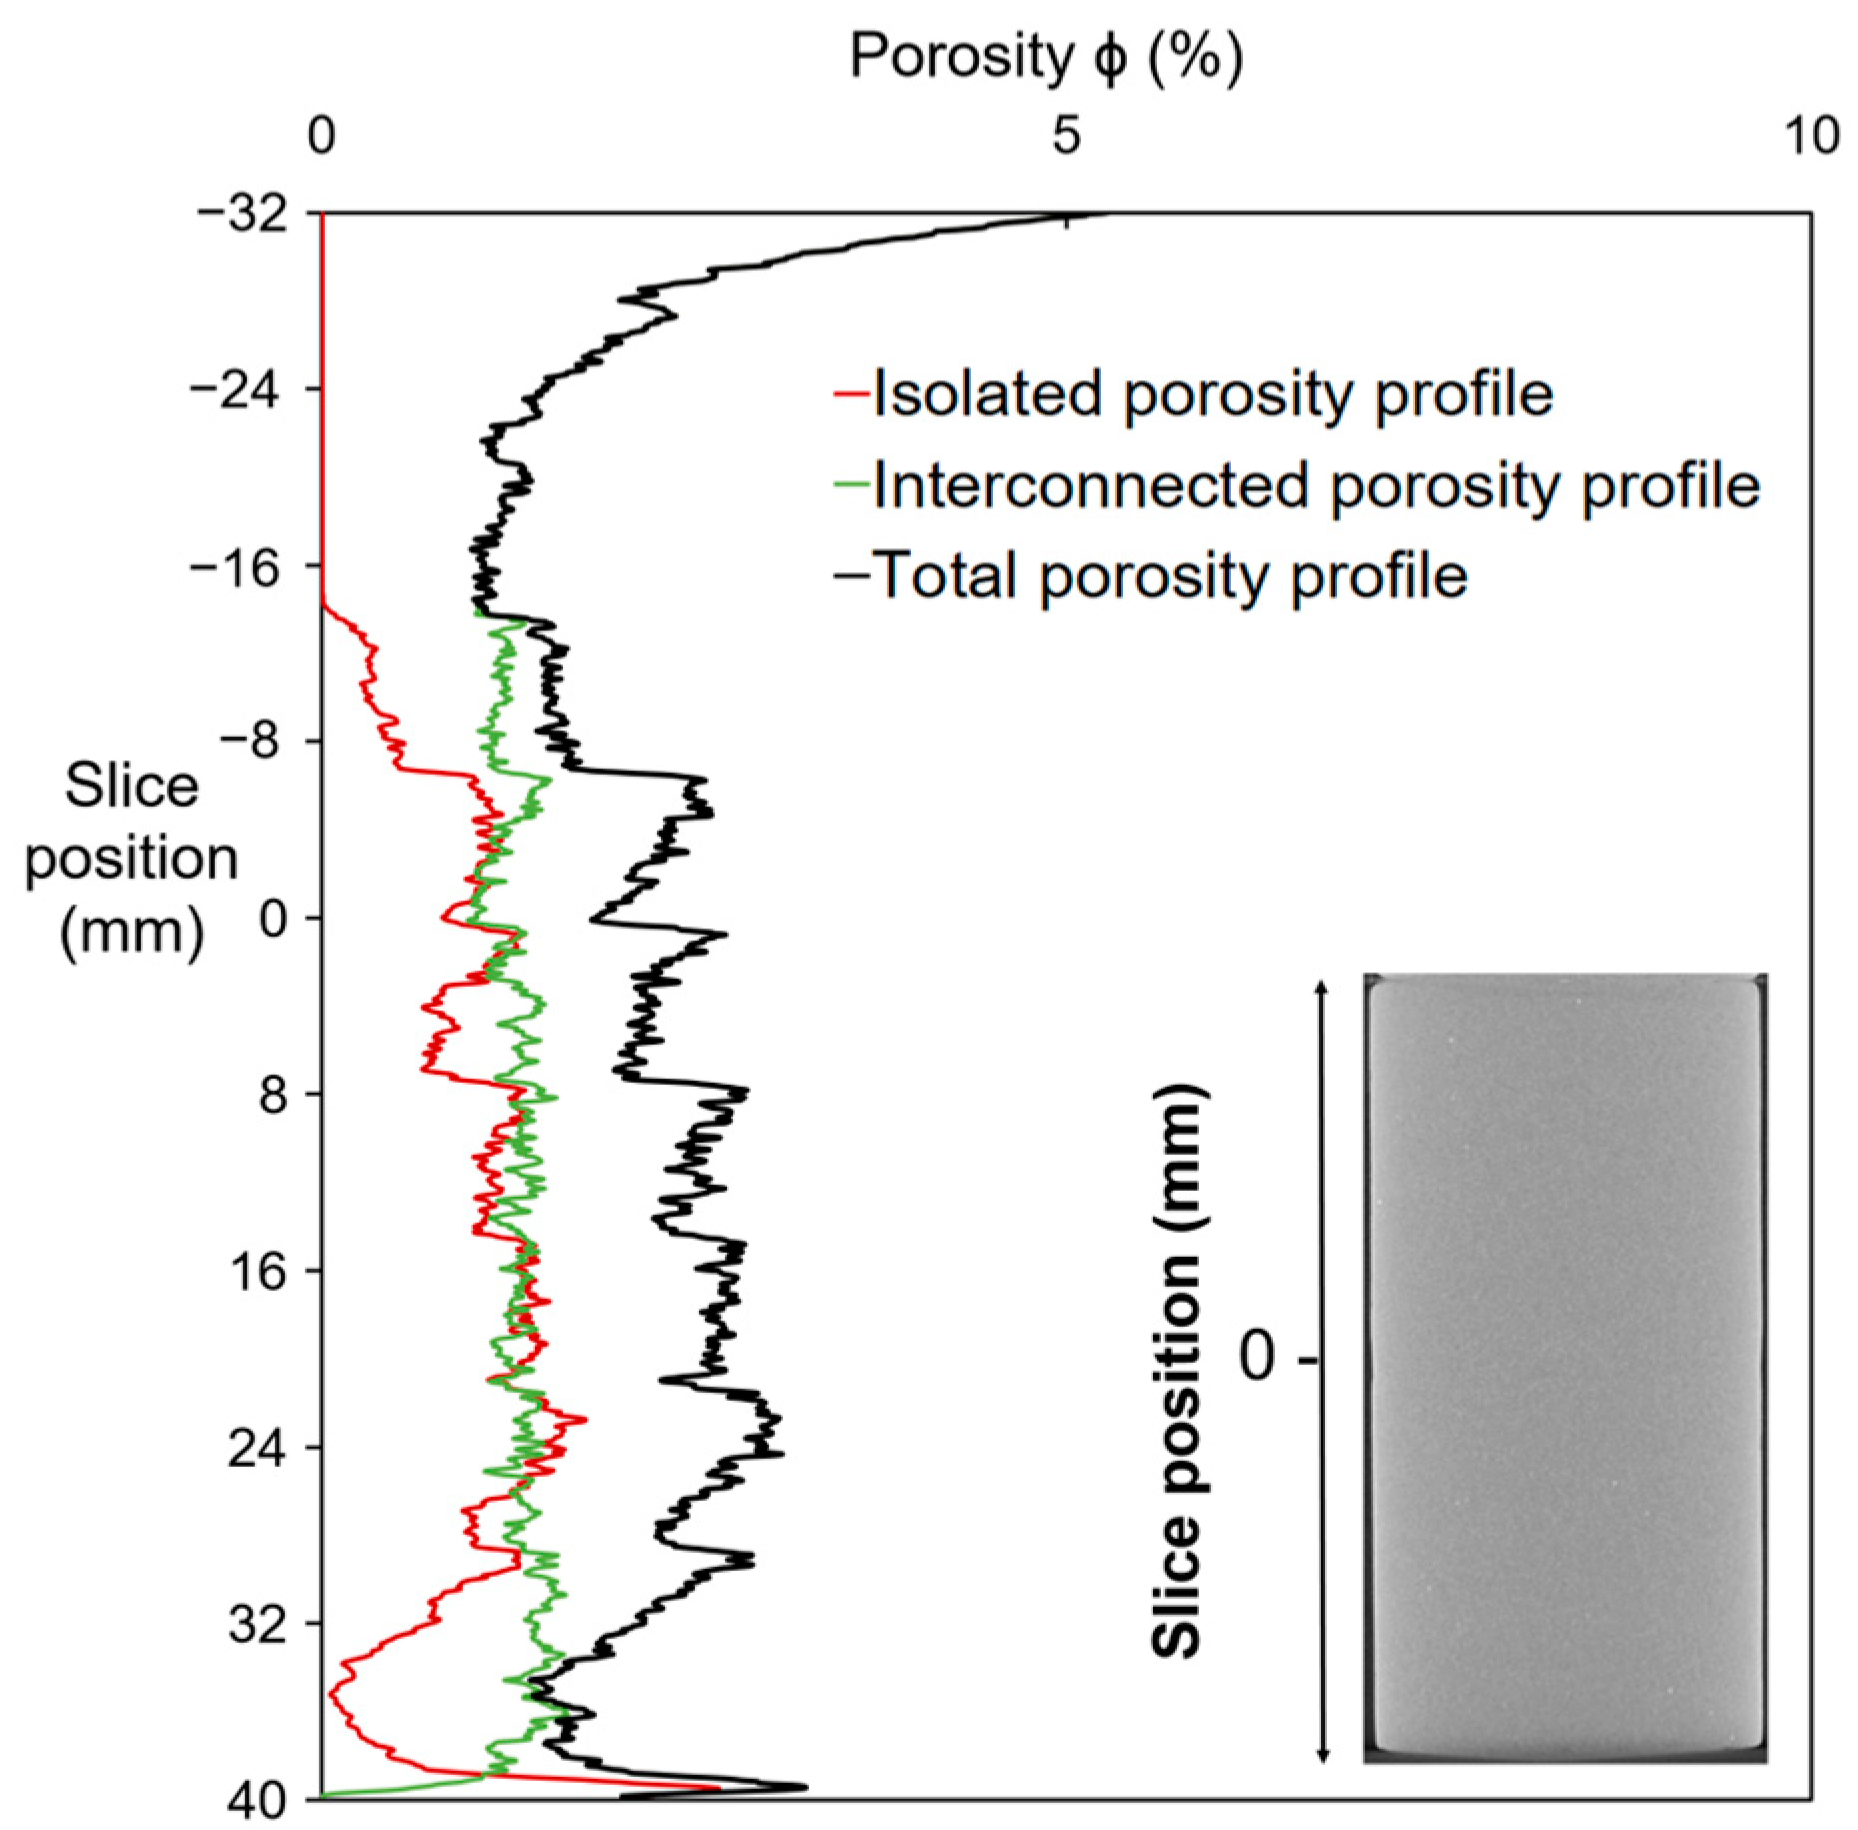
The sample reconstitution in 3D projection (Figure 6) through the VG Studio® software (version 3.4), generated from the 1490 slices, allowed the estimation of pore volume by the quantification of its voxels (55 µm) so that it was possible to identify the isolated, interconnected and total porous volume presented in Figure 7.
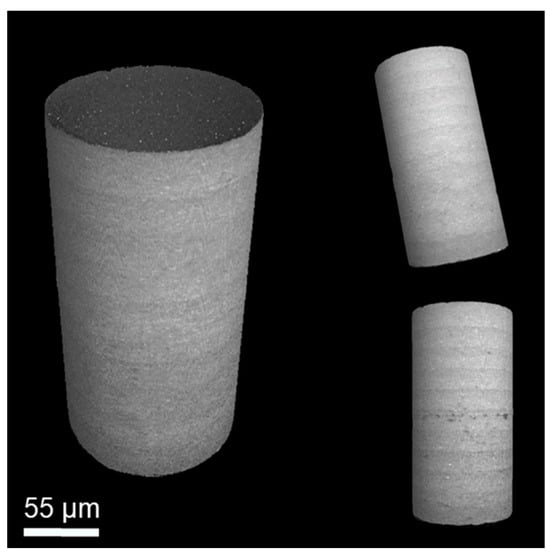
Figure 6.
Sample reconstitution in a 3D projection of the sample P-01.
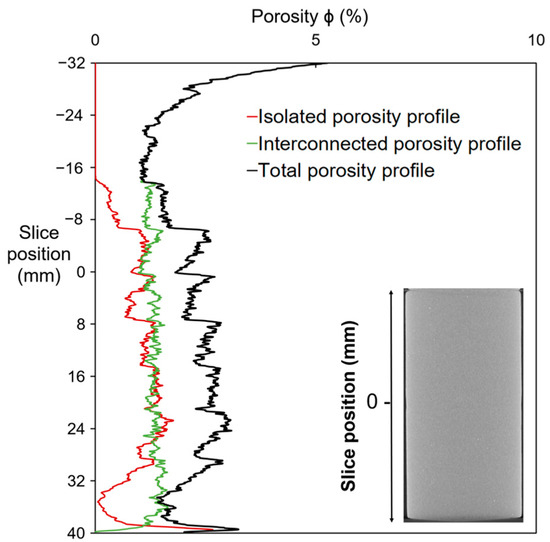
Figure 7.
Isolated, interconnected and total porosity profiles of the synthetic carbonate rock (P-01).
This graph shows the porosity distribution profile (%) and the slice position along the length of the sample, where 0 on the horizontal axis indicates the center portion of the rock. The analysis quantified 1.30% of isolated pores and 4.63% of interconnected pores, with 5.93% of total porosity; according to the porosity profiles presented, they show a uniform trend of pore distribution.
Evaluating the pores observed along the sample, it is reported that the interconnected pore volume promotes fluid flow permeability along the structure, as it allows fluid transmission between pores. Although porosity estimation by image analysis generated by computed microtomography has the advantage of being a non-destructive verification [20], pores smaller than the image voxel size (55 µm) were not identified and were not quantified in the total pore volume, being a limitation of this methodology [36].
3.2.2. Petrographic Image Analyses
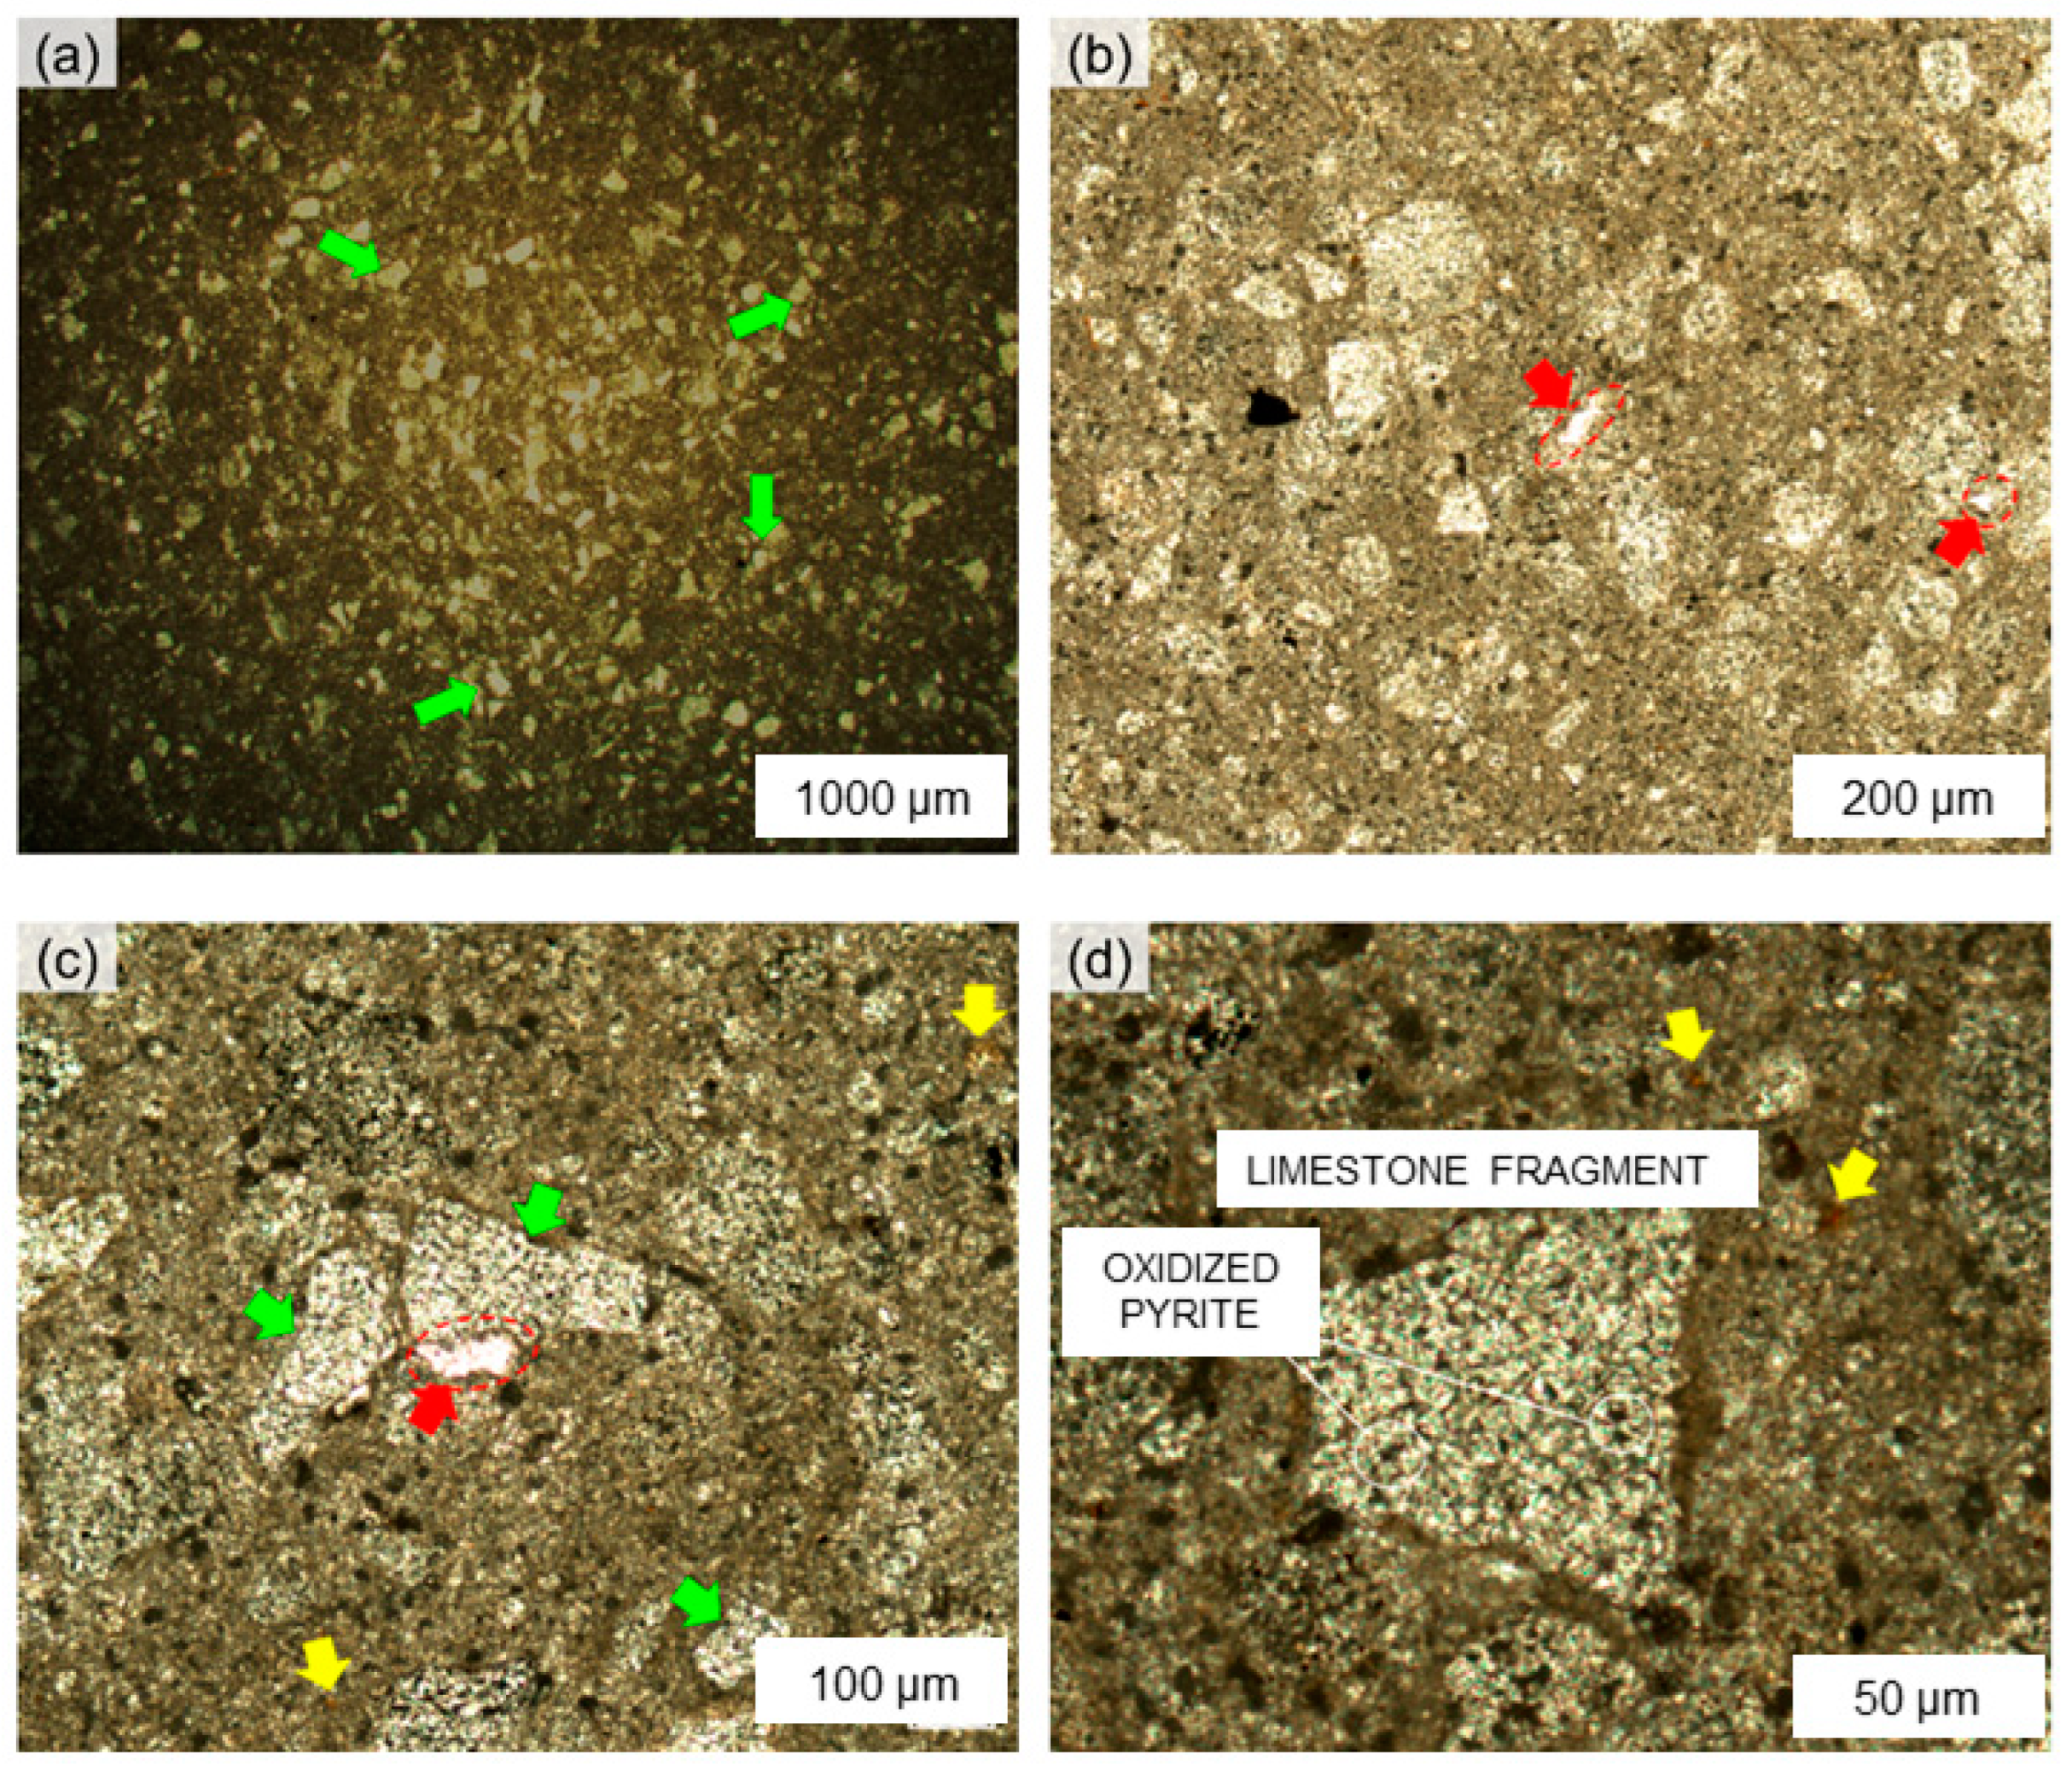
Analysis of a thin lamina obtained from sample I-01 using microscopy points out the general structure of the synthetic rock (Figure 8a), with the presence of clasts (limestone fragments) of different sizes and shapes (<425 µm), dispersed within a matrix composed of epoxy resin (green arrows) and very fine grains of limestone powder (region in black).
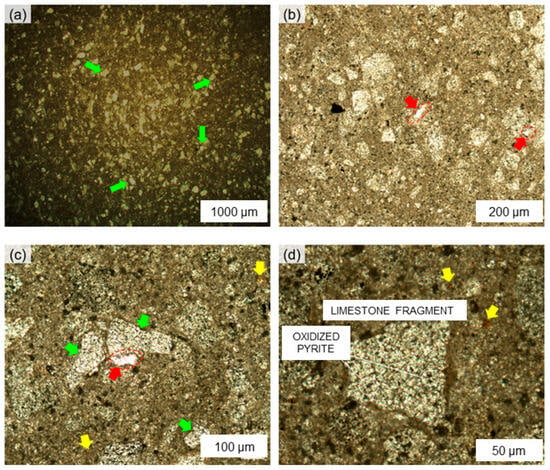
Figure 8.
Petrographic analysis of the synthetic sample (I-01): photomicrograph (parallel Nicols) indicating (a) general aspect of the sample with clasts (green arrows)—limestone fragments—of different sizes and shapes (<425 μm); (b) blank regions indicating pores of different size and shape (red arrows); (c) blank regions indicating pores of different sizes and shapes (red arrows), presence of clasts (green arrows) and organic matter remains (yellow arrows); (d) Detail of limestone fragment with black spots indicating oxidized pyrite (FeS2) agglomerates and organic matter remains (yellow arrows).
Figure 8b,c show blank regions, which refer to the presence of voids of different sizes and shapes (red arrows), formed from the consolidation process, representing the intergranular porosity, typical of carbonate rocks [37].
Figure 8d shows a laminated limestone fragment in detail, where one can observe the presence of a micritic matrix (predominant gray region), which originates from the limestone powder used in the production of the rock, whose constitution is indicated by [32] to be composed of calcite (CaCO3) and components of oxidized pyrite (FeS2) agglomerates (black spots) inside the clast; components of biotic origin (organic matter remains) indicated by dark brown colored spots (yellow arrows) are also observed, typically present in the formation [38]; that indicates their presence in Figure 8c,d due to weathering surface processes from the dark-gray laminate limestone used [32].
3.2.3. Porosity and Permeability Characterization
Table 2 presents the results of the porosity and permeability of the samples after characterization using a helium porosimeter and nitrogen permeameter, respectively.

Table 2.
Petrophysical characterization after laboratory tests: porosity ϕ (%) and permeability k (mD).
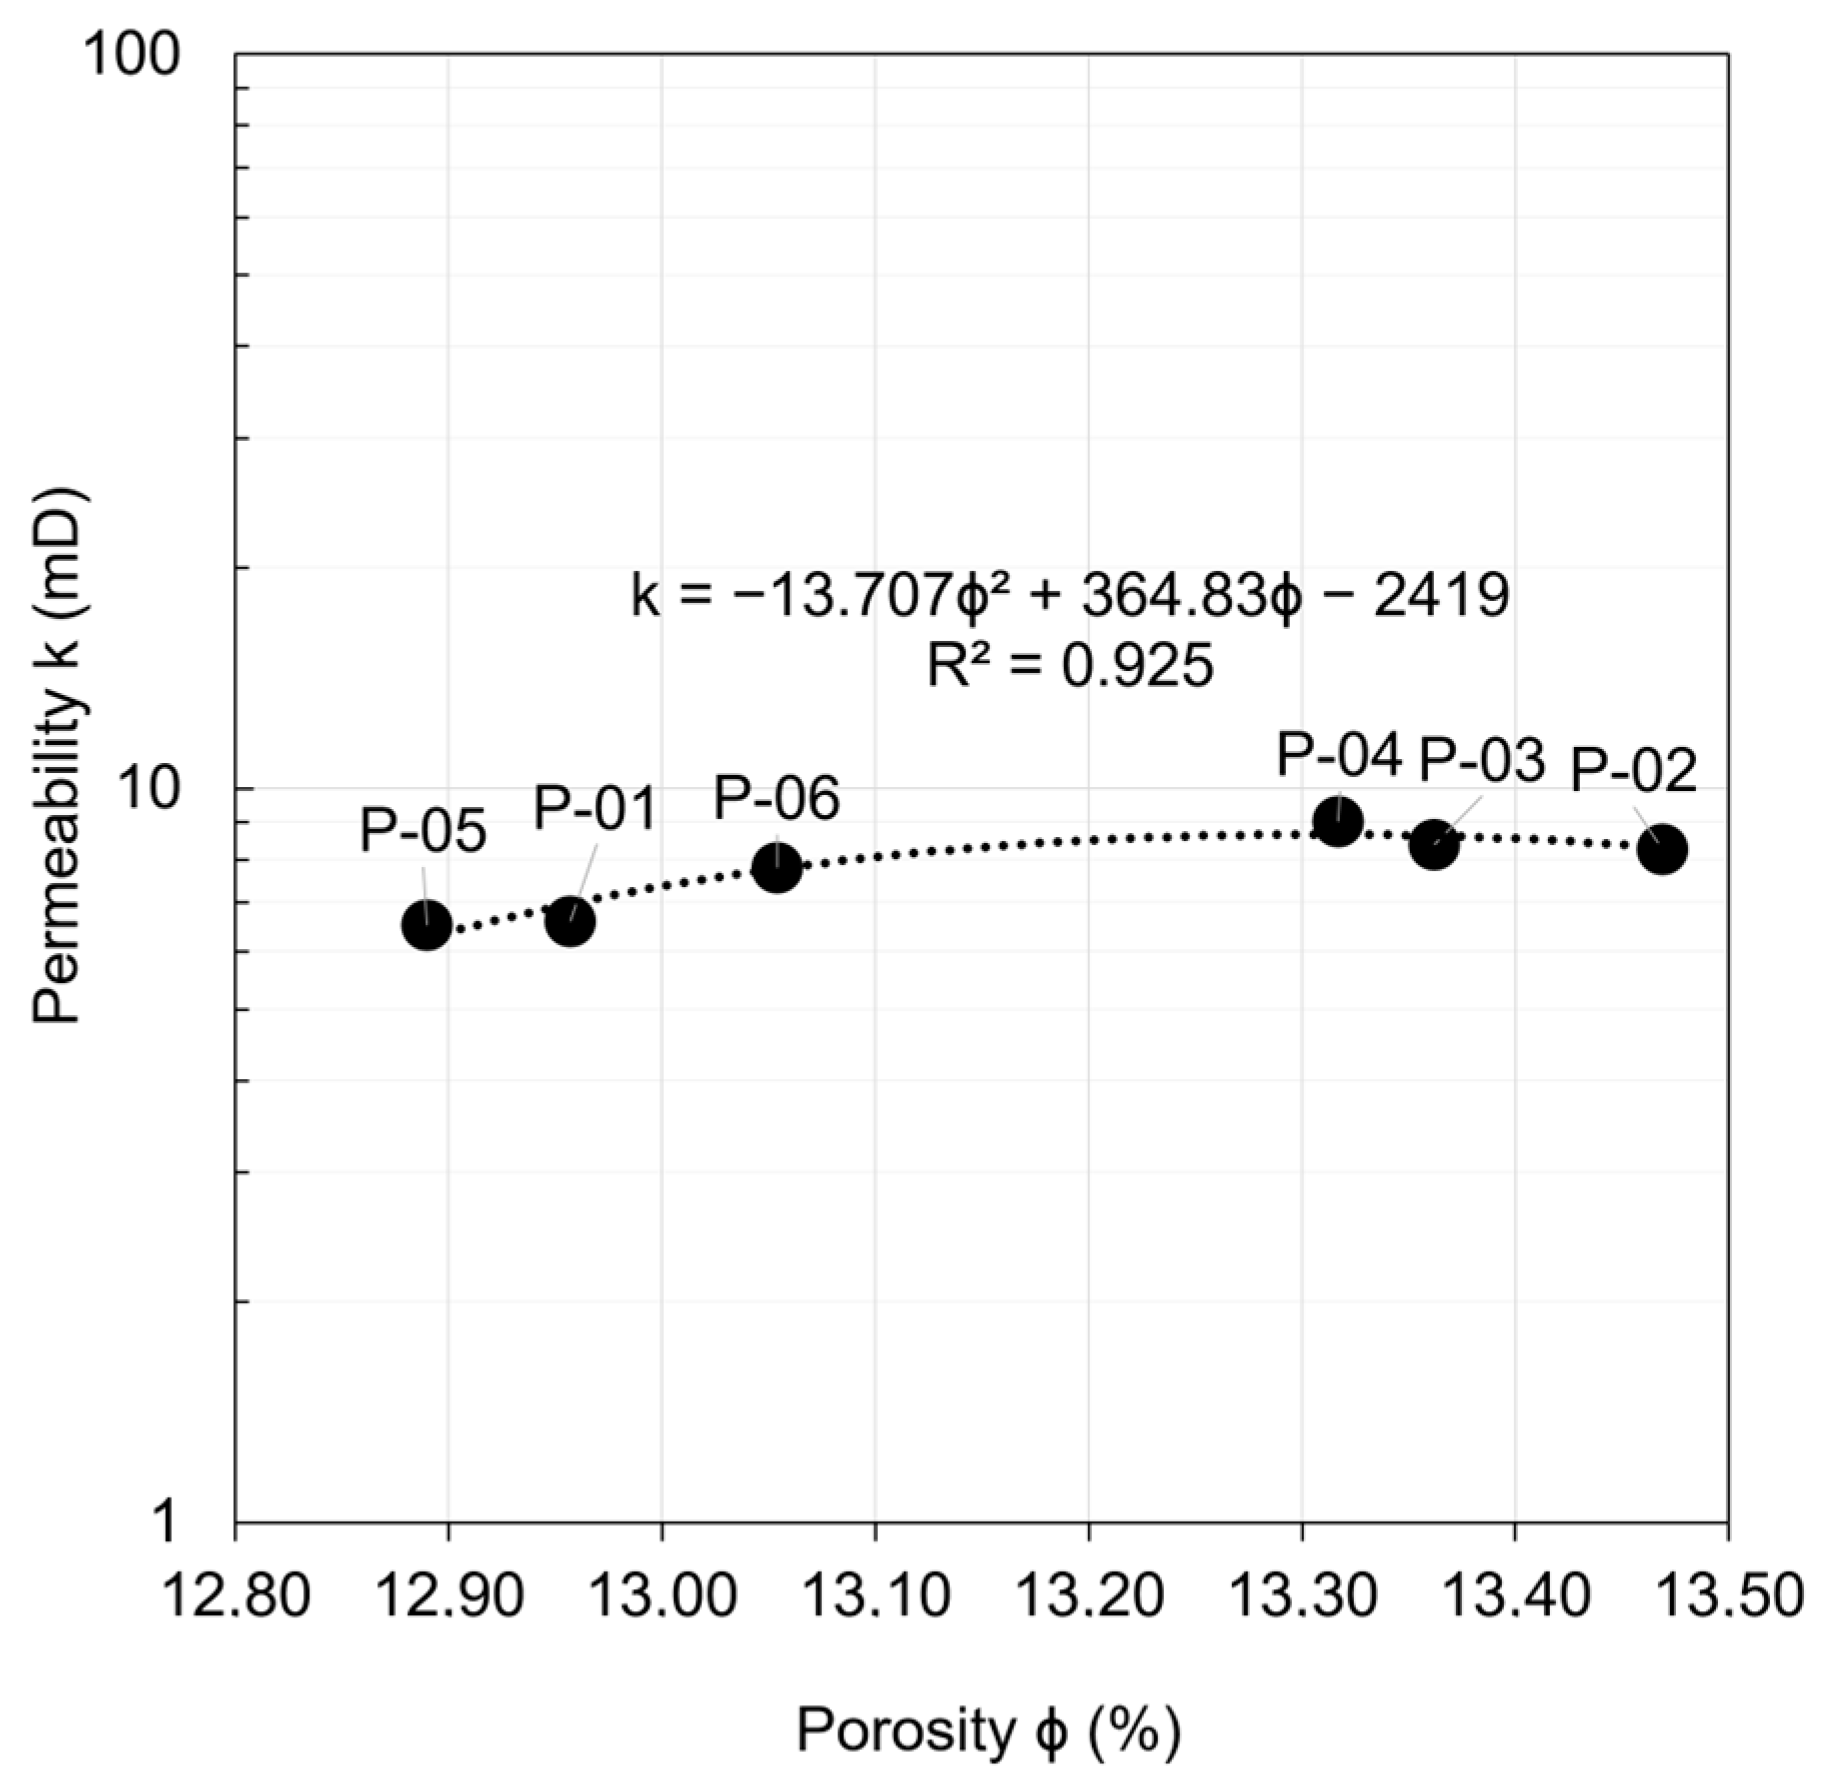
The proximity of the values obtained and presented in Table 2 during the petrophysical characterization indicates that the production process of the rocks presents good repeatability, producing homogeneous and similar samples, which is the purpose of the artificial rock synthesis, being able to reproduce the petrophysical properties of natural carbonate rocks. Figure 9 correlates the porosity and permeability of the samples, showing that permeability increases with increasing porosity in a polynomial trend, presenting a squared regression coefficient (R2) of 0.925, showing a good correlation between these values (R2 > 0.90); [15] presented a linear correlation between porosity and permeability, also with R2 greater than 0.90; [12] observed an exponential correlation between porosity and permeability for synthetic carbonate rocks, with R2 ≈ 0.9, also indicating increased permeability with increasing porosity.
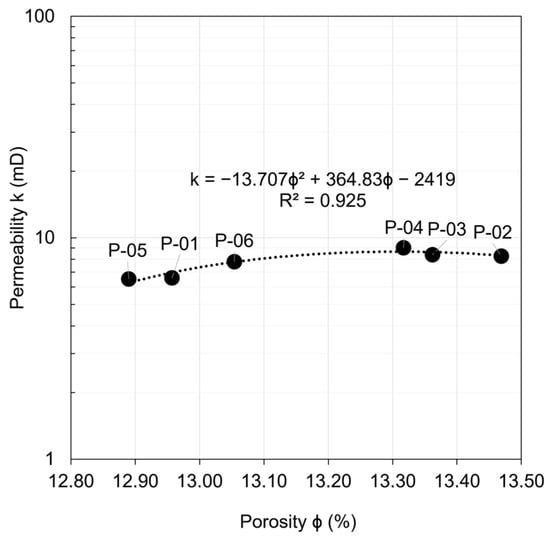
Figure 9.
Permeability in terms of porosity.
3.3. Geomechanical Results
3.3.1. UCS Analyses
Table 3 presents the results of the unconfined compressive strength test in terms of UCS, Young’s modulus (E) and Poisson’s ratio (υ).

Table 3.
Geomechanical characterization: UCS (MPa), Young’s Modulus E (GPa) and Poisson’s ratio (υ).
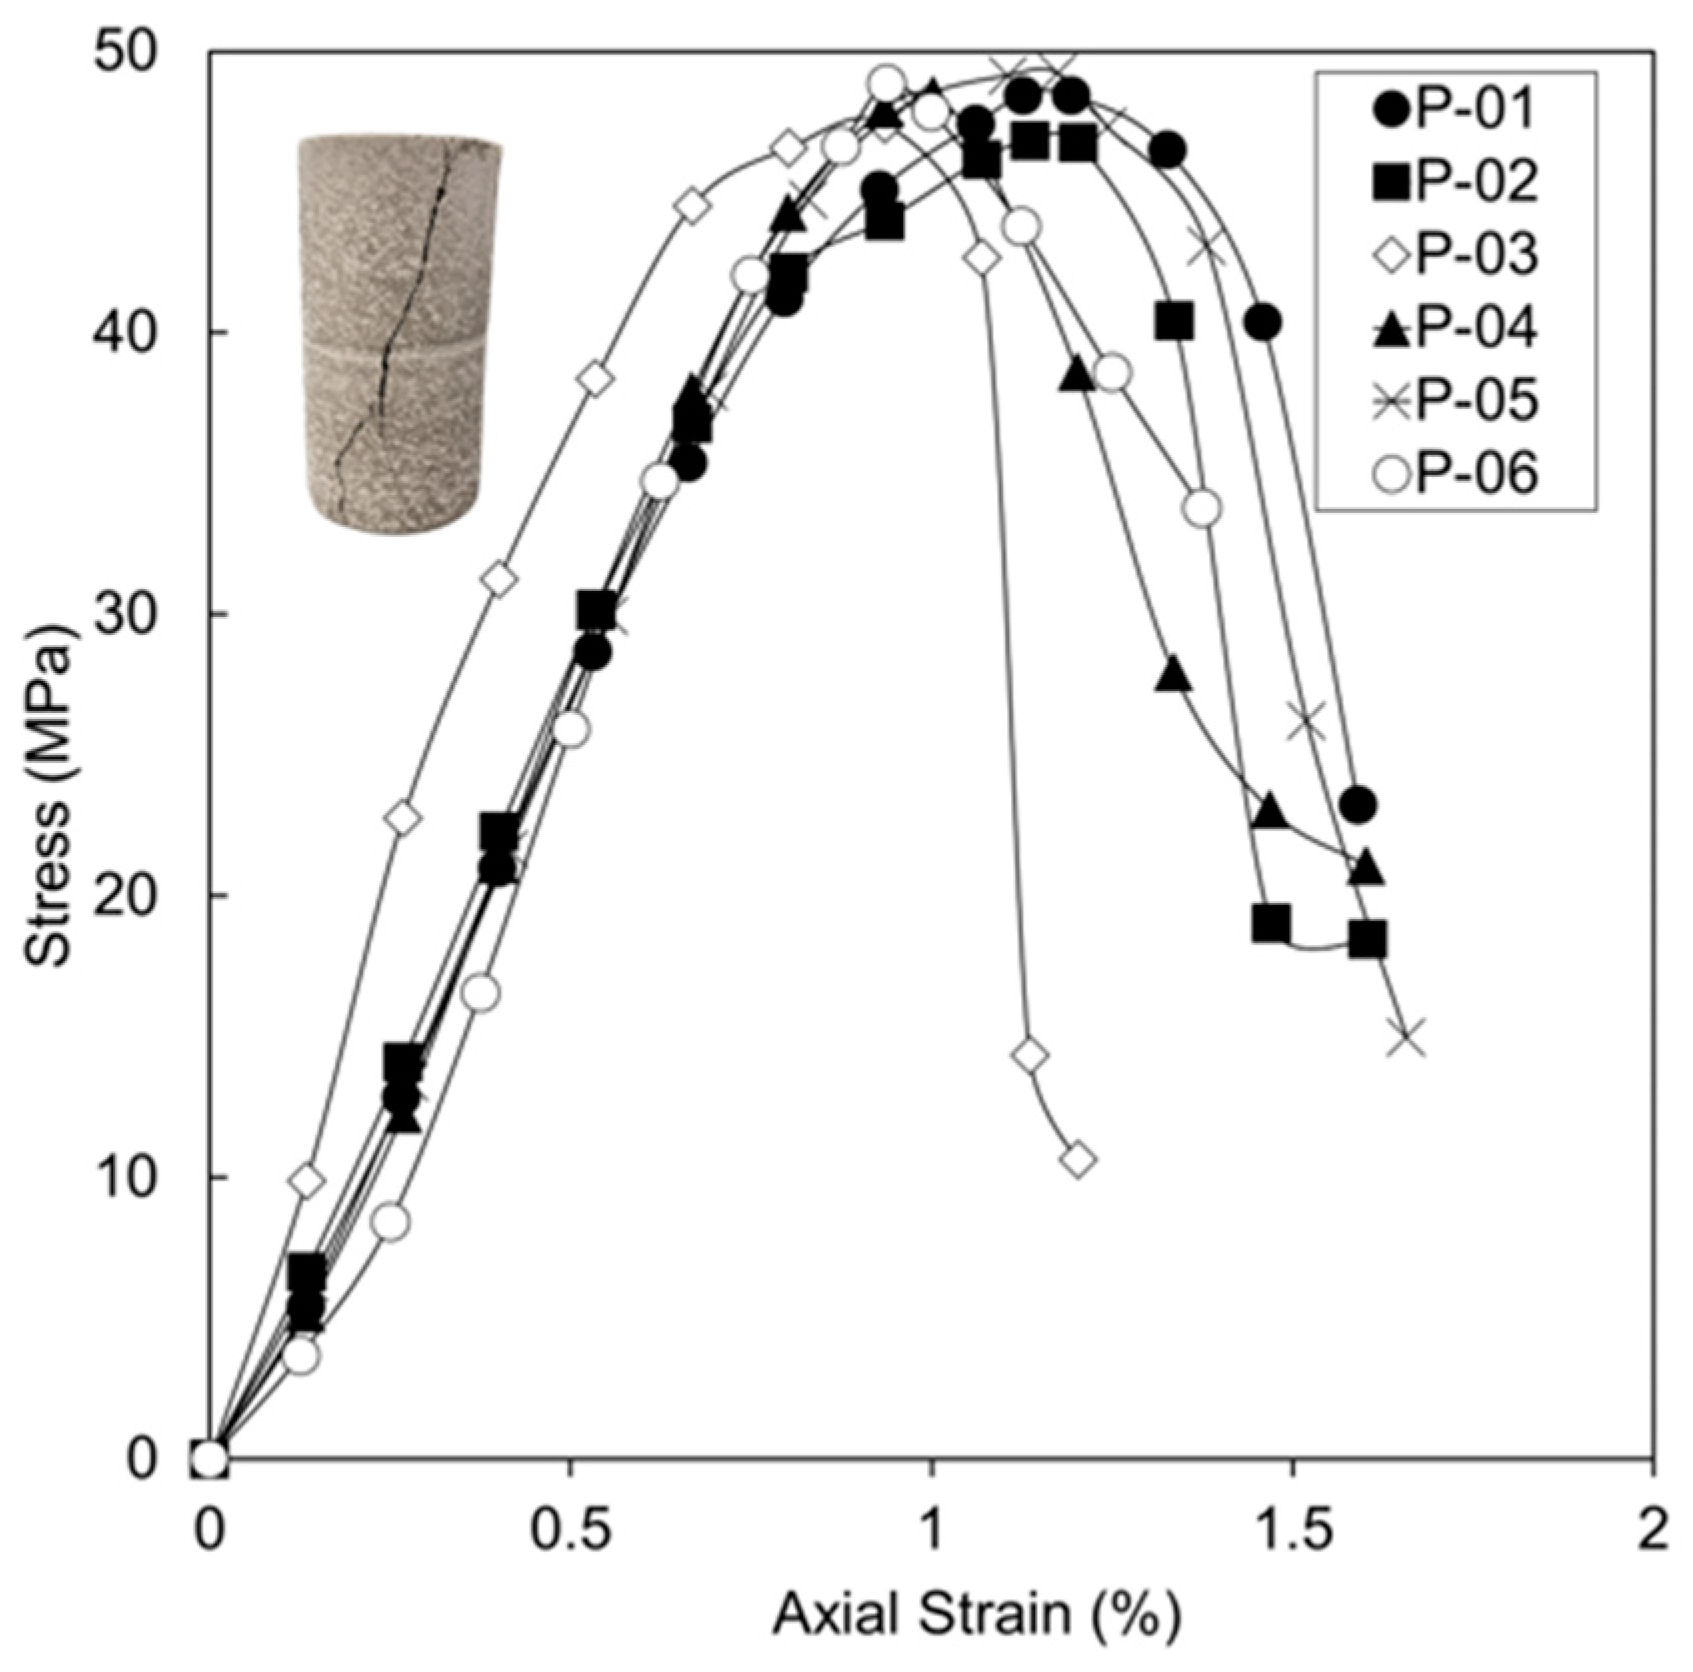
The stress-strain behavior of synthetic carbonate rocks is shown by the curves of stress (MPa) versus axial strain (%) in Figure 10.
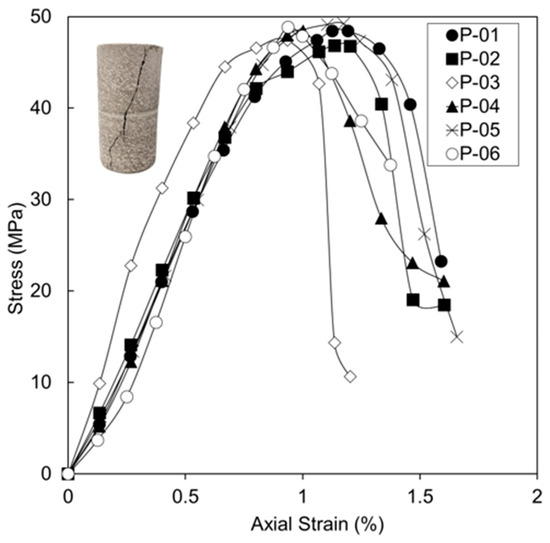
Figure 10.
Stress-strain curves of samples P-01 to P-06.
UCS values between 46.83 MPa (P-02) and 49.22 MPa (P-05) were obtained, with an average UCS of 48.20 MPa, being classified as moderately hard rocks (25–50 MPa) [39]. As the hardening process of the epoxy occurs, due to its binder properties, the samples gain strength and, associated with the consolidation process applying a compaction pressure for molding, promote strength characteristics to the rock, presenting values higher than those reported by [20,26] for synthetic carbonate rocks. Analyzing the UCS values, these present as very close, being associated with the production process of the samples, reflecting their repeatability. After UCS tests, all samples showed a defined rupture plane in the central portion.
As for the stress-strain curves presented, elastic behavior is observed, with a defined strength peak followed by an abrupt drop in UCS after rupture [11], and maintenance of the behavior trend of elastic behavior of the curves for five samples (P-01, P-02, P-04, P-05 and P-06), which is reflected by the proximity of the Young’s modulus (E), presenting an average of 6.61 GPa, which was estimated through the average inclination of the linear portion of this section. Poisson’s ratio ranged from 0.20 to 0.45, with an average of 0.31.
3.3.2. Tensile Strength Analyses
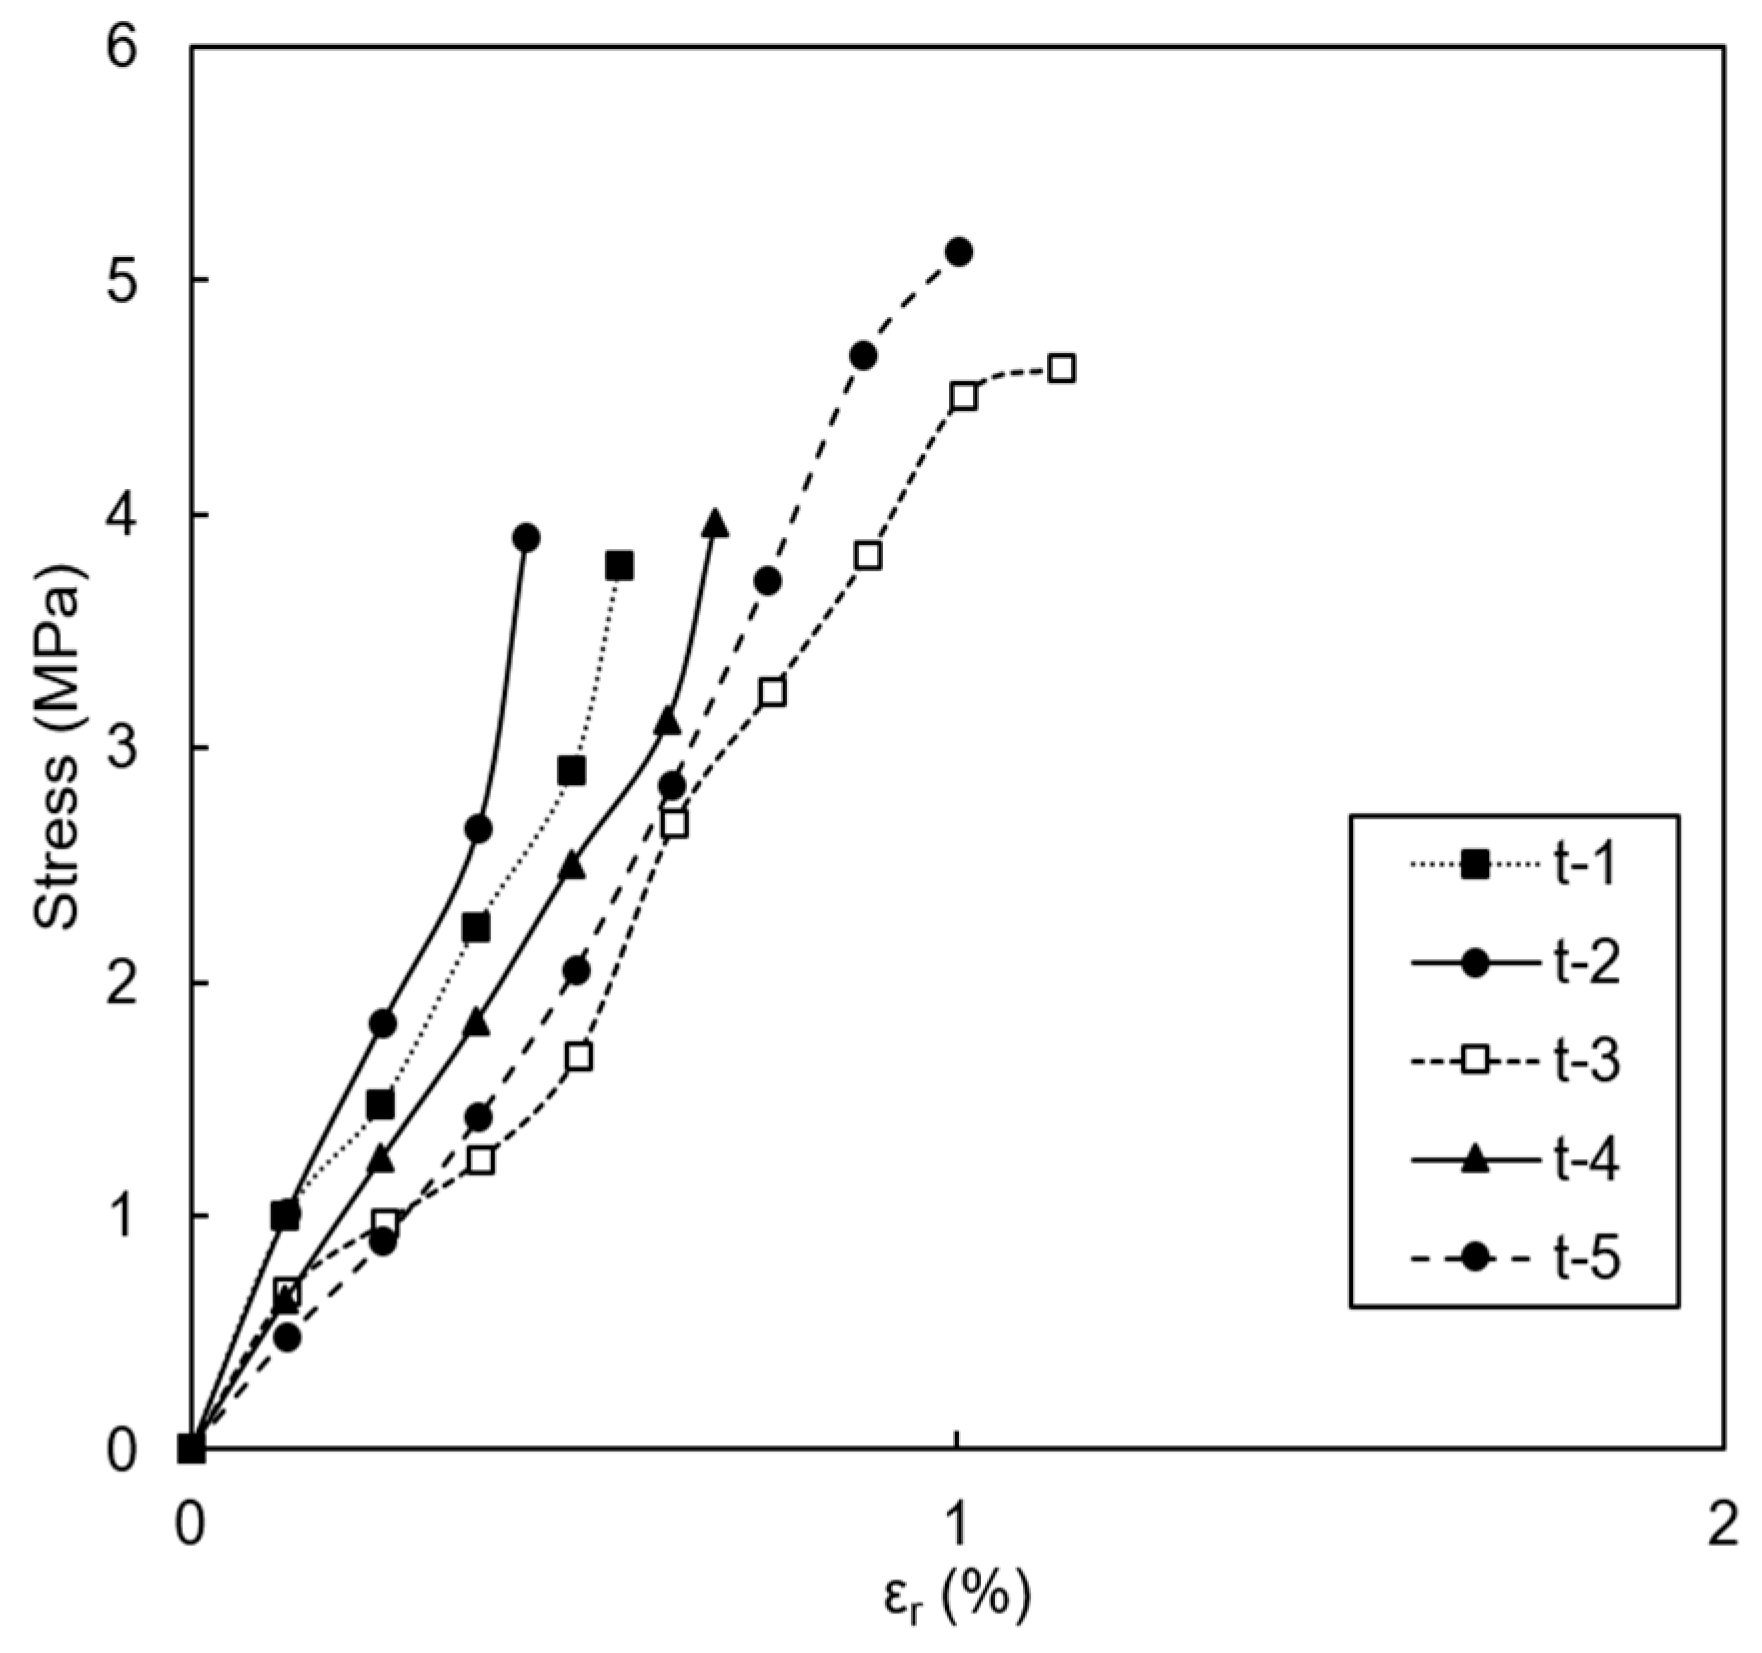
Table 4 shows the values of tensile strength—diametrical compression (σt) and the maximum radial strain for the tests carried out on samples t-01 to t-05; the radial stress-strain curves for the samples tested are shown in Figure 11.

Table 4.
σt and radial strain of the samples.
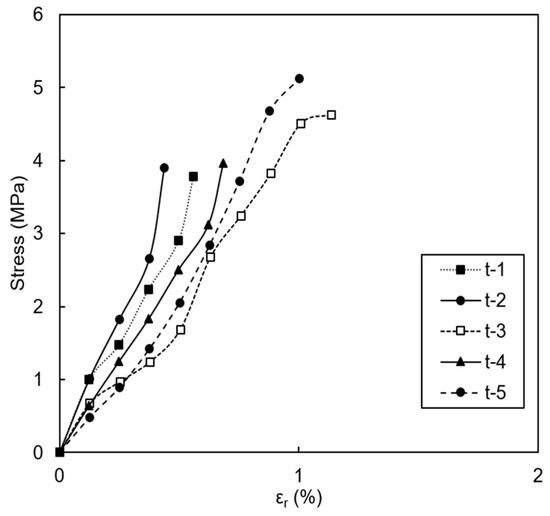
Figure 11.
Stress-radial strain curves of the tensile strength tests.
The samples showed σt ranging from 3.78 MPa (t-01) to 5.13 MPa (t-05), with an average value of 4.28 MPa, around 10% of the values observed for their UCS.
Analyzing the behavior of the stress-radial strain curves, we can see deformation varying between 0.44% (t-02) and 1.14% (t-04), with an average value of εr = 0.76%; for all the rocks tested, both showed an abrupt rupture after reaching their maximum strength, not showing post-peak behavior, and with a typical rupture pattern for this test (Figure 12), with a vertical fracture longitudinal to its length L, in the middle portion of the rock (Figure 12a,b), breaking the sample into two approximately equal parts (Figure 12c).

Figure 12.
Tensile strength test: (a) top view of the longitudinal fracture; (b) longitudinal fracture and; (c) split sample.
3.3.3. Triaxial Strength Analyses
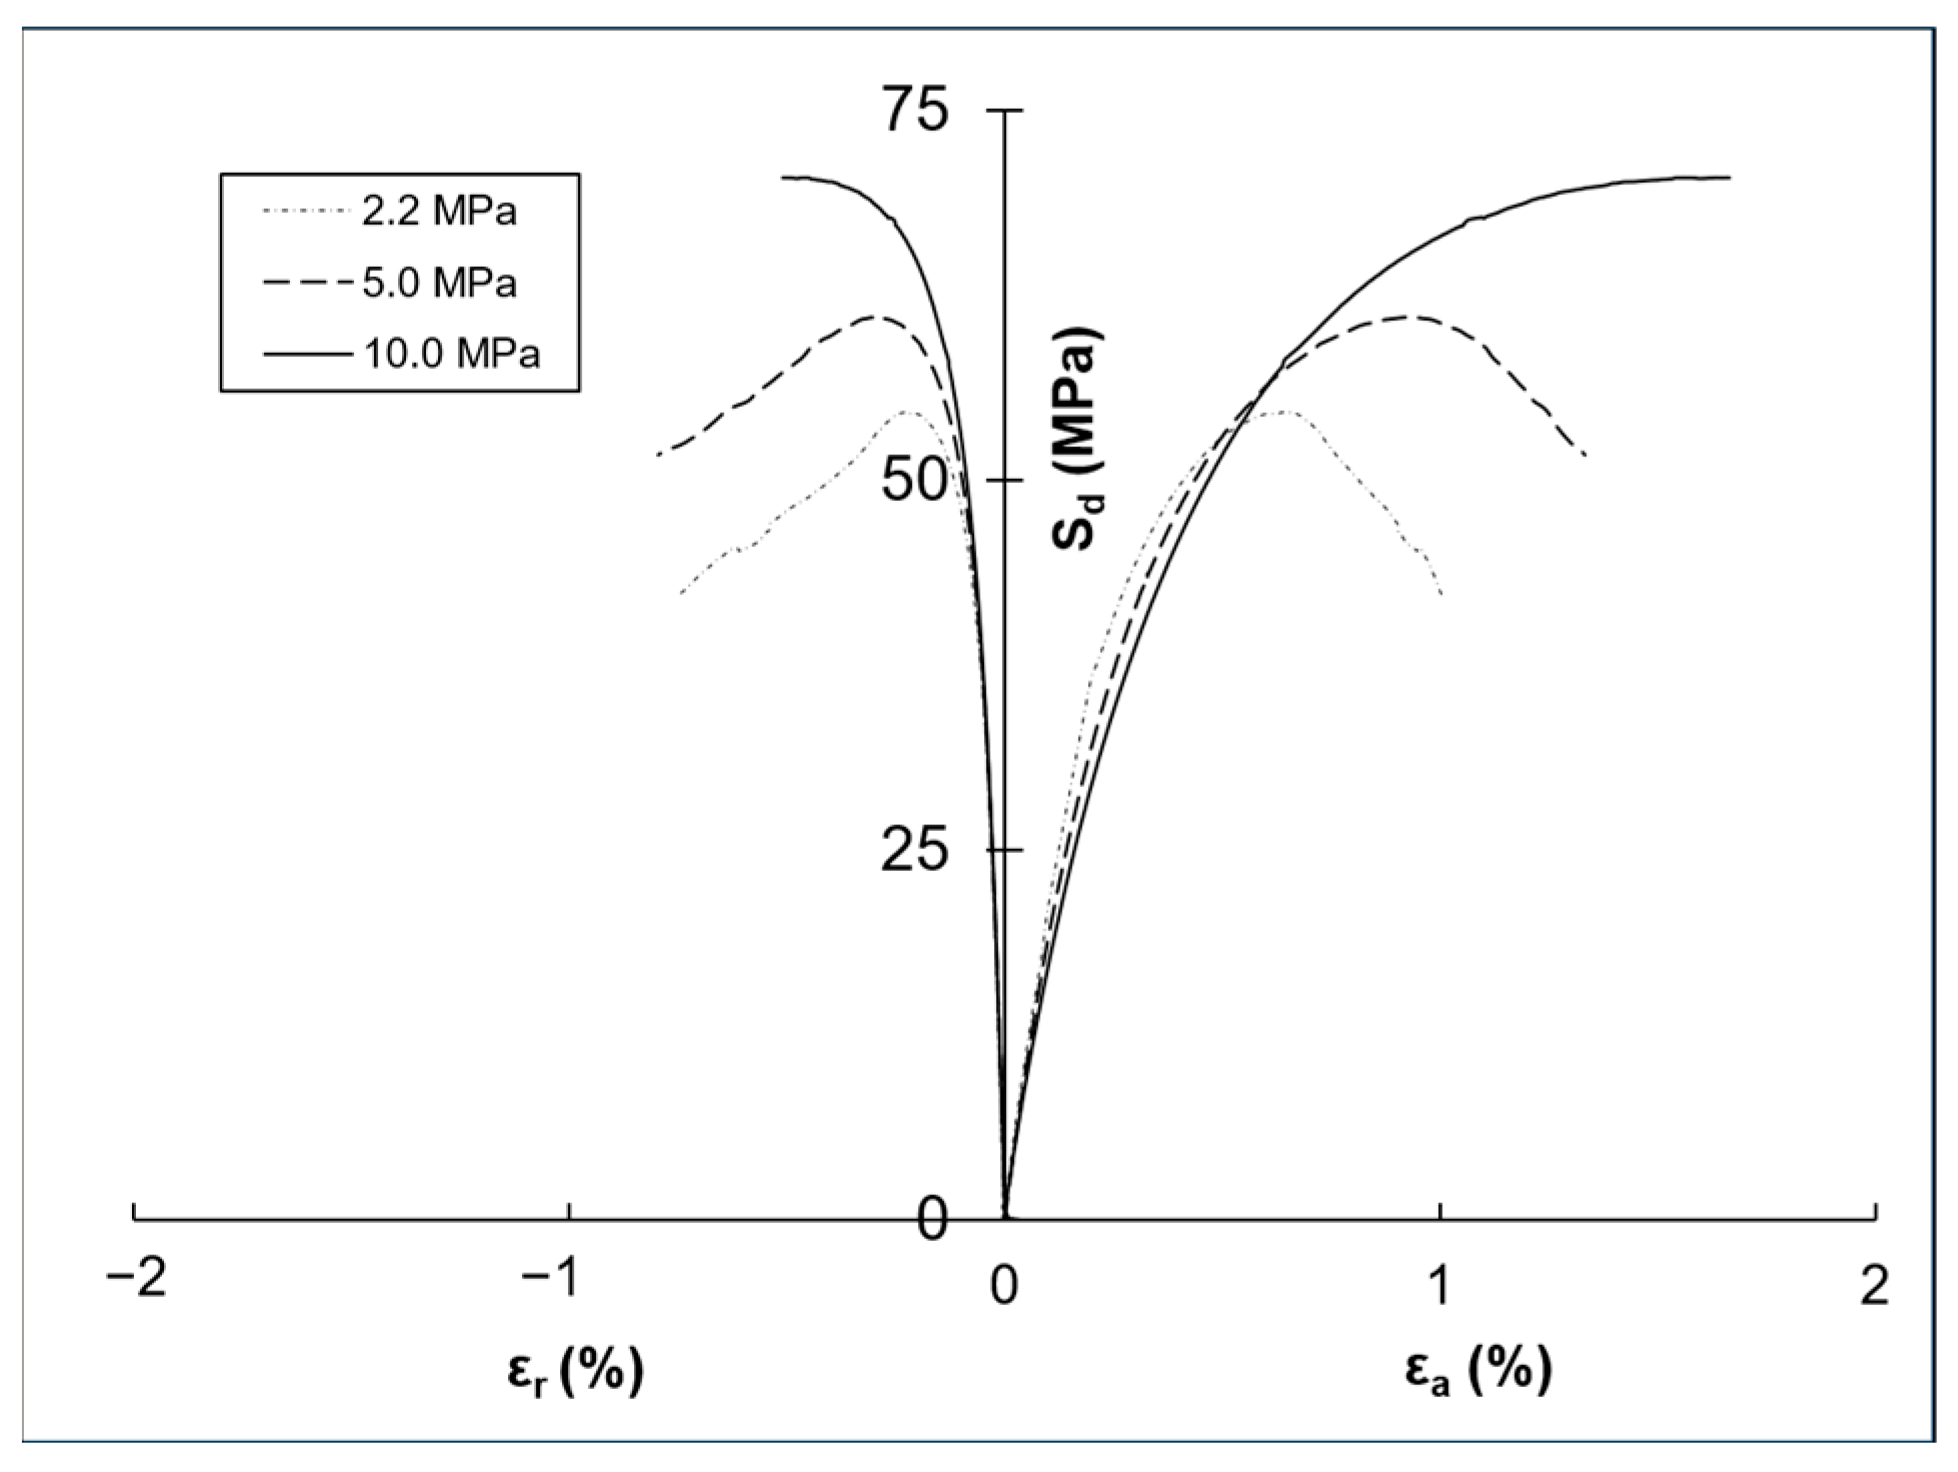
Table 5 summarizes the stress data and geomechanical parameters (secant and shear modulus and Poisson’s ratio) obtained from the triaxial compressive tests; the axial and radial stress-strain curves from the tests are shown in Figure 13, for the confining stresses of 2.2, 5.0 and 10.0 MPa.

Table 5.
Geomechanical parameters obtained from triaxial tests.
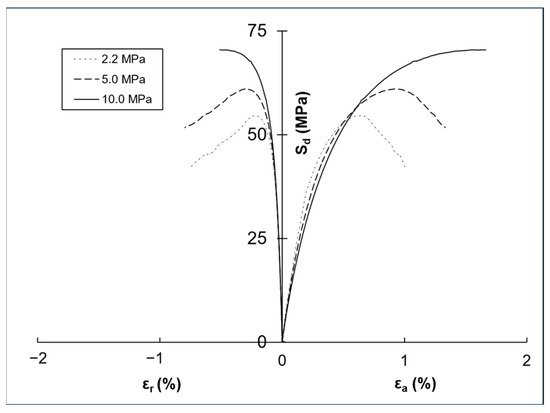
Figure 13.
Stress−strain curves obtained from triaxial tests.
The deviatoric stress (Sd) increased as the confining stress increased, with maximum values of 70.41 MPa (at εa = 1.55% and εr = 0.45%) for A-1, 60.98 MPa (at εa = 0.92% and εr = 0.29%) for A-2 and 54.52 MPa (at εa = 0.64% and εr = 0.23%) for A-3. The small reduction in the rock’s rigidity with the increase in confining stress, reflected by the reduction in the slope of the elastic section of the curves and consequently in the Es values, can be explained by the loss of cementation/union of the internal particles of the samples, caused by the increase in confinement. Both A-2 (σ3 = 5.0 MPa) and A-3 (σ3 = 2.20 MPa) showed a curve with a well-defined peak behavior, with an abrupt drop in strength after Sdmax, showing brittle behavior, while A-1 (σ3 = 10.0 MPa) showed an increase in deformation without a loss of strength, exhibiting ductile behavior.
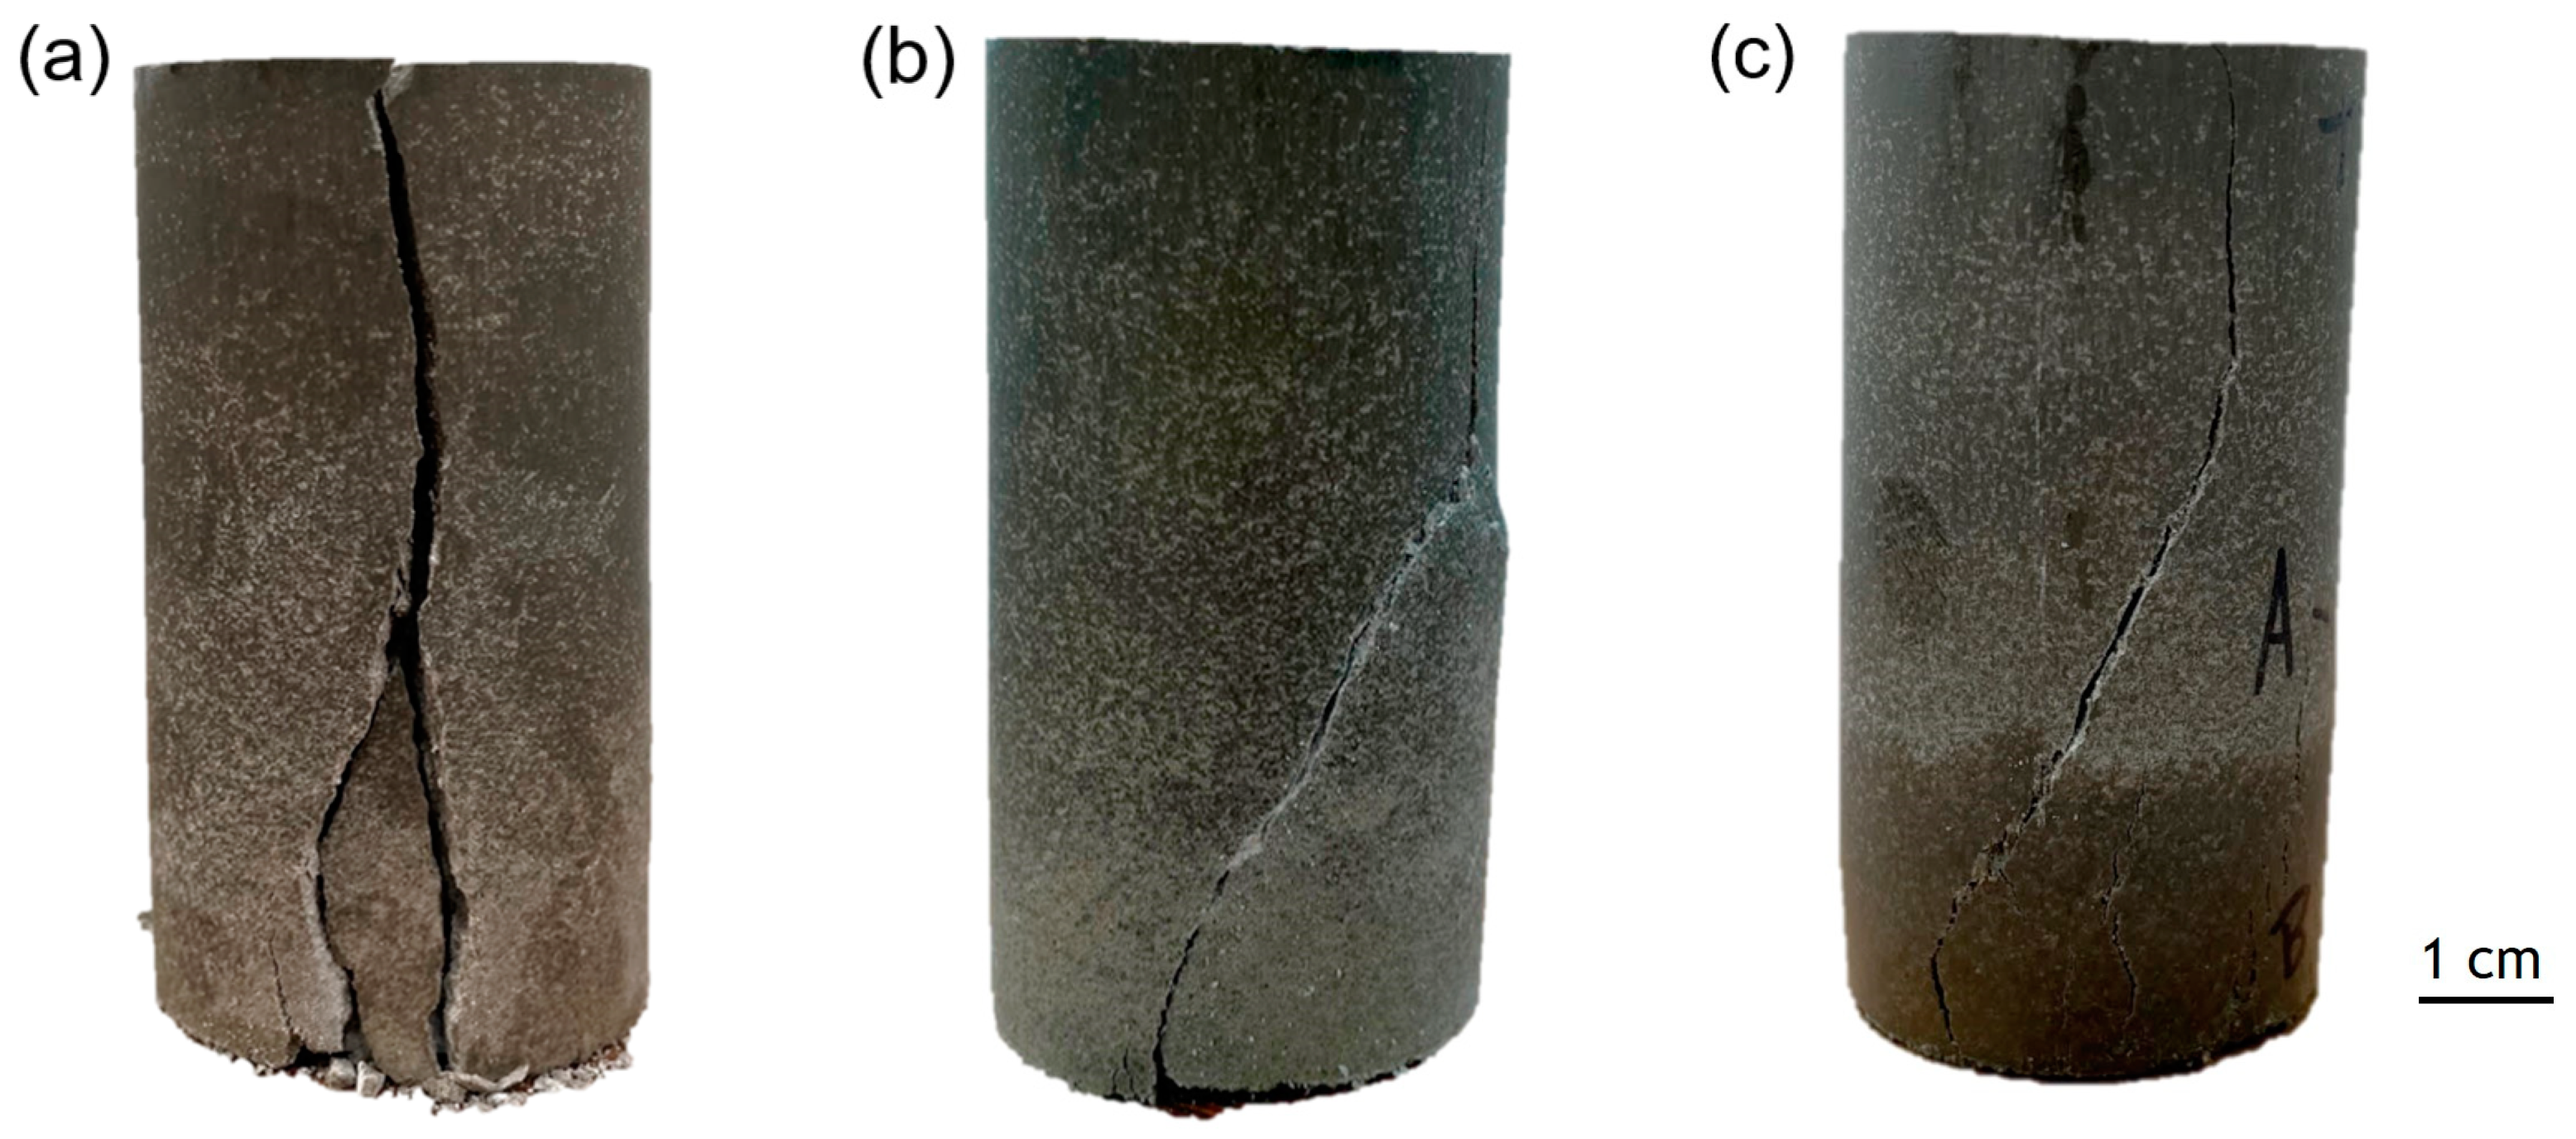
Figure 14 shows Samples A-1, A-2 and A-3 after the triaxial tests, highlighting the main rupture plane. For A-1 (Figure 14a), the main rupture plane was in the vertical direction, with an approximate angle of 90°; for A-2 (Figure 14b) and A-3 (Figure 14c), there was an approximate angle for the main rupture plane of 60°, in the diagonal direction. This change in behavior is due to the magnitude of the confining stress, imposing different rupture patterns on the synthetic carbonate rock.
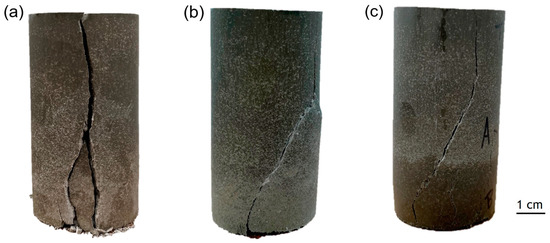
Figure 14.
Inclination of the main rupture planes observed after triaxial tests: (a) 90°; (b) 60°; and (c) 60°.
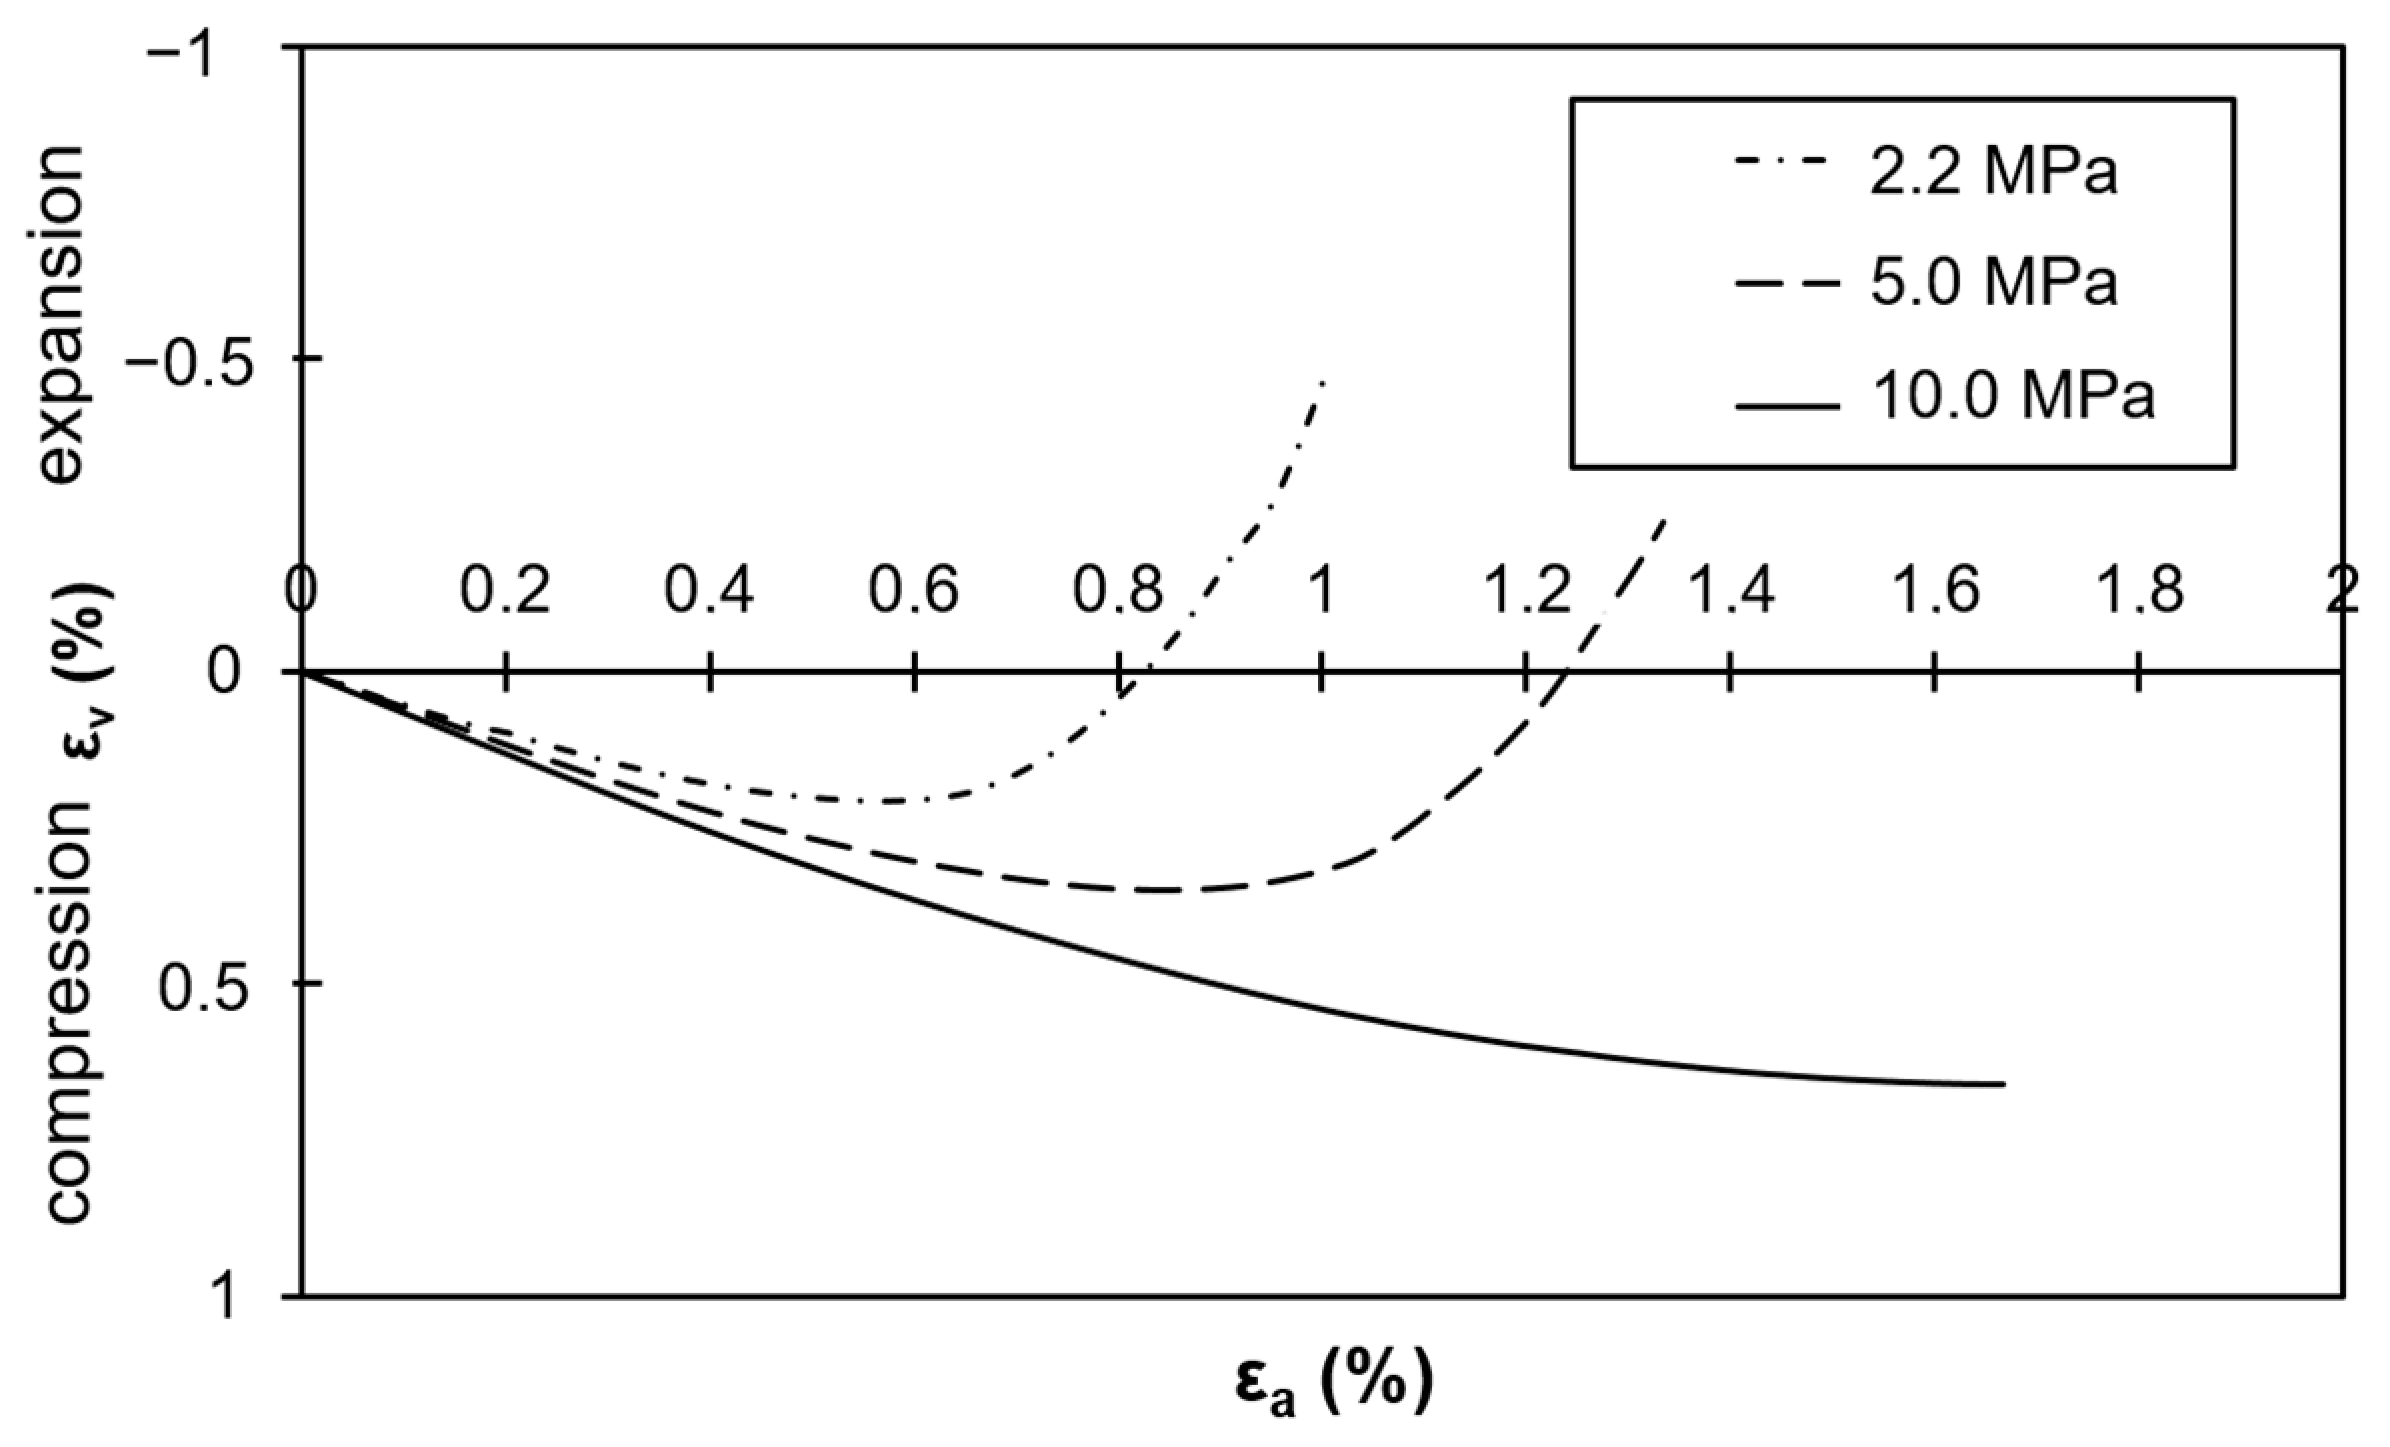
Figure 15 shows the volumetric strain as a function of the axial strain of the samples for the confining stresses adopted. A scenario of compression strain only can be observed for sample A-1, with a maximum volumetric strain of 0.65%; for A-2 and A-3, they initially show a volumetric variation in compression, with maximum values of 0.34% and 0.20%, respectively, until the maximum deviatoric stress is reached, which configures the rupture of the samples and subsequent expansion of their volume. The volumetric strain was lower for the lower value of σ3, increasing with the increase in confining stress, which is expected for porous media.
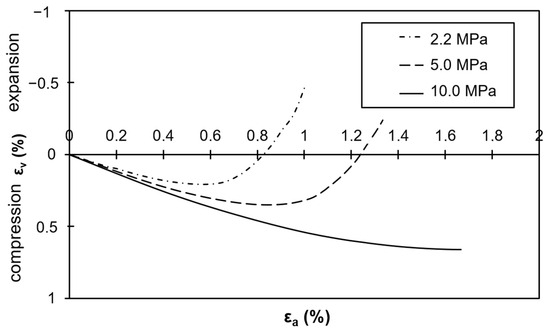
Figure 15.
Volumetric strain x axial strain curves obtained from triaxial tests.
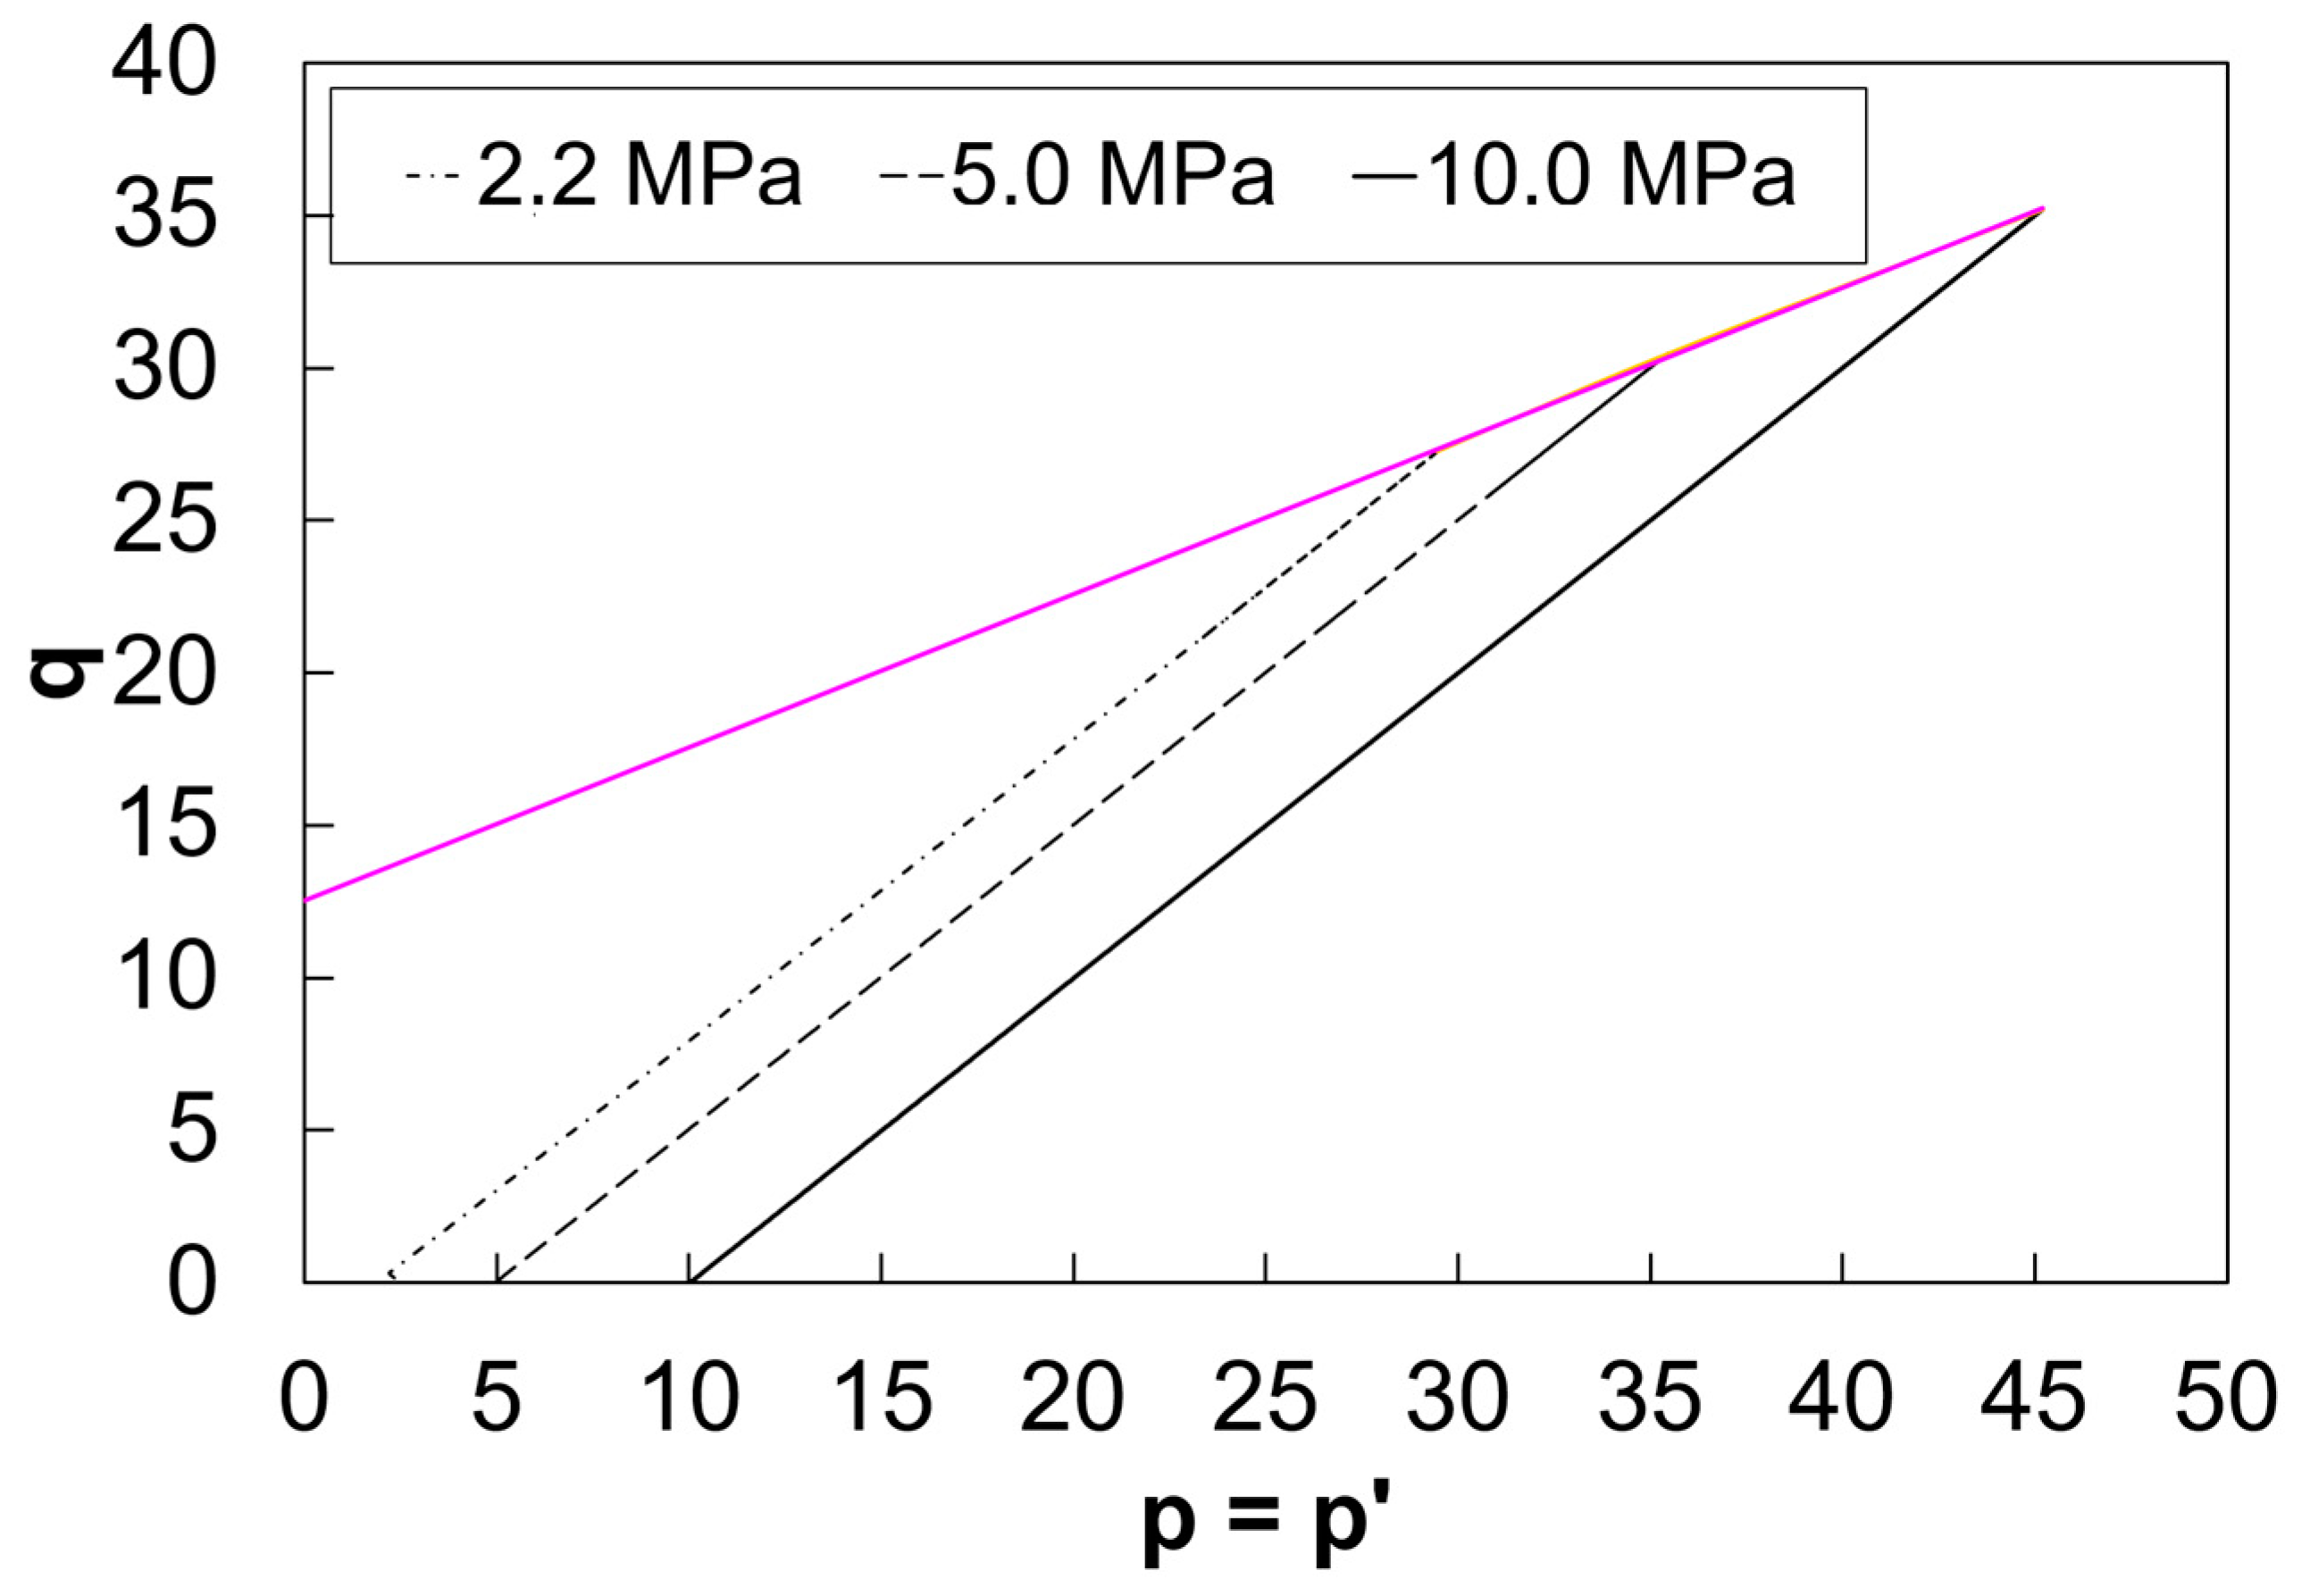
Figure 16 shows the trajectory of total and effective stresses of p = p′ = (σ1 + σ3/2) and q (σ1 − σ3/2). Both trajectories show the same behavior since, for the present case, the pore pressure is equal to zero (u = 0).
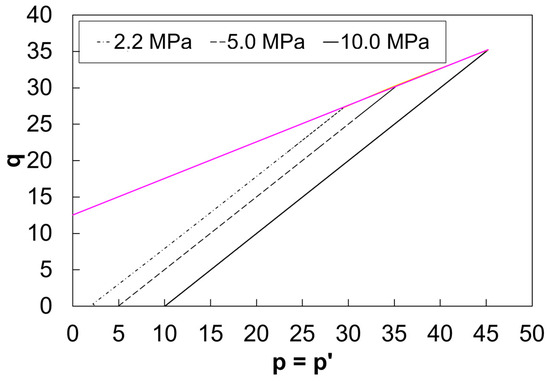
Figure 16.
Total and effective stress trajectory.
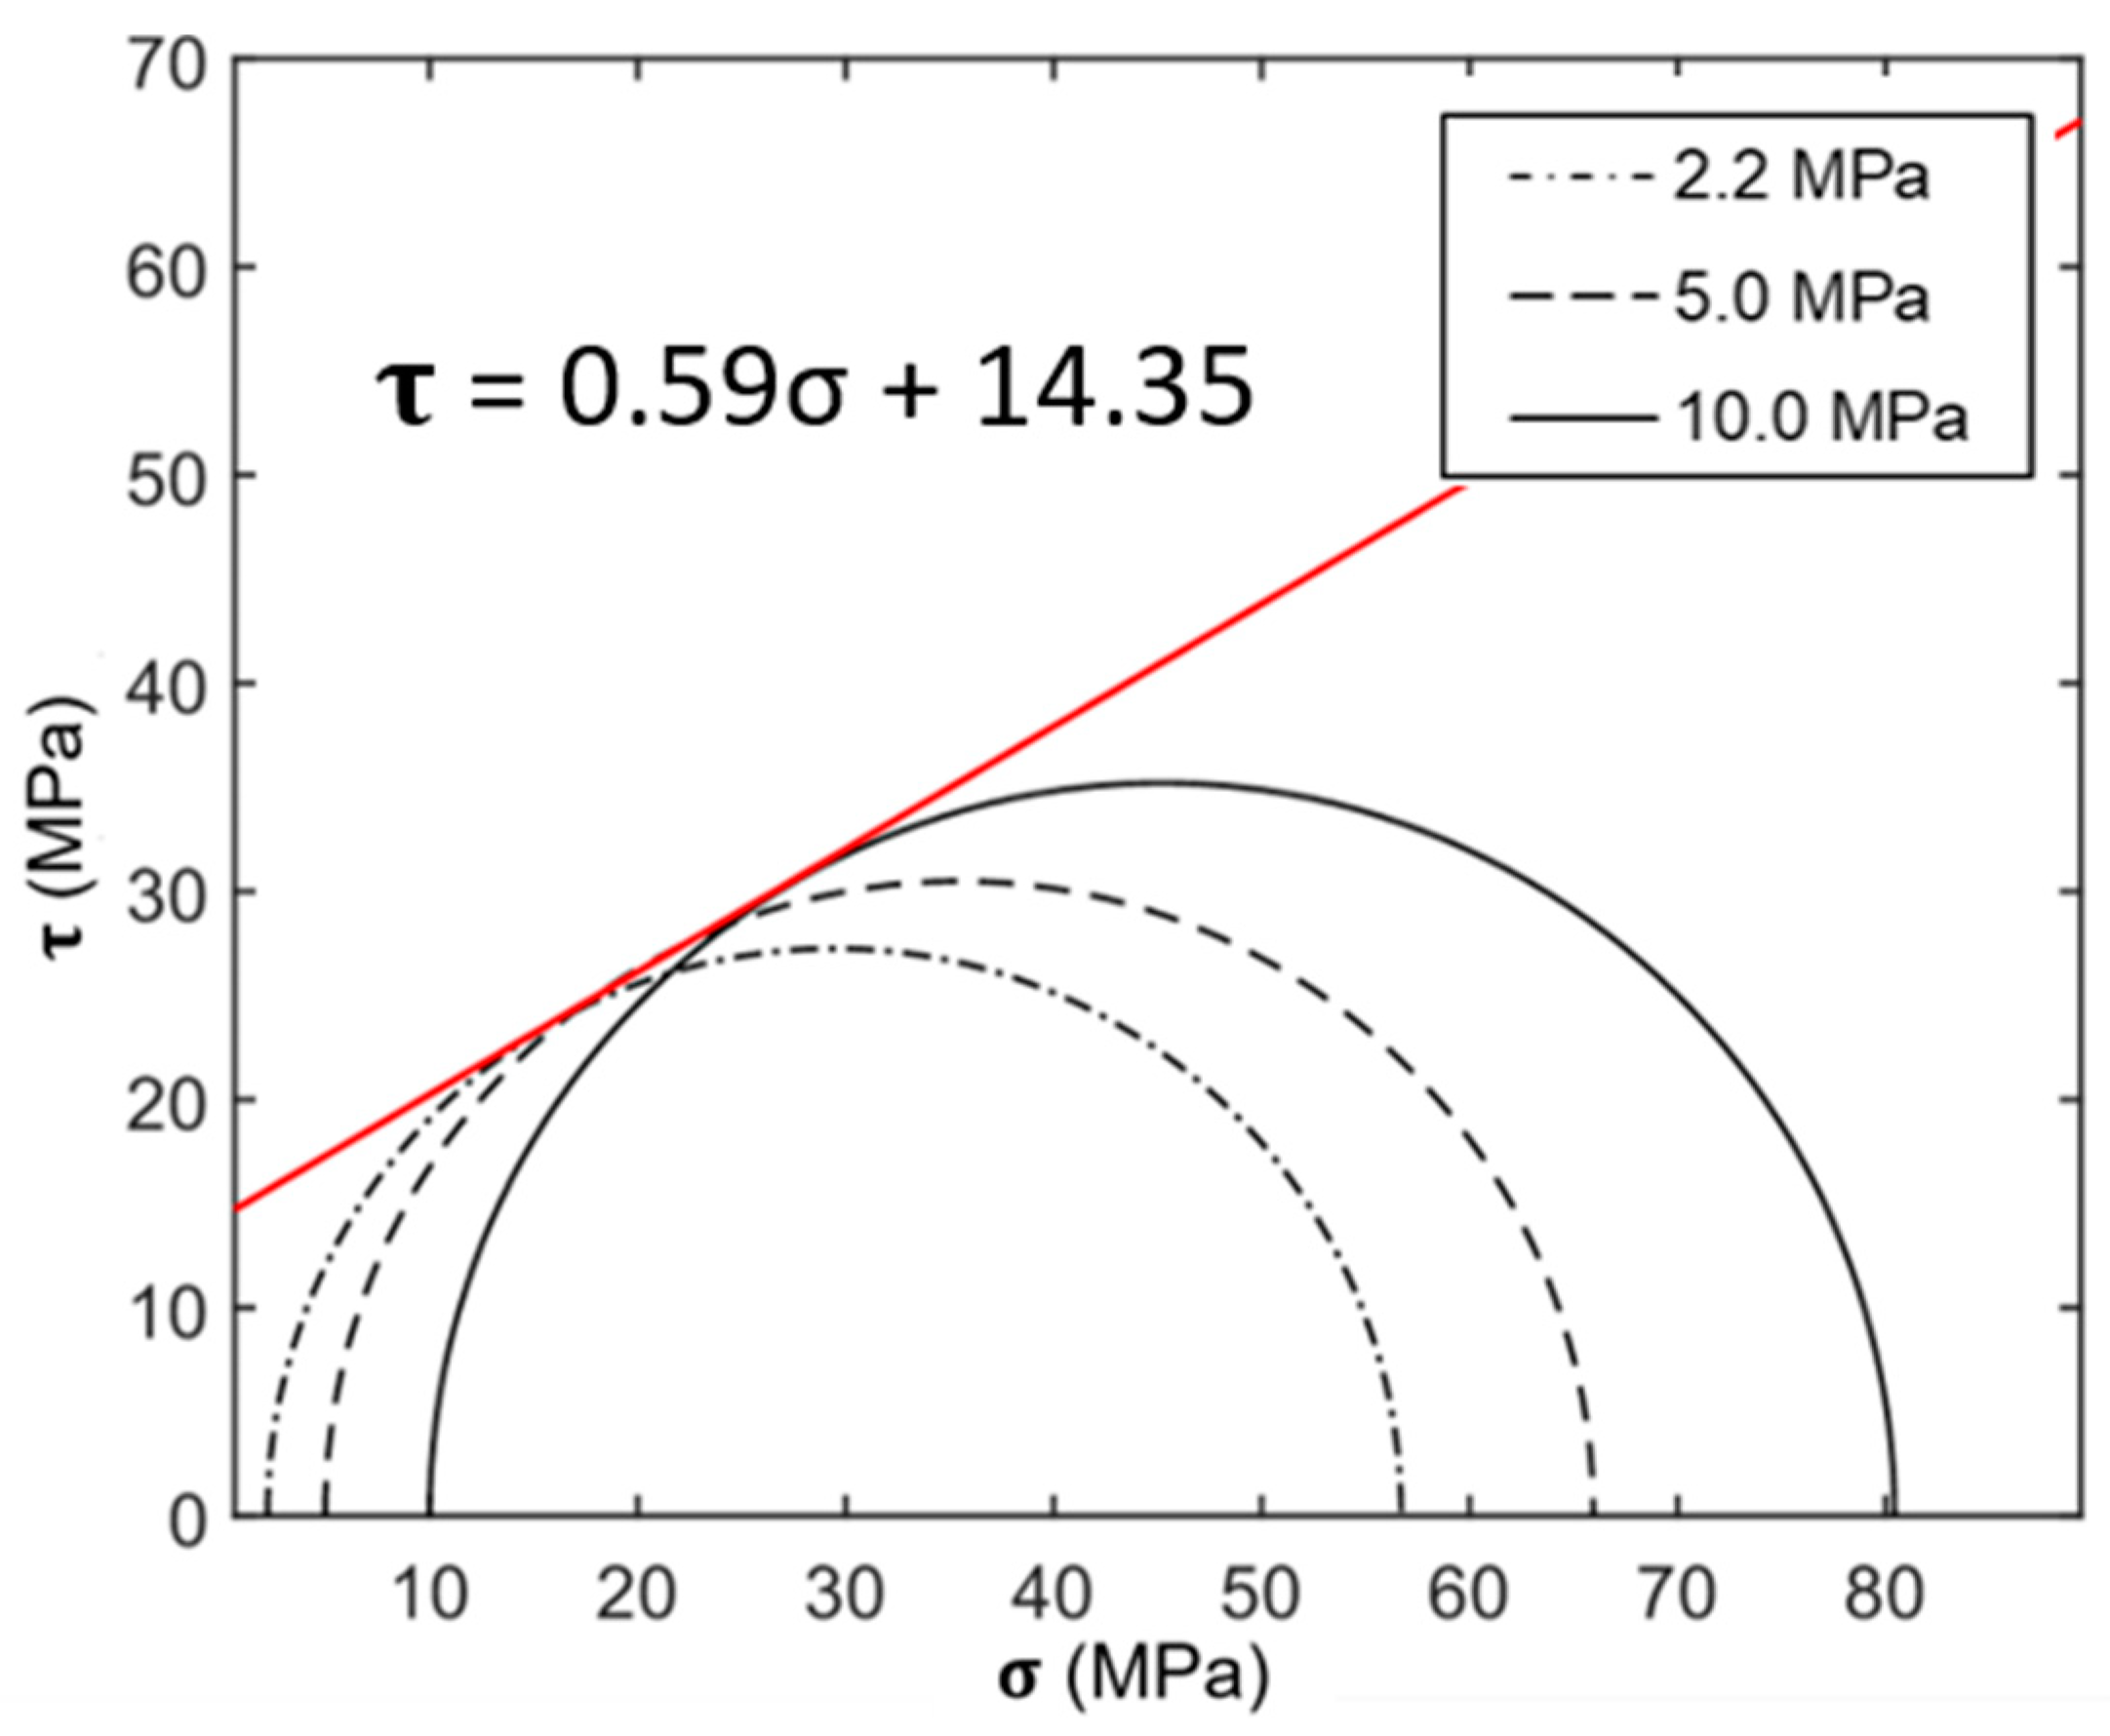
Figure 17 shows the Mohr–Coulomb strength envelope constructed from the triaxial compression tests on samples A-1, A-2 and A-3, applying confining stresses (σ3) of 10.0 MPa, 5.0 MPa and 2.2 MPa, adopting the criterion of combining normal and shear stresses in which the rock actually ruptures. By Equation (5), the cohesion (c) and friction angle (ϕ) parameters of 14.35 MPa and 30.51°, respectively, are determined for the synthetic carbonate rock, parameters governing the mechanical strength of rock.
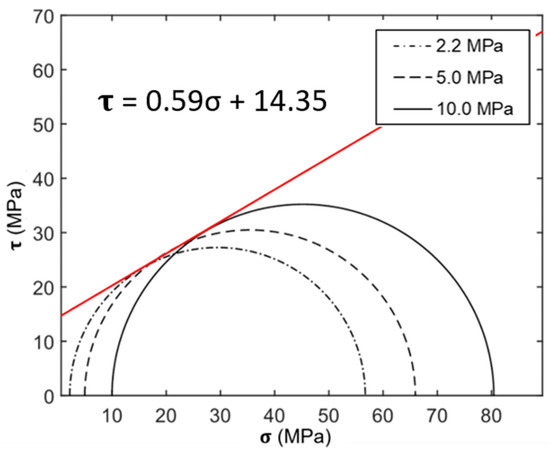
Figure 17.
Mohr–Coulomb strength envelope.
4. Discussion
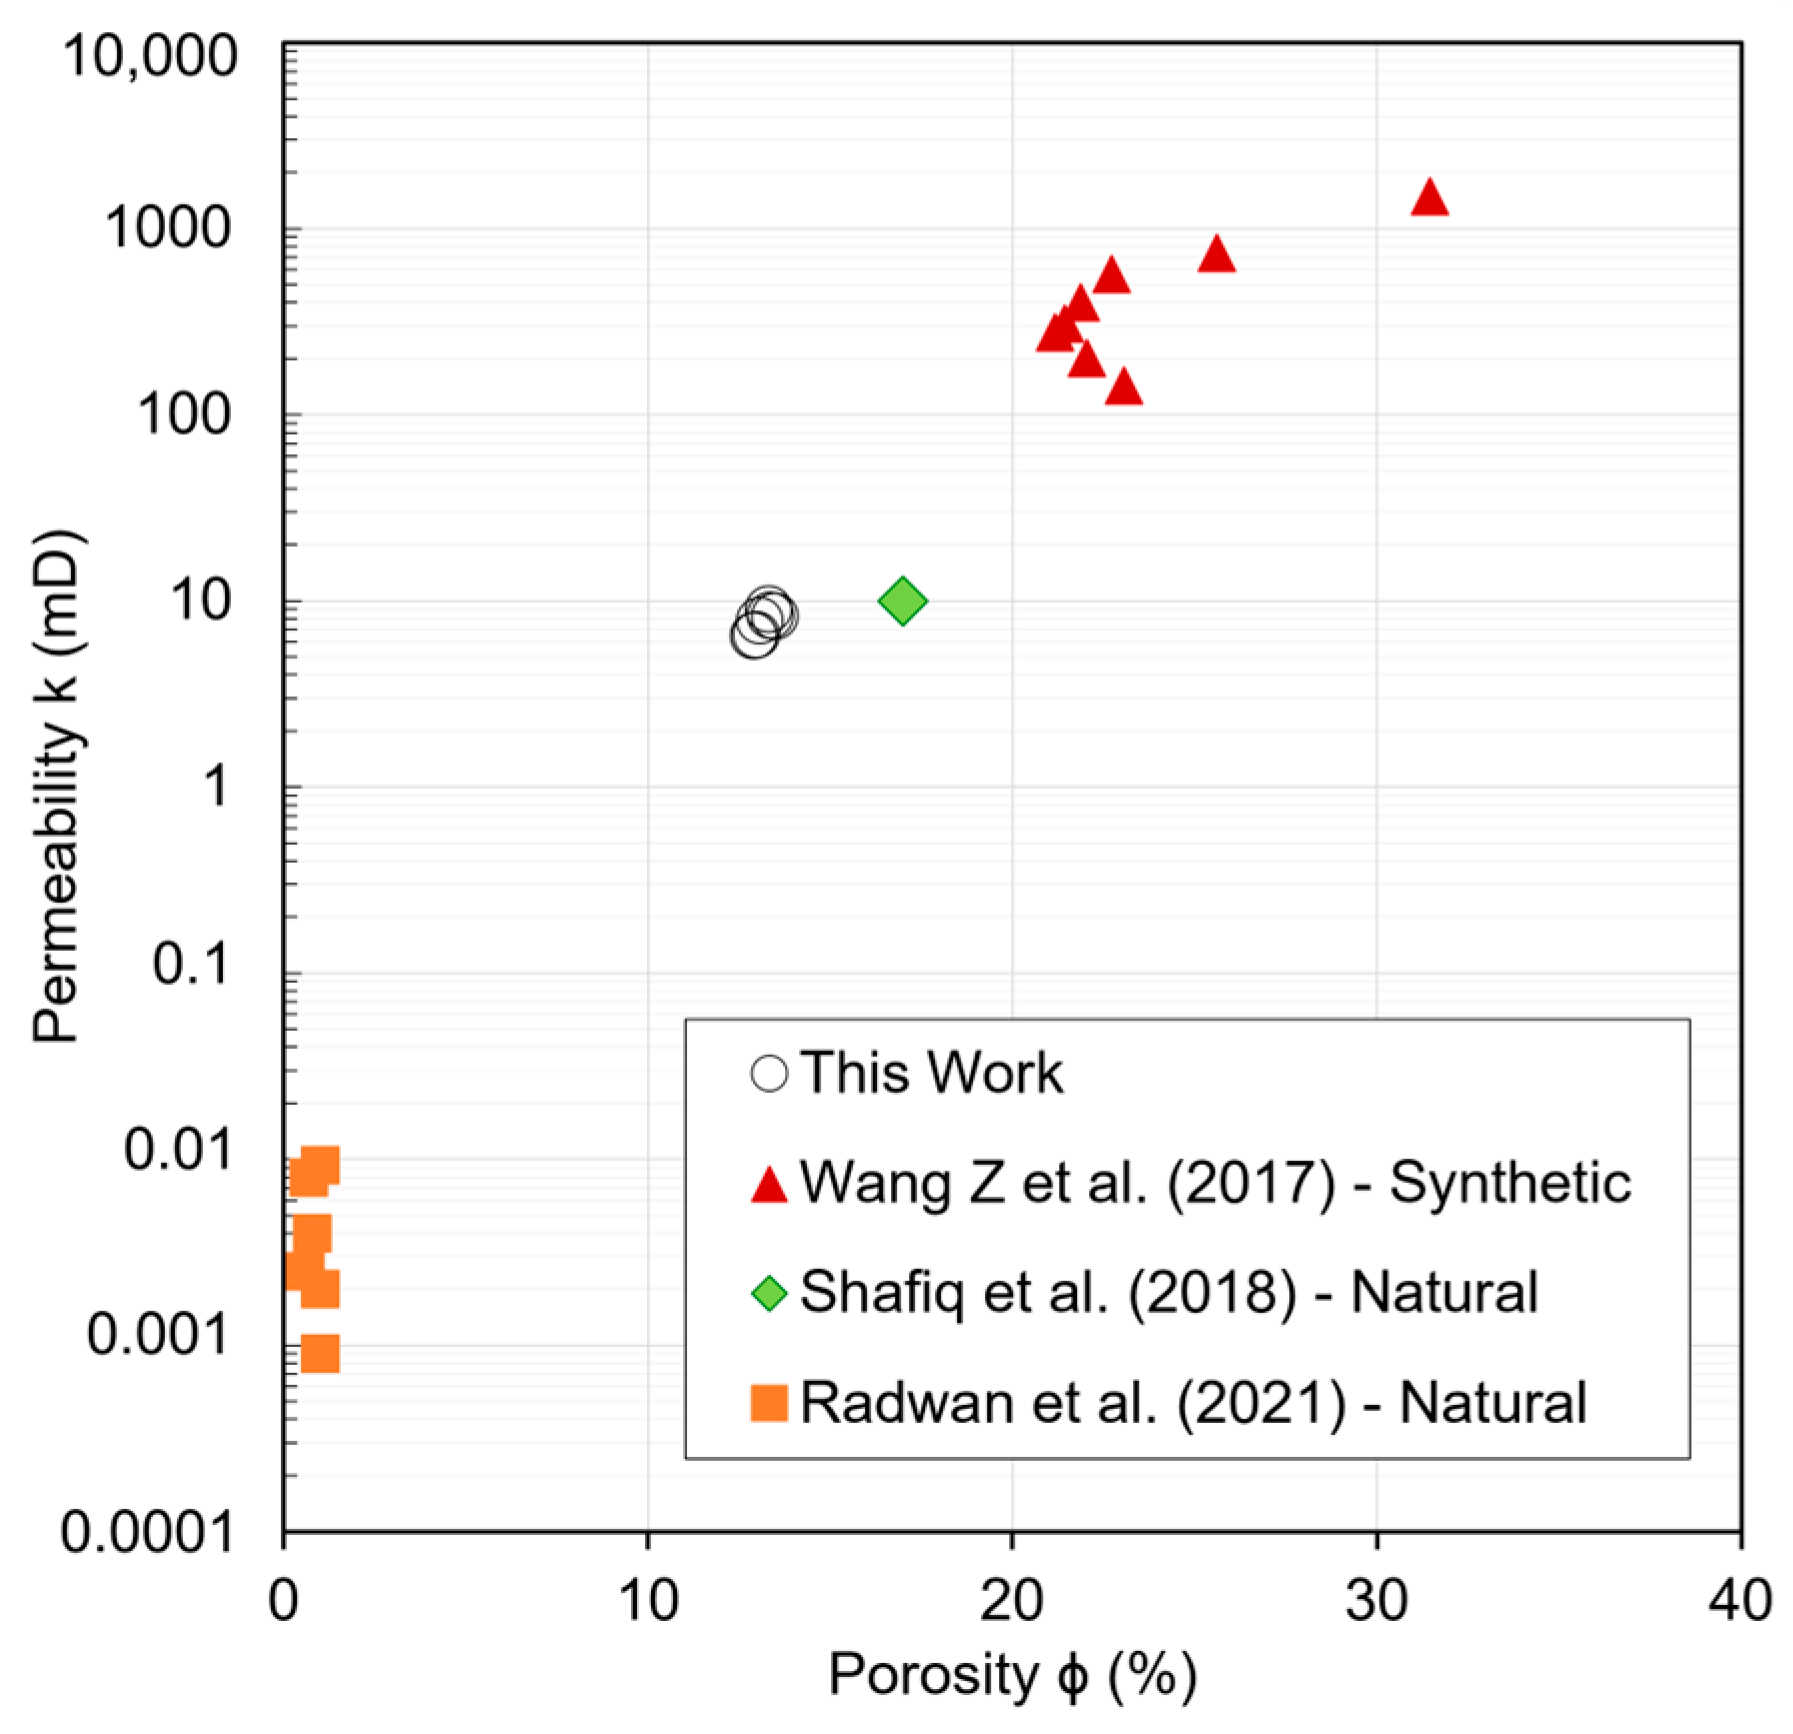
Figure 18 compares the correlation between porosity and permeability of natural and carbonate rocks [15,40,41] with the values obtained in this work, indicating an increase in permeability with increasing porosity; however, permeability not only depends on the pore volume of the rock matrix, but also on the interconnectivity existing between the pores, fractures and discontinuities within the system [4].
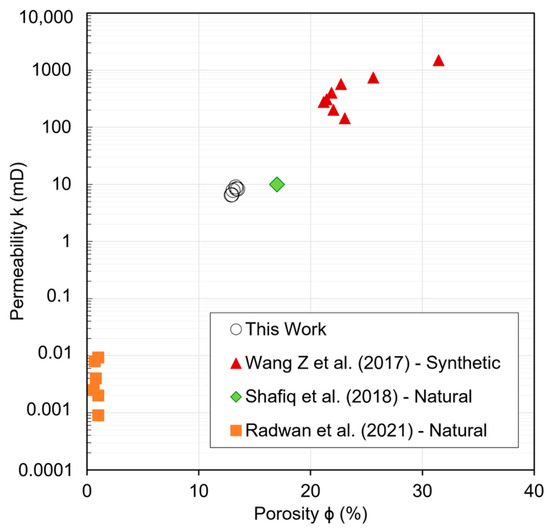
Figure 18.
Comparison between permeability and porosity relationship of samples produced in this work and data from Wang Z et al. [15], Radwan et al. [40] and Shafiq et al. [41].
Note that, for the samples presented by Wang Z et al. [15], there is a tendency for permeability to increase with increasing porosity. However, for the samples presented by Radwan et al. [40], there is a variation in permeability values, even with the maintenance of porosity, whose behavior may depend on the conditions (pore interconnectivity and discontinuities), and not just on the porous volume of the rock matrix.
Shafiq et al. [41] shows permeability and porosity close to that of the samples produced in this work. Therefore, more detailed analyses of permeability relating to pore-scale information, such as pore size distribution (PSD) and pore geometry [42] are necessary to detail this correlation better. We emphasize the importance of analyzing the permeability in synthetic rocks since, for natural hydrocarbon reservoirs, this property is of great relevance when considering the existence of an economically viable reservoir to be developed [26].
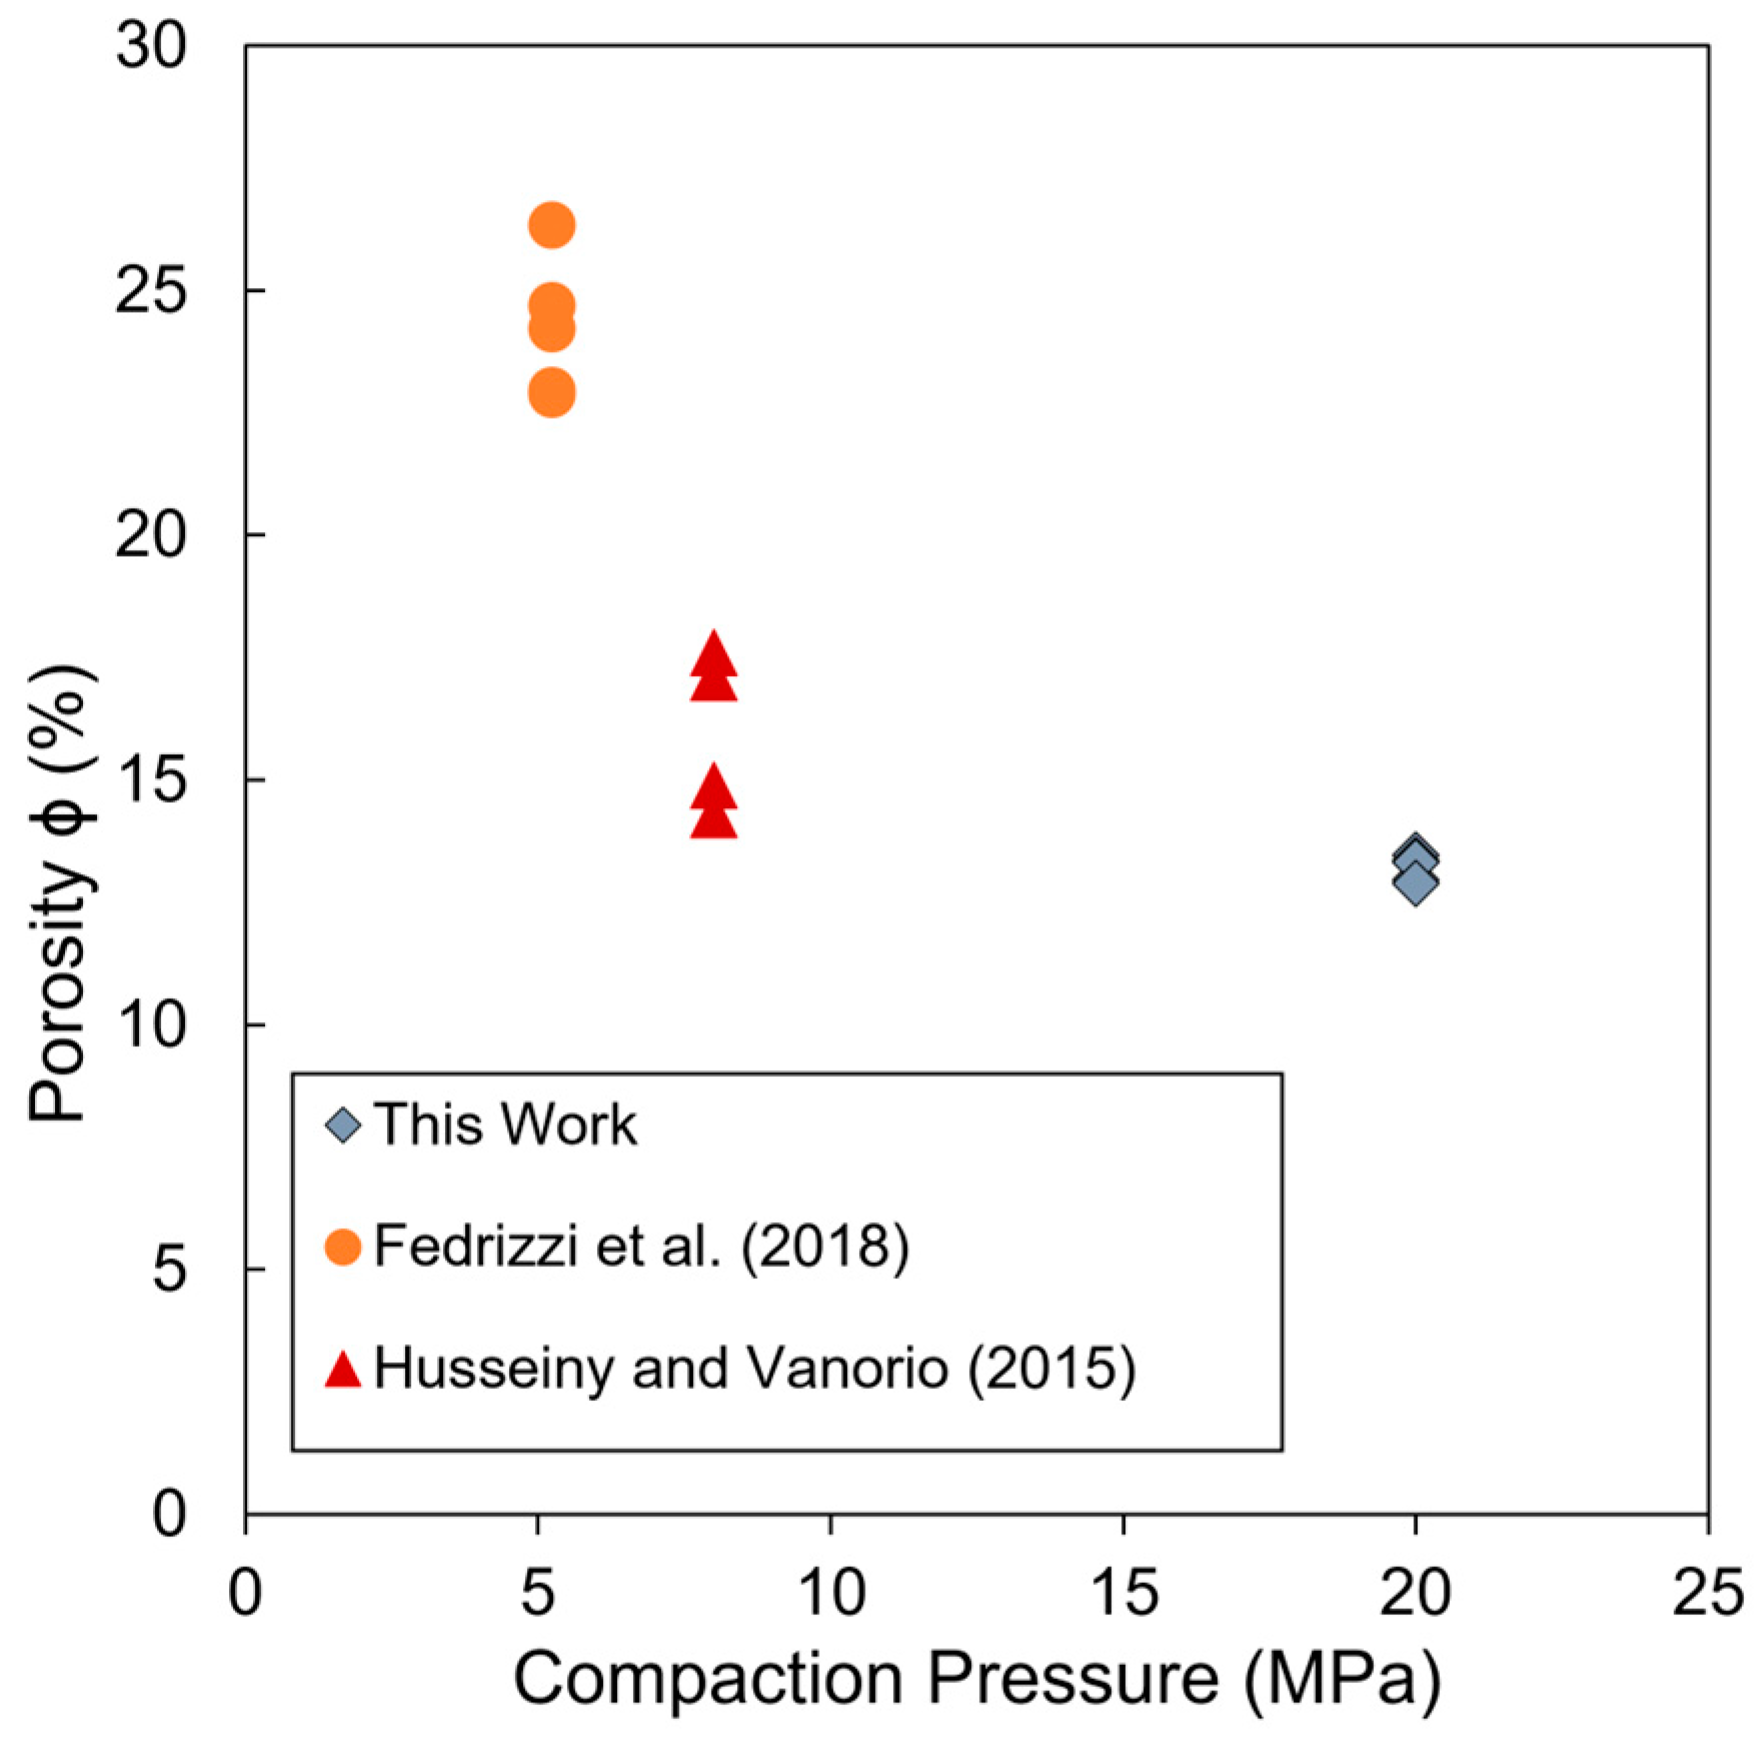
Figure 19 shows the relationship between porosity and the compaction pressure used to prepare the synthetic samples, comparing the results with data reported in the literature [12,13] for synthetic rocks that used the compaction process for their consolidation. Note that porosity is inversely proportional to the compaction pressure employed to consolidate the rock matrix so that the higher the energy, the more the occluded air present inside the solid matrix is eliminated, leaving a portion of pores that represent the intergranular porosity, characteristic of carbonate reservoirs.
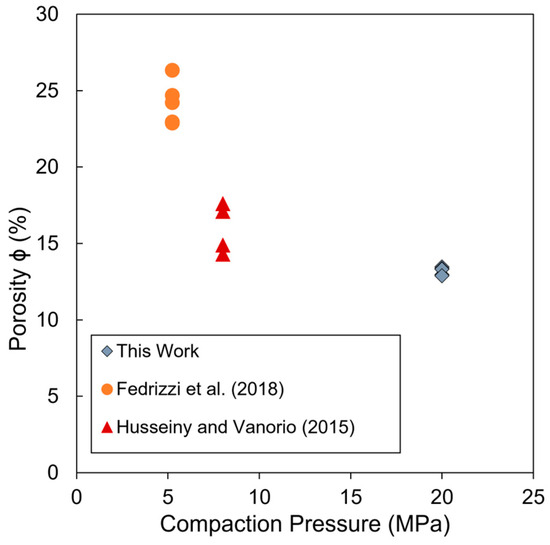
Figure 19.
Comparison between porosity and compaction pressure relationship in this work with the literature (data from Fedrizzi et al. [12] and Husseiny and Vanorio [13]).
In the synthesis of rock samples, the distribution and size of the grains of the material, the type of binder used, the proportion between grains and binder and the time of application of the compaction pressure affect the distribution and quantity of pores, also influencing the permeability. Therefore, knowing the material used, the components and the preparation of the synthetic rock are essential to assess what type of rock it will be when it is finished for analysis in laboratory tests.
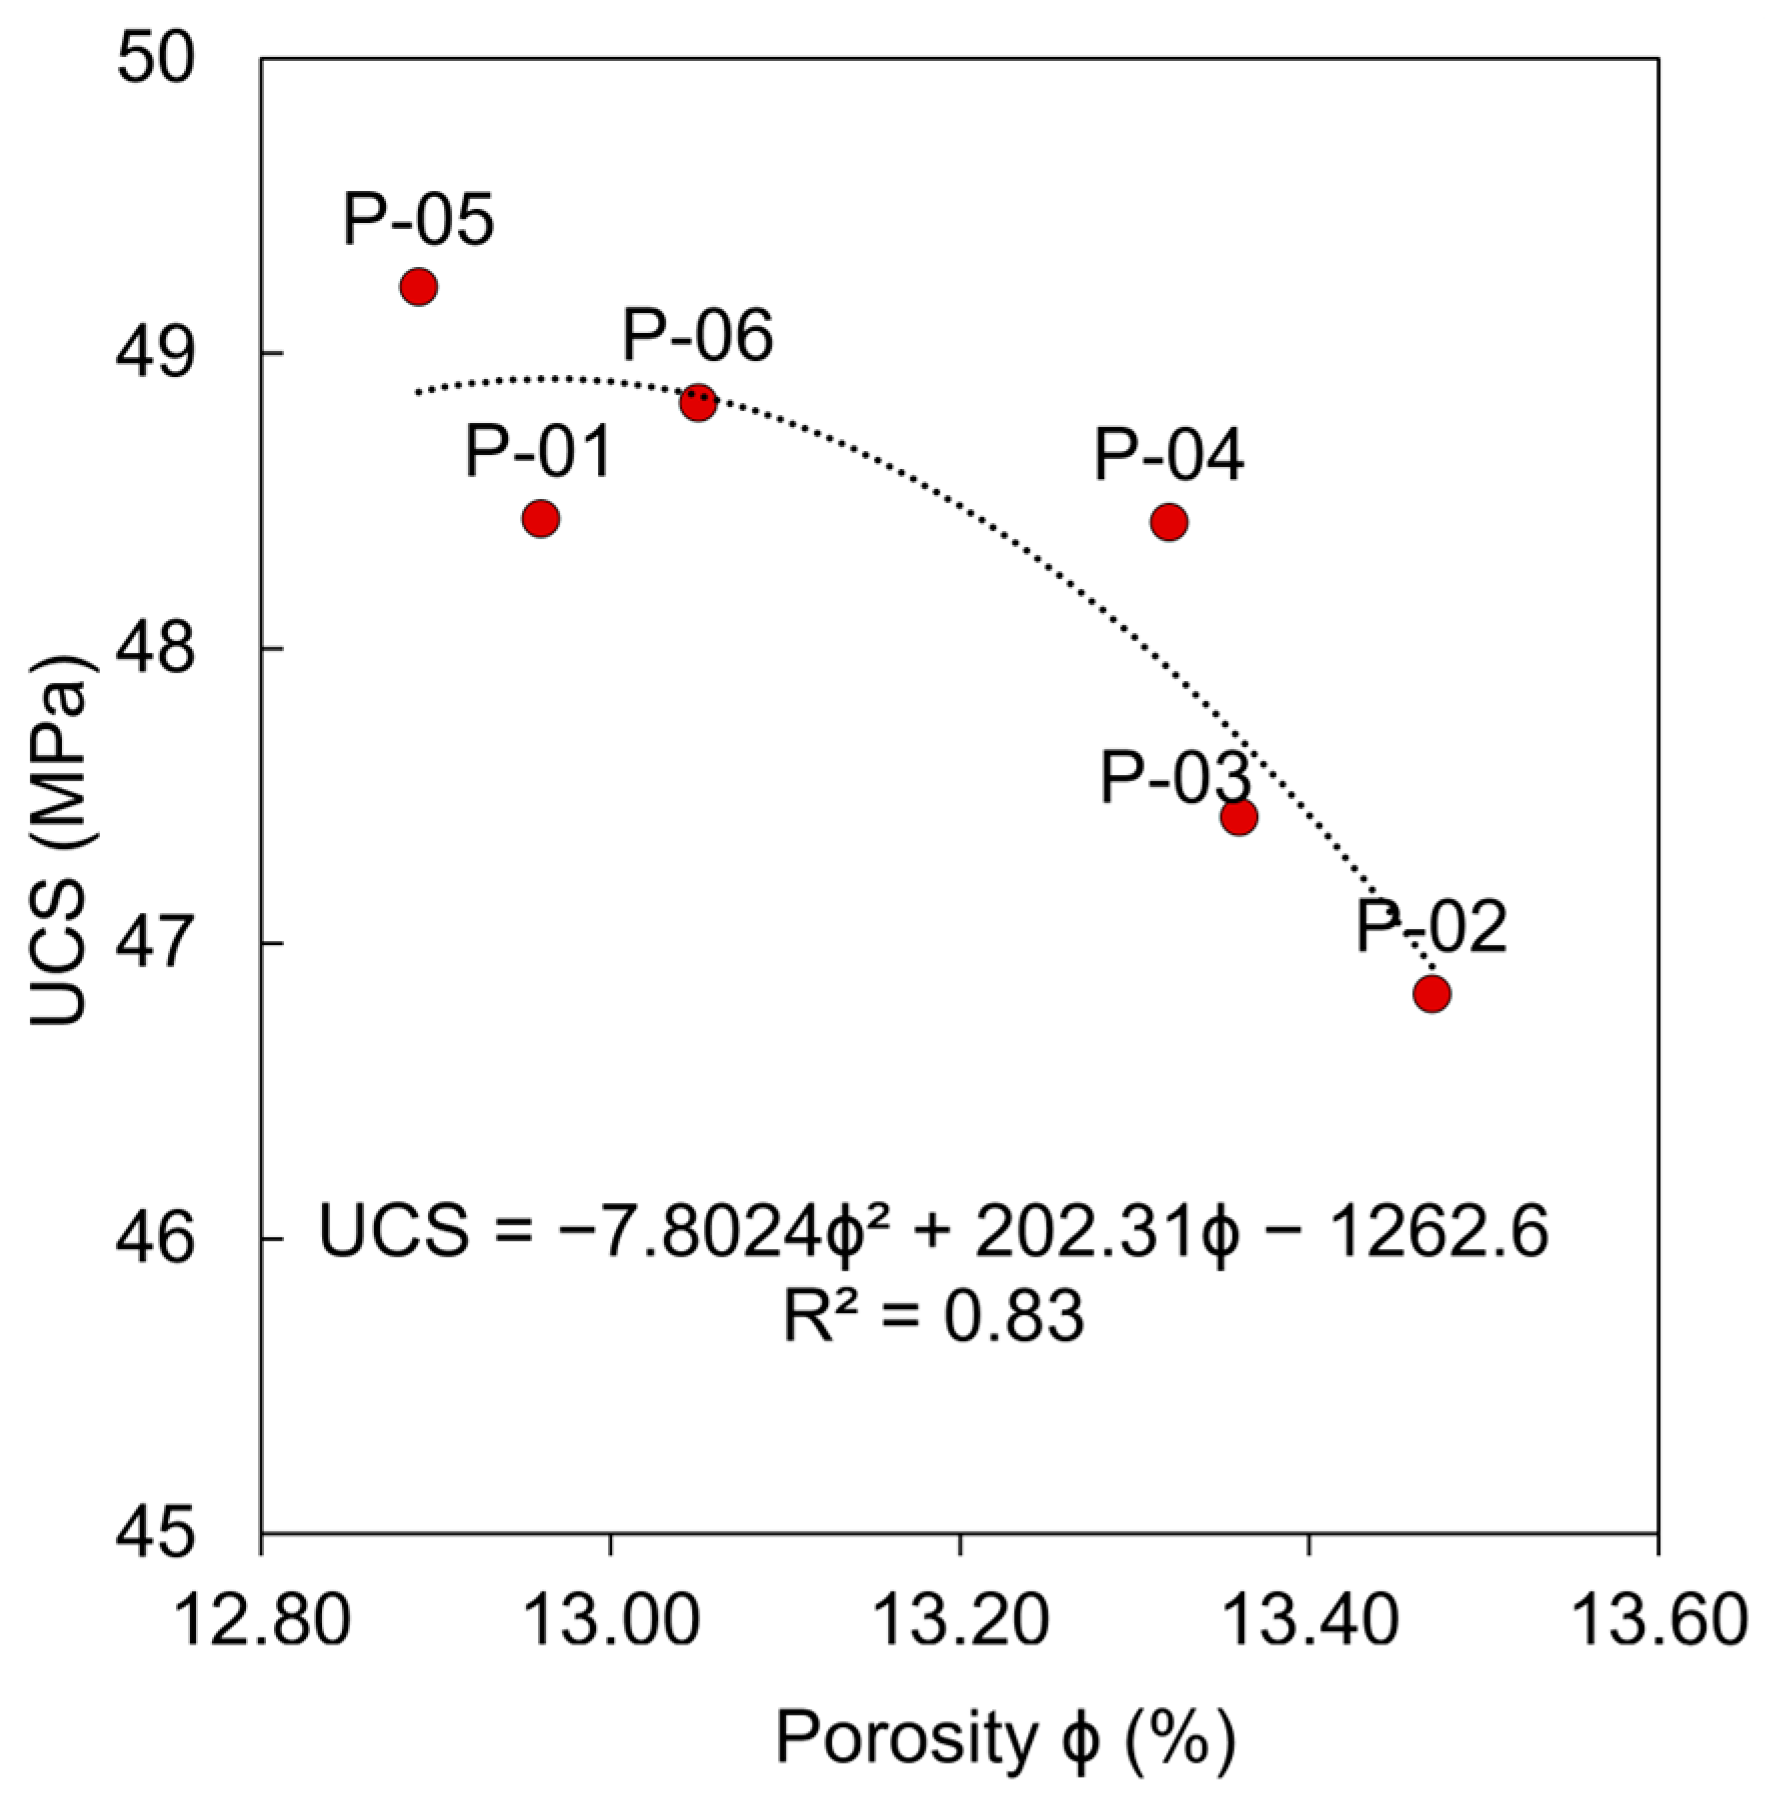
A polynomial correlation was established between the porosity and UCS values of the samples tested (Figure 20), showing a squared regression coefficient (R2) of 0.83. It can be seen that with increasing porosity, rock strength decreases, showing that porosity greatly influences the mechanical strength of the rocks produced, being a property inversely proportional to the UCS [43,44]. Fractures, discontinuities and vugs within the rock structure affect its integrity [45]. The authors of [46,47] also reported the effect of porosity on UCS in synthetic rocks, showing the same behavior.
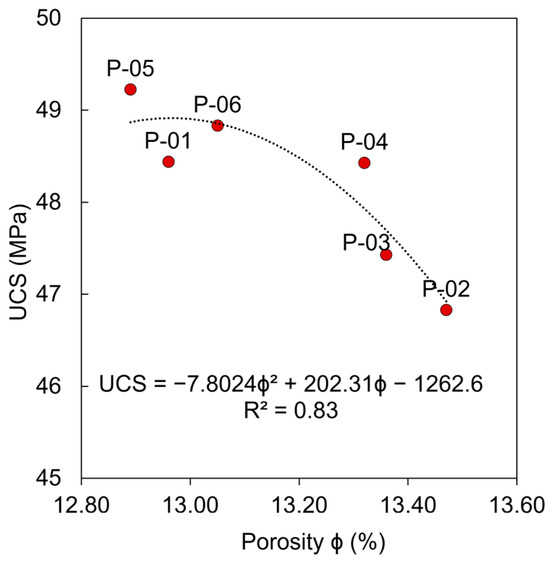
Figure 20.
UCS in terms of porosity.
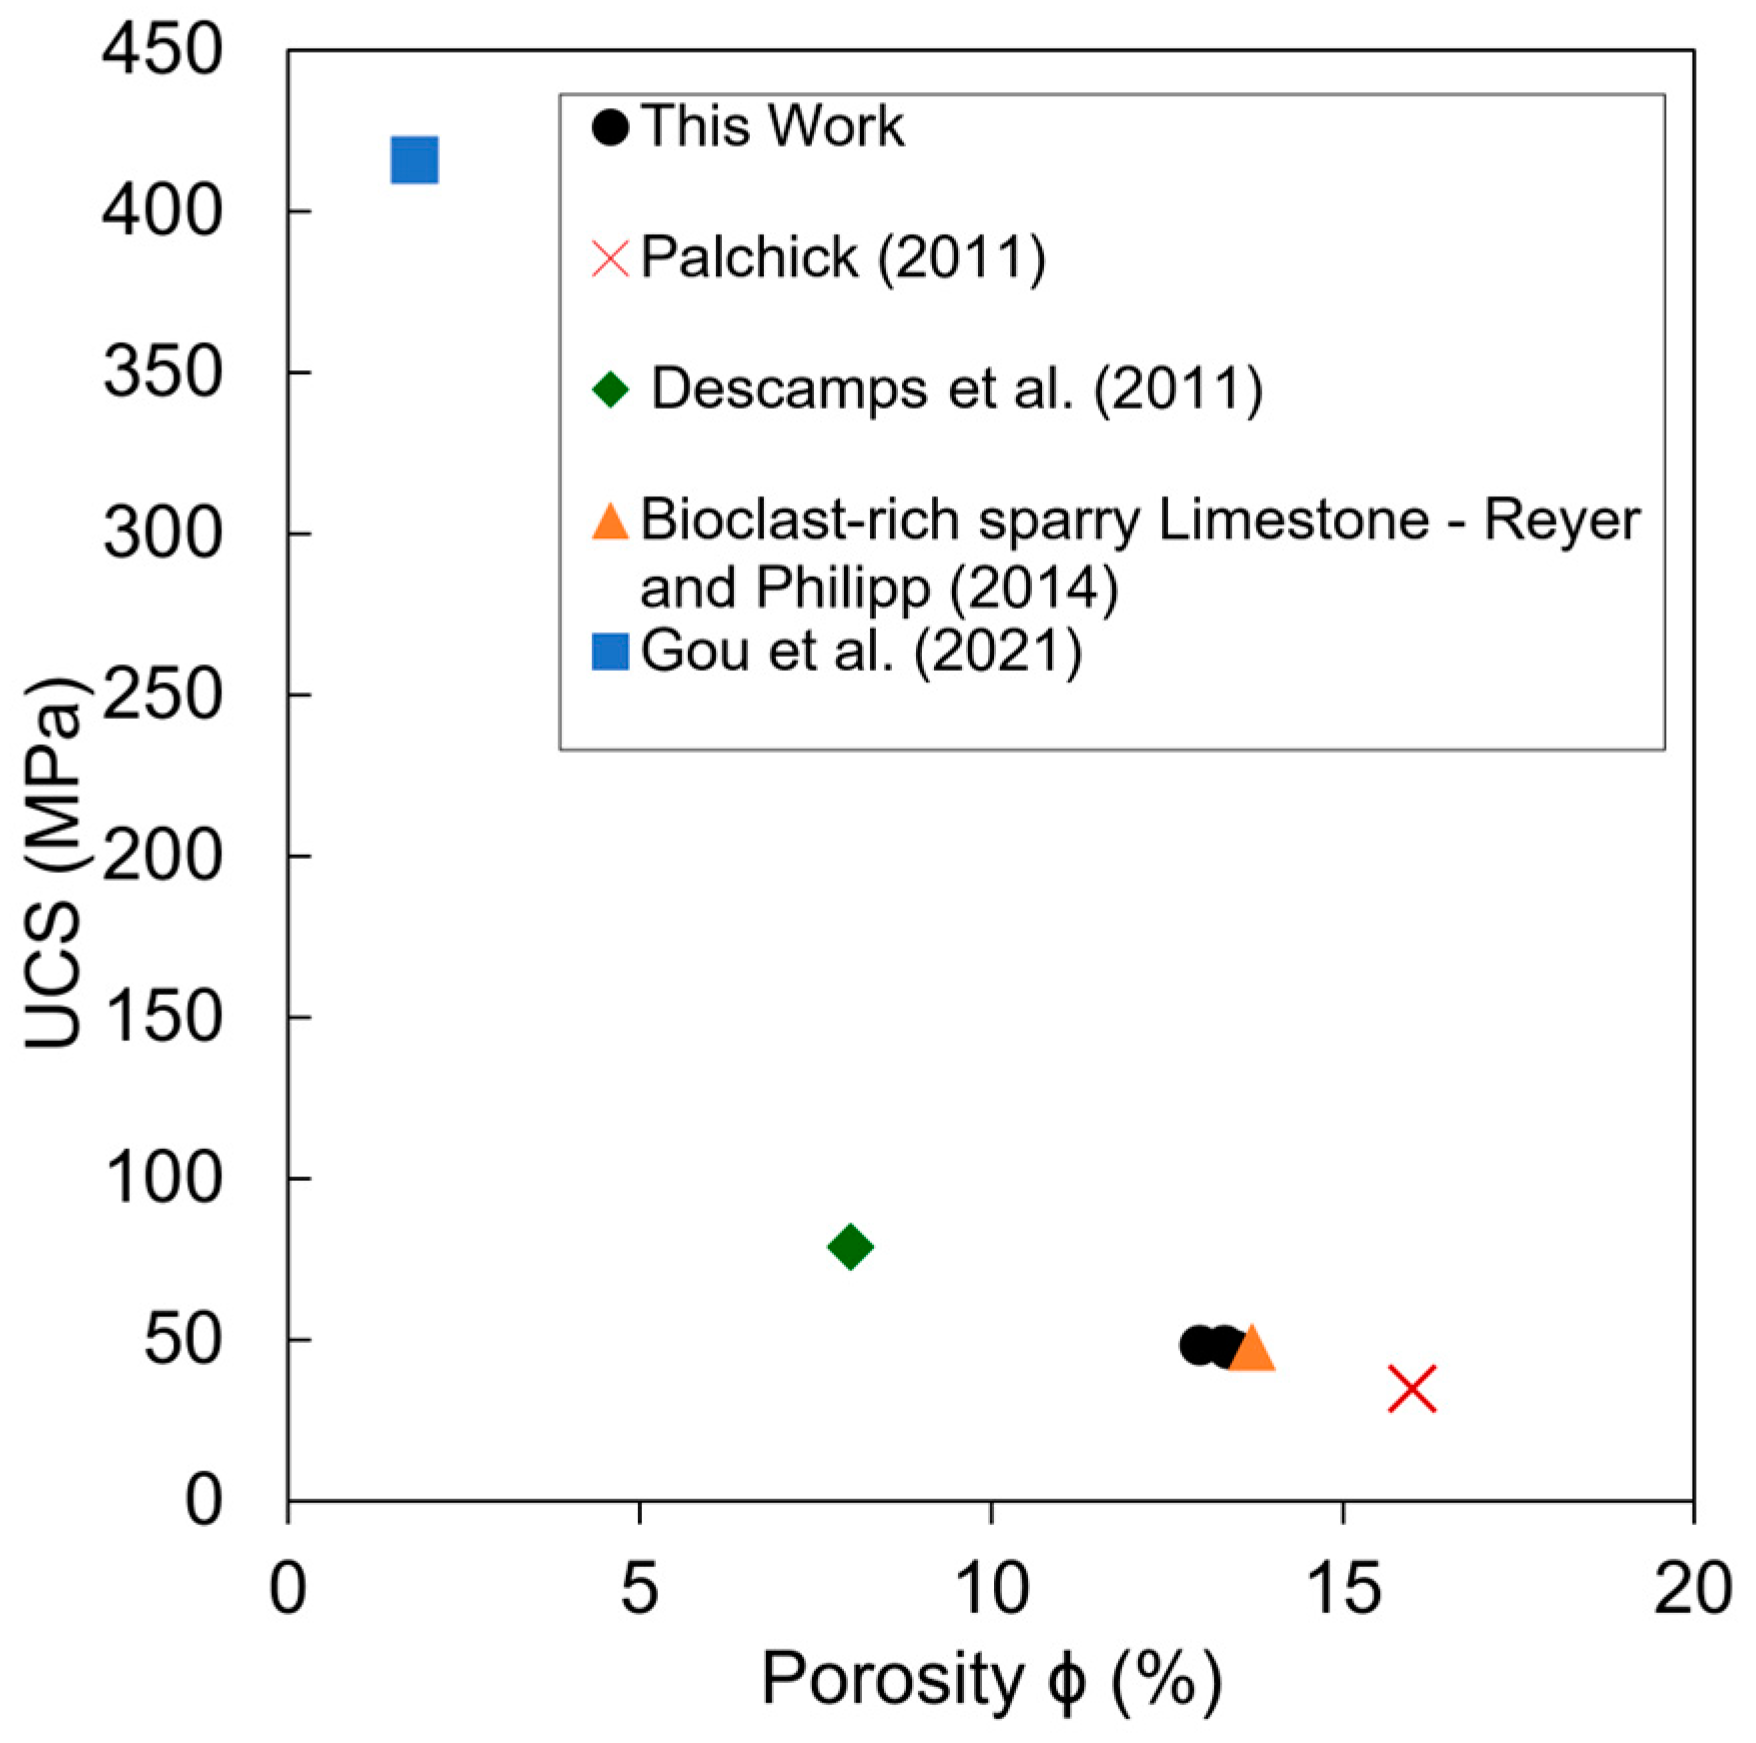
Figure 21 compares the UCS and porosity values obtained in this work with those reported by the literature for natural carbonate rocks [48,49,50,51], showing that the reproduction of the samples follows the relationship between UCS and porosity observed in carbonates.
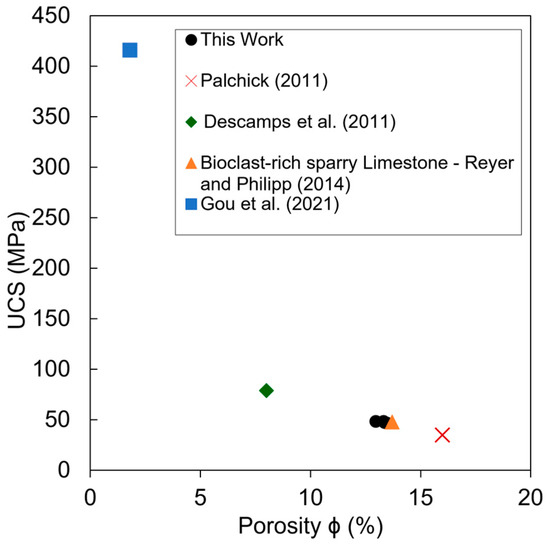
Figure 21.
Comparison between UCS and porosity relationship in this work with the literature (data from Palchick [48], Descamps et al. [49], Reyer and Philipp [50] and Gou et al. [51]).
Comparing the relationships between porosity and permeability [15,40,41] and between porosity and UCS [48,49,50,51] reported in the literature and the relationship between these properties presented by the synthetic carbonate rocks produced in this research shows that the methodology and materials used satisfactorily reproduce the characteristics and parameters observed in natural rocks, and can be applied in analyses involving rock–fluid interaction related to the exploration of hydrocarbons in oil reservoirs.
The production of the synthetic carbonate rock proposed in this research is an alternative when it is not possible to carry out studies with natural samples. The combination of methodology and materials used not only contributes to the study of oil reservoir engineering, but also has a low manufacturing cost, since it involves the reuse of mining waste that would otherwise be discarded for no purpose and the use of epoxy resin represents only 10% of the cost of the materials used to production the samples (approximately USD 0.60 per sample), much lower than the cost of sampling natural rock which requires professionals and the availability of appropriate equipment to extract plugs. The methodology makes it possible to replicate a large number of samples in the laboratory under controlled conditions that enable analysis of reservoir rocks, without the need to spend on equipment and professionals for field sampling activities.
5. Conclusions
In this research, synthetic carbonate rocks were produced by applying a methodology in which repeatability was observed, indicated by the proximity of their properties obtained through their characterization. The consolidation process, associated with the materials used to produce the rocks, reproduced the typical mineralogical and intergranular porosity of carbonate rocks, besides contributing to their mechanical strength, which was higher than the values reported by the literature for synthetic samples. Elastic behavior, Mohr–Coulomb envelope, cohesion, friction angle, tensile strength and mechanical parameters were obtained by performing destructive geomechanical tests, characterizing the samples in this respect. A direct proportion between porosity and permeability was observed, in which its permeability increases with pore volume increase in a polynomial trend. The increase in porosity is shown as a petrophysical property inversely proportional to the UCS increase, which is observed in natural carbonate rocks, whose correlation is described in this study by a polynomial trend. The synthetic rocks produced in this work, when compared to natural and synthetic carbonate rocks reported by the literature, presented similarities in their structure and geomechanical and petrophysical properties, showing that the combination of the materials and consolidation process used for sample production can represent carbonate and be applied in studies involving rock mechanics and rock–fluid interaction in petroleum reservoirs.
Author Contributions
Conceptualization, Y.R.P.d.S., I.G. and A.L.; methodology, Y.R.P.d.S., I.G. and A.L.; validation, Y.R.P.d.S., I.G., A.L., J.B., A.C.D.A. and M.R.; formal analysis, I.G., A.L., J.B., A.C.D.A. and M.R.; investigation, Y.R.P.d.S., I.G., D.D., O.C.F. and A.L.; data curation, Y.R.P.d.S., J.B., A.C.D.A. and D.D.; writing—original draft preparation, Y.R.P.d.S., I.G. and A.L.; writing—review and editing, Y.R.P.d.S., I.G., A.L., J.B., A.C.D.A. and M.R.; visualization, J.B., M.R., O.C.F. and D.D.; supervision, I.G. and A.L.; project administration, I.G. and A.L.; funding acquisition, I.G. and A.L. All authors have read and agreed to the published version of the manuscript.
Funding
This research was funded by PETROBRAS, National Council for Scientific and Technological Development-CNPq and Energi Simulation.
Data Availability Statement
The data presented in this study are available on request from the corresponding author.
Acknowledgments
The authors acknowledge the financial support of PETROBRAS, National Council for Scientific and Technological Development-CNPq and Energi Simulation.
Conflicts of Interest
The authors declare no conflicts of interest.
References
- Li, Y.; Kang, Z.; Xue, Z.; Zheng, S. Theories and practices of carbonate reservoirs development in China. Pet. Explor. Dev. 2018, 45, 669–678. [Google Scholar] [CrossRef]
- Aljuboori, F.A.; Lee, J.H.; Elraies, K.A.; Stephen, K.D. Gravity Drainage Mechanism in Naturally Fractured Carbonate Reservoirs, Review and Application. Energies 2019, 12, 3699. [Google Scholar] [CrossRef]
- Zhang, R.; Hou, B.; Zhou, B.; Liu, Y.; Xiao, Y.; Zhang, K. Effect of acid fracturing on carbonate formation in southwest China based on experimental investigations. J. Nat. Gas. Sci. Eng. 2020, 73, 103057. [Google Scholar] [CrossRef]
- Wang, W.; Yao, J.; Li, Y.; Lv, A. Research on carbonate reservoir interwell connectivity based on a modified diffusivity filter model. Open Phys. 2017, 15, 306–312. [Google Scholar] [CrossRef]
- Almetwally, A.G.; Jabbari, H. Experimental investigation of 3D printed rock samples replicas. J. Nat. Gas. Sci. Eng. 2020, 76, 103192. [Google Scholar] [CrossRef]
- Ishutov, S.; Hasiuk, F.J.; Jobe, D.; Agar, S. Using resin-based 3D printing to build geometrically accurate proxies of porous sedimentary rocks. Ground Water 2018, 56, 482–490. [Google Scholar] [CrossRef] [PubMed]
- Kong, L.; Ostadhassan, M.; Liu, B.; Li, C.; Liu, K. Multifractal characteristics of MIP-based pore size distribution of 3D-printed powder-based rocks: A study of post-processing effect. Transp. Porous Med. 2019, 129, 599–618. [Google Scholar] [CrossRef]
- Kargarpour, M.A. Carbonate reservoir characterization: An integrated approach. J. Pet. Explor. Prod. Technol. 2020, 10, 2655–2667. [Google Scholar] [CrossRef]
- de Castro Dantas, T.N.; de Oliveira, A.C.; de Souza, T.T.C.; dos Santos Lucas, C.R.; de Andrade Araújo, E.; Aum, P.T.P. Experimental study of the effects of acid microemulsion flooding to enhancement of oil recovery in carbonate reservoirs. J. Pet. Explor. Prod. Technol. 2020, 10, 1127–1135. [Google Scholar] [CrossRef]
- Fu, J.Y.; Yue, X.; Zhang, B. Methodology for concurrent multi-parametric physical modeling of a target natural unfractured homogeneous sandstone. Processes 2020, 8, 1448. [Google Scholar] [CrossRef]
- Gell, E.M.; Walley, S.M.; Braithwaite, C.H. Review of the validity of the use of artificial specimens for characterizing the mechanical properties of rocks. Rock. Mech. Rock. Eng. 2019, 52, 2949–2961. [Google Scholar] [CrossRef]
- Fedrizzi, R.M.; Ceia, M.A.R.; Misságia, R.M.; Santos, V.H.; Lima Neto, I. Artificial carbonate rocks: Synthesis and petrophysical characterization. J. Pet. Sci. Eng. 2018, 163, 303–310. [Google Scholar] [CrossRef]
- Husseiny, A.E.; Vanorio, T. The effect of micrite content on the acoustic velocity of carbonate rocks. Geophysics 2015, 80, L45–L55. [Google Scholar] [CrossRef]
- Wang, Z.; Wang, R.; Wang, F.; Qiu, H.; Li, T. Experiment study of pore structure effects on velocities in synthetic carbonate rocks. Geophysics 2015, 80, D207–D219. [Google Scholar] [CrossRef]
- Wang, Z.; Wang, R.; Li, T.; Zhao, M. The combined effects of pore structure and pore fluid on the acoustic properties of cracked and vuggy synthetic rocks. J. Pet. Sci. Eng. 2017, 156, 202–211. [Google Scholar] [CrossRef]
- Florez, J.J.A.; Michelon, M.; Ulsen, C.; Ferrari, J.V. Influence of base material particle features on petrophysical properties of synthetic carbonate plugs. Heliyon 2023, 9, e18219. [Google Scholar] [CrossRef] [PubMed]
- Santos, L.K.; Figueiredo, J.J.S.; Macedo, D.L.; Melo, A.L.; Silva, C.B. A new way to construct synthetic porous fractured medium. J. Pet. Sci. Eng. 2017, 156, 763–768. [Google Scholar] [CrossRef]
- Ding, P.; Di, B.; Wang, D.; Wei, J.; Li, X. Measurements of Seismic Anisotropy in Synthetic Rocks with Controlled Crack Geometry and Different Crack Densities. Pure Appl. Geophys. 2017, 174, 1907–1922. [Google Scholar] [CrossRef]
- Yu, H.; Gong, L.; Qu, Z.; Hao, P.; Liu, J.; Fu, L. Wettability enhancement of hydrophobic artificial sandstones by using the pulsed microwave plasma jet. Colloid Interface Sci. Commun. 2020, 36, 100266. [Google Scholar] [CrossRef]
- Galindo, K.; Lins, C.; Guimarães, L.; Lima, A.; Silva, K.; Nova, A. Application of microtomography and petrography techniques for the characterization of porosity of synthetic carbonatic rock minerals before and after acidification processes. Sci. Rep. 2022, 12, 17026. [Google Scholar] [CrossRef]
- Albalawi, H.I.; Khan, Z.N.; Valle-Pérez, A.U.; Kahin, K.M.; Hountondji, M.; Alwazani, H.; Schmidt-Roach, S.; Bilalis, P.; Aranda, M.; Duarte, C.M.; et al. Sustainable and eco-friendly coral restoration through 3D printing and fabrication. ACS Sustain. Chem. Eng. 2021, 9, 2634–12645. [Google Scholar] [CrossRef]
- Salek, M.F.; Shinde, V.V.; Beckingham, B.S.; Beckingham, L.E. Resin based 3D printing for fabricating reactive porous media. Mater. Lett. 2022, 322, 132469. [Google Scholar] [CrossRef]
- Morais, M.M.; Camargo, I.L.; Colombo, P.; Fortulan, C.A. Additive manufacturing of calcium carbonate parts through vat-photopolymerization and sintering in carbon dioxide atmosphere. Open Ceram. 2023, 14, 100348. [Google Scholar] [CrossRef]
- Sauerwein, M.; Doubrovski, E.L. Local and recyclable materials for additive manufacturing: 3D printing with mussel shells. Mater. Today Commun. 2018, 15, 214–217. [Google Scholar] [CrossRef]
- Shaked, H.; Polishchuk, I.; Nagel, A.; Bekenstein, Y.; Pokroy, B. Long-term stabilized amorphous calcium carbonate—An ink for bio-inspired 3D printing. Mater. Today Bio 2021, 11, 100120. [Google Scholar] [CrossRef]
- Shakiba, M.; Khamehchi, E.; Fahimifar, A.; Dabir, B. An experimental investigation of the proportion of mortar components on physical and geomechanical characteristics of unconsolidated artificial reservoir sandstones. J. Pet. Sci. Eng. 2020, 189, 107022. [Google Scholar] [CrossRef]
- Suguio, K. Sedimentary Geology, 1st ed.; Blucher: São Paulo, Brazil, 2003. [Google Scholar]
- Fé, M.M.M.; Bastos, F.H.; Nascimento, M.A.L. Mining in the metropolitan region of cariri (rmcariri), Ceará: Geohistory, environment and sustainability. Geografia 2022, 47, 1–26. [Google Scholar] [CrossRef]
- Santos, R.F.V.C.; Miranda, T.S.; Barbosa, J.A.; Gomes, I.F.; Matos, G.C.; Gale, J.F.W.; Neumann, V.H.; Guimarães, L.J. Characterization of natural fracture systems: Analysis of uncertainty effects in linear scanline results. AAPG Bull. 2015, 99, 2203–2219. [Google Scholar] [CrossRef]
- Terra, G.; Spadini, A.; França, A.; Sombra, C.; Zambonato, E.; Juschaks, L.; Arienti, L.; Erthal, M.; Blauth, M.; Franco, M.; et al. Carbonate rock classification applied to brazilian sedimentary basins. Bol. Geocienc. Petrobras 2010, 18, 9–29. [Google Scholar]
- Catto, B.; Jahnert, R.J.; Warren, L.V.; Varejao, F.G.; Assine, M.L. The microbial nature of laminated limestones: Lessons from the upper aptian, Araripe Basin, Brazil. Sediment. Geol. 2016, 341, 304–315. [Google Scholar] [CrossRef]
- Miranda, T.S.; Santos, R.F.; Barbosa, J.A.; Gomes, I.F.; Alencar, M.L.; Correia, O.J.; Falcão, T.C.; Gale, J.F.W.; Neumann, V.H. Quantifying aperture, spacing and fracture intensity in a carbonate reservoir analogue: Crato Formation, NE Brazil. Mar. Pet. Geol. 2018, 97, 556–567. [Google Scholar] [CrossRef]
- Guo, Y.; Hu, J.; Zhang, X.; Feng, R.; Li, H. Flow Behavior Through Porous Media and Microdisplacement Performances of Hydrophobically Modified Partially Hydrolyzed Polyacrylamide. SPE J. 2016, 21, 688–705. [Google Scholar] [CrossRef]
- Mohammed, T.E.; Schmitt, D.R. Preliminary experiments towards understanding the influence of fractures on the anisotropy of electrical conductivity. J. Appl. Geophys. 2020, 182, 104197. [Google Scholar] [CrossRef]
- Klinkenberg, L.J. The Permeability of Porous Media to Liquids and Gases. In Drilling and Production Practice; American Petroleum Institute: New York, NY, USA, 1941; API-41-200; Available online: https://www.scirp.org/reference/referencespapers?referenceid=1419571 (accessed on 3 April 2024).
- Costa, L.F.; Antonino, A.C.D.; Heck, R.J.; Coutinho, A.P.; Pimentel, R.M.M.; Vasconcelos, T.C.; Machado, C.B. Porous space in Brazilian soils using X-ray computed tomography. Rev. Bras. Geogr. Fís. 2016, 9, 692–706. [Google Scholar] [CrossRef]
- Lucia, F.J. Rock-Fabric/Petrophysical Classification of Carbonate Pore Space for Reservoir Characterization. AAPG Bull. 1995, 79, 1275–1300. [Google Scholar] [CrossRef]
- Gomes, J.M.P.; Rios-Netto, A.M.; Borghi, L.; Carvalho, I.S.; Mendonça Filho, J.G.; Sabaraense, L.D.; Araújo, B.C. Cyclostratigraphic analysis of the early Cretaceous laminated limestones of the Araripe Basin, NE Brazil: Estimating sedimentary depositional rates. J. S. Am. Earth Sci. 2021, 112, 103563. [Google Scholar] [CrossRef]
- Brown, E.T. Rock Characterization, Testing and Monitoring: I.S.R.M. In Suggested Methods, 1st ed.; Pergamon Press: Oxford, UK, 1981. [Google Scholar]
- Radwan, A.E.; Trippetta, F.; Kassem, A.A.; Kania, M. Multi-scale characterization of unconventional tight carbonate reservoir: Insights from October oil filed, Gulf of Suez rift basin, Egypt. J. Pet. Sci. Eng. 2021, 197, 107968. [Google Scholar] [CrossRef]
- Shafiq, M.U.; Mahmud, H.K.B.; Arif, M. Mineralogy and pore topology analysis during matrix acidizing of tight sandstone and dolomite formations using chelating agentes. J. Pet. Sci. Eng. 2018, 167, 869–876. [Google Scholar] [CrossRef]
- Buiting, J.J.M.; Clerke, E.A. Permeability from porosimetry measurements: Derivation for a tortuous and fractal tubular bundle. J. Pet. Sci. Eng. 2013, 108, 267–278. [Google Scholar] [CrossRef]
- Weng, M.C.; Jeng, F.S.; Hsieh, Y.M.; Huang, T.H. A simple model for stress-induced anisotropic softening of weak sandstones. Int. J. Rock. Mech. Min. Sci. 2008, 45, 155–166. [Google Scholar] [CrossRef]
- Hsieh, Y.M.; Li, H.H.; Huang, T.H.; Jeng, F.S. Interpretations on how the macroscopic mechanical behavior of sandstone affected by microscopic properties—Revealed by bonded-particle model. Eng. Geol. 2008, 99, 1–10. [Google Scholar] [CrossRef]
- Zhang, J.J.; Bentley, L.R. Pore geometry and elastic moduli in sandstones. CREWES Res. Rep. 2003, 115, 1–20. [Google Scholar]
- Atapour, H.; Mortazavi, A. The influence of mean grain size on unconfined compressive strength of weakly consolidated reservoir sandstones. J. Pet. Sci. Eng. 2018, 171, 63–70. [Google Scholar] [CrossRef]
- Rice-Birchall, E.; Faulkner, D.R.; Bedford, J.D. The manufacture, mechanical properties, and microstructural analysis of synthetic quartz-cemented sandstones. Int. J. Rock. Mech. Min. Sci. 2021, 146, 104869. [Google Scholar] [CrossRef]
- Palchick, V. On the Ratios between Elastic Modulus and Uniaxial Compressive Strength of Heterogeneous Carbonate Rocks. Rock. Mech. Rock. Eng. 2011, 44, 121–128. [Google Scholar] [CrossRef]
- Descamps, F.; Tshibangu, J.P.; Silva, M.R.; Verbrugge, J.C. Behavior of carbonated rocks under true triaxial compression. In Harmonising Rock Engineering and the Environment, 1st ed.; Qian, Q., Zhou, Y., Eds.; CRC Press: Boca Raton, FL, USA, 2011; pp. 597–602. [Google Scholar] [CrossRef]
- Reyer, D.; Philipp, S.L. Empirical relations of rock properties of outcrop and core samples from the Northwest German Basin for geothermal drilling. Geotherm. Energy Sci. 2014, 2, 21–37. [Google Scholar] [CrossRef]
- Gou, B.; Zhan, L.; Guo, J.; Zhang, R.; Zhou, C.; Wu, L.; Ye, J.; Zeng, J. Effect of different types of stimulation fluids on fracture propagation behavior in naturally fractured carbonate rock through CT scan. J. Pet. Sci. Eng. 2021, 201, 108529. [Google Scholar] [CrossRef]
Disclaimer/Publisher’s Note: The statements, opinions and data contained in all publications are solely those of the individual author(s) and contributor(s) and not of MDPI and/or the editor(s). MDPI and/or the editor(s) disclaim responsibility for any injury to people or property resulting from any ideas, methods, instructions or products referred to in the content. |
© 2024 by the authors. Licensee MDPI, Basel, Switzerland. This article is an open access article distributed under the terms and conditions of the Creative Commons Attribution (CC BY) license (https://creativecommons.org/licenses/by/4.0/).

