Article

Quantifying Forest Cover Loss during the COVID-19 Pandemic in the Lubumbashi Charcoal Production Basin (DR Congo) through Remote Sensing and Landscape Analysis

by
Yannick Useni Sikuzani
1,*,
Médard Mpanda Mukenza
2,*,
Ildephonse Kipili Mwenya
2,
Héritier Khoji Muteya
1,
Dieu-donné N’tambwe Nghonda
1,
Nathan Kasanda Mukendi
3,
François Malaisse
4,
Françoise Malonga Kaj
5,
Donatien Dibwe Dia Mwembu
6 and
Jan Bogaert
4
1
Unit Ecology, Ecological Restoration and Landscape, Faculty of Agronomic Sciences, University of Lubumbashi, Lubumbashi P.O. Box 1825, Democratic Republic of the Congo
2
Department of Renewable Natural Resources Management, Faculty of Agronomic Sciences, Katumba Mwanke University of Technology, Lubumbashi P.O. Box 74, Democratic Republic of the Congo
3
Research Unit in Agricultural Economics and Development, Faculty of Agronomic Sciences, University of Lubumbashi, Lubumbashi P.O. Box 1825, Democratic Republic of the Congo
4
Biodiversity, Ecosystem and Landscape Unit, Gembloux Agro-Bio Tech, University of Liège, 5030 Gembloux, Belgium
5
School of Public Health, University of Lubumbashi, Lubumbashi P.O. Box 1825, Democratic Republic of the Congo
6
Department of Historical Sciences, Faculty of Arts and Humanities, Lubumbashi P.O. Box 1825, Democratic Republic of the Congo
*
Authors to whom correspondence should be addressed.
Resources 2024, 13(7), 95; https://doi.org/10.3390/resources13070095
Submission received: 29 April 2024 / Revised: 7 June 2024 / Accepted: 1 July 2024 / Published: 5 July 2024

Abstract

:
In the context of the Lubumbashi Charcoal Production Basin (LCPB), the socio-economic repercussions of the COVID-19 pandemic have exacerbated pressures on populations dependent on forest resources for their subsistence. This study employs a comprehensive methodological approach, integrating advanced remote sensing techniques, including image classification, mapping, and detailed landscape analysis, to quantify alterations in forest cover within the LCPB during the pandemic period. Our findings reveal a consistent trend of declining forested area, characterized by processes of attrition and dissection observed throughout various study phases, spanning from May 2019 to November 2023. This reduction in forest cover, notably more pronounced in the vicinity of Lubumbashi city and the northern zone of the LCPB, proved to be less pronounced between November 2019 and September 2020, underscoring the influence of COVID-19 pandemic-induced confinement measures on forest management practices in the region. However, subsequent to this period of restriction, deforestation activity intensified, leading to significant landscape transformations within the LCPB, primarily attributable to expanded human activities, consequently resulting in a notable decrease in the proportion of land occupied by these natural ecosystems. Consequently, the size of the largest forest patch declined substantially, decreasing from 14.62% to 8.20% between May 2019 and November 2023, thereby fostering a heightened density of forest edges over time. Our findings provide a significant contribution to understanding the complex interactions between the COVID-19 pandemic and deforestation phenomena, emphasizing the urgent need to adopt adaptive management strategies and appropriate conservation measures in response to current economic challenges.

1. Introduction

Forest ecosystems play a pivotal and multifaceted role on a global scale. Their primary contribution to climate regulation stems from their ability to sequester carbon dioxide (CO2) [1], serving as critical carbon sinks and significantly mitigating greenhouse gas emissions [2]. Concurrently, forests uphold the stability of hydrological cycles by regulating water flow dynamics. Moreover, they harbor unparalleled biodiversity, safeguarding the planet’s genetic diversity [3]. Additionally, forests provide indispensable resources such as timber, firewood, and traditional medicines, thereby contributing to the daily welfare of populations [2,4,5]. Notably, an estimated 880 million people worldwide, particularly women, rely on firewood collection or charcoal production, underscoring forests’ indispensable role in human livelihoods [6,7].
Nevertheless, the conservation and sustainable management of forests remain imperative for preserving ecological equilibrium, fostering biodiversity, and supporting local communities [8]. Between 1990 and 2020, the global forest area diminished by 178 million hectares, equivalent to the size of Libya. Over 100 million hectares of forests face various threats such as fires, pests, diseases, invasive species, droughts, and adverse climatic events [9,10]. Agricultural expansion remains the primary driver of deforestation, forest fragmentation, and biodiversity loss, particularly in tropical regions [11].
In addition to these ongoing challenges, scholars suggest that the COVID-19 pandemic could have enduring economic and social repercussions with ongoing implications for forests [12,13]. For instance, crises such as COVID-19 might precipitate an escalation in forest fires due to reduced monitoring capacities [13]. Moreover, the surge in urban unemployment resulting from the pandemic has prompted temporary migration to rural areas, where individuals seek livelihood opportunities such as farming in proximity to forests, thereby exacerbating pressure on these ecosystems [14,15]. Conversely, studies indicate that the initial impacts of COVID-19 might have led to a reduction in deforestation rates due to economic slowdown during containment measures [16].
While Latin America halved the rate of forest loss from 5.2 million hectares per year between 2000 and 2010 to 2.6 million hectares per year over the subsequent decade, forest loss in Africa increased from 3.4 to 3.9 million hectares per year [17]. In Africa, deforestation is closely linked to small-scale activities such as subsistence farming, charcoal production, and firewood collection [18]. The Democratic Republic of the Congo (DR Congo) significantly contributes to this deforestation, becoming the country with the second-fastest rate of forest loss after Brazil [9].
In the southeastern DR Congo, the Katangese Copperbelt Area emerges as a longstanding mining hub, playing a central role in demographic growth [19]. Concurrently, this region is traversed by the miombo forest, an open forest formation characterized by sparse shrub vegetation, dominated by trees of the Brachystegia, Julbernadia, and Isoberlinia genera [20,21]. The regression of the miombo forest is particularly concentrated around mining areas, with the Lubumbashi region serving as a notable example. Driven by rapid urbanization, deforestation is exacerbated by unsustainable logging to meet local energy, construction, and other needs, as well as agricultural practices like shifting cultivation and farmland expansion [22,23,24]. As a significant mining locale, Lubumbashi also contributes to deforestation through the expansion of mining operations and associated infrastructure. Deforestation leads to the disappearance of many non-timber resources, such as honey, mushrooms, and caterpillars, as well as a reduction in wildlife, causing a shortage of animal proteins for the village population [22]. Challenges in forest resource management, such as the issuance of forest concessions without adequate oversight by customary authorities [25,26], have further exacerbated deforestation, particularly during the COVID-19 pandemic, in the rural area of Lubumbashi known as the Lubumbashi Charcoal Production Basin (LCPB). Khoji et al. [27] found that the LCPB lost more than half of its miombo woodland cover, decreasing from 77.90% in 1990 to 39.92% in 2022.
At the outset of the COVID-19 pandemic, Africa, including the DR Congo and the LCPB, implemented measures such as lockdowns to contain the virus’s spread [28]. These restrictions aimed to safeguard the population and bolster healthcare system capacities [29]. Within this basin, the containment measures and economic disruptions associated with the COVID-19 pandemic have intensified pressure on populations reliant on forest resources for their livelihoods [23,26,30]. Some have responded by escalating logging activities to meet immediate economic needs, as exemplified in Kasomeno within the same region with the illicit exploitation of Pterocarpus tinctorius Wel. [25]. Similarly, population groups affected by economic disruptions or containment measures may have migrated to forested areas, thereby exerting additional pressure on these fragile ecosystems. Pandemic-related restrictions have also altered electricity consumption patterns, particularly with increased demand in residential areas of Lubumbashi due to remote work. This heightened demand for electricity has disrupted energy supply, exacerbating the demand for charcoal [27]. Food security has become a major concern, prompting inhabitants to clear new areas for agriculture. Additionally, during pandemics, roads have facilitated access to forested areas, intensifying pressure on these ecosystems. Reduced surveillance and controls have fostered unsustainable utilization of forest resources, including logging and land conversion for agricultural purposes, along extensive distances to villages and roads. Changes in population movement patterns due to travel restrictions and economic impacts have led to displacement to forested areas, exacerbating deforestation, particularly near roads and villages. The pandemic has also influenced demand for forest products, such as timber and non-timber products, with roads facilitating the transport of these products to markets, and shifts in demand potentially affecting deforestation rates, as observed in Peru [14].
Analyzing spatial landscape patterns and their dynamics provides valuable insights into fundamental ecological processes, and vice versa [31]. In this context, remote sensing plays a crucial role in monitoring deforestation by offering accurate, continuous, and large-scale data [32,33]. Additionally, landscape ecology tools furnish an integrated spatial approach to comprehending deforestation dynamics. By amalgamating advanced geospatial methods with landscape ecology tools, detailed information on changes in forest landscapes’ processes is provided, thereby enabling more informed and sustainable forest resource management [34]. This study aims to assess and quantitatively analyze the impacts of COVID-19 on deforestation using a comprehensive approach integrating remote sensing and landscape analysis. We hypothesize that the socio-economic constraints imposed by containment measures during the COVID-19 pandemic would likely have led to a substantial surge in human activities during subsequent periods, thereby contributing to a significant decline in forest cover. This decline is anticipated to be more pronounced in peripheral areas of the city and in the northern region of the landscape, particularly attributable to the dense network of paved roads facilitating increased human access and activity.

2. Materials and Methods
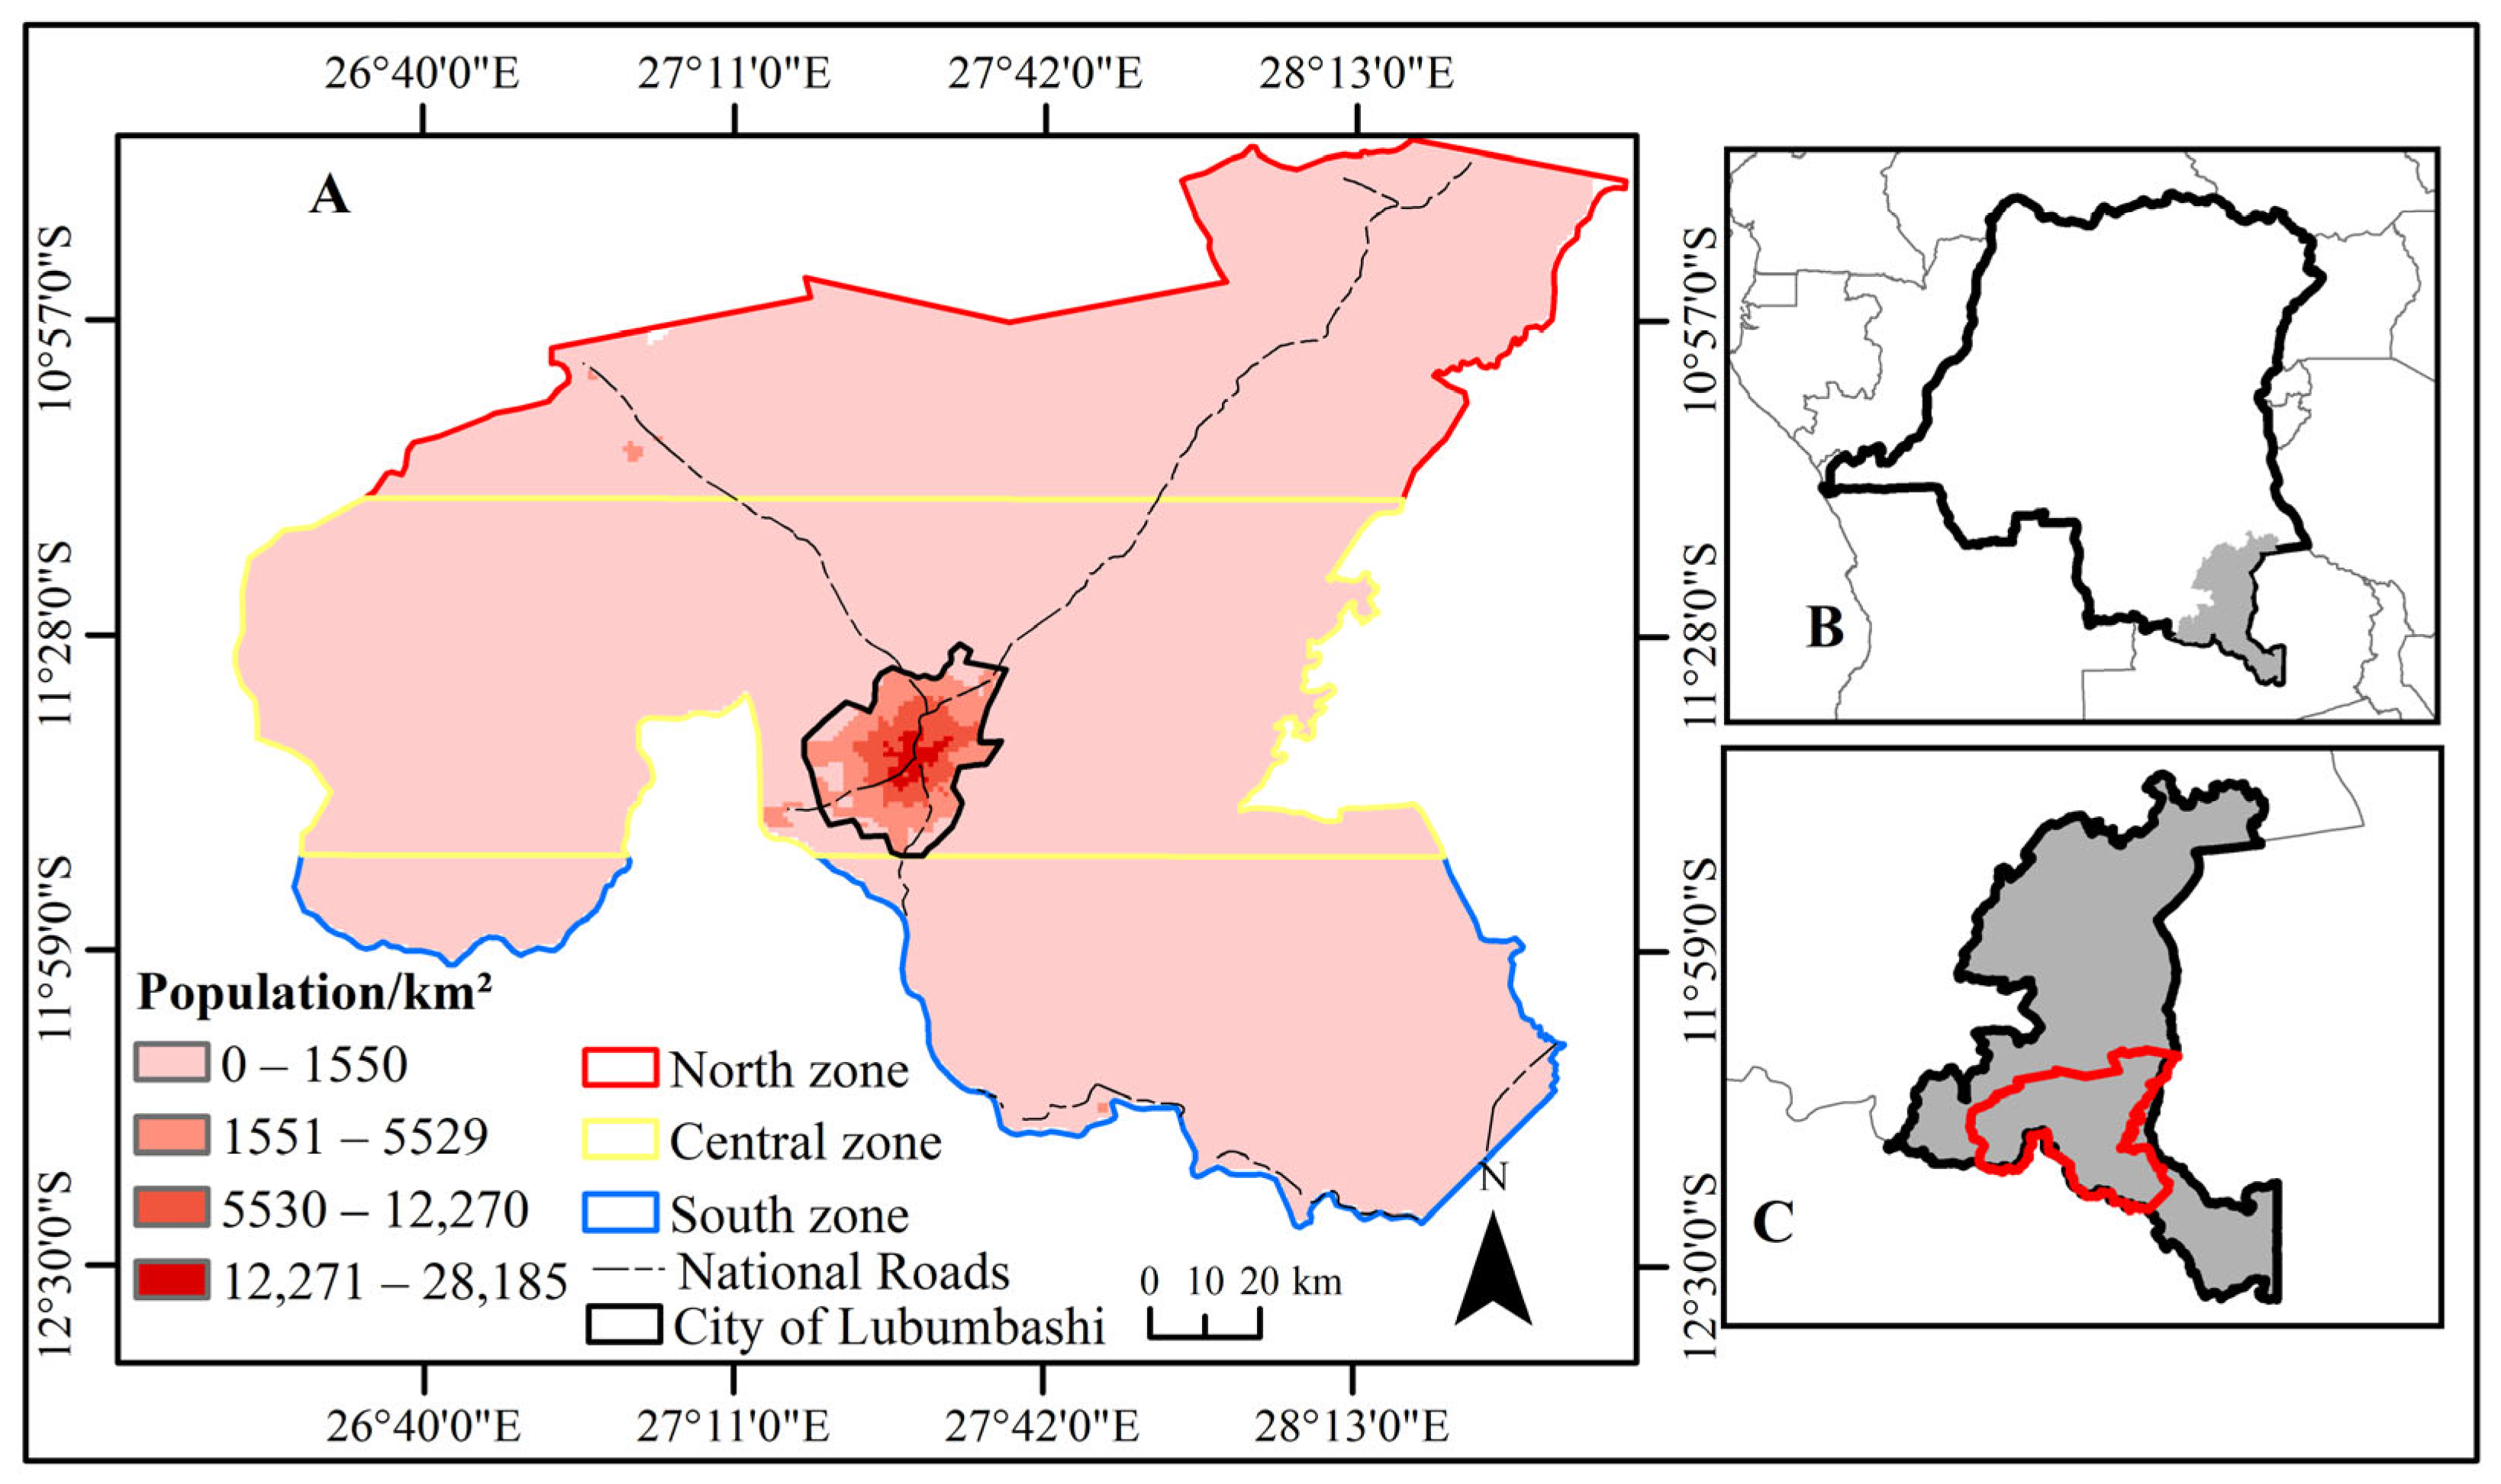
2.1. Study Area

This investigation was conducted within the LCPB, situated in the southeastern sector of the DR Congo. Geographically, the area is delineated by coordinates spanning from 10°39′7.47″–12°26′37.61″ S and 26°20′54.95″–28°40′13.55″ E (Figure 1) [27]. Encompassing a total land area of approximately 26,603.4 km2, the LCPB features a climate categorized as Cw according to the Köppen classification system [35]. Seasonally, the region experiences a rainy period extending from November to March, followed by a dry phase from May to September, interspersed with transitional periods in April and October [20,36]. The average annual precipitation in this area amounts to around 1270 mm, with a mean annual temperature of 20 °C, although recent climate fluctuations have been noted [36]. The prevailing vegetation, miombo woodland, is presently fragmented and intermittently replaced by savannah terrain [27,37]. The dominant soil is ferralitic according to FAO/World Reference Base for Soil Resources classification, with an average pH level of approximately 5.2 [38]. The socioeconomic activities within the LCPB encompass a range of sectors including mining, agriculture, charcoal production, livestock husbandry, and commerce, all of which hold substantial significance for the local population exceeding 3.5 million inhabitants [39,40]. The region faces notable challenges, including rapid population growth and deficiencies in public services and infrastructure. Since the appointment of provincial governors in 2006, a noticeable development in the form of road construction has taken place, connecting Lubumbashi to different regions. This progress has led to the growth of settlements within the LCPB. The distribution of tribes and villages around Lubumbashi reflects a combination of migration histories and economic activities. The main ethnic groups, such as the Baluba, Bemba, Sanga and Lunda, live together and contribute to the cultural diversity of the region. However, the swift population increase and ongoing poverty challenges have prompted the emergence of numerous villages within the LCPB [27]. Consequently, residents heavily depend on natural resources to meet essential needs and fulfill the demands of urban dwellers for agricultural produce, non-timber forest products, and charcoal [23,26]. This economic reliance has exerted significant pressure on forest resources, contributing to notable deforestation and forest degradation in the region. Additionally, deficiencies and inconsistencies in forest governance exacerbate the situation by allowing for unsustainable exploitation of forest resources [26].

2.2. Data

Data from the Sentinel-2 satellite, operating at a 10 m resolution and capturing imagery during the dry season, was pivotal in analyzing landscape changes. This satellite system, developed by the European Space Agency (ESA) as part of the Copernicus program, features a multispectral sensor that records data across different spectral bands [42]. Its high-resolution imagery provided valuable information crucial for the study’s analysis of landscape dynamics and transformations [43,44,45]. The investigation employed a series of Sentinel-2 images acquired at intervals spanning from 2019 to 2023, encompassing periods preceding, during, and after the emergence of the COVID-19 pandemic, with the objective of conducting a comprehensive evaluation of temporal variations. These time points delineate three discrete phases: the pre-COVID-19 era (May and November 2019), the concurrent pandemic phase (July 2020, September 2020, May 2021, May 2022), and the post-pandemic era (November 2022, May 2023, and November 2023). It is pertinent to mention that significant public health interventions were implemented during the second phase coinciding with the COVID-19 pandemic. Specifically, a state of health emergency, along with containment measures, was enforced from 24 March 2020 to 21 July 2020, aligning with the time frame of satellite image acquisition from November 2019 to July 2020. Subsequently, a curfew without a state of health emergency was instituted from 21 December 2020 to 15 February 2021, corresponding to image captures between November 2020 and May 2021. The selection of diverse dates within this investigation also facilitates an assessment of the impact of a project on community management of miombo forests in southeastern Katanga, a collaborative effort between the FAO and the Government of the DR Congo. This initiative, active from 1 August 2016 to 31 March 2023, was sanctioned by the creation of community forest concessions within the LCPB from 10 February 2021.

2.3. Sentinel-2 Images Classification

The Sentinel-2 satellite imagery employed in this research underwent pre-processing procedures, including atmospheric correction and radiometric calibration, to enhance image quality and reliability, thus enabling subsequent analyses [42]. These corrections were automated using the Sensor-Invariant Atmospheric Correction (SIAC) module on the Google Earth Engine (GEE) platform, utilizing a sensor-invariant methodology to minimize sensor-specific dependencies [46]. A false-color composite of Sentinel-2 images was generated by combining near infrared, red and green bands to enhance vegetation discrimination [47]. This false-color composite was crucial in revealing detailed information within the images, facilitating nuanced interpretation of captured objects. For precise analysis, distinct land cover units were identified and coded across scenes, and training areas known as Regions of Interest (ROIs) were delineated in each study year, strategically selected during the dry season (November 2023) for temporal consistency [40]. These ROIs, consisting of polygons with 2 and 4 pixels per area, were tailored for each land cover type, totaling 200 ROIs per type, aimed at reducing transitional effects known as the ‘mixel’ effect [48,49]. The ROIs were utilized as training data to construct a model based on the random forest algorithm, which combines predictions from multiple decision trees to enhance prediction accuracy and minimize classification errors [50,51]. The use of GEE was pivotal, providing cloud-based infrastructure for efficient processing of vast satellite datasets and utilizing substantial computational resources [52]. However, the classification of dates from images prior to November 2023 was also supported by Google Earth images, which sometimes contain errors in discriminating between land uses. This can be considered a potential source of classification error.
Land cover types, encompassing forests, savannas, built-up areas, bare soil, croplands, and water bodies, were grouped into two primary landscape classes: forests (miombo woodland, dry dense forest, gallery forest) and non-forests (all other land cover types). To evaluate classification accuracy, we followed best practices recommended by Olofsson et al. [53], employing unbiased surface estimators and estimating uncertainty through reference observations from change maps between 2019 and 2023. Samples were stratified based on stable and change classes for each period, and sample sizes were determined using Cochran’s method [54]. A total of 11,595 points were sampled across eight periods, with proportions allocated based on stratum sizes. Error matrices, expressing estimated surface proportions and confidence intervals, were generated in QGIS software version 3.26.1 (developed by the global QGIS community, Buenos Aires, Argentina), along with measurement accuracies such as overall accuracy, user accuracy, and producer accuracy. Land cover maps were produced using ArcGIS version 10.8 (developed by ESRI (Environmental Systems Research Institute), Redlands, CA, USA).

2.4. Land Cover Change Analysis

This research utilized Fragstats software version 4.2 (Developed by McGarigal, Amherst, MA, USA) to assess the influence of human activities on landscape morphology within the LCPB by computing five landscape metrics. These metrics, encompassing class area, mean patch area, number of patches, largest patch index, and edge density, clarified patch fragmentation across different land cover types [55,56]. Class area signifies the percentage of a specific land cover type within a given landscape. This measurement is valuable for understanding the composition of the landscape by pinpointing the predominant landscape matrix. Meanwhile, average patch area refers to the average size of habitat patches within a land cover type, offering insights into habitat fragmentation. Edge density quantifies the total length of all edge segments per hectare for a land cover type (m/ha). It gauges the complexity or ruggedness of the patches within land cover types; high edge density indicates that ruggedness decreases as patches merge and boundaries dissolve, while it increases with the emergence of new fragments or patches. Another crucial metric is the number of patches within a land cover type, where a high patch number may indicate fragmentation and dispersion, while a low patch number suggests infilling and aggregation. Such metrics hold ecological importance as they provide valuable insights into spatial patterns and fragmentation within forest landscapes [57], aiding in evaluating habitat fragmentation levels, patch connectivity, and overall landscape health [56,58]. A monthly deforestation rate was computed to standardize the comparison of forest cover loss progression across different periods under examination. This deforestation rate is defined as the ratio between the difference in forest cover between two periods and the difference in months separating them.
Spatial transformation processes affecting land cover dynamics were identified using a decision tree algorithm [59]. The decision tree (Table 1) uses comparisons between the number of patches, total area, and total perimeter of a land cover type to identify the corresponding spatial transformation process in the landscape between two specific dates [58]. Between two specific dates, a decrease in patch number, coupled with reduced class area, signifies attrition. Conversely, increased class area indicates aggregation. Unaffected patch numbers alongside increased class area suggest enlargement, while increased class area and patch number indicate creation of new patches. A decrease in class area alongside increased patch number, with minimal area loss due to linear disruptions, denotes dissection. Fragmentation combines patch increase with substantial class area loss. A decrease in class area can lead to perforation if the total perimeter increases, or patch shrinkage if it remains constant. In cases where patch number and class area remain constant, a constant total perimeter suggests a shift, while a changing total perimeter indicates deformation [59]. To distinguish between fragmentation and dissection processes, the ratio of total areas at different time points was analyzed, with a ratio above 0.75 indicating dissection and a ratio at or below 0.75 indicating fragmentation prevalence [60].
A landscape composition analysis within the LCPB was systematically conducted across its northern, central, and southern zones. The Kolmogorov–Smirnov test was applied to evaluate the conformity of the data to a normal distribution. Given the data’s adherence to normality, an analysis of variance (ANOVA) was utilized to compare forest proportions across these zones, thereby assessing the impact of zone classification. Moreover, to investigate the variation in forested areas surrounding Lubumbashi, ArcGIS 10.8 software was utilized to create five buffer zones ranging from 0 to 150 km (0–30 km, 30–60 km, 60–90 km, 90–120 km, and 120–150 km) from the city center (Figure 2). This facilitated an examination of the impact of proximity to the city on forest cover loss. The Kruskal–Wallis test, employed as a non-parametric alternative to ANOVA due to the non-normal distribution of the data, was employed to compare forest proportions at varying distances from the city of Lubumbashi.

3. Results

3.1. Classification Accuracy

Table 2 below presents a synthesis of the accuracy results from supervised classifications of Sentinel-2 images obtained using the random forest classifier, covering the periods from May 2019 to November 2023. It is important to note that the images were classified with an overall accuracy exceeding 90% for all periods studied, demonstrating a high reliability in distinguishing between different land cover types. The user’s and producer’s accuracy values ranging between 86% and 100% attest to the undeniable quality of the results obtained. Furthermore, the 95% confidence interval calculated to estimate the stratified area of each land cover class for all study periods remains below 5%, further reinforcing the reliability of the study’s conclusions.

3.2. Land Cover Change Mapping

The visual analysis of land cover maps highlights changes in the landscape between May 2019 and November 2023. Specifically, a pronounced forest cover loss is observed, primarily in the northern part of the study area, while non-forest areas continue to expand in all directions. These changes are even more noticeable between November 2022 and November 2023, a period following the onset of the COVID-19 pandemic. These results suggest that the COVID-19 pandemic may have had an impact on landscape spatial pattern changes through the deforestation process within the LCPB (Figure 3).

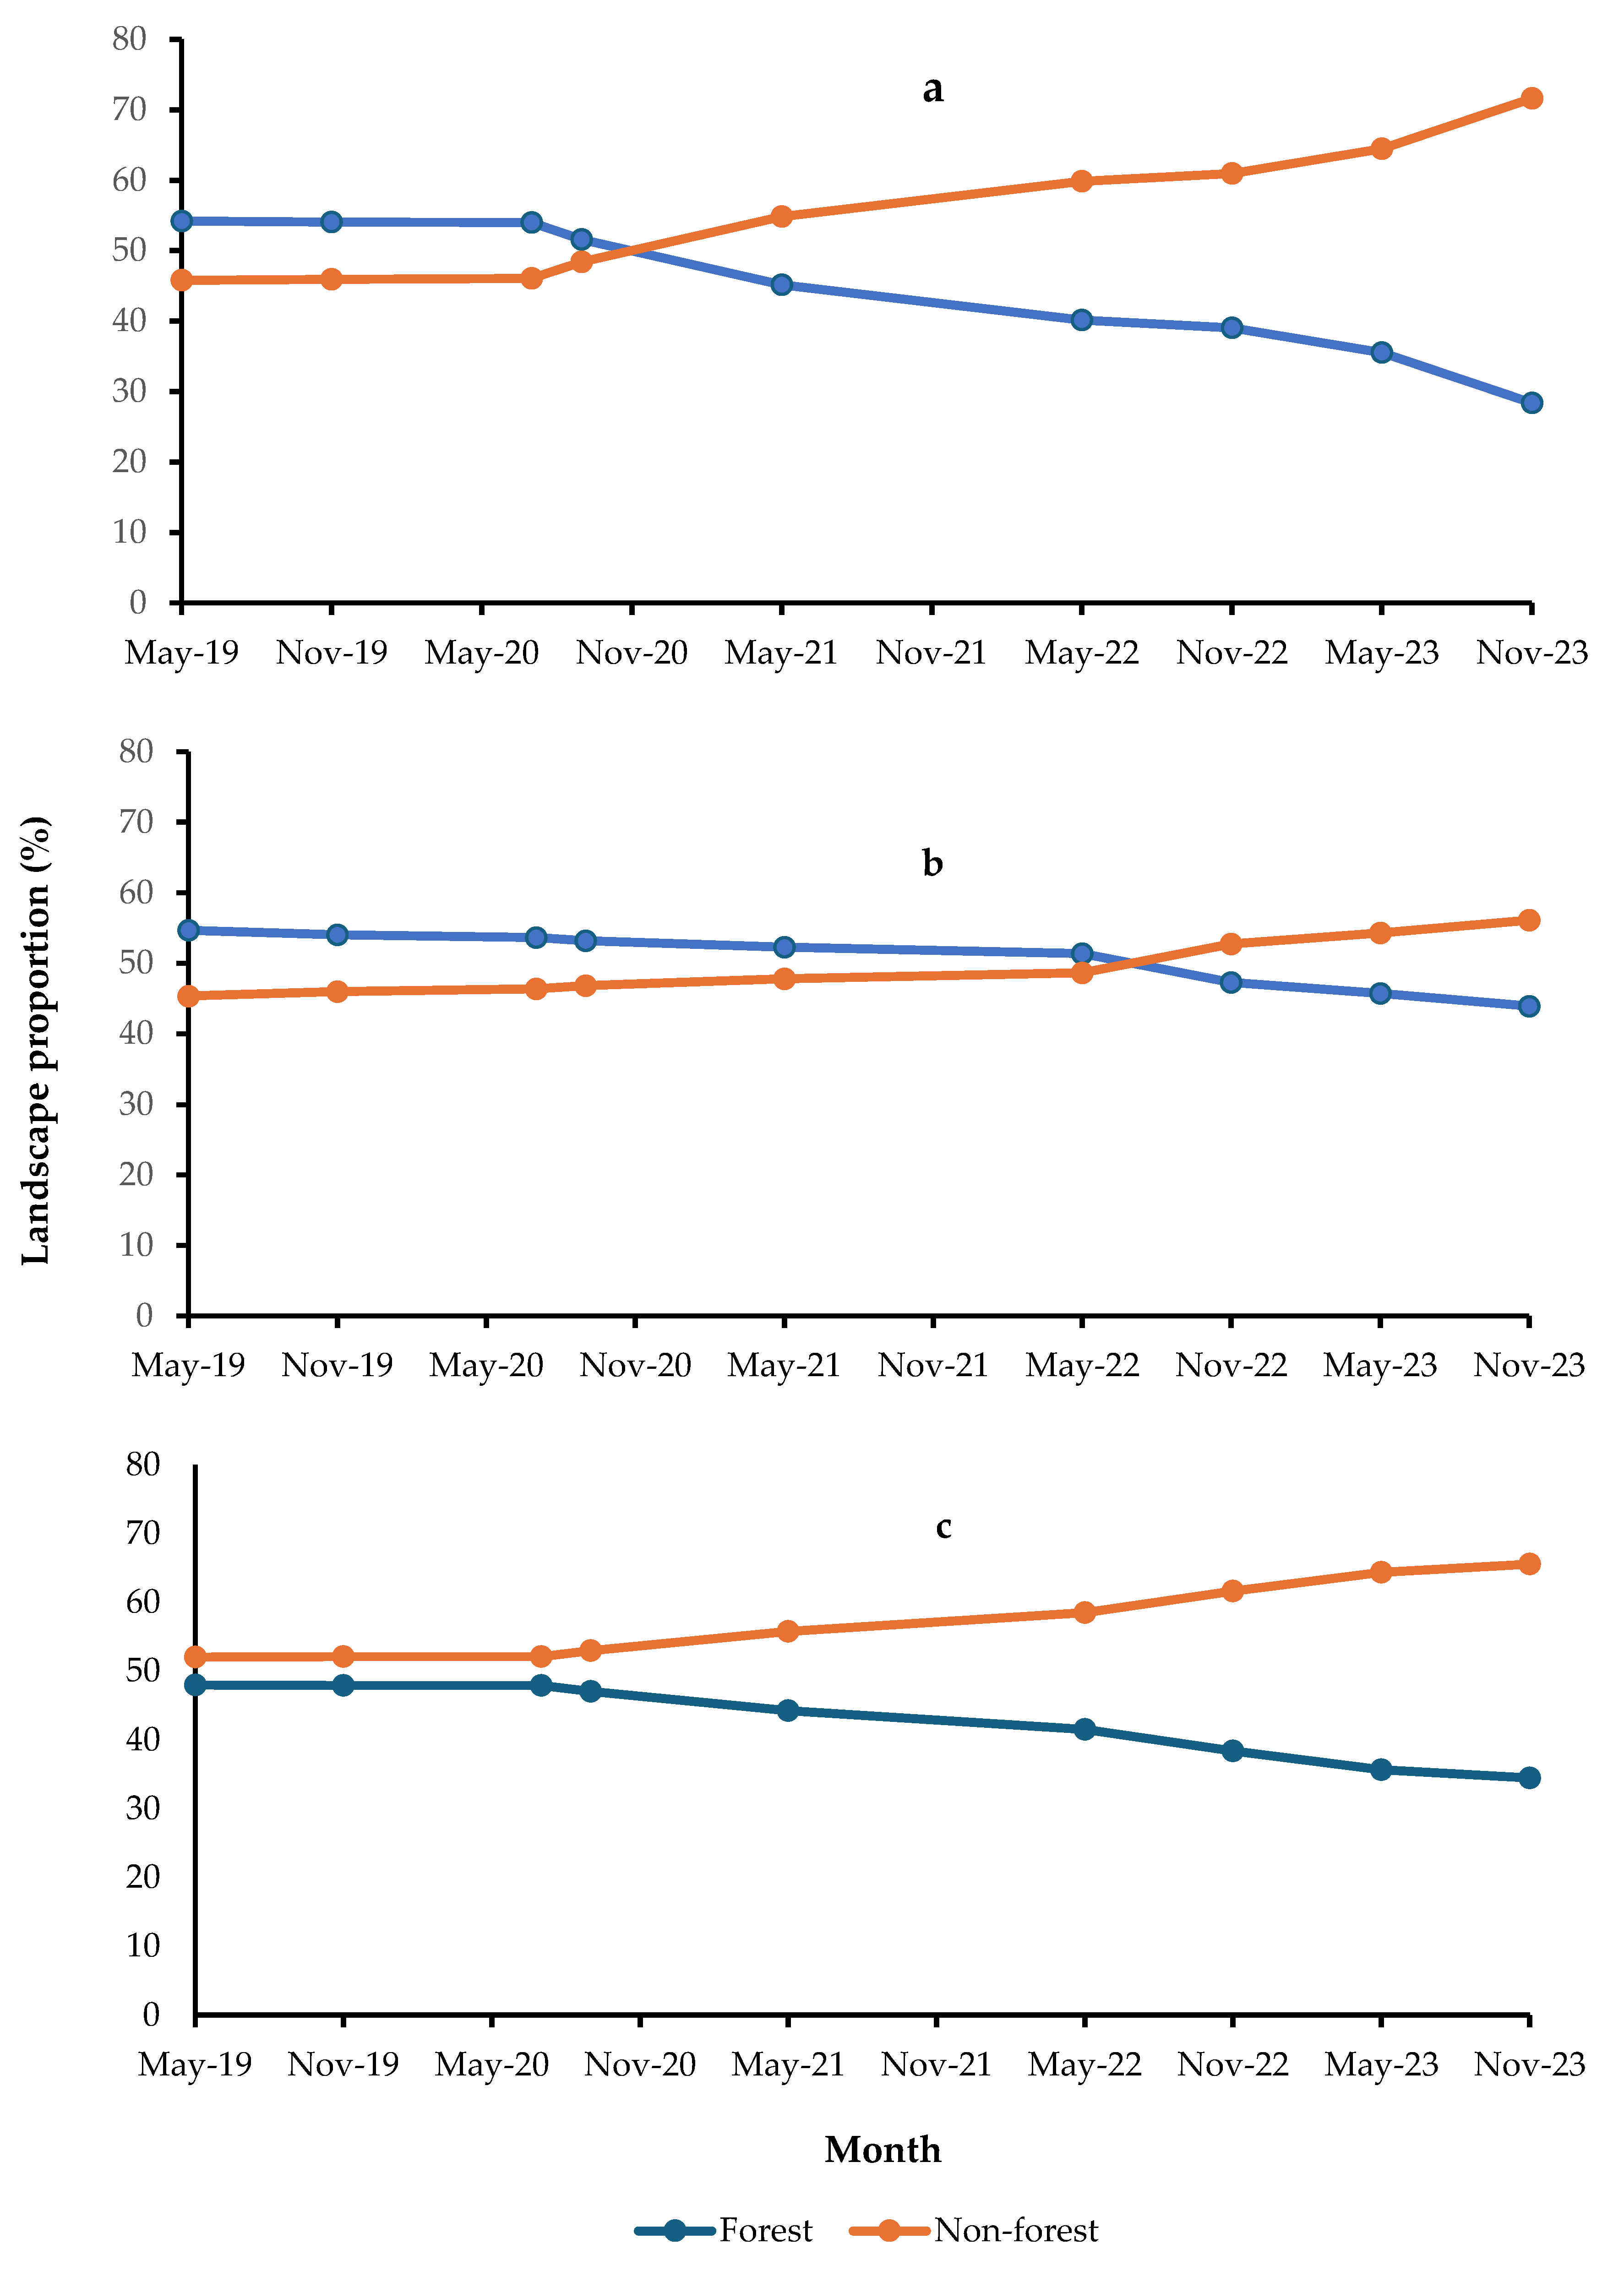
3.3. Landscape Composition Dynamics

During the period from May 2019 to November 2023, a gradual forest cover loss was observed across the entire LCPB (Figure 4). This decrease occurred in favor of non-forest. These results demonstrate a significant transition wherein the forest, which represented approximately 52% of the landscape in May 2019, was replaced by non-forest areas that became the dominant matrix after July 2020. By November 2023, forest cover had fallen below 40% of the landscape, experiencing a loss of approximately one-quarter compared to its initial area in May 2019 (Figure 4a). However, our results reveal significant variations in monthly deforestation rates over time (Figure 4b). Between May 2019 and November 2019, the monthly deforestation rate was relatively low at 0.05%. This period was followed by a slight decrease in the rate between November 2019 and July 2020, to 0.02%. However, a notable increase in the deforestation rate was observed between July 2020 and September 2020, reaching 0.59%. This period was marked by a significant rise in deforestation activities. Subsequently, although the deforestation rate decreased between September 2020 and May 2021 (0.43%), it remained relatively high compared to the earlier study periods. This downward trend continued until May 2022, with a deforestation rate of 0.24%. However, from May 2022 to November 2022, a new increase in the deforestation rate was recorded, reaching 0.46%. Between November 2022 and May 2023, although the deforestation rate slightly decreased to 0.44%, it remained higher than the levels observed in the earlier study periods. Finally, the period from May 2023 to November 2023 saw another increase in the deforestation rate, reaching 0.52%. These results highlight the complexity of deforestation dynamics within the LCPB (Figure 4b).
Analyses conducted over different key periods of the study on forest cover proportion revealed statistically significant differences (p = 0.0027; Figure 4c). Prior to the COVID-19 pandemic, forests constituted approximately 52% of the landscape in the LCPB. However, during the pandemic, the proportion of forested areas significantly decreased, no longer being the predominant landscape component, dropping to around 48%, which corresponds to a 7.7% decrease in forest cover. Following the pandemic, this gap widened further, with forest cover falling below 40% of the LCPB landscape, representing a substantial decline of 20.0% (Figure 4c). These results underscore the importance of monitoring and protecting forests in the context of biodiversity and current environmental challenges. They also highlight the potential impact of global events, such as the COVID-19 pandemic, on local natural ecosystems.
The spatial analysis of forest cover around the city of Lubumbashi reveals significant trends (p = 0.015) and notable variations (Figure 5). The results show a high proportion of forests over longer distances from the city, proportionally to the distance from the city center. Overall, a consistent decrease in forest cover is observed over time, notably on the outskirts of Lubumbashi city. However, an exception is noted between May 2019 and July 2020, where forest cover remained relatively stable regardless of the distance from the city. During the COVID-19 pandemic lockdown period, between November 2019 and July 2020, a significant drop in forest area was recorded far from the city of Lubumbashi, particularly in areas beyond 120 km from the city. Three distinct trends are evident. Firstly, forest cover, while showing a steady decline, continues to dominate the land within the 60–150 km radius of the city. Secondly, in the 30–60 km radius, forest cover declined to nearly 40% by November 2023, contrasting with an approximately 58% proportion in May 2019. Lastly, within the area less than 30 km from the city, forest cover, accounting for slightly under 20% of the land area in May 2019, had diminished to nearly 10% by November 2023. This analysis suggests that proximity to Lubumbashi has an impact on surrounding forest density, and specific events such as lockdowns can lead to major variations in forest cover on the periphery.
The gradual forest cover loss observed at the LCPB scale was also noted in its three distinct zones: the northern zone (NZ), the central zone (CZ), and the southern zone (SZ) (Figure 6). Globally, the results reveal a consistent decrease in the proportion of forested areas across the three zones of Lubumbashi city over the studied period from May 2019 to November 2023. In the northern zone of the city of Lubumbashi, forest cover declined from 54% in May 2019 to 28% in November 2023, indicating a steady and substantial reduction over time. This significant decrease signifies a noteworthy loss of forested areas in this region (Figure 6a). Similarly, in the southern zone of the city of Lubumbashi, the proportion of forest cover decreased from 55% in May 2019 to 44% in November 2023. While the reduction in forest cover is less pronounced compared to the northern zone, this consistent downward trend also underscores environmental degradation in this area (Figure 6b). In the central zone surrounding the city of Lubumbashi, forest cover also experienced a decline, dropping from 48% in May 2019 to 34% in November 2023. Although this decrease is slightly less pronounced than in the northern and southern zones, it nevertheless exhibits a linear downward trend over the study period (Figure 6c). These findings highlight a significant degradation of forest across all zones during the study period. This reduction in forest cover can have significant implications for biodiversity, ecosystem services, and the resilience of local ecosystems in the face of environmental changes. However, prior to the COVID-19 pandemic (from May to November 2019) and during the period covering the initial lockdown (from November 2019 to July 2020), a low deforestation dynamic was observed in the NZ, CZ, and SZ compared to other periods. Analysis of land cover change between May 2019 and November 2023 revealed growing concerns regarding forest loss, particularly in the northern and central zones where the forest proportion significantly decreased (p < 0.05). These results suggest that deforestation has intensified over time, especially in the northern and central zones, raising significant concerns about biodiversity loss and environmental degradation in this region.

3.4. Change in the Configuration of Landscape

The analysis of the landscape reveals distinct spatial transformation processes over the study periods, as presented in Table 3. From May 2019 to November 2019, November 2019 to July 2020, and from May 2023 to November 2023, there was a notable decrease in both the number of forest patches and their respective class area, signifying a spatial transformation process of attrition in spatial configuration. Conversely, the periods spanning from July 2020 to May 2023 are marked by the dissection of forest patches (with a t-value exceeding 0.75) as dominant spatial transformation process since the decrease in class area is accompanied by an increase in patch number. Over the period from May 2019 to November 2023, small forest patches gradually dominated larger ones, leading to a continuous reduction in the average area of forest zones. Consequently, over the years, the forest significantly degraded. This degradation is highlighted by a decrease in the Largest Patch Index (LPI) values (13% in May 2019 to 8% in November 2023) in parallel to the increase in the edge density values between May 2019 and May 2023 (87 to 108), before dropping to 86 in November 2023. These results underscore the complex changes and pressures exerted on the forest during the study period, with potentially significant implications for biodiversity and local ecosystems.

4. Discussion

4.1. Methodology

Traditional aerial imagery, while valuable, is limited by cost and inadequate coverage over extended periods compared to satellite imagery, hampering comprehensive temporal analysis [61,62]. In contrast, utilizing Sentinel-type satellite images in this study provides high spatial resolution, enabling detailed examination of land cover changes not well-captured by medium to coarse resolution imagery, thus allowing precise analysis [63,64]. To ensure reliable classification outcomes, multiple sets of image datasets were acquired at various intervals for comparison and assessment of changes pre- and post-COVID-19 pandemic, offering historical and current insights into forest cover dynamics [65]. Despite challenges in synchronizing Sentinel-2 image acquisition dates with COVID-19 pandemic-related events, mitigating seasonal influences by capturing images during specific dry season periods facilitated deforestation data comparison between pre-pandemic and pandemic periods. Rigorous data validation, cross-referencing with official pandemic timelines, and statistical adjustments addressed challenges in synchronizing image acquisition dates, ensuring accuracy and reliability of the study’s temporal analysis. Integrating remote sensing data with ground observations validated findings, enhancing analysis robustness and allowing isolation of specific COVID-19 impacts on deforestation [66].
The GEE platform offers several advantages, including access to vast geospatial datasets, efficient processing capabilities for large-scale analyses, and cloud-based computing resources that facilitate collaborative research. Additionally, its integration with machine learning algorithms like random forest enables accurate and automated land cover classification, especially in areas with complex land use patterns [24]. However, the platform’s reliance on remote sensing data may limit classification accuracy in areas with high cloud cover or limited internet connection [27].
Our investigation employed rigorous scientific methodologies to examine the ramifications of COVID-19 on deforestation. Specifically, preprocessing steps were crucial for eliminating distortions and enhancing data quality, thereby improving result reliability [42]. Geometric rectification ensured accurate comparisons across different timeframes by eliminating geometric variations and ensuring precise interpretation of forest cover changes [42]. The use of a supervised classification approach enabled accurate discrimination between land cover types, aiding in the identification of landscape composition changes with high precision compared to unsupervised classification methods [23].
Additionally, change detection analysis to identify forest cover loss involved calculating a series of landscape metrics [56,67]. Indeed, the conversion of natural landscapes into anthropized landscapes results in significant spatial pattern alterations. Employing landscape metrics allows for quantitative analysis of changes, providing detailed information on spatial patterns and forest fragmentation. The complexity of landscape pattern studies is evident in the multitude of metrics utilized, as a singular value cannot fully encapsulate landscape configuration [34]. Understanding forest spatial transformation processes involves analyzing patch number, class area, and perimeter, forming the basis of decision-making processes such as the decision tree, which integrates information on patch morphology variation and landscape transformation causes.

4.2. Forest Cover Loss during COVID-19 Pandemic: Drivers, Extent, and Spatio-Temporal Dynamics

In the Lubumbashi region, deforestation rates were high, but they decreased during the lockdown period before rising again post-restriction. This trend continued until the official end of the pandemic in July 2023. The lockdown and restrictions of the global COVID-19 pandemic resulted in significant environmental changes and reduced anthropogenic disturbances on ecosystems worldwide, known as the “anthropause” [68]. Activities like unauthorized logging and artisanal mining were reduced during the lockdown, leading to a decrease in deforestation levels in the LCPB. Indeed, during the COVID-19 pandemic, the Congolese government implemented strict measures, including lockdowns, restrictions on non-essential movement, curfews, and partial or total border closures [69]. In addition, educational institutions were closed, and public events were restricted or banned while restaurants, bars, and other gathering places were also temporarily closed. These measures negatively impacted productive activities, exacerbating economic and social insecurity. Travel restrictions and business closures led to increased unemployment and loss of income, particularly for those working in the informal sector and small businesses. Consequently, these restrictions hampered monitoring and conservation efforts, encouraging illegal activities and increasing pressure on forests.
Non-compliance with COVID-19 measures during the lockdown likely resulted in undetected infections, impacting people’s ability to exploit forest resources, and potentially affecting food and economic security in forest-dependent areas. Furthermore, the pandemic exacerbated fragility in forest resource monitoring due to reduced field presence of public service agents and limited resources [70,71]. Economic impacts and limited compliance led to continuous forest cover loss, despite the decreasing in extent. Indeed, population below the poverty line resorted to exploiting forest resources during the curfew, leading to deforestation. In addition, during the COVID-19 pandemic, there was a notable surge in the utilization of traditional medicine. The heightened demand for medicinal plants utilized in traditional medicine placed additional stress on forest reserves [72], with communities intensifying their collection efforts [73]. Furthermore, the commercialization of medicinal plants flourished during the pandemic, incentivizing collectors to search for more specimens in forested areas [74,75,76,77,78].
At a national level, the 2002 Forestry Code promotes sustainable forest management by designating nature reserves and community forests, regulating commercial timber concessions, and involving local communities in forest management [79]. In addition, the REDD+ plan aims to reduce greenhouse gas emissions caused by deforestation, by training local communities and authorities, and by using monitoring technologies to track forest cover changes [80]. Locally, Upper Katanga’s policies adapt national directives to local conditions, implements reforestation programs, and support land conservation and restoration initiatives, often in partnerships with NGOs and international organizations. However, COVID-19 containment measures have impended by restricting fields monitoring. The restrictions have also delayed training, increased illegal activities, and redirected resources to managing the health crisis, reducing the effectiveness of conservation initiatives [81].
Subsequently, following the relaxation of lockdown measures and the upsurge in human activities, deforestation accelerated rapidly in the three first months following the lockdown period. This surge is attributed to heightened demands on forest resources due to the recommencement of economic operations and the relaxation of travel constraints, which facilitated the resurgence of human activities, including illicit ones [82]. In addition, after lockdown, reorienting phytomedicines for COVID-19 treatment reduced the risk of weakened populations relying on forest resources [83]. The DR Congo encountered the onset of viral infectious diseases like Ebola nearly a decade ago, yet national initiatives to fortify the health system’s resilience against health hazards and calamities remained absent. However, a trend in the decrease in the extent of forest cover loss was observed from the fourth month after COVID-19 curfew period, probably due to the implementation of a community forestry project. This project has identified within the LCPB 30 sites for local forest concessions covering 334,656 hectares and submitted 20 applications approved by the governorate. It has also promoted agroforestry on 20,882 hectares, encouraging sustainable management of forest resources and reducing pressure on deforested areas [84]. Community-based Forest management has been identified as a win-win option for reducing deforestation while improving the well-being of rural communities [85,86]. Unfortunately, the following period was characterized by an increase in deforestation extent attributable to increased human activity in forest concessions and agroforestry practices, possibly due to economic opportunities and population growth.
Our research reveals a trend of escalating forest exploitation in areas increasingly distant from Lubumbashi city. As forests diminish in nearby rural zones proximate to the city, demand for residual forest resources such as timber, firewood, non-timber forest products, and agricultural land escalates significantly [26]. This heightened demand leads to unsustainable forest exploitation and the conversion of remote forested lands into agricultural zones. Forest scarcity consequently amplifies the fragmentation of remaining forested areas, driving farmers to seek new lands for conversion, including the remaining forest areas, as observed in Ghana and Burkina Faso [87]. Moreover, deforestation itself can perpetuate forest scarcity by diminishing the size and quality of remaining forest areas, compromising their natural regeneration capacity and complicating forest ecosystem restoration efforts, fostering a cycle of continual deforestation [88]. While previous studies reported a deforestation radius of 35 km [89], Kabulu et al.’s analysis based on 2008 field data revealed that charcoal production for Lubumbashi extended up to approximately 60 km from the city [90]. Our findings suggest this radius has expanded to over 100 km, propelled by urban growth and population expansion, escalating land and forest resource demands. Advancements in technology facilitate access to remote forested areas, while inadequate regulations foster uncontrolled exploitation, particularly in remote rural zones governed by traditional authorities. Notably, state authority diminishes in rural areas away from urban centers, favoring customary chiefs’ influence [91]. The alarming deforestation near Lubumbashi during the COVID-19 pandemic stems from various factors. Urban expansion in Lubumbashi has exerted substantial pressure on local forests, driven by the escalating demand for land for residential, industrial, and agricultural purposes [92]. Furthermore, global economic pressures reinforced the phenomenon, with increased demands for agricultural and forest products compelling companies to expand at the expense of forests. In the Kasenga territory, in response to illegal exploitation of Pterocarpus tinctorius, forest cover experienced a significant decline between 2009 and 2021, evidenced by the replacement of forest matrix with savanna in 2021 [25].
The region north of the studied landscape, intersected by two major asphalt roads (national roads to the west and 5 to the east), witnessed substantial deforestation during the COVID-19 pandemic. The presence of asphalt roads is acknowledged to enhance access to forested regions, leading to heightened resource utilization, particularly evident in the post-lockdown phase [93]. The pandemic’s disruptions to traditional economic pursuits potentially spurred some individuals to seek alternative livelihoods such as logging or agriculture, especially in locales accessible via asphalt roads. Moreover, the infrastructure provided by asphalt roads facilitated economic activities and the establishment of transient farmer or charcoal producer settlements, amplifying land demand [94]. Notably, the Lubumbashi–Likasi and Lubumbashi–Kasenga Road networks, situated in the northern region of our study area, are primary conduits for transporting charcoal to Lubumbashi [95]. In contrast, the central and southern areas, lacking significant asphalt roads, are more distant from populous centers and markets, thereby diminishing economic incentives for exploitation. However, recent research indicates that ongoing road network expansions, encompassing the southern region supplying charcoal to Lubumbashi, are anticipated to reduce existing forest resources by over 2% while increasing agricultural lands by about 16% [96].
Acknowledging the various stages of human-induced landscape transformation, encompassing perforation, dissection, and fragmentation [97], our observations within the LCPB are in line with this trend. In our study, forest degradation predominantly stems from dissection and attrition, aligning with previous conclusions [25,98]. Forest fragmentation often precedes the disappearance of certain fragments and the reduction in the size of forest patches over time due to various factors [99]. Firstly, the expansion of human activities leads to the division of forests into smaller patches [99]. Subsequently, these isolated fragments face increased pressure, resulting in their gradual disappearance [100]. Additionally, interventions such as selective logging can cause a reduction in the size of remaining patches, explaining the decrease in the LPI over time [101]. Finally, Human activities such as selective deforestation and unsustainable logging lead to an increase in the proportion of forest edges [102]. Consequences include increased vulnerability of ecosystems to biological invasions, habitat alteration for wildlife, and reduced resilience to disturbances.
The reduction in forest cover is complex and results from a variety of factors [103]. In addition to constant population growth and economic development, short-term factors were exacerbated by the COVID-19 pandemic. The lockdown measures led to a significant decrease in global and local demand for timber products due to economic slowdowns and manufacturing shutdowns. Consequently, timber prices fell, decreasing legal logging activities. However, illegal logging increased as people sought alternative income sources, negatively impacting forest cover [82]. While confinement measures did not directly affect weather patterns, reduced industrial activities slightly decreased air pollution, possibly benefiting local climate conditions and forest health [104,105]. However, restrictions on public gatherings and travel during holidays reduced the spike in timber demand, slightly decreasing forest exploitation. The pandemic altered routines and economic activities, with increased unemployment and economic hardship pushing more people toward subsistence activities, including illegal logging and forest product extraction, intensifying pressure on forest resources. Restricted mobility led to greater reliance on local resources, impacting forest cover as communities turned to forests for fuel, food, and income.

4.3. Implications for Forest Management

The reduction in forest cover leads to habitat loss and fragmentation, resulting in a decline in biodiversity within the miombo woodland [106]. Strict conservation measures, such as protected area designation and sustainable land management practices, can help preserve critical habitats and mitigate biodiversity loss. Moreover, decreasing forest cover diminishes the miombo woodland’s capacity to provide essential ecosystem services, including carbon sequestration, water regulation, and soil stabilization [107]. Promoting reforestation and afforestation initiatives can restore ecosystem functions and enhance the provision of vital ecosystem services crucial for local communities and ecosystem resilience [108].
Forest degradation also impacts the livelihoods and well-being of communities reliant on forest resources for food, fuel, medicine, and traditional practices [109]. Implementing community-based forest management approaches that empower local communities to sustainably manage forest resources can foster socio-economic development while conserving biodiversity [110]. Deforestation contributes significantly to climate change by releasing stored carbon into the atmosphere and reducing forests’ capacity to sequester carbon dioxide [111]. Enhancing climate change mitigation strategies through reforestation, afforestation, and sustainable land use practices can help mitigate climate change impacts and enhance ecosystem resilience [112]. Forest cover loss can also alter hydrological patterns, affecting water availability, quality, and regulating functions [113]. Implementing watershed management strategies, such as reforestation of riparian zones and conservation of water catchment areas, can improve water resource management and ensure long-term water security [114]. Additionally, deforestation increases soil erosion, leading to soil degradation, loss of fertility, and increased sedimentation in water bodies. Implementing agroforestry practices, such as tree planting on degraded lands, can prevent soil erosion, improve soil health, and enhance agricultural productivity sustainably [115].
Inadequate enforcement of forest conservation policies, weak governance, and lack of stakeholder engagement contribute to unsustainable practices of forest exploitation [116]. Strengthening policy frameworks, enhancing law enforcement, promoting stakeholder participation, and fostering partnerships between government, NGOs, and local communities can improve forest governance and promote sustainable land management [117]. Moreover, limited awareness and understanding of the importance of forest conservation and sustainable land management practices among local communities and stakeholders hinder conservation efforts [118]. Investing in environmental education, raising awareness about the value of forests, and promoting community participation in conservation activities can foster a culture of environmental stewardship and support sustainable land management practices.
The identified trends in forest cover reduction around urban areas like Lubumbashi city and the northern zone of the LCPB highlight intensified pressures on natural habitats due to rapid population growth and urban expansion, which diminish overall ecosystem resilience [119]. These trends underscore the urgency of conservation efforts focused on protecting and restoring forested areas, implementing sustainable land-use practices, and creating wildlife corridors to reduce habitat fragmentation [120,121]. The spatial processes of attrition and dissection of forest patches can lead to isolated fragments that may not support viable wildlife populations or ecological functions, necessitating prioritized land-use planning that promotes connectivity between forest patches and incorporates ecological corridors into development plans to mitigate these effects [121,122]. Additionally, the reduction in the size of the largest forest patch increases edge effects, emphasizing the need to restore and protect large contiguous forest areas and implement measures like buffer zones and wildlife-friendly land-use practices to minimize habitat degradation and changes in species composition [123].
Finally, pandemics or epidemics exacerbate poverty, leading to a cascade of events that intensify the exploitation of forest resources, thus fueling a cycle of disease emergence [124]. Firstly, health crises cause widespread job loss and income reduction, particularly in countries lacking robust social safety nets. Impacted communities often turn to forests for sustenance, driving unsustainable practices like deforestation, wood extraction, hunting, and gathering non-timber products [125]. Secondly, disrupted food supply chains heighten food insecurity, prompting reliance on forests for immediate needs like food, medicine, and construction materials, further straining resources [126]. Thirdly, weakened governance during health crises fosters illegal exploitation of forests, including wildlife trade, increasing the risk of zoonotic disease transmission. These pressures alter ecosystems, disturb wildlife habitats, and heighten human–wildlife interactions, facilitating pathogen transmission and fostering new disease outbreaks [127]. To disrupt this cycle, multifaceted interventions are necessary, addressing socioeconomic vulnerabilities, promoting sustainable practices, and enhancing governance to safeguard both human health and forest ecosystems [128,129].

5. Conclusions

By combining landscape ecology analysis tools with remote sensing and geographic information systems (GIS), this study analyzed landscape changes in the Lubumbashi Charcoal Production Basin (LCPB) from May 2019 to November 2023. Due to rapid population growth and economic disruptions caused by the COVID-19 pandemic, the study area experienced significant spatial changes, notably a continuous decrease in forest cover. However, this reduction was slower between November 2019 and September 2020, during the initial phase of COVID-19 pandemic-related lockdowns. This period also witnessed a substantial loss of forests on the outskirts of Lubumbashi city. Attrition and dissection of forest patches led to a landscape imbalance, paving the way for alternative land cover that expanded their footprint. Consequently, the level of landscape spatial pattern and composition changes intensified, indicating the growing impact of human activity on natural ecosystems. Finally, our results revealed that forest cover loss is notably more pronounced in the vicinity of Lubumbashi city and the northern zone of the LCPB. The observed spatial changes in forest cover, particularly during the initial COVID-19 lockdowns, underscore the critical link between human activities and ecosystem resilience. These findings highlight the urgent need for proactive biodiversity conservation measures and ecosystem restoration efforts, especially in areas experiencing rapid urbanization and landscape imbalance. Stakeholders, including policymakers, conservation organizations, and local communities, should prioritize strategies such as habitat restoration, green infrastructure development, and sustainable land use practices to mitigate further forest cover loss and promote ecosystem resilience.

Author Contributions

Y.U.S.: conceptualization, methodology and writing—original draft preparation; M.M.M.: conceptualization, methodology and writing—original draft preparation, I.K.M.: data curation and writing—review and editing; H.K.M., D.-d.N.N., N.K.M., F.M.K., D.D.D.M. and F.M.: writing—review and editing; J.B.: supervision, writing—original draft and funding acquisition. All authors have read and agreed to the published version of the manuscript.

Funding

This research was funded by the program ARES-CCD COOP-CONV-21-519 (Belgium).

Data Availability Statement

All the data presented in this study are available in this manuscript.

Acknowledgments

The authors would like to thank the development research project “Capacity building for the sustainable management of the miombo clear forest through the assessment of the environmental impact of charcoal production and the improvement of forest resource management practices (CHARLU)” and all the customary authorities for the facilities provided.

Conflicts of Interest

The authors state that the research was conducted without any commercial or financial relationships that could be interpreted as a potential conflict of interest.

References

  1. Brockerhoff, E.G.; Barbaro, L.; Castagneyrol, B.; Forrester, D.I.; Gardiner, B.; González-Olabarria, J.R.; Lyver, P.O.B.; Meurisse, N.; Oxbrough, A.; Taki, H.; et al. Forest biodiversity, ecosystem functioning and the provision of ecosystem services. Biodivers. Conserv. 2017, 26, 3005–3035. [Google Scholar] [CrossRef]
  2. Cooper, L.; MacFarlane, D. Climate-Smart Forestry: Promise and risks for forests, society, and climate. PLoS Clim. 2023, 2, e0000212. [Google Scholar] [CrossRef]
  3. Sukara, E. Tropical Forest Biodiversity to Provide Food, Health and Energy Solution of the Rapid Growth of Modern Society. Procedia Environ. Sci. 2014, 20, 803–808. [Google Scholar] [CrossRef]
  4. Useni, S.Y.; Malaisse, F.; Yona, J.M.; Mwamba, T.M.; Bogaert, J. Diversity, use and management of household-located fruit trees in two rapidly developing towns in Southeastern D.R. Congo. Urban For. Urban Green. 2021, 63, 127220. [Google Scholar] [CrossRef]
  5. Friedlingstein, P.; O’sullivan, M.; Jones, M.W.; Andrew, R.M.; Gregor, L.; Hauck, J.; Le Quéré, C.; Luijkx, I.T.; Olsen, A.; Peters, G.P.; et al. Global carbon budget 2022. Earth Syst. Sci. Data Discuss. 2022, 14, 4811–4900. [Google Scholar] [CrossRef]
  6. UN: United Nations Department of Economic and Social Affairs, 2021. The Global Forest Goals Report 2021. Sales No.: E. 21. IV. 3. Available online: https://www.un.org/en/desa/global-forest-goals-report-2021 (accessed on 10 March 2024).
  7. FAO; UNEP. The State of the World’s Forests 2020. In Forests, Biodiversity and People; FAO: Rome, Italy, 2020. [Google Scholar] [CrossRef]
  8. Vancutsem, C.; Achard, F.; Pekel, J.F.; Vieilledent, G.; Carboni, S.; Simonetti, D.; Gallego, J.; Aragao, L.E.; Nasi, R. Long-term (1990–2019) monitoring of forest cover changes in the humid tropics. Sci. Adv. 2001, 7, eabe1603. [Google Scholar] [CrossRef]
  9. FAO. Global Forest Resources Assessment (FRA); FAO: Rome, Italy, 2020. [Google Scholar] [CrossRef]
  10. Mulatu, K.A.; Mora, B.; Kooistra, L.; Herold, M. Biodiversity Monitoring in Changing Tropical Forests: A Review of Approaches and New Opportunities. Remote Sens. 2017, 9, 1059. [Google Scholar] [CrossRef]
  11. Curtis, P.G.; Slay, C.M.; Harris, N.L.; Tyukavina, A.; Hansen, M.C. Classifying drivers of global forest loss. Science 2018, 361, 1108–1111. [Google Scholar] [CrossRef] [PubMed]
  12. Zahawi, R.A.; Reid, J.L.; Fagan, M.E. Potential impacts of COVID-19 on tropical forest recovery. Biotropica 2020, 52, 803–807. [Google Scholar] [CrossRef]
  13. López-Feldman, A.; Chávez, C.; Vélez, M.A.; Bejarano, H.; Chimeli, A.B.; Féres, J.; Robalino, J.; Salcedo, R.; Viteri, C. Environmental impacts and policy responses to COVID-19: A view from Latin America. Environ. Resour. Econ. 2020, 13, 1–6. [Google Scholar] [CrossRef]
  14. Céspedes, J.; Sylvester, J.M.; Pérez-Marulanda, L.; Paz-Garcia, P.; Reymondin, L.; Khodadadi, M.; Tello, J.J.; Castro-Nunez, A. Has global deforestation accelerated due to the COVID-19 pandemic? J. For. Res. 2023, 34, 1153–1165. [Google Scholar] [CrossRef] [PubMed]
  15. Couch, K.A.; Fairlie, R.W.; Xu, H. Early evidence of the impacts of COVID-19 on minority unemployment. J. Public Econ. 2020, 192, 104287. [Google Scholar] [CrossRef] [PubMed]
  16. de Oliveira, P.C. Ethnophytomedicine in the Amazon: A Future Threatened by Deforestation and COVID-19 Pandemic. Biomed. J. Sci. Tech. Res. 2021, 33, 26121–26122. [Google Scholar] [CrossRef]
  17. FAO. Latin American and Caribbean Forestry. 2021. Available online: https://www.fao.org/3/cb6027en/cb6027en.pdf (accessed on 1 March 2024).
  18. Eba’a Atyi, R.; Hiol Hiol, F.; Lescuyer, G.; Mayaux, P.; Defourny, P.; Bayol, N.; Nasi, R. Les forêts du Bassin du Congo: État des Forêts; CIFOR: Bogor, Indonésie, 2021. [Google Scholar] [CrossRef]
  19. Potapov, P.V.; Turubanova, S.A.; Hansen, M.C.; Adusei, B.; Broich, M.; Altstt, A.; Mane, L.; Justice, C.O. Quantifying forest cover loss in Democratic Republic of the Congo, 2000–2010, with Landsat ETM+data. Remote Sens. Environ. 2012, 122, 106–116. [Google Scholar] [CrossRef]
  20. Malaisse, F. How to Live and Survive in Zambezian Open Forest (Miombo Ecoregion); Les presses agronomiques de Gembloux: Gembloux, Belgium, 2010. [Google Scholar]
  21. Useni, S.Y.; Malaisse, F.; Kaleba, S.C.; Kankumbi, F.M.; Bogaert, J. Le rayon de déforestation autour de la ville de Lubumbashi (Haut-Katanga, RD Congo): Synthèse. Tropicultura 2017, 35, 215–221. [Google Scholar]
  22. Useni, S.Y.; Muteya, H.K.; Bogaert, J. Miombo woodland, an ecosystem at risk of disappearance in the Lufira Biosphere Reserve (Upper Katanga, DR Congo)? A 39-years analysis based on Landsat images. Glob. Ecol. Conserv. 2020, 24, e01333. [Google Scholar] [CrossRef]
  23. Cabala, K.S.; Sikuzani, Y.U.; Yamba, A.M.; Kankumbi, F.M.; Bogaert, J. Activités anthropiques et dynamique des écosystèmes forestiers dans les zones territoriales de l’Arc Cuprifère Katangais (RD Congo). Tropicultura 2022, 40, 27. [Google Scholar] [CrossRef]
  24. Khoji, M.K.; N’Tambwe, N.D.-D.; Malaisse, F.; Waselin, S.; Sambiéni, K.R.; Cabala, K.S.; Munyemba, K.F.; Bastin, J.-F.; Bogaert, J.; Useni, S.Y. Quantification and Simulation of Landscape Anthropization around the Mining Agglomerations of Southeastern Katanga (DR Congo) between 1979 and 2090. Land 2022, 11, 850. [Google Scholar] [CrossRef]
  25. Mpanda, M.M.; Muteya, H.K.; Nghonda, D.-D.N.; Sambiéni, K.R.; Malaisse, F.; Kaleba, S.C.; Bogaert, J.; Sikuzani, Y.U. Uncontrolled Exploitation of Pterocarpus tinctorius Welw. and Associated Landscape Dynamics in the Kasenga Territory: Case of the Rural Area of Kasomeno (DR Congo). Land 2022, 11, 1541. [Google Scholar] [CrossRef]
  26. N’tambwe Nghonda, D.-d.; Muteya, H.K.; Kashiki, B.K.W.N.; Sambiéni, K.R.; Malaisse, F.; Sikuzani, Y.U.; Kalenga, W.M.; Bogaert, J. Towards an Inclusive Approach to Forest Management: Highlight of the Perception and Participation of Local Communities in the Management of miombo Woodlands around Lubumbashi (Haut-Katanga, D.R. Congo). Forests 2023, 14, 687. [Google Scholar] [CrossRef]
  27. Happi, C.T.; Nkengasong, J.N. Two years of COVID-19 in Africa: Lessons for the world. Nature 2022, 601, 22–25. [Google Scholar]
  28. Murewanhema, G.; Dzinamarira, T. The COVID-19 Pandemic: Public Health Responses in Sub-Saharan Africa. Int. J. Environ. Res. Public Health 2022, 19, 4448. [Google Scholar] [CrossRef] [PubMed]
  29. Mukendi, N.K.; Muteya, H.K.; Nghonda, D.-d.N.; Berti, F.; Useni, S.Y.; Ndjibu, L.N.; Mbay, J.-P.K.; Fyama, J.N.M.; Lebailly, P.; Bogaert, J. Quantification and Determinants of Carbonization Yield in the Rural Zone of Lubumbashi, DR Congo: Implications for Sustainable Charcoal Production. Forests 2024, 15, 554. [Google Scholar] [CrossRef]
  30. Khoji, M.H.; Nghonda, D.-d.N.; Kalenda, F.M.; Strammer, H.; Kankumbi, F.M.; Malaisse, F.; Bastin, J.-F.; Sikuzani, Y.U.; Bogaert, J. Mapping and Quantification of Miombo Deforestation in the Lubumbashi Charcoal Production Basin (DR Congo): Spatial Extent and Changes between 1990 and 2022. Land 2023, 12, 1852. [Google Scholar] [CrossRef]
  31. Richiardi, C.; Minciardi, M.R.; Siniscalco, C.; Adamo, M. Cumulative Spatial and Temporal Analysis of Anthropogenic Impacts in the Protected Area of the Gran Paradiso National Park in the NW Alps, Italy. Land 2023, 12, 1124. [Google Scholar] [CrossRef]
  32. Shimabukuro, Y.E.; Arai, E.; Duarte, V.; Jorge, A.; Santos, E.G.D.; Gasparini, K.A.C.; Dutra, A.C. Monitoring deforestation and forest degradation using multi-temporal fraction images derived from Landsat sensor data in the Brazilian Amazon. Int. J. Remote Sens. 2019, 40, 5475–5496. [Google Scholar] [CrossRef]
  33. Foody, G.M. Remote sensing in landscape ecology. Landsc. Ecol. 2023, 38, 2711–2716. [Google Scholar] [CrossRef]
  34. Zaehringer, J.G.; Hett, C.; Ramamonjisoa, B.; Messerli, P. Beyond deforestation monitoring in conservation hotspots: Analysing landscape mosaic dynamics in north-eastern Madagascar. Appl. Geogr. 2016, 68, 9–19. [Google Scholar] [CrossRef]
  35. Kottek, M.; Grieser, J.; Beck, C.; Rudolf, B.; Rubel, F. World map of the Köppen-Geiger climate classification updated. Meteorol. Z. 2006, 15, 259–263. [Google Scholar] [CrossRef]
  36. Kalombo, K.D. Évolution des Eléments du Climat en RDC: Stratégies D’adaptation des Communautés de Base, Face aux Evénements Climatiques de Plus en Plus Fréquents; Éditions Universitaires Européennes: Sarrebruck, Germany, 2016; p. 220. [Google Scholar]
  37. Munyemba, K.F.; Bogaert, J. Anthropisation et dynamique spatiotemporelle de l’occupation du sol dans la région de Lubumbashi entre 1956 et 2009. E-Rev. UNILU 2014, 1, 3–23. [Google Scholar]
  38. Kasongo, L.M.E.; Baert, B.; Ngongo, L.M.; Verdoodt, A.; Van Ranst, E. Esquisse des pédopaysages du Katanga et aperçu sur les potentialités agricoles et activités minières. In Anthropisation des Paysages Katangais; Bogaert, J., Colinet, G., Mahy, G., Eds.; Les Presses Universitaires de Liège—Agronomie: Gembloux, Belgium, 2018; pp. 127–156. [Google Scholar]
  39. Dibwe, M.D. Lubumbashi, Ville Industrielle Attractive et Repulsive (1910–2008); Los Restos de la Pobreza Urbana: Madrid, Spain, 2009. [Google Scholar]
  40. Useni, S.Y.; Kaleba, S.C.; Khonde, C.N.; Mwana, Y.A.; Malaisse, F.; Bogaert, J.; Kankumbi, F.M. Vingt-cinq ans de monitoring de la dynamique spatiale des espaces verts en réponse á (‘urbanisation dans les communes de la ville de Lubumbashi (Haut-Katanga, RD Congo). Tropicultura 2017, 35, 300–311. [Google Scholar]
  41. WorldPop Homa Page. Available online: https://hub.worldpop.org/ (accessed on 4 March 2024).
  42. Main-Knorn, M.; Pflug, B.; Louis, J.; Debaecker, V.; Müller-Wilm, U.; Gascon, F. Sen2Cor for Sentinel-2. In Image and Signal Processing for Remote Sensing; SPIE: Bellingham, WA, USA, 2017; Volume 10427, pp. 37–48. [Google Scholar] [CrossRef]
  43. Misra, G.; Cawkwell, F.; Wingler, A. Status of phenological research using sentinel-2 data: A review. Remote Sens. 2020, 12, 10–14. [Google Scholar] [CrossRef]
  44. Segarra, J.; Buchaillot, M.L.; Araus, J.L.; Kefauver, S.C. Remote sensing for precision agriculture: Sentinel-2 improved features and applications. Agronomy 2020, 10, 641. [Google Scholar] [CrossRef]
  45. Wasniewski, A.; Hoscilo, A.; Zagajewski, B.; Moukétou-Tarazewicz, D. Assessment of sentinel-2 satellite images and random forest classifier for rainforest mapping in Gabon. Forests 2020, 11, 941. [Google Scholar] [CrossRef]
  46. Yin, F.; Lewis, P.E.; Gómez-Dans, J.L. Bayesian atmospheric correction over land: Sentinel-2/MSI and Landsat 8/OLI. Geosci. Model. Dev. 2022, 15, 7933–7976. [Google Scholar] [CrossRef]
  47. Barima, Y.S.S.; Barbier, N.; Bamba, I.; Traoré, D.; Lejoly, J.; Bogaert, J. Dynamique paysagère en milieu de transition forêt-savane ivoirienne. Bois For. Trop. 2009, 299, 15. [Google Scholar] [CrossRef]
  48. Useni, S.Y.; Mpanda, M.M.; Malaisse, F.; Kaseya, P.K.; Bogaert, J. The Spatiotemporal Changing Dynamics of Miombo Deforestation and Illegal Human Activities for Forest Fire in Kundelungu National Park, Democratic Republic of the Congo. Fire 2023, 6, 174. [Google Scholar] [CrossRef]
  49. Useni, S.Y.; Mpanda, M.M.; Khoji, M.H.; Cirezi, C.N.; Malaisse, F.; Bogaert, J. Vegetation Fires in the Lubumbashi Charcoal Production Basin (The Democratic Republic of the Congo): Drivers, Extent and Spatiotemporal Dynamics. Land 2023, 12, 2171. [Google Scholar] [CrossRef]
  50. Noi Phan, T.; Kuch, V.; Lehnert, L.W. Land cover classification using google earth engine and random forest classifier-the role of image composition. Remote Sens. 2020, 12, 2411. [Google Scholar] [CrossRef]
  51. Belgiu, M.; Drăguţ, L. Random forest in remote sensing: A review of applications and future directions. ISPRS J. Photogramm. Remote Sens. 2016, 114, 24–31. [Google Scholar] [CrossRef]
  52. Gorelick, N.; Hancher, M.; Dixon, M.; Ilyushchenko, S.; Thau, D.; Moore, R. Google Earth Engine: Planetary-scale geospatial analysis for everyone. Remote Sens. Environ. 2017, 202, 18–27. [Google Scholar] [CrossRef]
  53. Olofsson, P.; Foody, G.M.; Herold, M.; Stehman, S.V.; Woodcock, C.E.; Wulder, M.A. Good practices for estimating area and assessing accuracy of land change. Remote Sens. Environ. 2014, 148, 42–57. [Google Scholar] [CrossRef]
  54. Hu, J.; Xia, G.-S.; Hu, F.; Zhang, L. A Comparative Study of Sampling Analysis in the Scene Classification of Optical High-Spatial Resolution Remote Sensing Imagery. Remote Sens. 2015, 7, 14988–15013. [Google Scholar] [CrossRef]
  55. O’Neill, R.V.; Krummel, J.R.; Garner, R.H.; Sugihara, G.; Jackson, B.; Deangelis, D.L.; Milne, B.T.; Turner, M.G.; Zygmunt, B.; Christensen, S.W.; et al. Indices of landscape pattern. Landsc. Ecol. 1988, 1, 153–162. [Google Scholar] [CrossRef]
  56. Lamine, S.; Petropoulos, G.P.; Singh, S.K.; Szabó, S.; Bachari, N.E.I.; Srivastava, P.K.; Suman, S. Quantifying land use/land cover spatio-temporal landscape pattern dynamics from Hyperion using SVMs classifier and FRAGSTATS®. Geocarto Int. 2018, 33, 862–878. [Google Scholar] [CrossRef]
  57. Cabala, K.S.; Useni, S.Y.; Mwana, Y.A.; Bogaert, J.; Munyemba, K.F. Analyse structurale de la dynamique forestiere dans la région de I’Arc Cuprifére Katangai I. Pattern Analysis of Forest Dynamics of the Katangese Copper Belt Region in the Democratic Republic of the Congo: II. Complementary Analysis on Forest Fragmentation. Tropicultura 2018, 36, 621–630. [Google Scholar]
  58. Kabuanga, J.M.; Adipalina Guguya, B.; Ngenda Okito, E.; Maestripieri, N.; Saqalli, M.; Rossi, V.; Iyongo Waya Mongo, L. Suivi de l’anthropisation du paysage dans la région forestière de Babagulu, République Démocratique du Congo. VertigO 2020, 20. [Google Scholar] [CrossRef]
  59. Bogaert, J.; Ceulemans, R.; Salvador-Van, E.D. Decision tree algorithm for detection of spatial processes in landscape transformation. Environ. Manag. 2004, 33, 62–73. [Google Scholar] [CrossRef]
  60. de Haulleville, T.; Rakotondrasoa, O.L.; Rakoto Ratsimba, H.; Bastin, J.F.; Brostaux, Y.; Verheggen, F.J.; Rajoelison, G.L.; Malaisse, F.; Poncelet, M.; Haubruge, É.; et al. Fourteen years of anthropization dynamics in the Uapaca bojeri Baill. Forest of Madagascar. Landsc. Ecol. Eng. 2018, 14, 135–146. [Google Scholar] [CrossRef]
  61. Freitas, S.R.; Hawbaker, T.J.; Metzger, J.P. Effects of roads, topography, and land use on forest cover dynamics in the Brazilian Atlantic Forest. For. Ecol. Manag. 2010, 259, 410–417. [Google Scholar] [CrossRef]
  62. Morgan, J.L.; Gergel, S.E.; Coops, N.C. Aerial photography: A rapidly evolving tool for ecological management. Bioscience 2010, 60, 47–59. [Google Scholar] [CrossRef]
  63. Abdi, A.M. Land cover and land use classification performance of machine learning algorithms in a boreal landscape using Sentinel-2 data. GIScience Remote Sens. 2020, 57, 1–20. [Google Scholar] [CrossRef]
  64. Wickham, J.; Riitters, K.H. Influence of high-resolution data on the assessment of forest fragmentation. Landsc. Ecol. 2019, 34, 2169–2182. [Google Scholar] [CrossRef]
  65. Kim, D.H.; Sexton, J.O.; Noojipady, P.; Huang, C.; Anand, A.; Channan, S.; Feng, M.; Townshend, J.R. Global, Landsat-based forest-cover change from 1990 to 2000. Remote Sens. Environ. 2014, 155, 178–193. [Google Scholar] [CrossRef]
  66. López-Serrano, P.M.; Corral-Rivas, J.J.; Díaz-Varela, R.A.; Álvarez-González, J.G.; López-Sánchez, C.A. Evaluation of radiometric and atmospheric correction algorithms for aboveground forest biomass estimation using landsat 5 TM data. Remote Sens. 2016, 8, 369. [Google Scholar] [CrossRef]
  67. McGarigal, K.; Cushman, S.A.; Neel, M.C.; Ene, E. FRAGSTATS Version 2: Spatial Pattern Analysis Program for Categorical Maps; Computer software program produced by the authors at the University of Massachusetts, Amherst; University of Massachusetts: Amherst, MA, USA, 2002. [Google Scholar]
  68. Zuluaga, S.; Speziale, K.; Lambertucci, S.A. Global Aerial Habitat Conservation Post-COVID-19 Anthropause. Trends Ecol. Evol. 2021, 36, 273–277. [Google Scholar] [CrossRef]
  69. Jacobs, C.; Kyamusugulwa, P.M.; Katembera, R.S.; Kintuntu, H. Containing COVID-19 in the Democratic Republic of the Congo: Government Measures and Women’s Compliance. J. Afr. Law 2021, 65, 287–310. [Google Scholar] [CrossRef]
  70. Duguma, L.A.; van Noordwijk, M.; Minang, P.A.; Muthee, K. COVID-19 pandemic and agroecosystem resilience: Early insights for building better futures. Sustainability 2021, 13, 1278. [Google Scholar] [CrossRef]
  71. Vroh, B.T.A. Plant species used in traditional medicine against the main symptoms of COVID-19 in sub-saharan Africa: Literature review. Ethnobot. Res. Appl. 2020, 20, 1–14. [Google Scholar] [CrossRef]
  72. Ferrannini, A.; Barbieri, E.; Biggeri, M.; Di Tommaso, M.R. Industrial policy for sustainable human development in the post-COVID19 era. World Dev. 2021, 137, 105215. [Google Scholar] [CrossRef]
  73. Assefa, N.; Soura, A.; Hemler, E.C.; Korte, M.L.; Wang, D.; Abdullahi, Y.Y.; Lankoande, B.; Millogo, O.; Chukwu, A.; Workneh, F.; et al. COVID-19 knowledge, perception, preventive measures, stigma, and mental health among healthcare workers in three Sub-Saharan African countries: A phone survey. Am. J. Trop. Med. Hyg. 2021, 105, 342–350. [Google Scholar] [CrossRef]
  74. Mulumbati, M.C.; Godoy Jara, M.; Baboy Longanza, L.; Bogaert, J.; Werbrouck, S.; Sikuzani, Y.U.; Mazinga Kwey, M. In Vitro Regeneration Protocol for Securidaca longepedunculata Fresen., a Threatened Medicinal Plant within the Region of Lubumbashi (Democratic Republic of the Congo). Conservation 2023, 3, 411–425. [Google Scholar] [CrossRef]
  75. Lawler, O.K.; Allan, H.L.; Baxter, P.W.J.; Castagnino, R.; Tor, M.C.; Dann, L.E.; Hungerford, J.; Karmacharya, D.; Lloyd, T.J.; López-Jara, M.J.; et al. The COVID-19 pandemic is intricately linked to biodiversity loss and ecosystem health. Lancet Planet. Health 2021, 5, e840–e850. [Google Scholar] [CrossRef]
  76. Chuimika, M.M.; Tshomba, K.J.; Bakari, A.S.; Useni, S.Y.; Werbrouck, S.; Mazinga, M.K. Causes de la disparition des plantes médicinales du Miombo Katangais (RD Congo): Cas du commerce non conventionnel de Securidaca longepedunculata Fresen (Polygalaceae). Rev. Afr. Environ. Agr. 2023, 6, 98–107. [Google Scholar]
  77. Ngamsou Abdel, K.; Mala, W.A.; Chimi, P.M.; Funwi, F.P.; Engoulou, C.; Messi Effa, J.A.; Kamdem, M.E.K.; Djonko, F.N.; Fokoua, U.L.; Adounga, S.B.; et al. Ethnobotanical study and vulnerability of medicinal plants used against the symptoms of COVID-19 in the Lomié subdivision, East Region of Cameroon. Heliyon 2024, 10, e28247. [Google Scholar] [CrossRef] [PubMed]
  78. Attah, A.F.; Fagbemi, A.A.; Olubiyi, O.; Dada-Adegbola, H.; Oluwadotun, A.; Elujoba, A.; Babalola, C.P. Therapeutic Potentials of Antiviral Plants Used in Traditional African Medicine with COVID-19 in Focus: A Nigerian Perspective. Front. Pharmacol. 2021, 12, 596855. [Google Scholar] [CrossRef]
  79. de Sousa, C.; Fatoyinbo, L.; Honzák, M.; Wright, T.M.; Murillo Sandoval, P.J.; Whapoe, Z.E.; Yonmah, J.; Olatunji, E.T.; Garteh, J.; Stovall, A.; et al. Two decades of land cover change and forest fragmentation in Liberia: Consequences for the contribution of nature to people. Conserv. Sci. Pract. 2023, 5, e12933. [Google Scholar] [CrossRef]
  80. Bogaert, J.; Barima, Y.S.S.; Iyongo, W.M.L.; Bamba, I.; Mama, A.; Toy, M.; Lafortezza, R. Forest fragmentation: Causes, ecological impacts, and implications for landscape management. In Landscape Ecology in Forest Management and Conservation; Li, C., Lafortezza, R., Chen, J., Eds.; Springer: Beijing, China; Berlin/Heidelberg, Germany, 2011; pp. 273–296. [Google Scholar]
  81. Diss, L. Nouveau code forestier de la République Démocratique du Congo. Une mise en œuvre potentielle des obligations internationales relatives à la protection de l’environnement et des droits de l’homme. Groupe de Travail Forêts/Rainforest Foundation, Kinshasa, République Démocratique du Congo, 2003; p29. Available online: http://archive.niza.nl/docs/200501181555158325.pdf (accessed on 4 March 2024).
  82. Hoefsloot, H. Evaluation à mi-parcours indépendante du processus national de préparation à la REDD+ en RDC. Kinshasa-Arnhem (Pays Bas). 2012. Available online: https://www.forestpeoples.org/sites/default/files/publication/2013/05/rapport-d-evaluation-independent-mi-parcours-du-processus-redd-en-rdc-juin-2012-version-2-final.pdf (accessed on 4 March 2024).
  83. Funke, M.; Ho, T.K.; Tsang, A. Containment measures during the COVID pandemic: The role of non-pharmaceutical health policies. J. Policy Model. 2023, 45, 90–102. [Google Scholar] [CrossRef]
  84. FAO. Évaluation Finale du Projet «Gestion Communautaire des Forêts Miombo dans le Sud-Est du Katanga»; Série évaluation de projet; FAO: Rome, Italy, 2023. [Google Scholar] [CrossRef]
  85. Ellis, E.A.; Romero Montero, J.A.; Hernández Gómez, I.U. Deforestation processes in the state of quintana roo, mexico: The role of land use and community forestry. Trop. Conserv. Sci. 2017, 10, 1940082917697259. [Google Scholar] [CrossRef]
  86. Santika, T.; Meijaard, E.; Budiharta, S.; Law, E.A.; Kusworo, A.; Hutabarat, J.A.; Indrawan, T.P.; Struebig, M.; Raharjo, S.; Huda, I.; et al. Community forest management in Indonesia: Avoided deforestation in the context of anthropogenic and climate complexities. Glob. Environ. Chang. 2017, 46, 60–71. [Google Scholar] [CrossRef]
  87. Pouliot, M.; Treue, T. Rural People’s Reliance on Forests and the Non-Forest Environment in West Africa: Evidence from Ghana and Burkina Faso. World Dev. 2013, 43, 180–193. [Google Scholar] [CrossRef]
  88. Juniyanti, L.; Purnomo, H.; Kartodihardjo, H.; Prasetyo, L.B. Understanding the Driving Forces and Actors of Land Change Due to Forestry and Agricultural Practices in Sumatra and Kalimantan: A Systematic Review. Land 2021, 10, 463. [Google Scholar] [CrossRef]
  89. Sola, P.; Schure, J.; Eba’a Atyi, R.; Gumbo, D.; Okeyo, I.; Awono, A. Woodfuel policies and practices in selected countries in Sub-Saharan Africa—A critical review. Bois For. Trop. 2019, 340, 5–19. [Google Scholar] [CrossRef]
  90. Kabulu, D.J.-P.; Vranken, I.; Bastin, J.-F.; Malaisse, F.; Nyembwe, N.S.; Useni, S.Y.; Ngongo, L.M.; Bogaert, J. Approvisionnement En Charbon de Bois Des Ménages Lushois: Quantités, Alternatives et Conséquences. In Anthropisation des Paysages Katangais; Bogaert, J., Colinet, G., Mahy, G., Eds.; Presses Universitaires de Liège: Liège, Belgium, 2018; pp. 297–311. [Google Scholar]
  91. Trefon, T.; Kabuyaya, N. Les espaces périurbains en Afrique centrale. In Territoires Périurbains: Développement, Enjeux et Perspectives dans les Pays du Sud; les Presses Agronomiques de Gembloux: Gembloux, Belgium, 2015; pp. 33–42. [Google Scholar]
  92. Useni, S.Y.; Sambiéni, K.R.; Maréchal, J.; Ilunga wa Ilunga, E.; Malaisse, F.; Bogaert, J.; Munyemba, K.F. Changes in the Spatial Pattern and Ecological Functionalities of Green Spaces in Lubumbashi (the Democratic Republic of Congo) in Relation with the Degree of Urbanization. Trop. Conserv. Sci. 2018, 11, 194008291877132. [Google Scholar] [CrossRef]
  93. Karlson, M.; Mörtberg, U.; Balfors, B. Road ecology in environmental impact assessment. Environ. Impact Assess. Rev. 2014, 48, 10–19. [Google Scholar] [CrossRef]
  94. Branch, A.; Agyei, F.K.; Anai, J.G.; Apecu, S.L.; Bartlett, A.; Brownell, E.; Caravani, M.; Cavanagh, C.J.; Fennell, S.; Langole, S.; et al. From crisis to context: Reviewing the future of sustainable charcoal in Africa. Energy Res. Soc. Sci. 2022, 87, 102457. [Google Scholar] [CrossRef]
  95. Useni, S.Y.; Khoji, M.H.; Langunu, S.; Gerardy, A.; Bogaert, J. Amplification of Anthropogenic Pressure Heavily Hampers Natural Ecosystems Regeneration within the Savanization Halo Around Lubumbashi City (Democratic Republic of Congo). Int. J. Environ. Sci. Nat. Res. 2019, 17, 555958. [Google Scholar] [CrossRef]
  96. Li, M.; De Pinto, A.; Ulimwengu, J.M.; You, L.; Robertson, R.D. Impacts of road expansion on deforestation and biological carbon loss in the Democratic Republic of Congo. Environ. Resou. Econom. 2015, 60, 433–469. [Google Scholar] [CrossRef]
  97. Bogaert, J.; Vranken, I.; André, M. Anthropogenic effects in landscapes: Historical context and spatial pattern. In Biocultural Landscapes. Diversity, Functions and Values; Hong, S.K., Bogaert, J., Min, Q., Eds.; Springer: Dordrecht, The Netherlands, 2014; pp. 89–112. [Google Scholar]
  98. Cabala, K.S.; Useni, S.Y.; Sambieni, K.R.; Bogaert, J.; Munyemba, K.F. Dynamique des écosystèmes forestiers de l’Arc Cuprifère Katangais en République Démocratique du Congo. Causes, Transformations spatiales et ampleur. Tropicultura 2017, 35, 192–202. [Google Scholar]
  99. Haddad, N.M.; Brudvig, L.A.; Clobert, J.; Davies, K.F.; Gonzalez, A.; Holt, R.D.; Lovejoy, T.E.; Sexton, J.O.; Austin, M.P.; Collins, C.D.; et al. Habitat fragmentation and its lasting impact on Earth’s ecosystems. Sci. Adv. 2015, 1, e1500052. [Google Scholar] [CrossRef]
  100. Laurance, W.F.; Camargo, J.L.; Luizão, R.C.; Laurance, S.G.; Pimm, S.L.; Bruna, E.M.; Stouffer, P.C.; Williamson, G.B.; Benítez-Malvido, J.; Vasconcelos, H.L.; et al. The fate of Amazonian forest fragments: A 32-year investigation. Biol. Conserv. 2011, 144, 56–67. [Google Scholar] [CrossRef]
  101. Bodo, T.; Gimah, B.G.; Seomoni, K.J. Deforestation and habitat loss: Human causes, consequences and possible solutions. J. Geogr. Res. 2021, 4, 22–30. [Google Scholar] [CrossRef]
  102. Fischer, R.; Taubert, F.; Müller, M.S.; Groeneveld, J.; Lehmann, S.; Wiegand, T.; Huth, A. Accelerated forest fragmentation leads to critical increase in tropical forest edge area. Sci. Adv. 2021, 7, eabg7012. [Google Scholar] [CrossRef] [PubMed]
  103. Sloan, S.; Sayer, J.A. Forest Resources Assessment of 2015 shows positive global trends but forest loss and degradation persist in poor tropical countries. For. Ecol. Manag. 2015, 352, 134–145. [Google Scholar] [CrossRef]
  104. Varotsos, C.A.; Krapivin, V.F. A new big data approach based on geoecological information-modeling system. Big Earth Data 2017, 1, 47–63. [Google Scholar] [CrossRef]
  105. Hengeveld, G.M.; Gunia, K.; Didion, M.; Zudin, S.; Clerkx, A.P.P.M.; Schelhaas, M.J. Global 1-Degree Maps of Forest Area, Carbon Stocks, and Biomass, 1950–2010; ORNL DAAC: Oak Ridge, TN, USA, 2015. [Google Scholar] [CrossRef]
  106. McNicol, I.M.; Keane, A.; Burgess, N.D.; Bowers, S.J.; Mitchard, E.T.; Ryan, C.M. Protected areas reduce deforestation and degradation and enhance woody growth across African woodlands. Commun. Earth Environ. 2023, 4, 392. [Google Scholar] [CrossRef]
  107. Dieng, M.; Mbow, C.; Skole, D.L.; Ba, B. Sustainable land management policy to address land degradation: Linking old forest management practices in Senegal with new REDD+ requirements. Front. Environ. Sci. 2023, 11, 1088726. [Google Scholar] [CrossRef]
  108. Mbuvi, M.T.E.; Kungu, J.B. A transforming traditional community based forest management: The case of Loita community forest, Kenya. Heliyon 2021, 7, e07380. [Google Scholar] [CrossRef] [PubMed]
  109. Abiodun, B.J.; Adeyewa, Z.D.; Oguntunde, P.G.; Salami, A.T.; Ajayi, V.O. Modeling the impacts of reforestation on future climate in West Africa. Theor. Appl. Climatol. 2012, 110, 77–96. [Google Scholar] [CrossRef]
  110. Negi, S.; Pham, T.T.; Karky, B.; Garcia, C. Role of community and user attributes in collective action: Case study of community-based forest management in Nepal. Forests 2018, 9, 136. [Google Scholar] [CrossRef]
  111. Panja, P. Deforestation, Carbon dioxide increase in the atmosphere and global warming: A modelling study. Int. J. Model. Simul. 2021, 41, 209–219. [Google Scholar] [CrossRef]
  112. Tole, L. Reforms from the ground up: A review of community-based forest management in tropical developing countries. Environ. Manag. 2010, 45, 1312–1331. [Google Scholar] [CrossRef]
  113. Li, S.; Xu, M.; Sun, B. Long-term hydrological response to reforestation in a large watershed in southeastern China. Hydrol. Process. 2014, 28, 5573–5582. [Google Scholar] [CrossRef]
  114. Peng, H.; Tague, C.; Jia, Y. Evaluating the eco-hydrologic impacts of reforestation in the Loess Plateau, China, using an eco-hydrologic model. Ecohydrology 2016, 9, 498–513. [Google Scholar] [CrossRef]
  115. Hu, X.; Næss, J.S.; Iordan, C.M.; Huang, B.; Zhao, W.; Cherubini, F. Recent global land cover dynamics and implications for soil erosion and carbon losses from deforestation. Anthropocene 2021, 34, 100291. [Google Scholar] [CrossRef]
  116. Miyamoto, M. Poverty reduction saves forests sustainably: Lessons for deforestation policies. World Dev. 2020, 127, 104746. [Google Scholar] [CrossRef]
  117. Arima, E.Y.; Barreto, P.; Araújo, E.; Soares-Filho, B. Public policies can reduce tropical deforestation: Lessons and challenges from Brazil. Land Use Policy 2014, 41, 465–473. [Google Scholar] [CrossRef]
  118. Musyoki, J.K.; Mugwe, J.; Mutundu, K.; Muchiri, M. Factors influencing level of participation of community forest associations in management forests in Kenya. J. Sustain. For. 2016, 35, 205–216. [Google Scholar] [CrossRef]
  119. Faria, D.; Morante-Filho, J.C.; Baumgarten, J.; Bovendorp, R.S.; Cazetta, E.; Gaiotto, F.A.; Mariano-Neto, E.; Mielke, M.S.; Pessoa, M.S.; Rocha-Santos, L.; et al. The breakdown of ecosystem functionality driven by deforestation in a global biodiversity hotspot. Biol. Conserv. 2023, 283, 110126. [Google Scholar] [CrossRef]
  120. Mpanda, M.M.; Kipili, M.I.; Tshomba, K.J.; Kitabala, M.A.; Cabala, K.S.; Useni, S.Y. Perception de la dégradation de la fertilité des sols et de sa gestion par les agriculteurs de la cité de Kasenga en République Démocratique du Congo. Geo-Eco-Trop 2021, 45, 211–220. [Google Scholar]
  121. Loro, M.; Ortega, E.; Arce, R.M.; Geneletti, D. Ecological connectivity analysis to reduce the barrier effect of roads. An innovative graph-theory approach to define wildlife corridors with multiple paths and without bottlenecks. Landsc. Urban Plan. 2015, 139, 149–162. [Google Scholar] [CrossRef]
  122. Kuglerová, L.; Ågren, A.; Jansson, R.; Laudon, H. towards optimizing riparian buffer zones: Ecological and biogeochemical implications for forest management. For. Ecol. Manag. 2014, 334, 74–84. [Google Scholar] [CrossRef]
  123. Young, N.E.; Evangelista, P.H.; Mengitsu, T.; Leisz, S. Twenty-three years of forest cover change in protected areas under different governance strategies: A case study from Ethiopia’s southern highlands. Land Use Policy 2020, 91, 104426. [Google Scholar] [CrossRef]
  124. Tollefson, J. Why deforestation and extinctions make pandemics more likely. Nature 2020, 584, 175–177. [Google Scholar] [CrossRef]
  125. Gebara, M.F.; May, P.H.; Platais, G. Pandemics, conservation, and human-nature relations. Clim. Chang. Ecol. 2021, 2, 100029. [Google Scholar] [CrossRef]
  126. Pereira, M.; Oliveira, A.M. Poverty and food insecurity may increase as the threat of COVID-19 spreads. Public Health Nutr. 2020, 3, 3236–3240. [Google Scholar] [CrossRef] [PubMed]
  127. Tajudeen, Y.A.; Oladunjoye, I.O.; Bajinka, O.; Oladipo, H.J. Zoonotic Spillover in an Era of Rapid Deforestation of Tropical Areas and Unprecedented Wildlife Trafficking: Into the Wild. Challenges 2022, 13, 41. [Google Scholar] [CrossRef]
  128. Salomon, W.; Useni, S.Y.; Kouakou, A.T.M.; Barima, Y.S.S.; Theodat, J.M.; Bogaert, J. Cartographie et quantification de la perte du couvert forestier dans les parcs nationaux du Sud de la République d’Haïti de 1985 à 2018: Rôle des activités agricoles locales. Int. J. Biol. Chem. Sci. 2021, 15, 477–496. [Google Scholar] [CrossRef]
  129. Berrouet, L.M.; Machado, J.; Villegas-Palacio, C. Vulnerability of socio—Ecological systems: A conceptual Framework. Ecol. Indic. 2018, 84, 632–647. [Google Scholar] [CrossRef]
Figure 1. Location of the study area (A), the Lubumbashi Charcoal Production Basin (LCPB), in southeastern DR Congo (B) within the Upper Katanga province (C). For this study, the LCPB landscape was subdivided into northern zone (~8000 km2), central zone (~12,000 km2) and southern zone (~7000 km2) using socio-economic criteria (population size, economic activities and road network). The densely populated area, including the city of Lubumbashi, forms the center. The moderately populated area with a large road network is the north zone, while the less populated area with a single road connecting it to the city of Lubumbashi is the south zone. Population density estimation on this map was obtained from the WorldPop website [41], based at the University of Southampton.
Resources 13 00095 g001
Figure 2. Evaluation device used to measure the effect of distance from the city of Lubumbashi on forest degradation and deforestation.
Resources 13 00095 g002
Figure 3. Mapping of the evolution of land cover within the LCPB for May 2019, November 2019, July 2020, September 2020, May 2021, May 2022, November 2022, May 2023 and November 2023, obtained through the “Random Forest” classifier. May 2019 and November 2019 correspond to ‘the pre-COVID-19 era’; July 2020, September 2020, May 2021, May 2022, and September 2022 correspond to ‘the concurrent pandemic phase’. May 2023 and November 2023 correspond to ‘the post-pandemic era’.
Resources 13 00095 g003
Figure 4. Temporal dynamics of forest cover changes in the LCPB: evolution of forest cover in the LCPB between May 2019 and November 2023 (a); evolution of the monthly forest loss (b); proportion of forest in the landscape before, during and after COVID-19 pandemic (c). May 2019 and November 2019 correspond to ‘the pre-COVID-19 era’; July 2020, September 2020, May 2021, May 2022, and September 2022 correspond to ‘the concurrent pandemic phase’. May 2023 and November 2023 correspond to ‘the post-pandemic era’.
Resources 13 00095 g004
Figure 5. The variation in forest area (%) based on distance from the city of Lubumbashi between November 2019 and November 2023. Distance from Lubumbashi plays a crucial role in the deforestation in the LCPB. May 2019 and November 2019 correspond to ‘the pre-COVID-19 era’; July 2020, September 2020, May 2021, May 2022, and September 2022 correspond to ‘the concurrent pandemic phase’. May 2023 and November 2023 correspond to ‘the post-pandemic era’.
Resources 13 00095 g005
Figure 6. Evolution of forest cover between November 2019 and November 2023 in the 3 zones of the Lubumbashi charcoal production basin ((a) = north zone, (b) = south zone and (c) = central zone). May 2019 and November 2019 correspond to ‘the pre-COVID-19 era’; July 2020, September 2020, May 2021, May 2022, and September 2022 correspond to ‘the concurrent pandemic phase’. May 2023 and November 2023 correspond to ‘the post-pandemic era’.
Resources 13 00095 g006
Table 1. Illustration and identification of the spatial landscape transformation processes. The parameters PN0, CA0, and CP0 indicate the number of patches, class area, and class perimeter before changes, respectively, while PN1, CA1, and CP1 are the corresponding values after the pattern change. Based on the work of Bogaert et al. [59].
Spatial Transformation ProcessIllustrationIdentification
1PerforationResources 13 00095 i001PN1 = PN0; CA1 < CA0; CP1 > CP0
2DissectionResources 13 00095 i002PN1 > PN0; CA1 < CA0
3FragmentationResources 13 00095 i003PN1 > PN0; CA1 << CA0
4AttritionResources 13 00095 i004PN1 < PN0; CA1 < CA0
5ShrinkageResources 13 00095 i005PN1 = PN0; CA1 < CA0; CP1 ≤ CP2
6ShiftResources 13 00095 i006PN1 = PN0; CA1 = CA0; CP1 = CP2
7DeformationResources 13 00095 i007PN1 ≠ PN0; CA1 = CA0; CP1 = CP2
8CreationResources 13 00095 i008PN1 > PN0; CA1 > CA0
9EnlargementResources 13 00095 i009PN1 = PN0; CA1 > CA0
10AggregationResources 13 00095 i010PN1 < PN0; CA1 > CA0
Table 2. Accuracy assessment and for the land cover and land cover change map based on the Sentinel-2 image supervised classification using the random forest classifier. May 2019 and November 2019 correspond to ‘the pre-COVID-19 era’; July 2020, September 2020, May 2021, May 2022, and September 2022 correspond to ‘the concurrent pandemic phase’. May 2023 and November 2023 correspond to ‘the post-pandemic era’.
PeriodLand Cover Strata
May 2019–November 2019ForestForest GainForest LossNon-Forest
Prod. acc.100.0%87.0%100.0%100.0%
User acc.98.7%100.0%100.0%100.0%
Overall acc.99.3%
November 2019–July 2020ForestForest gainForest lossNon-forest
Prod. acc.100.0%100.0%97.0%100.0%
User acc.99.6%100.0%100.0%100.0%
Overall acc.99.8%
July 2020–September 2020ForestForest gainForest lossNon-forest
Prod. acc.100.0%98.8%94.1%100.0%
User acc.98.8%100.0%100.0%99.8%
Overall acc.99.4%
September 2020–May 2021ForestForest gainForest lossNon-forest
Prod. acc.100.0%100.0%99.2%100.0%
User acc.99.8%100.0%100.0%100.0%
Overall acc.99.9%
May 2021–May 2022ForestForest gainForest lossNon-forest
Prod. acc.100.0%100.0%100.0%100.0%
User acc.100.0%100.0%100.0%100.0%
Overall acc.100.0%
May 2022–November 2022ForestForest gainForest lossNon-forest
Prod. acc.100.0%100.0%100.0%100.0%
User acc.100.0%100.0%100.0%100.0%
Overall acc.100.0%
November 2022–May 2023ForestForest gainForest lossNon-forest
Prod. acc.100.0%98.1%92.5%100.0%
User acc.99.8%100.0%100.0%99.0%
Overall acc.99.4%
May 2023–November 2023ForestForest gainForest lossNon-forest
Prod. acc.100.0%100.0%100.0%100.0%
User acc.100.0%100.0%100.0%100.0%
Overall acc.100.0%
Prod. acc.: producer accuracy; User acc.: user accuracy; Overall acc.: overall accuracy.
Table 3. Land cover class configuration indices in November 2019, July 2020, September 2020, May 2021, May 2022, November 2022, May 2023 and November 2023. LPI: largest patch index (%), CA: class area (km2), MA: mean patch area (km2), NP: number of patches, ED: edge density (m/ha). May 2019 and November 2019 correspond to ‘the pre-COVID-19 era’; July 2020, September 2020, May 2021, May 2022, and September 2022 correspond to ‘the concurrent pandemic phase’. May 2023 and November 2023 correspond to ‘the post-pandemic era’.
DateNPCAMALPIED
May-2019400,858.013,711.46.814.687.3
November-2019733,771.013,654.46.313.688.7
July-2020662,269.013,613.06.915.684.8
September-20201,526,810.013,297.64.513.2116.6
May-2021869,037.012,388.06.211.489.2
May-20221,057,747.011,607.74.910.189.5
November-20221,171,325.010,865.84.110.498.7
May-20231,220,557.010,160.13.49.8108.3
November-20231,168,247.09849.83.78.285.7
Disclaimer/Publisher’s Note: The statements, opinions and data contained in all publications are solely those of the individual author(s) and contributor(s) and not of MDPI and/or the editor(s). MDPI and/or the editor(s) disclaim responsibility for any injury to people or property resulting from any ideas, methods, instructions or products referred to in the content.

