Article

Evaluating Policy Frameworks and Their Role in the Sustainable Growth of Distributed Photovoltaic Generation

by
Annelys Machado Schetinger
* and
André Frossard Pereira de Lucena
Energy Planning Program (PPE/COPPE), Federal University of Rio de Janeiro, Rio de Janeiro 21945970, RJ, Brazil
*
Author to whom correspondence should be addressed.
Resources 2025, 14(2), 28; https://doi.org/10.3390/resources14020028
Submission received: 12 December 2024 / Revised: 16 January 2025 / Accepted: 30 January 2025 / Published: 3 February 2025

Abstract

:
In response to the growing photovoltaic distributed generation market, this study investigates the evolution of energy policies and mechanisms driving the growth of photovoltaic distributed generation (DGPV). Analyzing the top ten countries in photovoltaic installations, it examines historical trends in capacity growth, installation costs, and stakeholder engagement to evaluate policy effectiveness. Eight policy categories are identified as follows: direct financial incentives, energy market regulation, government management, production incentives, performance-based feed-in tariffs, renewable energy obligations, research and development initiatives, and agreements and commitments. The research results emphasize the crucial influence of government management policies, direct financial incentives, and energy market regulation on promoting the growth of DGPV. Political will and effective governance are identified as key drivers in advancing technology and market development. Policies reducing installation costs and encouraging investment support the transition of photovoltaic systems from early adoption to market maturity. Despite these advances, disparities in policy implementation highlight the need for adaptable frameworks tailored to local contexts. By leveraging solar energy, an abundant and universally accessible resource, nations can enhance energy equity through effective policies and accelerate the shift toward sustainable energy systems. This analysis offers valuable insights for policymakers seeking to promote DGPV as a central strategy in combating climate change.

1. Introduction

The fight against climate change has been a prominent topic in the international community since the signing of the Kyoto Protocol [1]. As part of the low-carbon energy transition, photovoltaic (PV) solar energy has emerged as a crucial ally in reducing greenhouse gas emissions [2]. Solar energy offers numerous benefits, including diversifying the energy mix; improving energy security; reducing reliance on foreign energy sources, given it is a cost-effective renewable energy source [3]; and leveraging the universal availability of free solar resources accessible to all [4].
In grid-connected PV systems, inverters convert DC electricity from photovoltaic arrays into AC electricity for the power grid, with efficiency ranging from 95% to 99%. A single inverter can serve the whole array, or multiple inverters can handle specific module strings. These systems provide power to either a customer or the grid, interfacing mainly with distribution networks, though larger installations may connect to transmission grids. Typically, they are located on or integrated into customer premises, usually on the demand side of the electricity meter in residential, commercial, or industrial settings [5]. Figure 1 illustrates a typical DGPV system.
Distributed generation of solar PV (DGPV) energy has gained popularity due to its numerous advantages, including avoiding extensive transmission lines, empowering the consumer, and allowing for architectural integration [6]. Additionally, it offers greater efficiency, flexibility, and energy independence [7]. The DGPV has grown rapidly worldwide in recent years, since the beginning of the 20th century and especially in recent decades [8]. The cost of the technology has continuously fallen, making it more accessible to consumers; therefore, it is being adopted widely by residential, commercial, and industrial consumers [9]. Many countries have developed energy policies encouraging distributed photovoltaic energy generation, including direct financial incentives, energy market regulation, government management, and others [10,11]. As technology increasingly integrates into the power grid, consumers can generate their own energy and supply the excess back to the grid. In many markets, distributed photovoltaic energy generation has reached parity with the grid, becoming a viable economic option for consumers [12]. This accelerated growth is mainly due to the increasing accessibility of technology, mass adoption, and the development of supportive energy policies [13]. The growth of distributed solar generation is expected to continue, driven by cost reductions, increased consumer demand, and government policies aimed at reducing greenhouse gas emissions and promoting energy independence [14,15].
According to [5], Crystalline Silicon (c-Si) represents the predominant technology in the solar cell industry, accounting for more than 98% of total cell production. This category includes Monocrystalline Silicon (Mono-Si), which features higher efficiencies ranging from 20% to 25%, and Multicrystalline Silicon (Multi-Si), which exhibits lower efficiencies, approximately between 18% and 21%, and is gradually being phased out in favor of newer production techniques. Another significant technology employed in this domain is Thin-Film Technologies, which entail the deposition of thin layers of photovoltaic materials such as Micromorph Silicon (μ-Si), Cadmium Telluride (CdTe), and Copper Indium Gallium Selenide (CIGS). Furthermore, organic photovoltaics (OPV) generally demonstrate lower efficiencies, around 14%. Additionally, III-V Compound Semiconductor Cells, including Gallium Arsenide (GaAs), achieve high efficiencies ranging from 25% to 30%, yet their high cost restricts their use primarily to specialized applications such as space technology. Lastly, Perovskite Solar Cells represent an emerging technology that has garnered considerable attention due to its rapid advancements and potential for high efficiency, with tandem cells achieving efficiencies of up to 33.9% in experimental setups. Figure 2 presents a typical representation of photovoltaic cell technologies.
The success of the solar DGPV relies heavily on the support provided by energy policies. Governments are crucial in outlining technological roadmaps and providing financial and regulatory incentives to stimulate technology development and deployment [16,17,18]. These policies help make solar PV distributed generation more accessible and attractive to consumers, reduce financial risk, and promote competitiveness in the sector, leading to the development of more advanced and efficient technologies [19].
China leads in global solar PV manufacturing investment, boosting funding post-2020 amid strong government policies and rising demand. The Asia–Pacific, including India, shows notable growth from efforts to increase domestic production and decrease imports. North America and Europe expand more slowly due to varying market dynamics. Slower growth persists elsewhere, indicating a global transition to renewable energy. Projections to 2027 emphasize ongoing decarbonization and localized supply chains. Figure 3 illustrates solar PV manufacturing capacity investments by region from 2016 to 2027 [20].
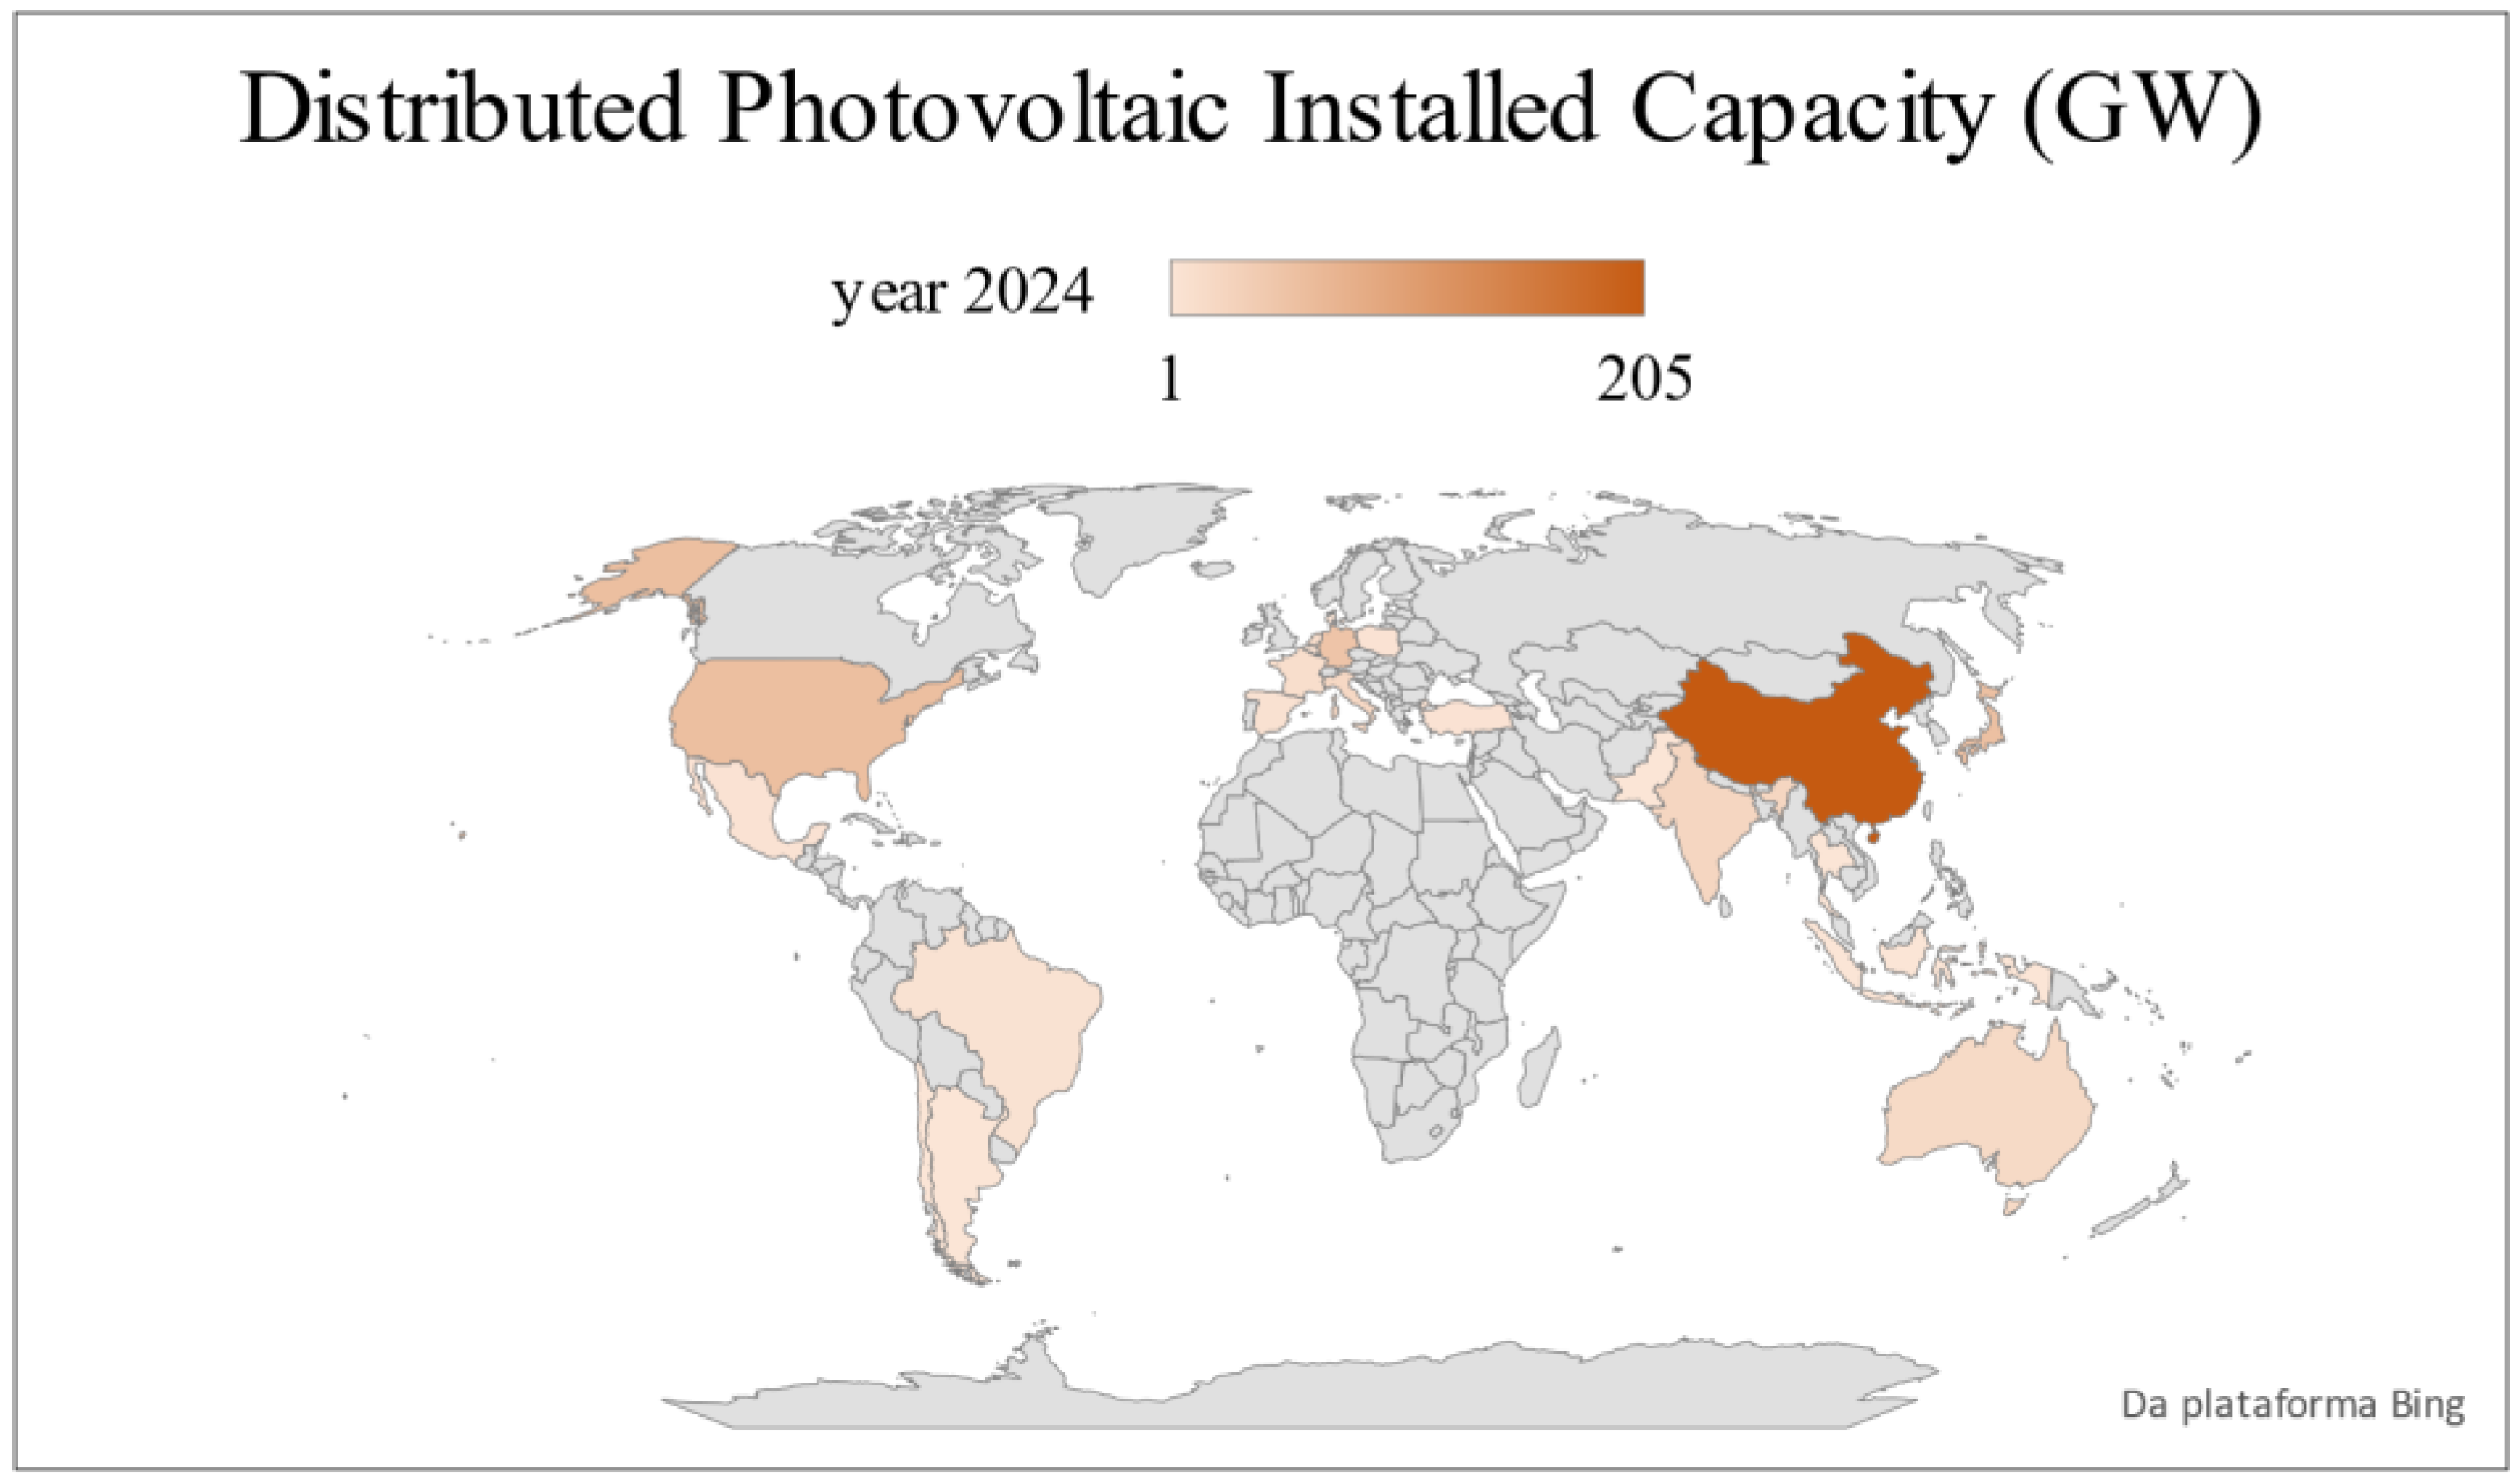
This study aims to analyze the experiences of photovoltaic solar energy in the ten countries where technology had its most significant development and to relate this development to the energy policies adopted, thus assessing the most successful and best-suited policy adopted to encourage the technology. This analysis depends on factors such as the degree of technological maturity in the country, according to the installed capacity; the available capital for investment in this segment; and the political will of the local government to invest in technology. Figure 4 and Figure 5 demonstrate the global advancement of installed capacity in DGPV across the primary nations worldwide that possess a significant value of installed capacity for DGPV. Thus, the installed capacity of utility-scale solar photovoltaic systems has been excluded from this analysis.
The countries that invested the most in this technology and have the highest installed capacity are the subject of this study. According to [8,21], these are as follows: 1. China; 2. Japan; 3. Germany; 4. United States; 5. Italy; 6. Australia; 7. Netherlands; 8. India; 9. France; and 10. Belgium [8]. A survey of the incentives for DGPV policies applied in these 10 countries that stand out in the global scenario is carried out, and these policies are categorized for application in countries that plan to invest in distributed photovoltaic generation technology. An assessment is also made of how the policies have performed and influenced the penetration of DGPV. Finally, guidelines are provided to contribute as an incentive framework for DGPV policies for decision makers.
The importance of this study is found in its contribution to the strategic advancement of DGPV on a global scale. Through the meticulous analysis and categorization of the successful policy frameworks in the ten countries with the largest installed capacities, this research offers a comprehensive guide for developing tailored strategies aligned with regional realities. It enhances the global knowledge base by providing actionable insights into practical policies that can be adapted and replicated across various territorial contexts. Ultimately, this study facilitates the sustainable growth of distributed photovoltaic generation, accelerating the transition to cleaner energy systems, reducing greenhouse gas emissions, and promoting energy independence while effectively addressing distinct local challenges.
This paper is organized as follows: The subsequent section outlines the survey methodology and categorizes the analyzed policies. The third section presents the results of the policy analysis in the ten countries under study, examining growth in installed capacity, installation price trends, stakeholder involvement, and other historical factors influencing policy application. Finally, this study’s insights and conclusions are summarized in the concluding fourth section.

2. Methodology Framework

The research was conducted in two phases. First, a comprehensive bibliographical review of energy policies for DGPV generation is realized, focusing on a specific time frame and selected countries based on the predefined criteria described later. In the second phase, the identified policies are connected with other relevant parameters to characterize their impact, as detailed in the subsequent sections.

2.1. Stage One: Establishing the Analytical Framework for Energy Policy Evaluation

In this section, the parameters guiding the construction of policy frameworks are delineated. This study focuses on grid-connected photovoltaic systems as the primary area of research. DGPV is defined as the generation of electricity from photovoltaic sources, including all components of the system, such as photovoltaic panels, inverters, and other equipment required to produce electrical energy, connected to end-use consumption, such as homes or businesses [22,23]. The scope of this study includes small- to medium-sized power plants, with a capacity ranging from 1 kW to 100 kW, that are connected to the same location as the consumer units. This research aims to understand distributed solar power generation’s technical, economic, and regulatory aspects and their potential impact on the electric power system. Thus, all policies examined herein specifically promote DGPV.
To define the analyzed countries, the research evaluated the global installed capacity of DGPV, focusing on the top 10 countries with the largest capacity, as follows: China, Japan, Germany, USA, Italy, Australia, Netherlands, India, France, and Belgium. This selection ensures a comprehensive geographic diversity study covering Asia, Europe, North America, and Oceania. These nations represent a mix of high-income and emerging economies, providing insights into how economic status impacts DGPV adoption. The selected countries also showcase varying levels of policy maturity, energy market structures, renewable energy targets, and regulatory environments, from established frameworks in Germany and the USA to rapidly evolving systems in China and India. Additionally, technological adoption, incentives, public and political support, and solar resource availability are considered, ensuring a holistic view of the factors influencing DGPV policies. This diverse selection allows us to capture various strategies and outcomes, providing valuable lessons for the global promotion of renewable energy. The policies chosen in these countries can serve as replicable models for other nations with similar economic, regulatory, and geographic characteristics, thereby facilitating the global adoption and success of DGPV.
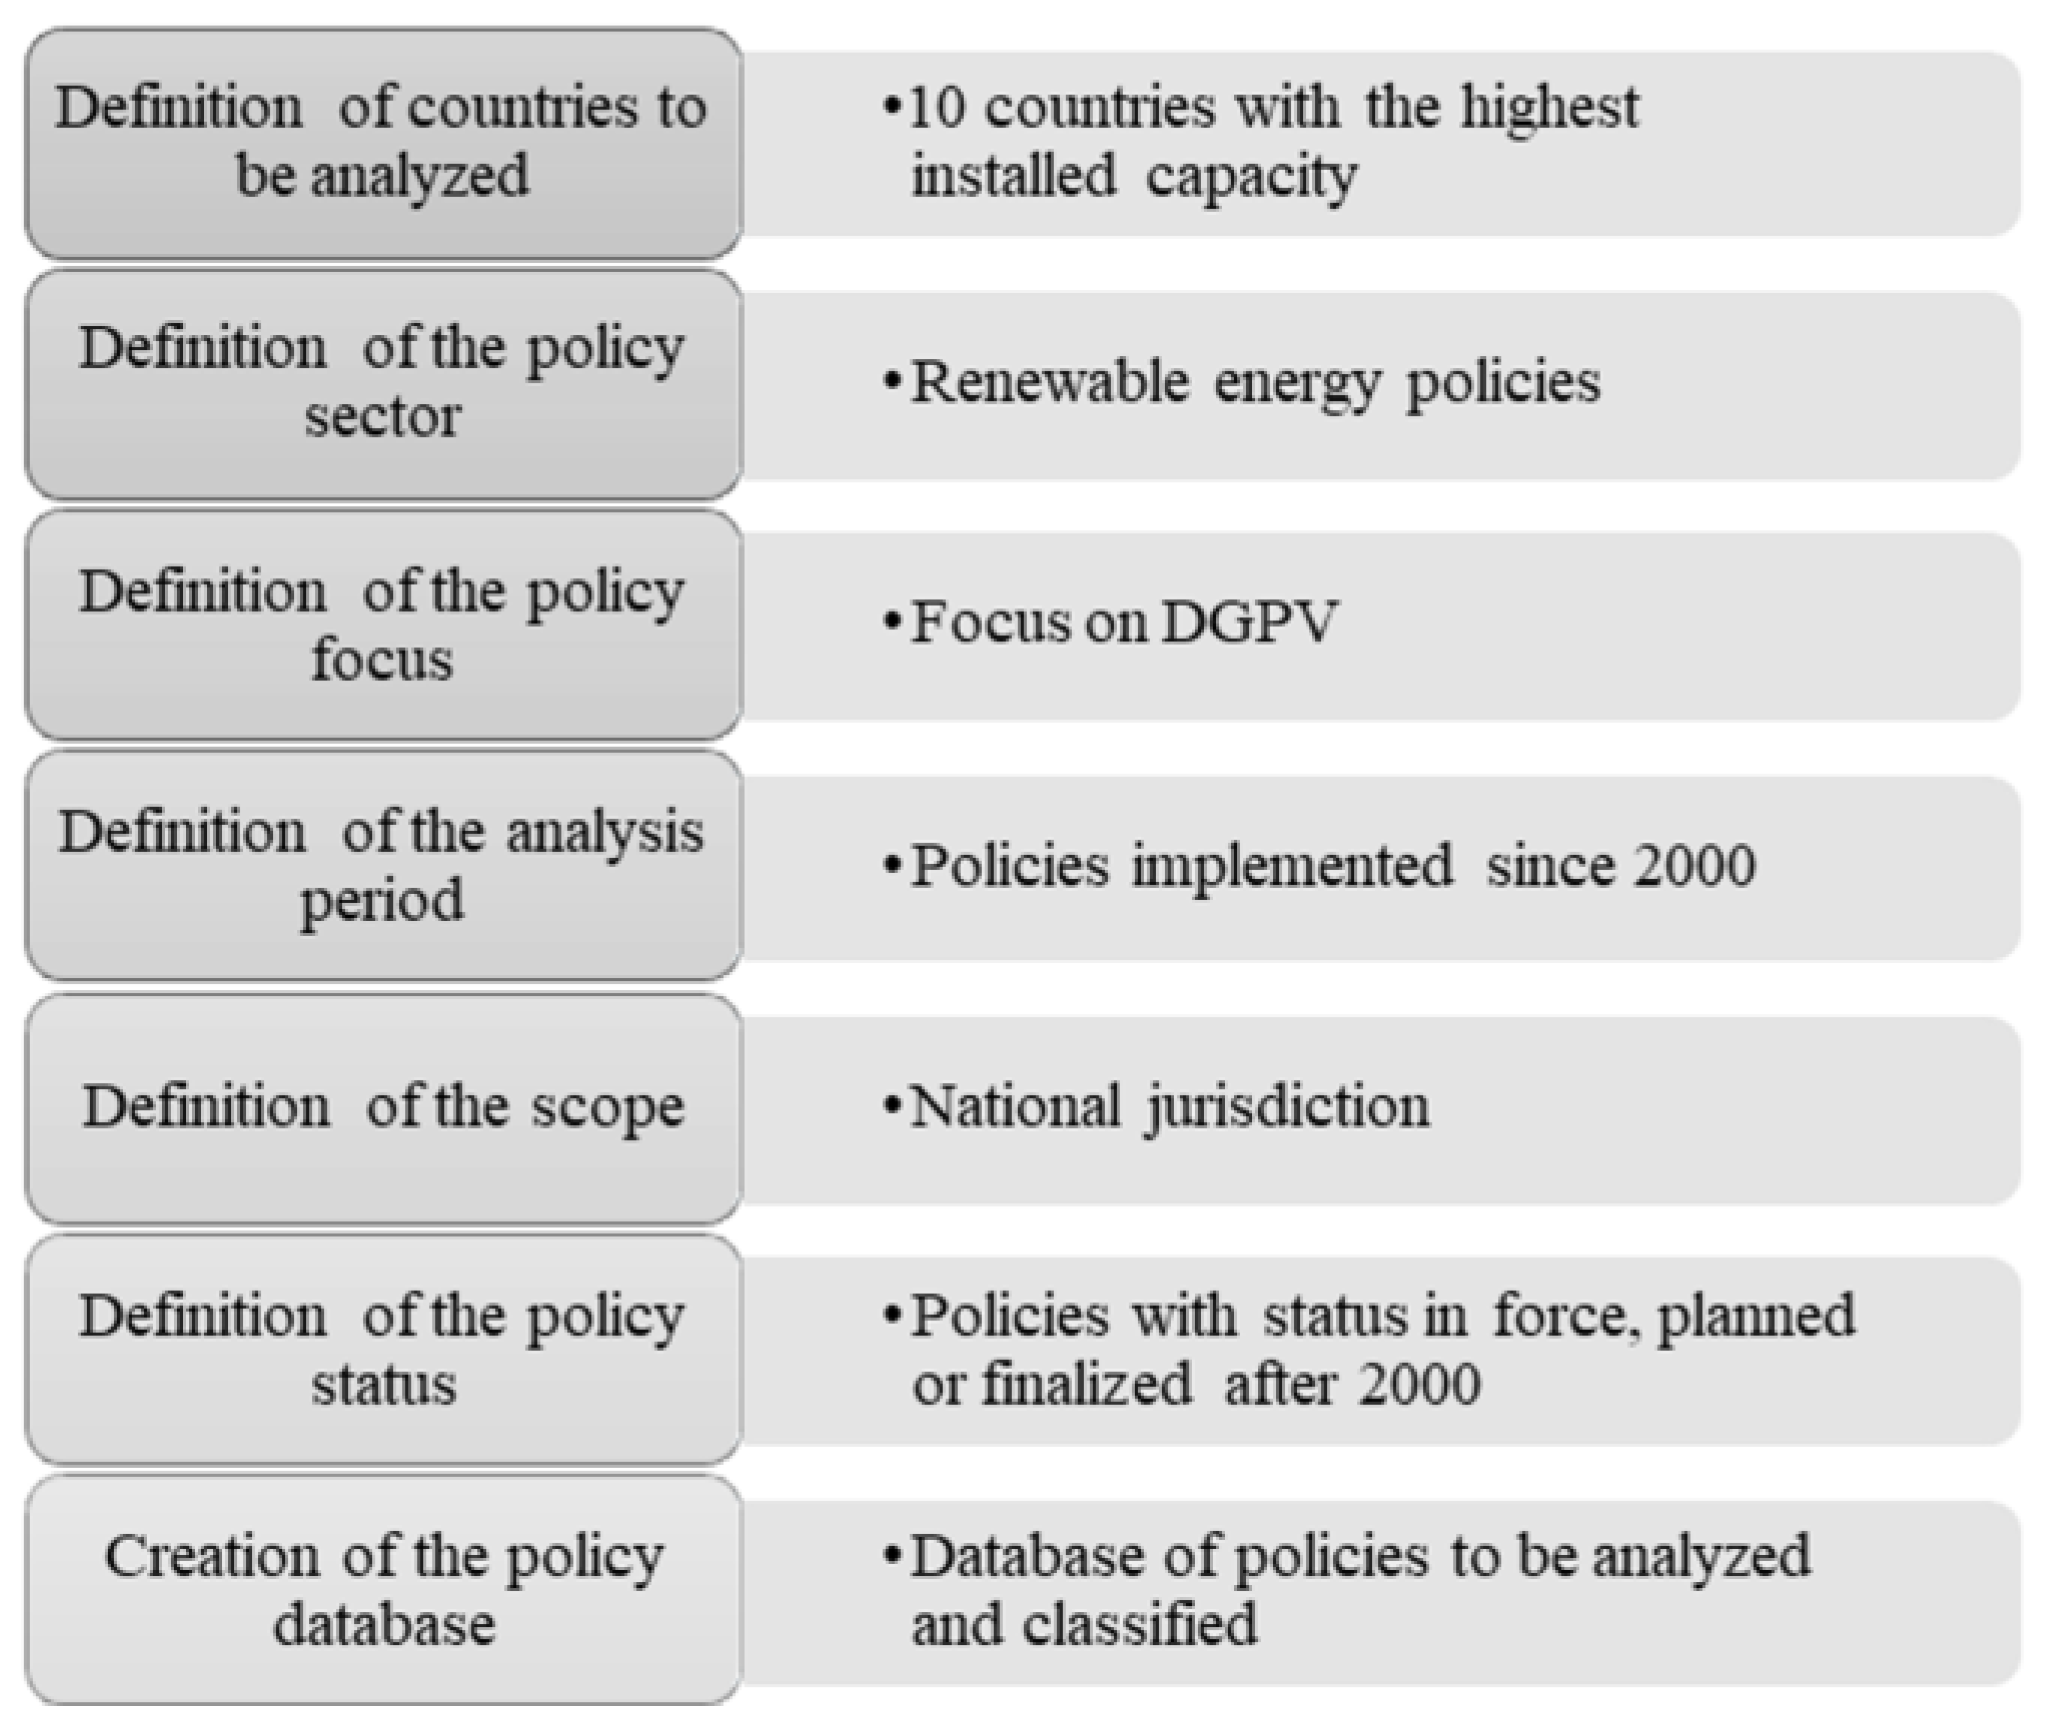
A comprehensive literature review examines the policies and mechanisms implemented in each country that are directly or indirectly related to renewable electricity generation. The policies and mechanisms examined were selected based on the following criteria: (i) time frame, with a focus on policies in effect from the year 2000 onwards, including those that were implemented before 2000 but remained in force in subsequent years; (ii) jurisdiction, with a focus on national policies and the exclusion of policies at the municipal or state jurisdiction, except for those that have demonstrated a significant contribution to DGPV in the country or policies of the same type applied in more than two states simultaneously; (iii) status, with a focus on policies that are, in effect, finalized, or in the planning stage between the years 2000 and 2025, with the exclusion of policies that were finalized before 1999.
Following the delineation of research criteria, various international and regional energy policy databases are consulted, including the International Energy Agency (IEA) and International Renewable Energy Agency (IRENA), Renewables Policies Database, Renewable Energy Sources Legal Database, Climate Policy Database, Climate Change Laws of the World, DSIRE, NC Clean Energy Technology Center, and the databases of the Government of the Republic of China. Specific filters to align with predetermined criteria, such as country name, renewable energy focus, solar PV, electricity, support schemes, grid issues, policies, jurisdiction, and mitigation area renewables, are implemented. In the context of energy policy, “policy” denotes the strategic framework and goals set by a government or organization to direct energy production, distribution, and consumption. “Mechanisms” encompass specific tools like tax incentives or loans to achieve these goals. “Advice” includes recommendations from experts and stakeholders guiding policy development. “Government actions” encompass concrete steps like legislation and regulations to enforce policies. All these elements are considered equally to understand energy policy implementation comprehensively.
Figure 6 summarizes the methodology of the first stage and visually depicts the sequential process undertaken to construct a policy database. Finally, policies and mechanisms that met the established criteria were classified and categorized, ensuring a thorough and systematic approach to the analysis.

2.2. Methodological Approach for Stage Two: Assessing the Impacts of Selected Policies

After compiling an energy policy database that promoted DGPV, policies by standard instruments are categorized into macro segments, allowing for comprehensive analysis. These policies and parameters are correlated to explore the implementation influences and examine the temporal evolution and interaction with external factors. Contextualizing policies within broader variables helps uncover the nuanced interplay between policy enactment and external dynamics, enriching the understanding of effective practices.
Initially, the analysis focused on the following two factors: the installed capacity and trends in installed prices. Cost fluctuations over the policy application period and the assessed significant increases in DGPV capacity within each country are observed. These increases highlight positive outcomes resulting from implemented policies, indicating growth. This approach helped us identify critical policies and mechanisms driving installation cost trends and facilitating capacity expansion. Moreover, the relationship between various policy types and stakeholders within the renewable energy sector is examined. This analysis aims to discern the most influential sectoral growth agent and identify specific policies and incentive mechanisms benefiting these stakeholders. By delineating these connections, insight into the optimal strategies for fostering sectoral development and effectively incentivizing key stakeholders can be gained [24].
Another crucial determinant is the level of technological maturity. Variations in technological maturity led to different policy approaches. In this context, the correlation between the policies enacted and the technological maturity is examined, tracking the evolution of the technology’s maturity throughout the policy application period. This analysis allows us to discern shifts in policy mechanisms as the technology progresses toward greater maturity.
To define and compare the maturity of DGPV technology across countries, a framework based on methodologies is adopted from [25] and the International Technology Roadmap for Photovoltaic Energy (ITRPV) [26]. This approach categorizes countries by their progress from initial small-scale implementations to large-scale deployments, using Technology Readiness Levels (TRLs).
Policies were collected in a database for comparative analysis, and indicators such as installed capacity, cost per kW, and the number of policies were utilized to ensure comparability among countries. Each country was assigned to one of the four phases based on the values of these indicators over time. Comparisons were conducted between countries within the same phase and across different phases to identify trends, best practices, and areas needing improvement. This framework allows for systematic definition and comparison of the maturity of distributed photovoltaic solar energy generation in different countries, highlighting effective policy measures and strategies used to promote the global adoption of DGPV. This approach provides valuable insights into how various policy measures impact the development and adoption of DGPV across different maturity stages, emphasizing the importance of tailored policy support in advancing solar PV technology globally.
Sequentially, two critical socioeconomic factors were analyzed to indicate the readiness and ability of the national policy to invest in DGPV. This analysis examined how specific policy approaches responded to changes in these factors. By correlating policies with socioeconomic indicators, optimal strategies for a nation’s development stages are determined. In conclusion, an in-depth analysis was conducted on the interrelationship between the implemented policies and the specific characteristics of the nation’s electricity sector. By systematically examining the features of the electricity sector, the mechanisms that exhibit the most significant prevalence of application were documented.
In this second phase of the research, fundamental questions that guided the study were addressed. These include identifying policies that significantly reduce installation costs and drive the expansion of installed capacity. Critical sector agents essential for fostering DGPV development were determined, and policies that benefit them the most were highlighted. Additionally, the suitability of policies across different technological maturity stages and socioeconomic contexts was evaluated, identifying optimal policies across diverse value ranges. The analysis further examines socioeconomic characteristics and national electricity matrix compositions to identify successful case studies applicable to countries with similar profiles.
Optimal policies for various scenarios within the national electricity sector are explored, offering comprehensive insights into policy effectiveness and applicability. This analysis aims to provide valuable strategies for fostering DGPV growth that apply to both developed and developing nations. Table 1 presents an overview of the methodology utilized in the second stage of the research, delineating the external factors correlated with policies and the corresponding research questions to elucidate the study’s objectives.

3. Results and Discussion

This section presents our findings regarding the predominant policies employed to foster the advancement of DGPV technology. The initial findings establish the foundation of the policy framework. Subsequently, an overview of the total number of policies and their categorization and prevalent categories is identified, and a detailed analysis highlighting the predominant policy categories within each country is provided. Then, the history of the top ten countries with the highest DGPV installed capacity is listed by capacity from 2000 to the present. The analysis aims to correlate policy implementation with capacity and price trends. Insights into how policy approaches distributed solar power development are provided. The country-specific analysis examines installed capacity, prices, and policy timelines, revealing the correlation between price reduction and capacity increase, facilitating policy impact assessment. Additionally, the findings from analysis regarding the demonstration of existing policies and the direct beneficiaries of these mechanisms are presented.
Several crucial parameters must be considered to determine the optimal DGPV incentive policy. Many policies and mechanisms do not necessarily translate into greater installed capacity, and a single policy may suffice to enhance the technology [27]. To identify the most suitable policy, it is essential to consider factors such as the local solar resource conditions, public awareness and adoption, technology, manufacturing structure, the level of development of local solar energy, socioeconomic characteristics of the country, and specific characteristics of the electricity sector [28].

3.1. Mapping Policy Landscapes: Unveiling Categories, Trends, and Country-Specific Applications

A total of 338 DGPV incentive policies and mechanisms were identified as relevant for encouraging or mandating the adoption of renewable energy from photovoltaic solar sources connected to the distribution network located close to the load, based on the criteria outlined in the methodology. These policies and mechanisms were classified into eight categories based on the specific action segment of each policy and inspired by the IEA/IRENA Renewable Energy Policies and Measures Database policy type filter [29]. Policies and mechanisms with more than one action segment were included in multiple categories, reflecting their influence in various areas. The categories include: (1) Direct Financial Incentives; (2) Energy Market Regulation; (3) Government Management; (4) Production Incentives; (5) Performance-Based Feed Rates; (6) Renewable Energy Obligations; (7) Research and Development; and (8) Agreements and Commitments. Table 2 provides a brief overview of each category, the policies and mechanisms considered in each category, and the references used to establish the framework.
The Government Management category included the most policies and mechanisms, totaling 212. The USA had the highest number of policies in this category, with 41, followed by China with 37. The second highest category in terms of the number of policies was Direct Financial Incentives, which totaled 175. The USA and Australia had the highest financial and fiscal incentives, with 31 and 28, respectively. In third place, with 94 policies, was the Energy Market Regulation category. China and India had the highest number of policies in this category, with 19 and 15, respectively. The United States had the highest overall number of policies and mechanisms to promote the growth and development of the DGPV market, with 61 in total. China had 52, and France had 41. Table 3 displays the number of policies classified in each category and the number of policies adopted in the ten countries that have invested the most in DGPV since 2000.

3.2. Examining the Drivers of Distributed Solar: A Historical Analysis of Top 10 DGPV Leaders

This item presents a historical overview of the top ten countries with the highest installed capacity of DGPV plants from the year 2000 to the present. The countries are listed in descending order based on their installed capacity. China is identified as the foremost nation examined, possessing the largest installed capacity, while Belgium is noted as the tenth country, possessing the least installed capacity.
Through this analysis, the correlation between policy implementation and the evolution of installed capacity and installed price trends is established, offering insights into how different policy approaches have influenced the development of DGPV. Notably, the number of policies made a significant difference in shaping the trajectory of DGPV growth. The correlation between decreasing installation prices and rising installed capacity is evident. By examining each country individually, the concentration of policies during specific periods and assessing their impact on growth and costs can be identified.
The cost data utilized in this study were obtained from reports by the IEA/IRENA [8], except for data for the United States, which were obtained from Berkeley Lab [65]. The study incorporates actual data spanning from the year 2000 to 2023. For the years 2024 and 2025, the analysis relies on respective projections.
Utilizing data from the referenced sources, graphical representations were developed for each country to facilitate a clear and objective analysis of the relationships among installed capacity, pricing trends, and the extent of policy implementation during the examined periods.

3.2.1. China

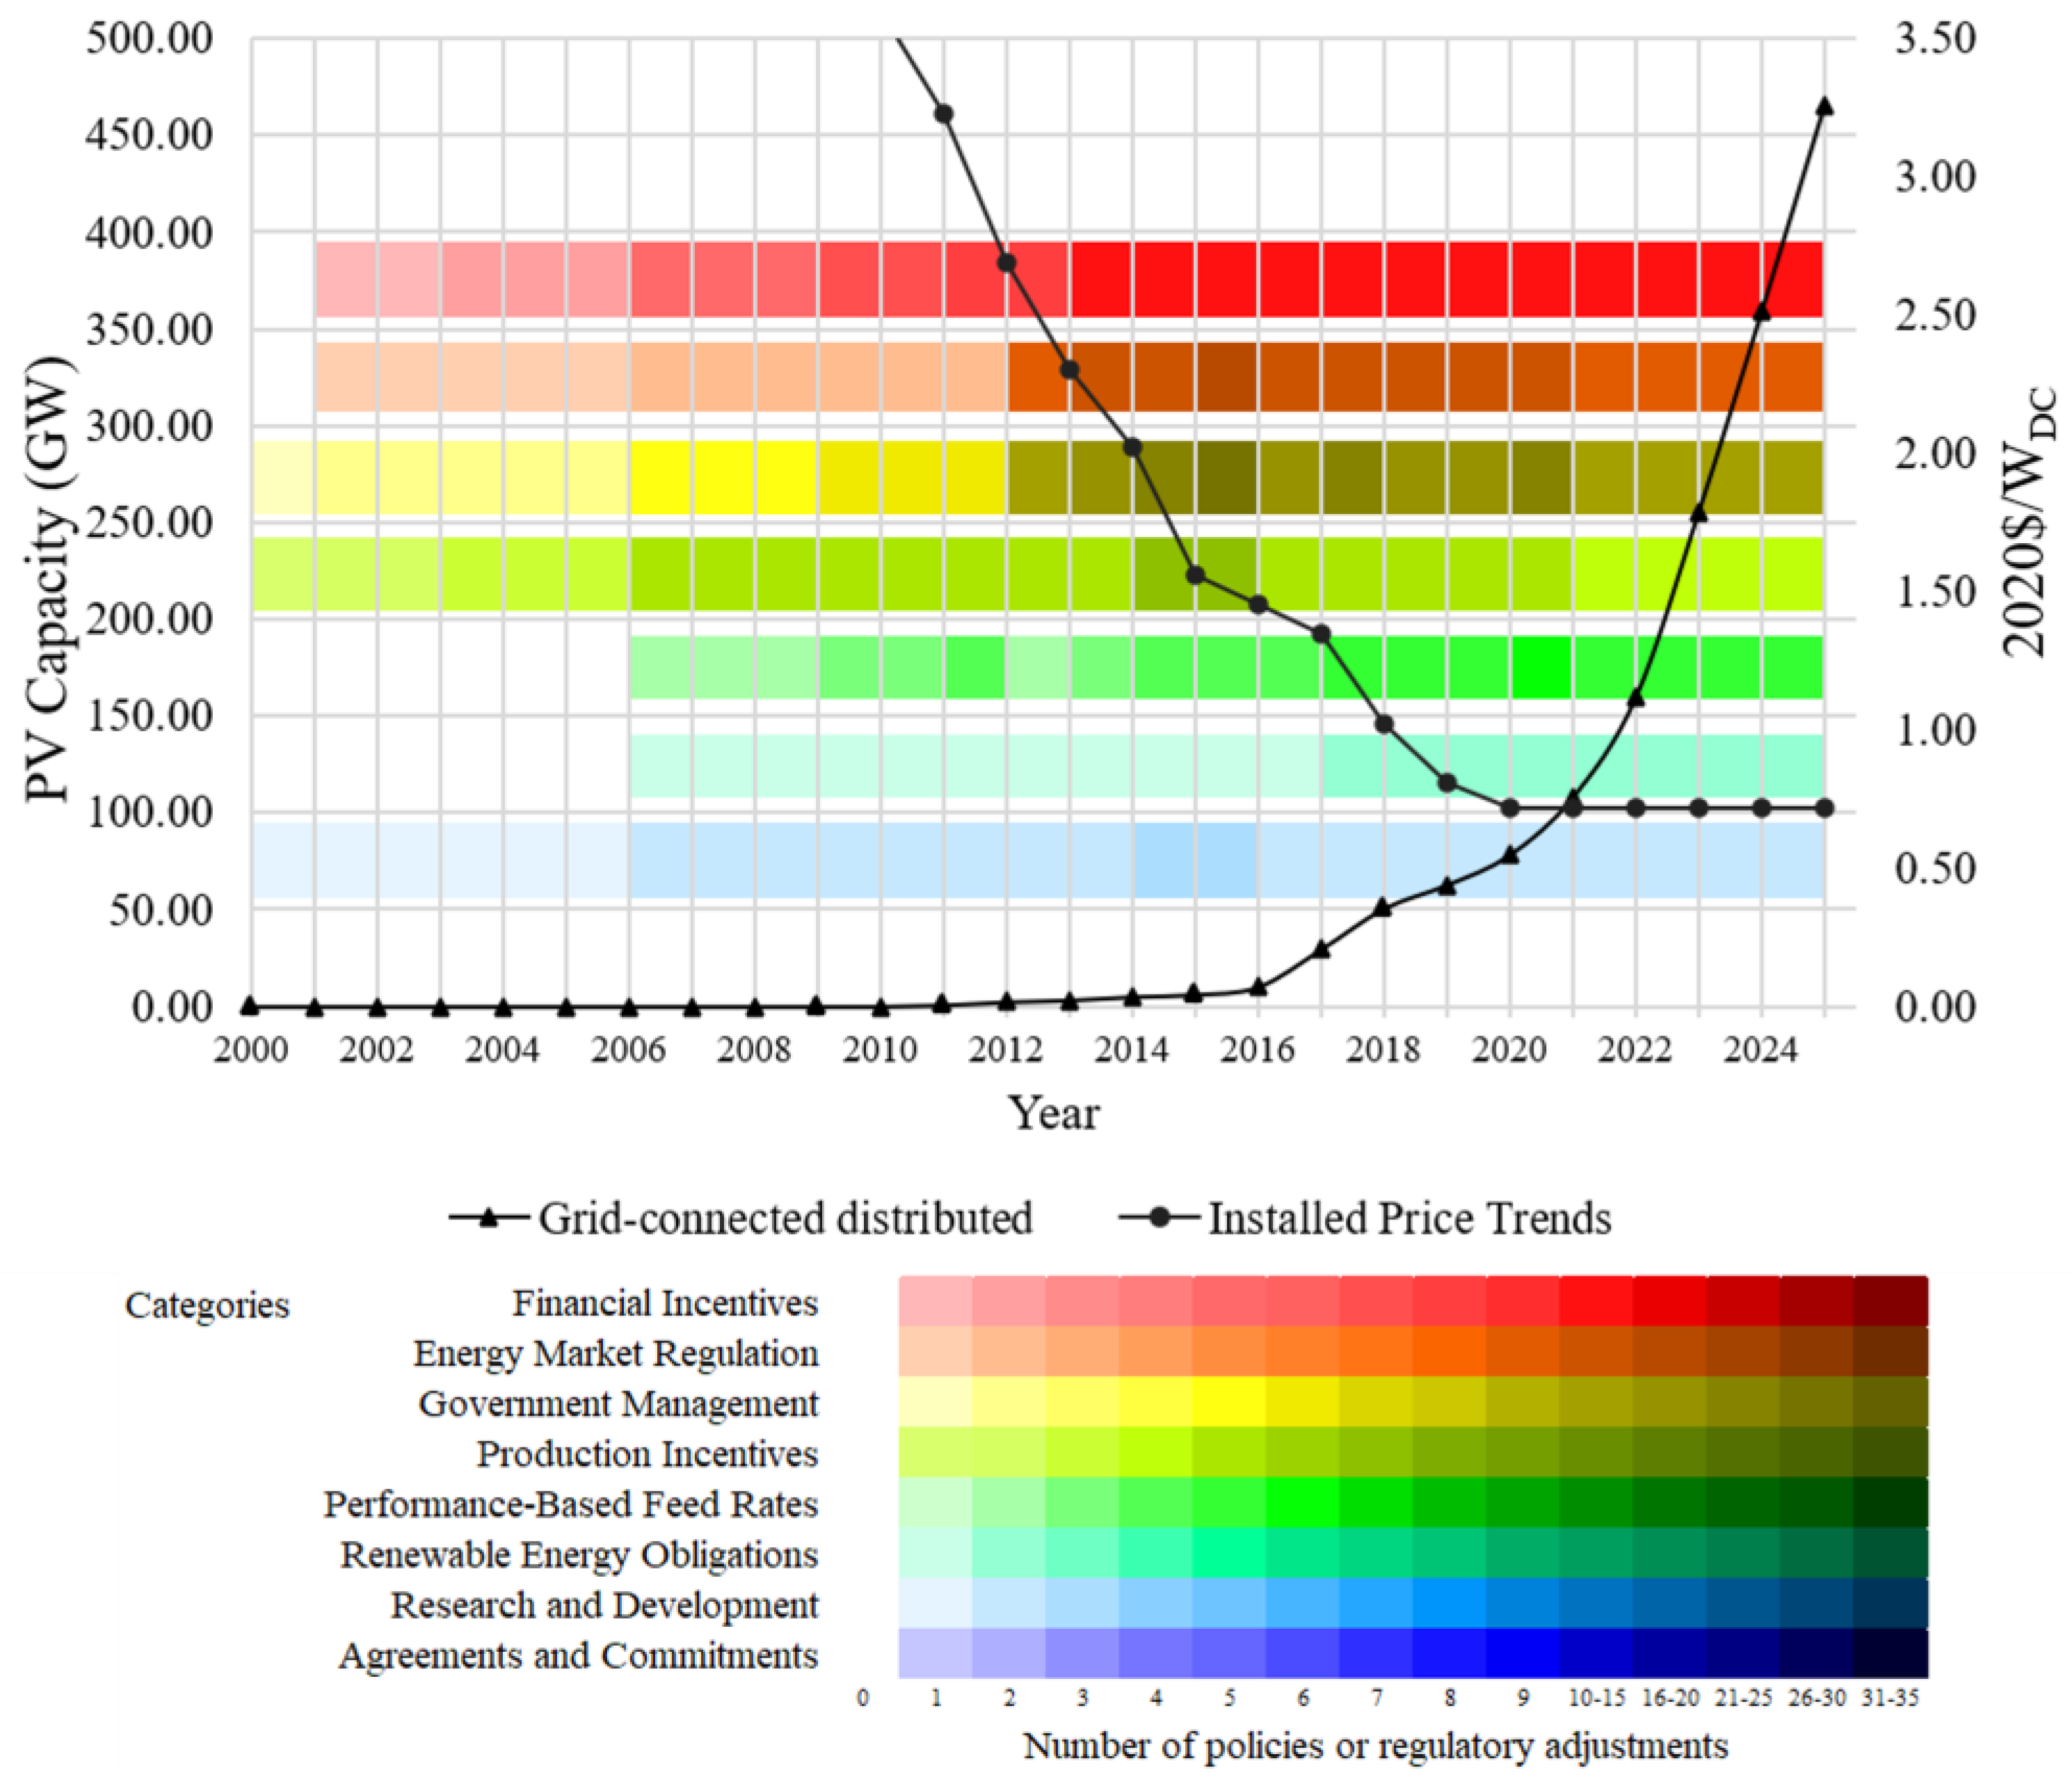
China has installed the most DGPV plants from 2000 to the present [66]. In 2006, four critical policies focused on renewable energy were implemented, including the Renewable Energy Law of the People’s Republic of China and the Interim Method for Renewable Energy Generated Power Pricing and Cost Allocation Management [67,68]. However, it was not until 2011 that significant growth in installed capacity was observed, increasing from 0.01 GW to 0.31 GW, and in 2012 it further increased to 2.54 GW. This increase can be attributed to the replacement of the pricing policy with the solar PV feed-in tariff in 2011 and the implementation of nine new guidelines in 2012, including The Twelfth Five-Year Plan for Renewable Energy and Solar Industry/Solar Power Technology 12th Five-Year Development Planning, which aimed to improve government management, energy market regulation, and direct financial incentives [69]. By 2015, 23 new policies had been implemented to support and promote distributed power generation further [70]. As a result, from 2011 to 2015, the installed price experienced its greatest reduction at 51.8%, facilitating a significant increase in the country’s installed capacity in the following years. In 2016, the installed capacity was 9.9 GW, rising to 29.4 GW in 2017, 51 GW in 2018, and 159.7 GW in 2022. The National Energy Administration (NEA) released China’s 13th Electricity Development Five-Year Plan for 2016–2020, which set a goal of more than 60 GW of distributed solar energy systems [71]. This goal has already been achieved twice in 2022. Figure 7 illustrates the correlation between the growth in installed capacity of distributed solar energy systems over the studied period and the concurrent decline in installed prices in China.

3.2.2. Japan

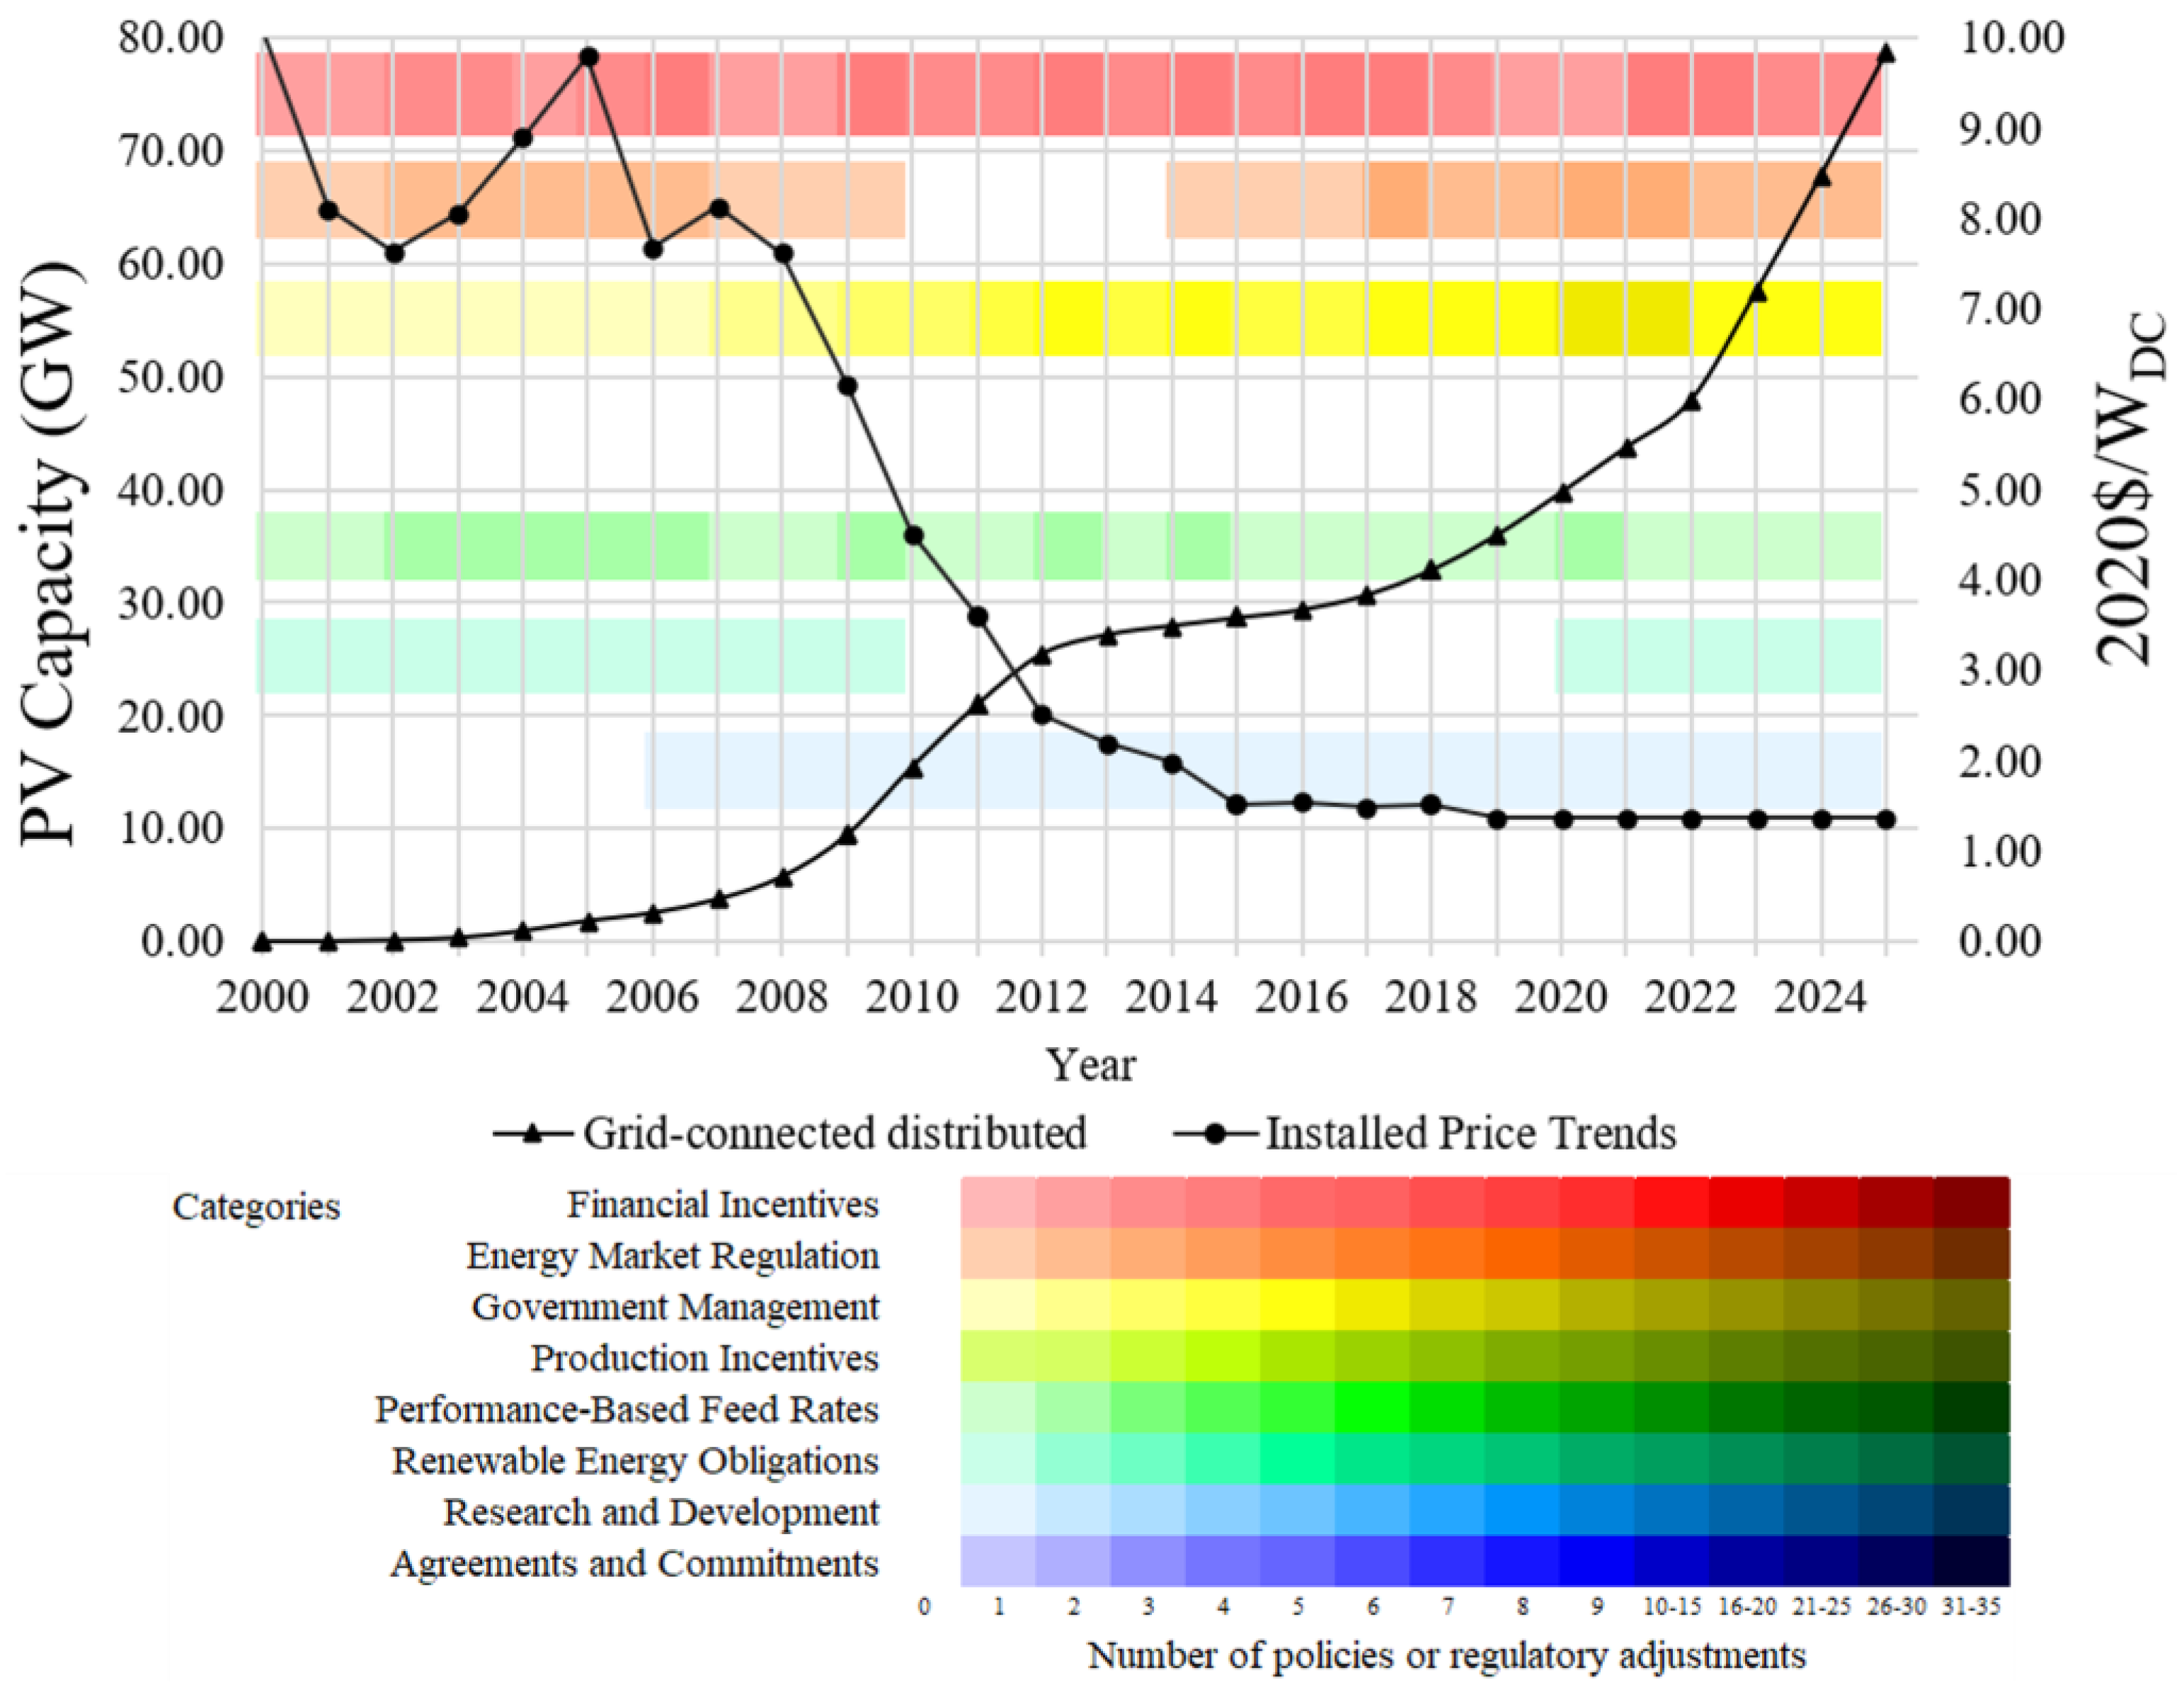
Japan is the second country with the highest installed capacity of distributed generation [66]. Before the year 2000, Japan implemented direct financial incentives and energy market regulations, such as the Net Billing Program and the Residential PV Dissemination Program, as well as the Special Measures Law for promoting the use of new energy, which remains in effect today [73]. Between 2000 and 2011, installed capacity increased from 0.2 GW to 4.7 GW, but the installed price remained unstable. However, from 2011 onwards, the installed price significantly reduced by 60.3% over four years. This reduction led to a significant increase in installed capacity, beginning in 2012 when the standard Renewable Portfolio Law policy was finalized, and the feed-in tariff for renewable electricity and solar PV auctions began [74]. By the end of 2012, 6.3 GW of DGPV plants were installed, which grew to 26.9 GW in 2016, 41 GW in 2020, and 48.2 in 2022. Figure 8 depicts the relationship between the growth in installed capacity of distributed solar energy systems over the studied period and the concurrent decrease in installed prices, specifically in Japan.

3.2.3. Germany

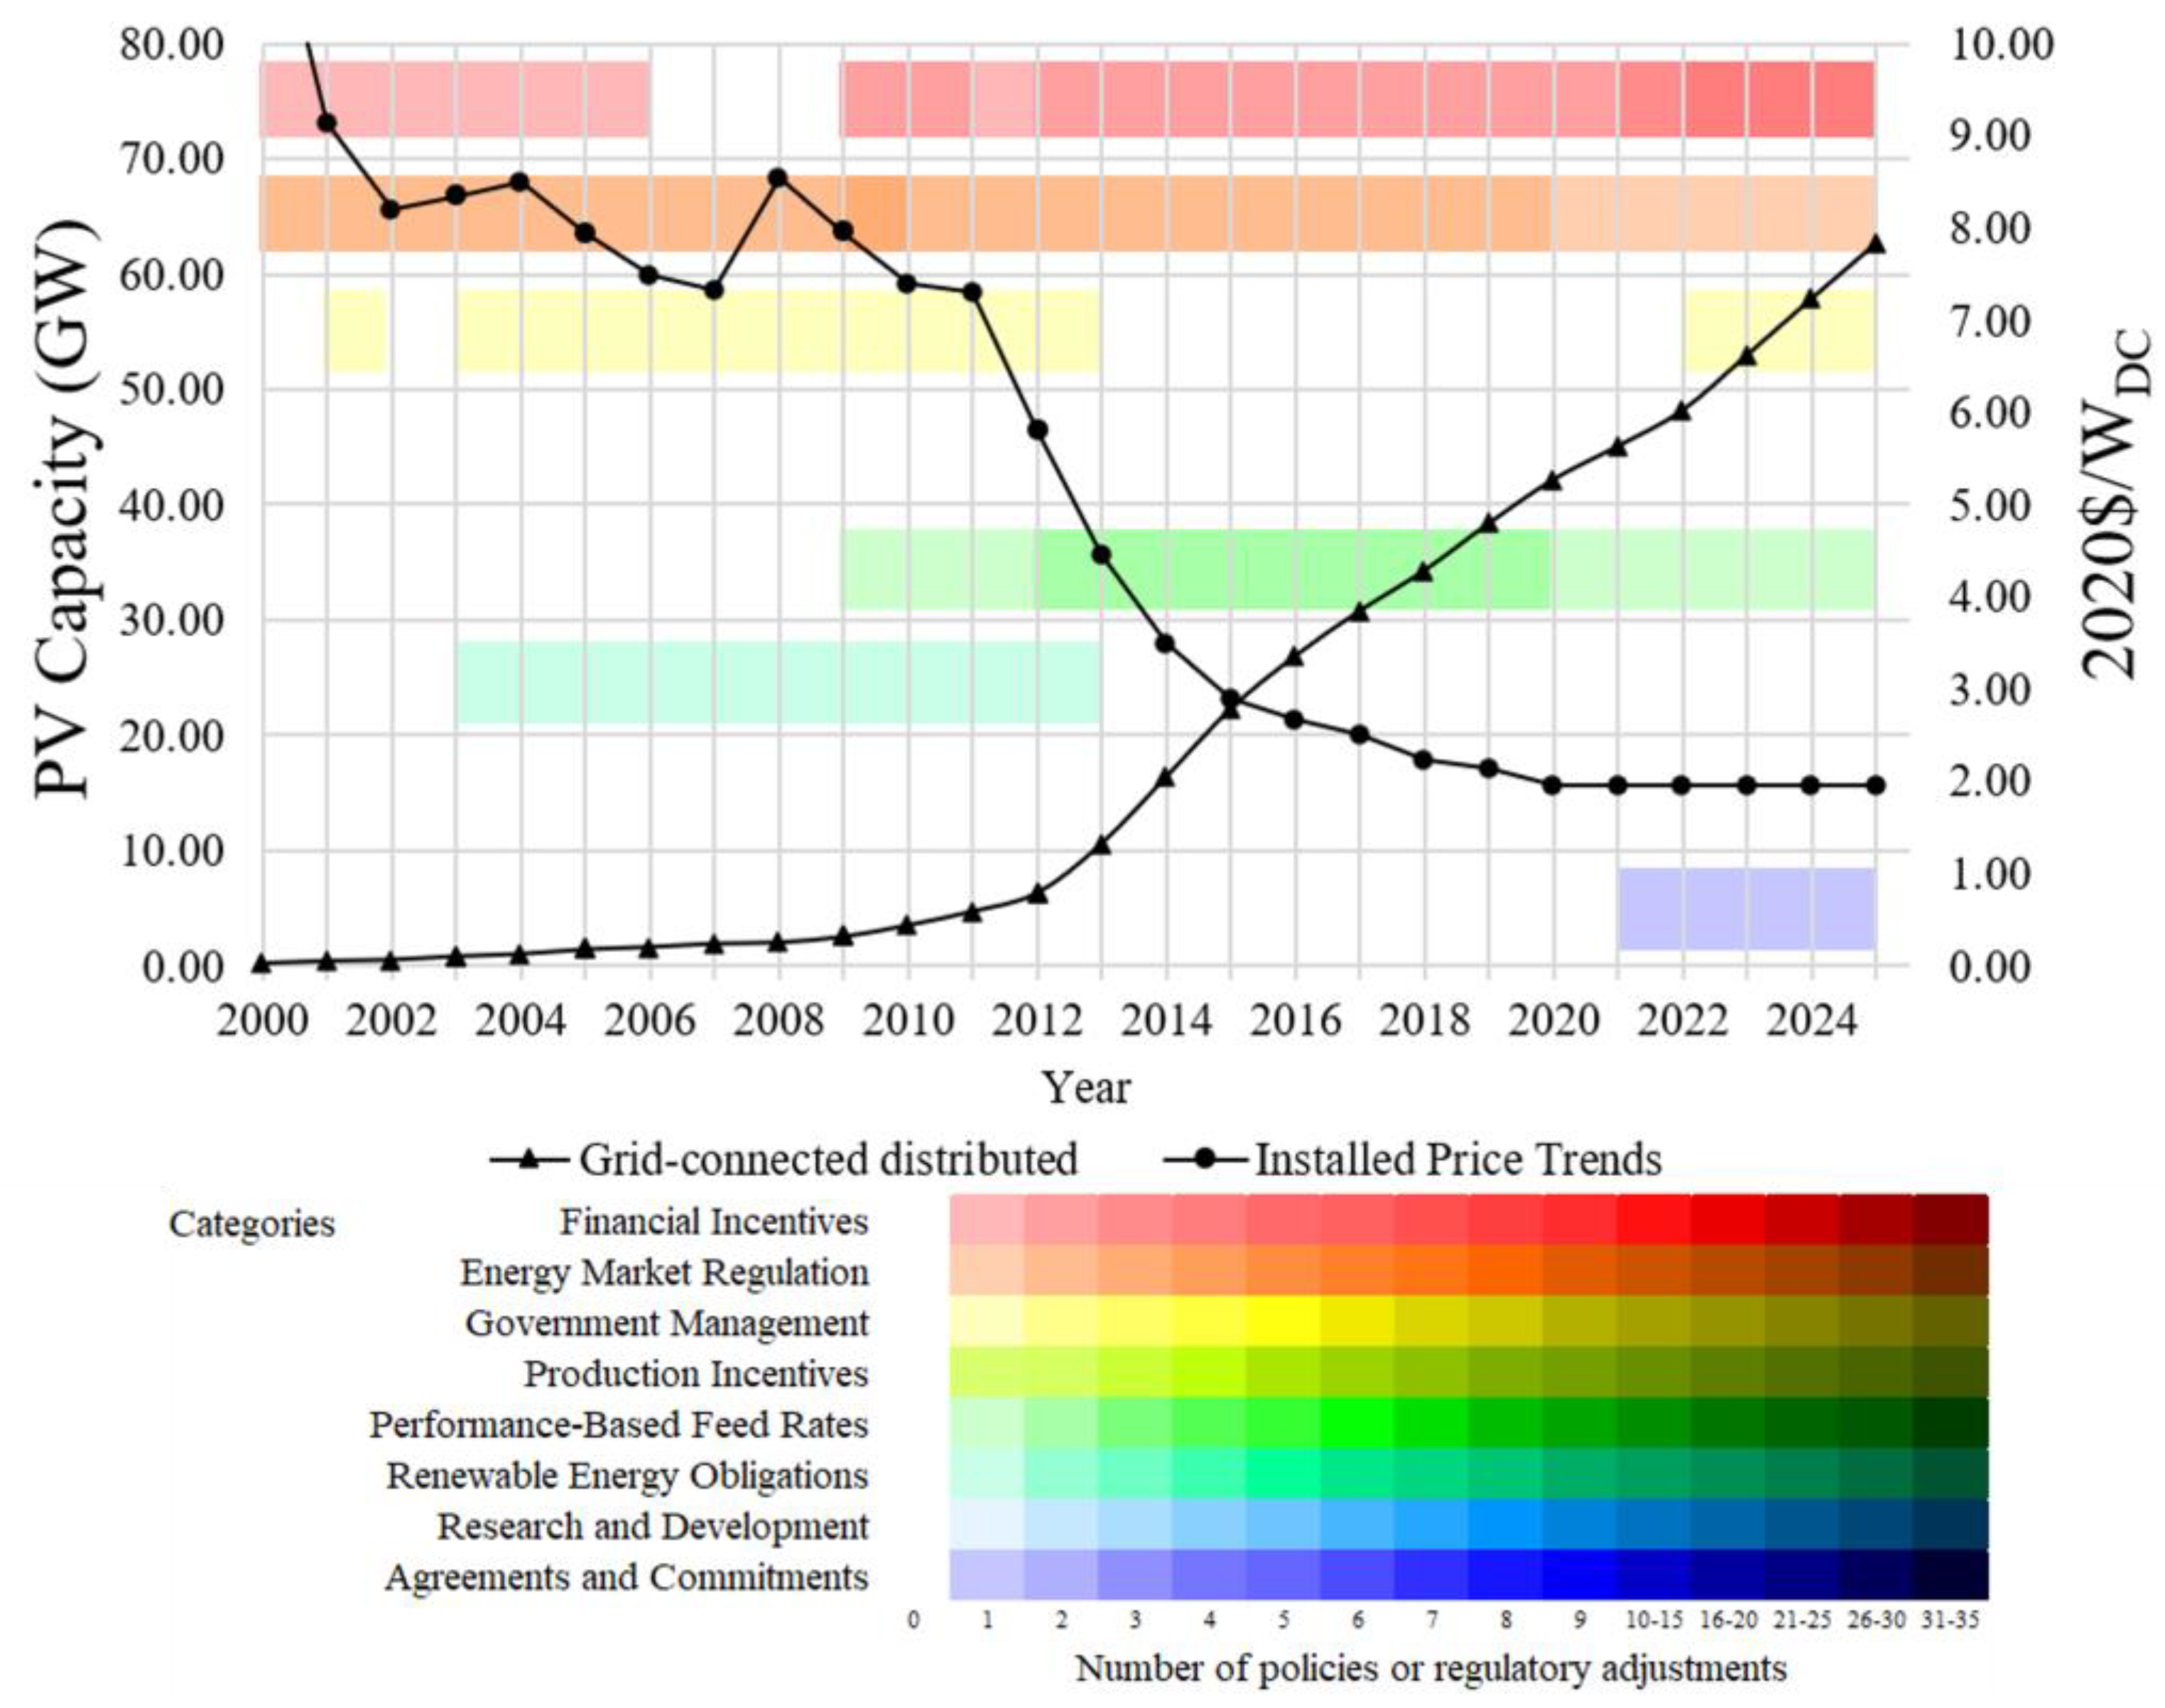
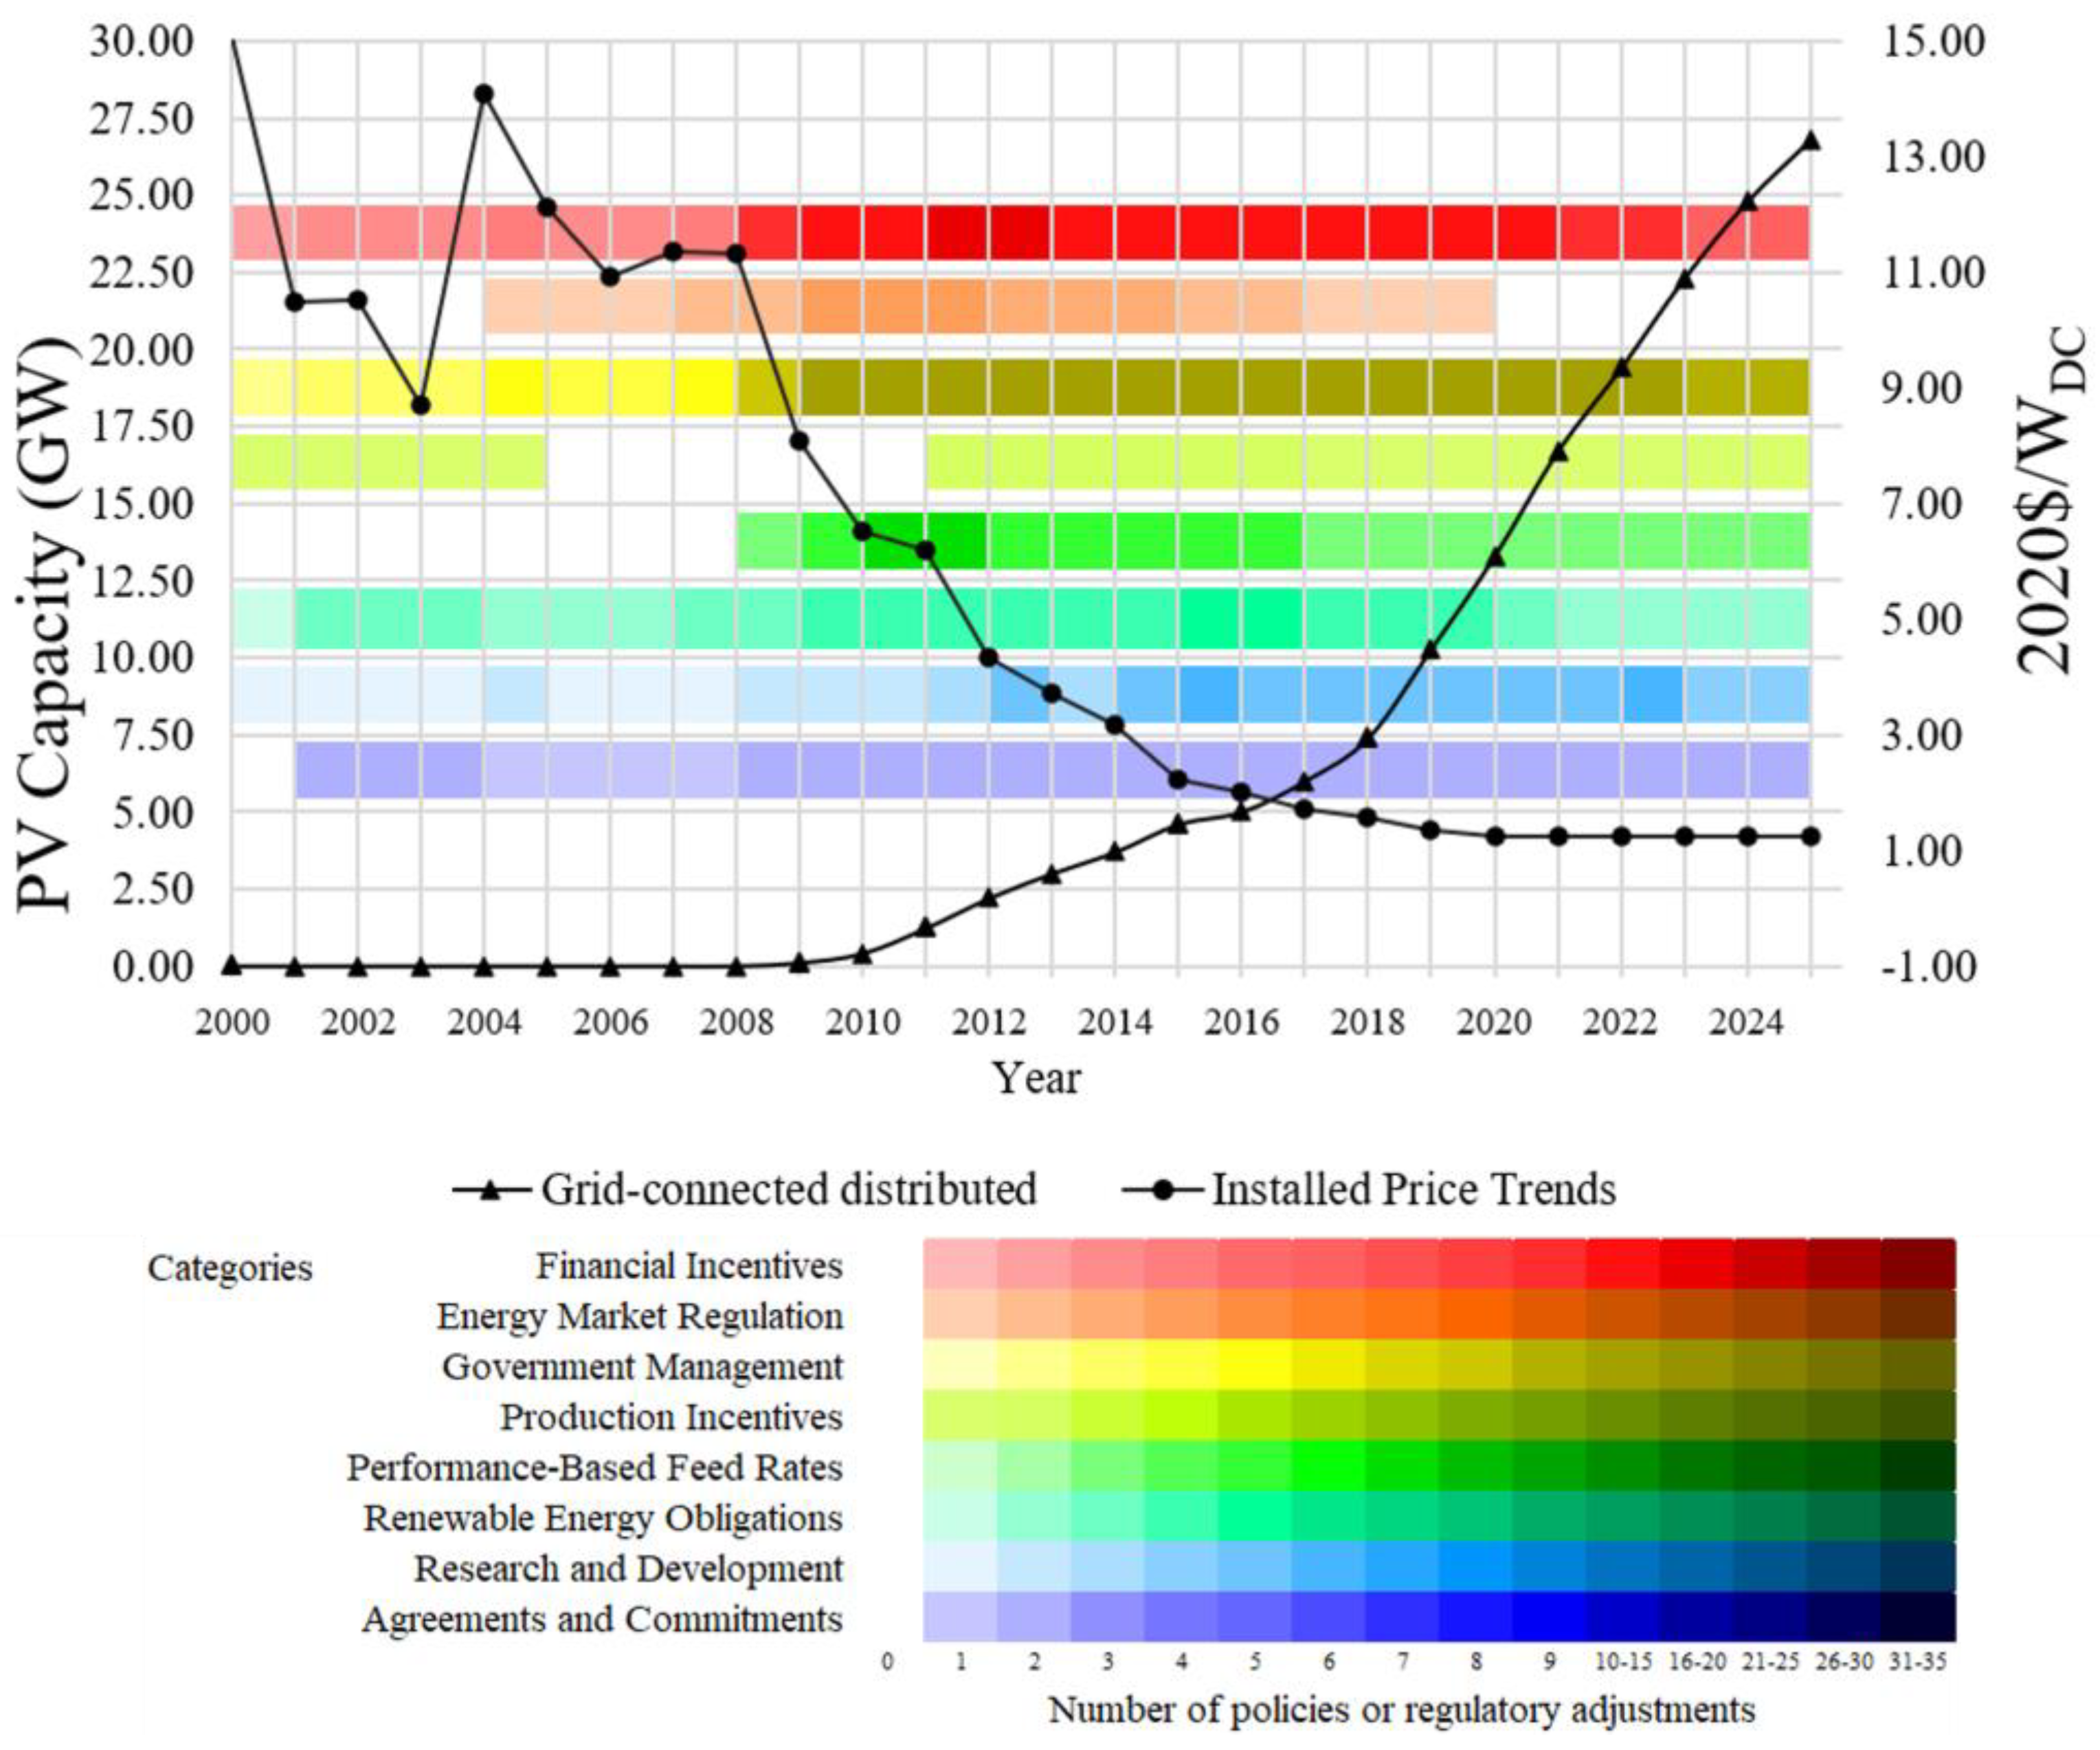
The German government supports the growth of DGPV through direct financial incentives, government management, and performance-based feed rates. In 2000, the country established its first regulatory framework for renewable energy through the Renewable Energy Sources Act (Erneuerbare Energien Gesetz, EEG in German acronym) [75,76]. This framework has undergone several amendments over the years, with the most recent changes made in 2021. Between 2000 and 2006, the installed price of DGPV systems fluctuated, but from 2007 onwards, a significant reduction in costs was observed, with a 69% decrease over a five-year period. Concurrently, the installed capacity of DGPV systems in Germany increased rapidly, surpassing 3.8 GW in 2007 and reaching 25.5 GW by the end of 2012, representing a growth rate of 73%. By 2017, the installed capacity had grown to 30.7 GW and reached 48 GW in 2022. Figure 9 illustrates the dynamic between the expansion of installed capacity in distributed solar energy systems and fluctuations in installed prices during the studied period in Germany.

3.2.4. USA

The United States led the way in investing in supportive measures, grid infrastructure, and policies to advance the growth of DGPV [77,78,79]. During the study period, 61 mechanisms were implemented, with the majority being direct financial incentives, government management, and research and development. Despite the initial instability in installed prices before 2009, a significant decrease of 45% was observed from 2009 to 2013. This was followed by a steady increase in installed capacity, from 1.12 GW in 2009 to 6.27 GW in 2013, 20.58 GW in 2017, and 49.6 GW in 2022. Figure 10 presents the correlation between the expansion of installed capacity within distributed solar energy systems and fluctuations in installed prices throughout the studied timeframe, with a focus on the USA.

3.2.5. Italy

In Italy, initiatives aimed at advancing distributed generation and liberalizing the energy market were launched in 1991 and are planned to continue beyond 2030 [80,81]. The implementation of the Net-Metering policy occurred in 2004 and remains in effect to this day. Additionally, the Italian Conto Energia, a feed-in premium program for photovoltaic systems, was introduced in 2005 and underwent several revisions in 2007, 2011, and 2012, with the final version concluding in 2013 [82]. Italy’s most widely adopted policies include government management, energy market regulation, and direct financial incentives. These incentives have led to substantial growth in installed capacity, surpassing 1 GW in 2009 and reaching a peak growth rate of 34% in 2010–2011, reaching 9.9 GW by the end of that year. By 2017, the installed capacity reached 15.5 GW; in 2019, it was recorded to be 16.40 GW. In the same period, the installed price experienced a drop of 31% in 2009, followed by a progressive decline until 2012, contributing to the market’s consolidation. Therefore, each year, the installed capacity grows more, reaching the value of 19.6 GW in 2022. Figure 11 illustrates the connection between the increase in installed capacity of distributed solar energy systems and the fluctuations in installed prices throughout the studied period, with a specific focus on Italy.

3.2.6. Australia

Australia has implemented various policies and mechanisms to promote the deployment of DGPV systems, such as direct financial incentives, government management, and research and development initiatives [83]. However, between 2000 and 2008, the installed price of DGPV systems remained unstable, and the growth in installed capacity was insignificant. Starting from 2008, the installed price of DGPV systems experienced its most substantial reduction rate, decreasing by 29%. Moreover, beginning in 2009, the installed capacity of DGPV systems began to grow. During this period, the number of incentive policies, including bonuses, the Renewable Energy Target (RET), and feed-in tariff schemes increased by 31%. The installed price decreased significantly until 2015, when it reached a smaller reduction rate. This reduction in the installed price directly influenced the growth of installed capacity. For instance, in 2016, when prices stabilized at lower levels, the installed capacity of DGPV systems increased from 5.0 to 6.0 GW, followed by a further increase to 7.7 GW in 2017, 10.1 GW in 2018, and more than 150% in the period between 2016 and 2019. This reached a value of 19.4 GW in 2022. Figure 12 illustrates the correlation between the expansion of installed capacity within distributed solar energy systems throughout the study period and the concurrent decrease in installed prices in Australia.

3.2.7. Netherlands

The Netherlands has implemented several policies that were established before the 2000s and continue to be in effect today [84]. These include the Electricity Act of 1998, the Energy Tax 1996, and the Fee Code 1999, which are expected to remain in force until at least 2025 [85]. Between 2001 and 2005, the installed price experienced an upward trend. However, in 2006, a cost reduction was observed, which continued until 2009, resulting in a cumulative decrease of 66%. Further cost reductions of 42% occurred until 2013, stabilizing the prices. During this period, several significant policies were introduced, including green certificate trading in 2001, net energy metering in 2004, and the feed-in premium program SDE+ (Dutch acronym Stimulering Duurzame Energieproductie which translates to Encouragement of Sustainable Energy Production in English) [86].
Furthermore, in 2012, the top-sector innovation approach was implemented. These policies’ broad scope and consolidation resulted in the growth of the DGPV installed capacity, reaching 100 MW in 2010, just one year after price stabilization. However, the most significant increase in installed capacity occurred in 2014, with a capacity of 1 GW. This capacity doubled in 2016 to 2 GW; in 2022, the installed capacity reached a record of 15.7 GW. Figure 13 presents the correlation between the expansion of installed capacity in distributed solar energy systems and the variations in installed prices observed in the Netherlands throughout the study period.

3.2.8. India

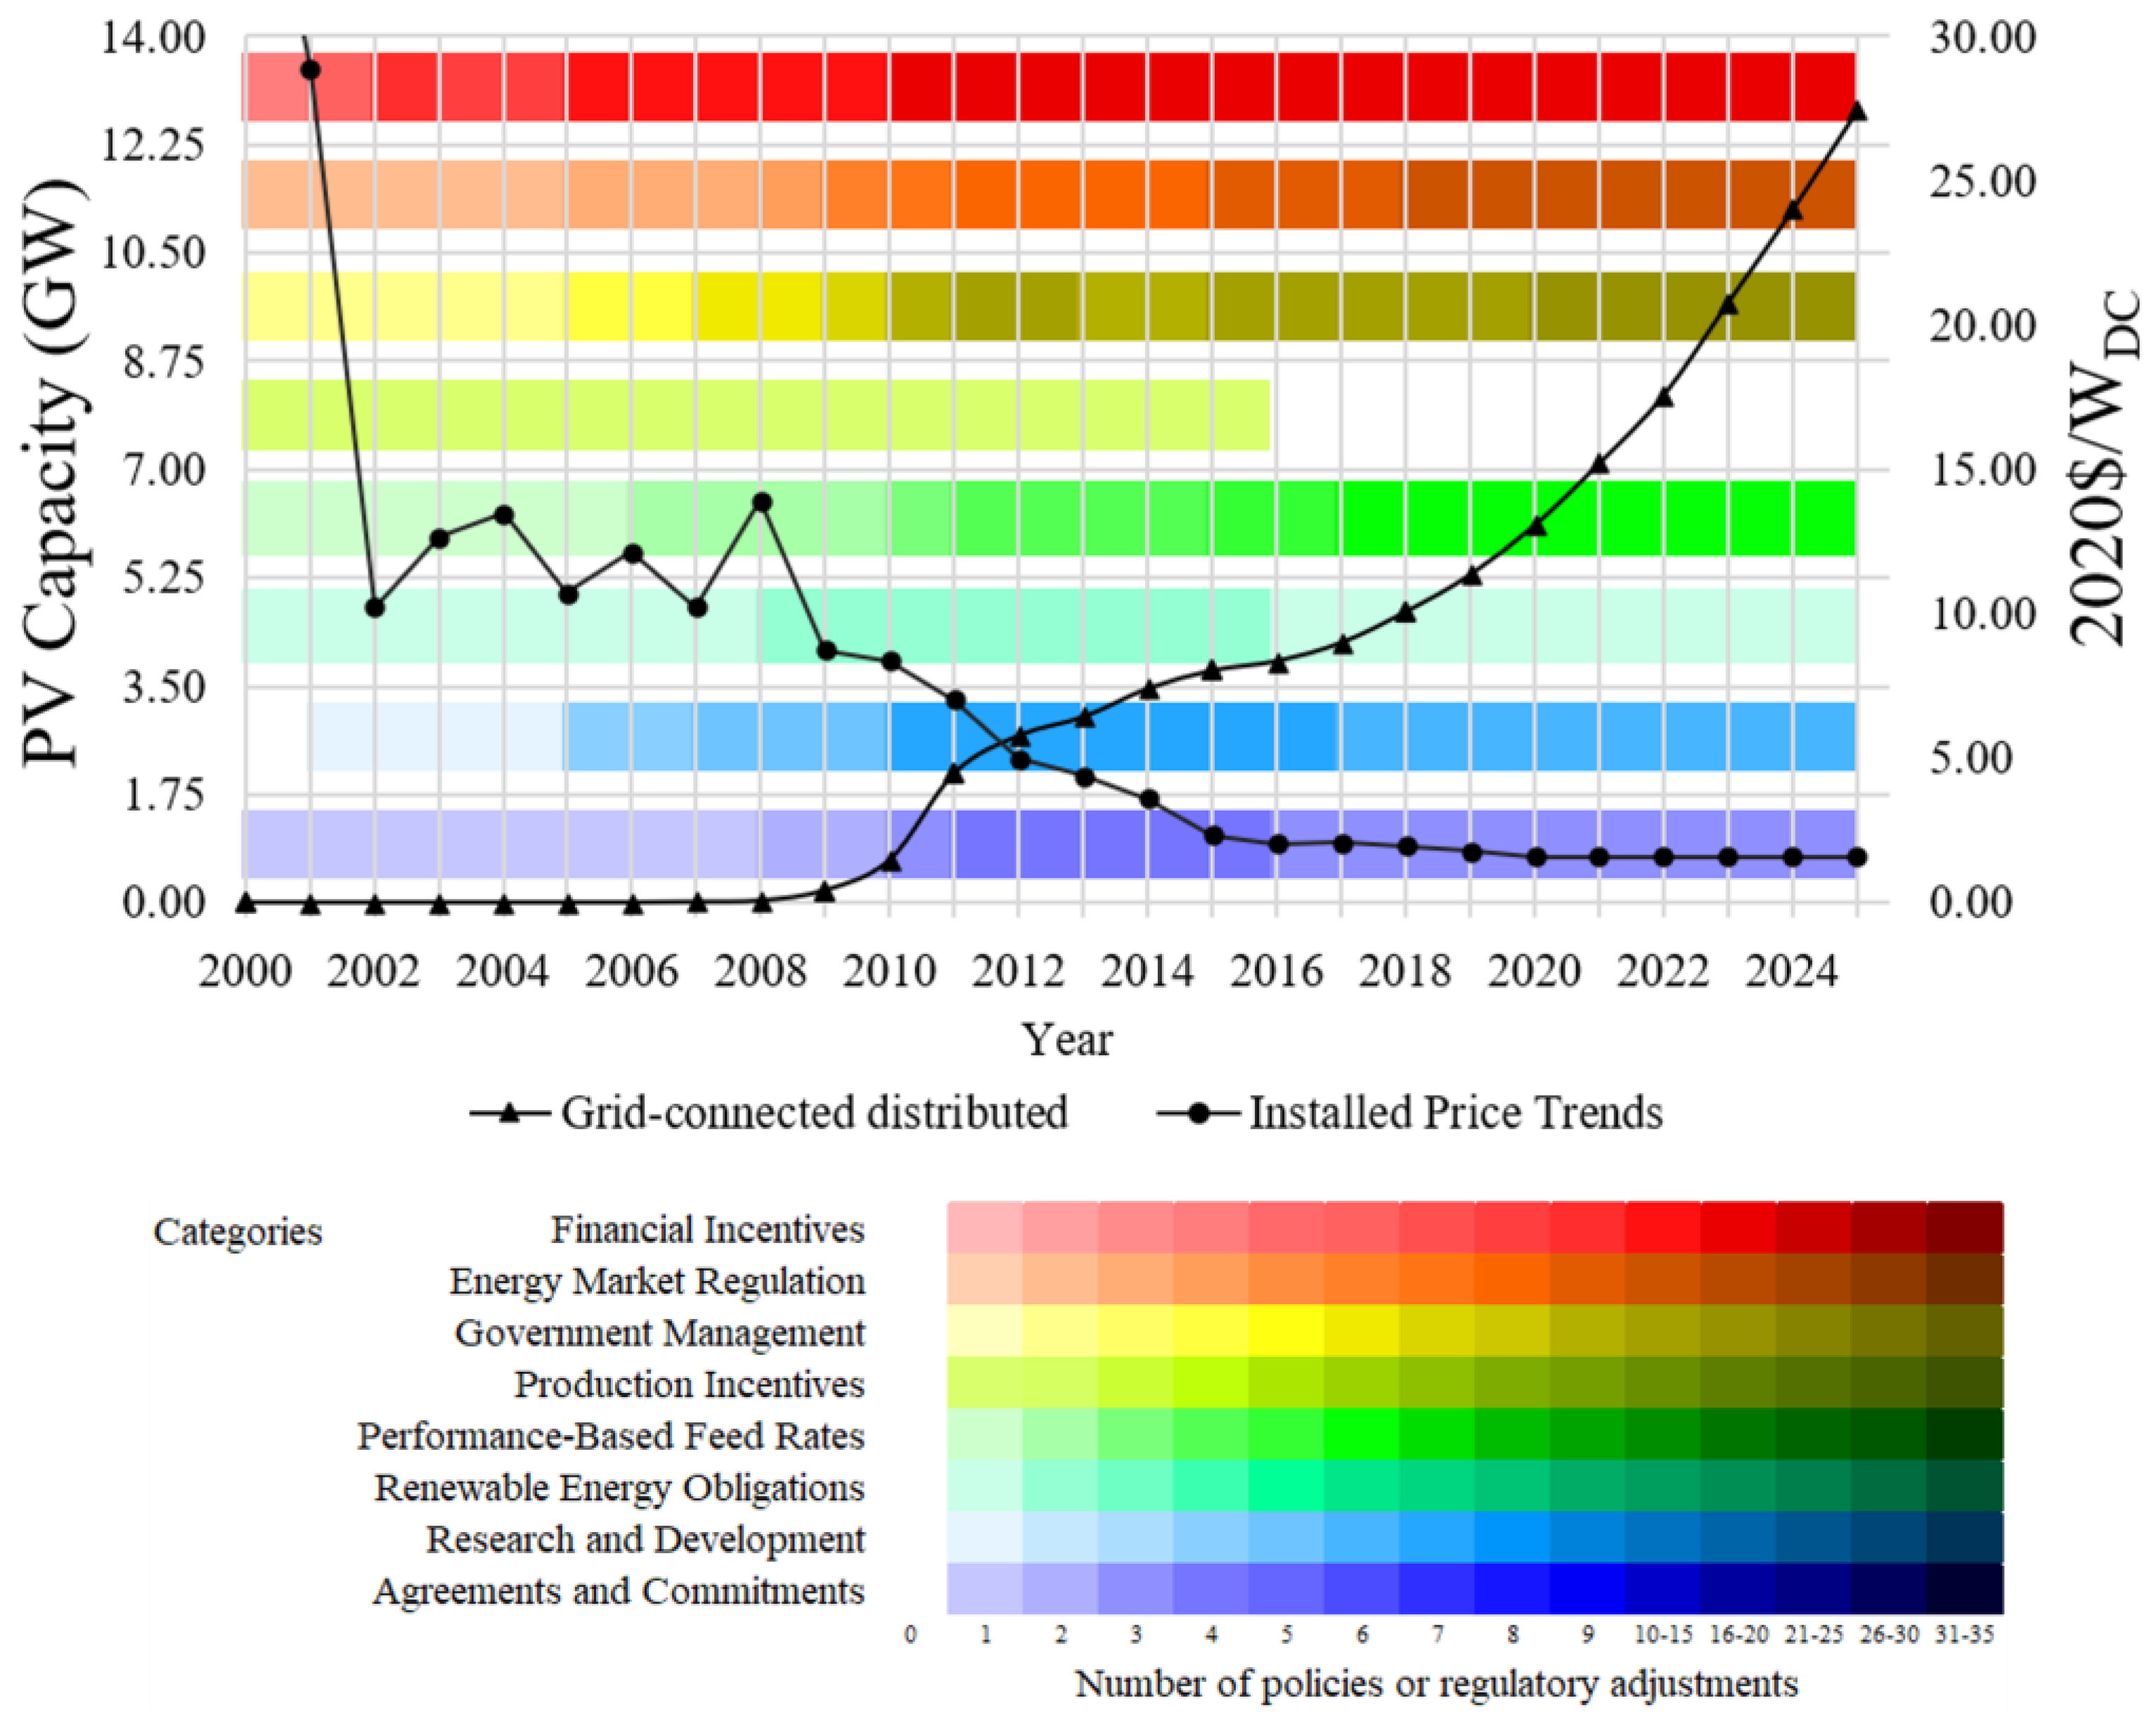
Since 2003, India has implemented a few policies to encourage the adoption of DGPV systems [87,88]. Notably, the Jawaharlal Nehru National Solar Mission (Phase I, II, and III) has been one of the critical drivers of the country’s DGPV market [89]. However, it was not until 2013 that the installed capacity of DGPV became significant, reaching 150 MW, and that same year saw a decrease in installed prices. The subsequent implementation of feed-in tariff policies in 2014, net-metering regulations for rooftop solar PV in 2015, and the Grid Connected Solar Power Rooftop Program in 2016 further stimulated market growth. During this period, prices fell by 44%, and the installed capacity increased to 1.3 GW. In 2019, the implementation of Renewable Purchase Obligations (RPOs) boosted the DGPV market [90], driving the installed capacity to 5.4 GW. The installed price of DGPV systems also experienced a further 21% reduction, reaching an all-time low. In 2022, the installed capacity reached a record of 15.2 GW. Figure 14 illustrates the correlation between the increase in installed capacity of distributed solar energy systems and the corresponding fluctuations in installed prices over the studied period, with a specific focus on India.

3.2.9. France

In France, from 2000 to 2008, the installed price of DGPV systems remained high and unstable. Furthermore, the installed capacity of these systems remained negligible during this period. However, from 2009 onward, the cost of DGPV systems began to decline gradually. Notably, in 2011, the installed capacity of DGPV systems reached 2.1 GW, representing a significant 200% increase compared to the previous year. During this period, the French government implemented various policies promoting the adoption of DGPV systems. Specifically, there were 18 policies in effect for direct financial incentives, 10 for government management, 8 for energy market regulation, and 7 for research and development. Furthermore, the government introduced a performance-based feed-in tariff policy in 2000, which has remained in force and is expected to continue until at least 2030 [91]. In the years following 2011, the cost of DGPV systems continued to decrease until it stabilized in 2016. During this period, the installed capacity of DGPV systems in France grew significantly, reaching 3.9 GW in 2016 and 5.0 GW in 2019. In 2022, the installed capacity reached a record of 8.20 GW. Figure 15 elucidates the connection between the expansion of installed capacity in distributed solar energy systems and fluctuations in installed prices throughout the study period, specifically focusing on France.

3.2.10. Belgium

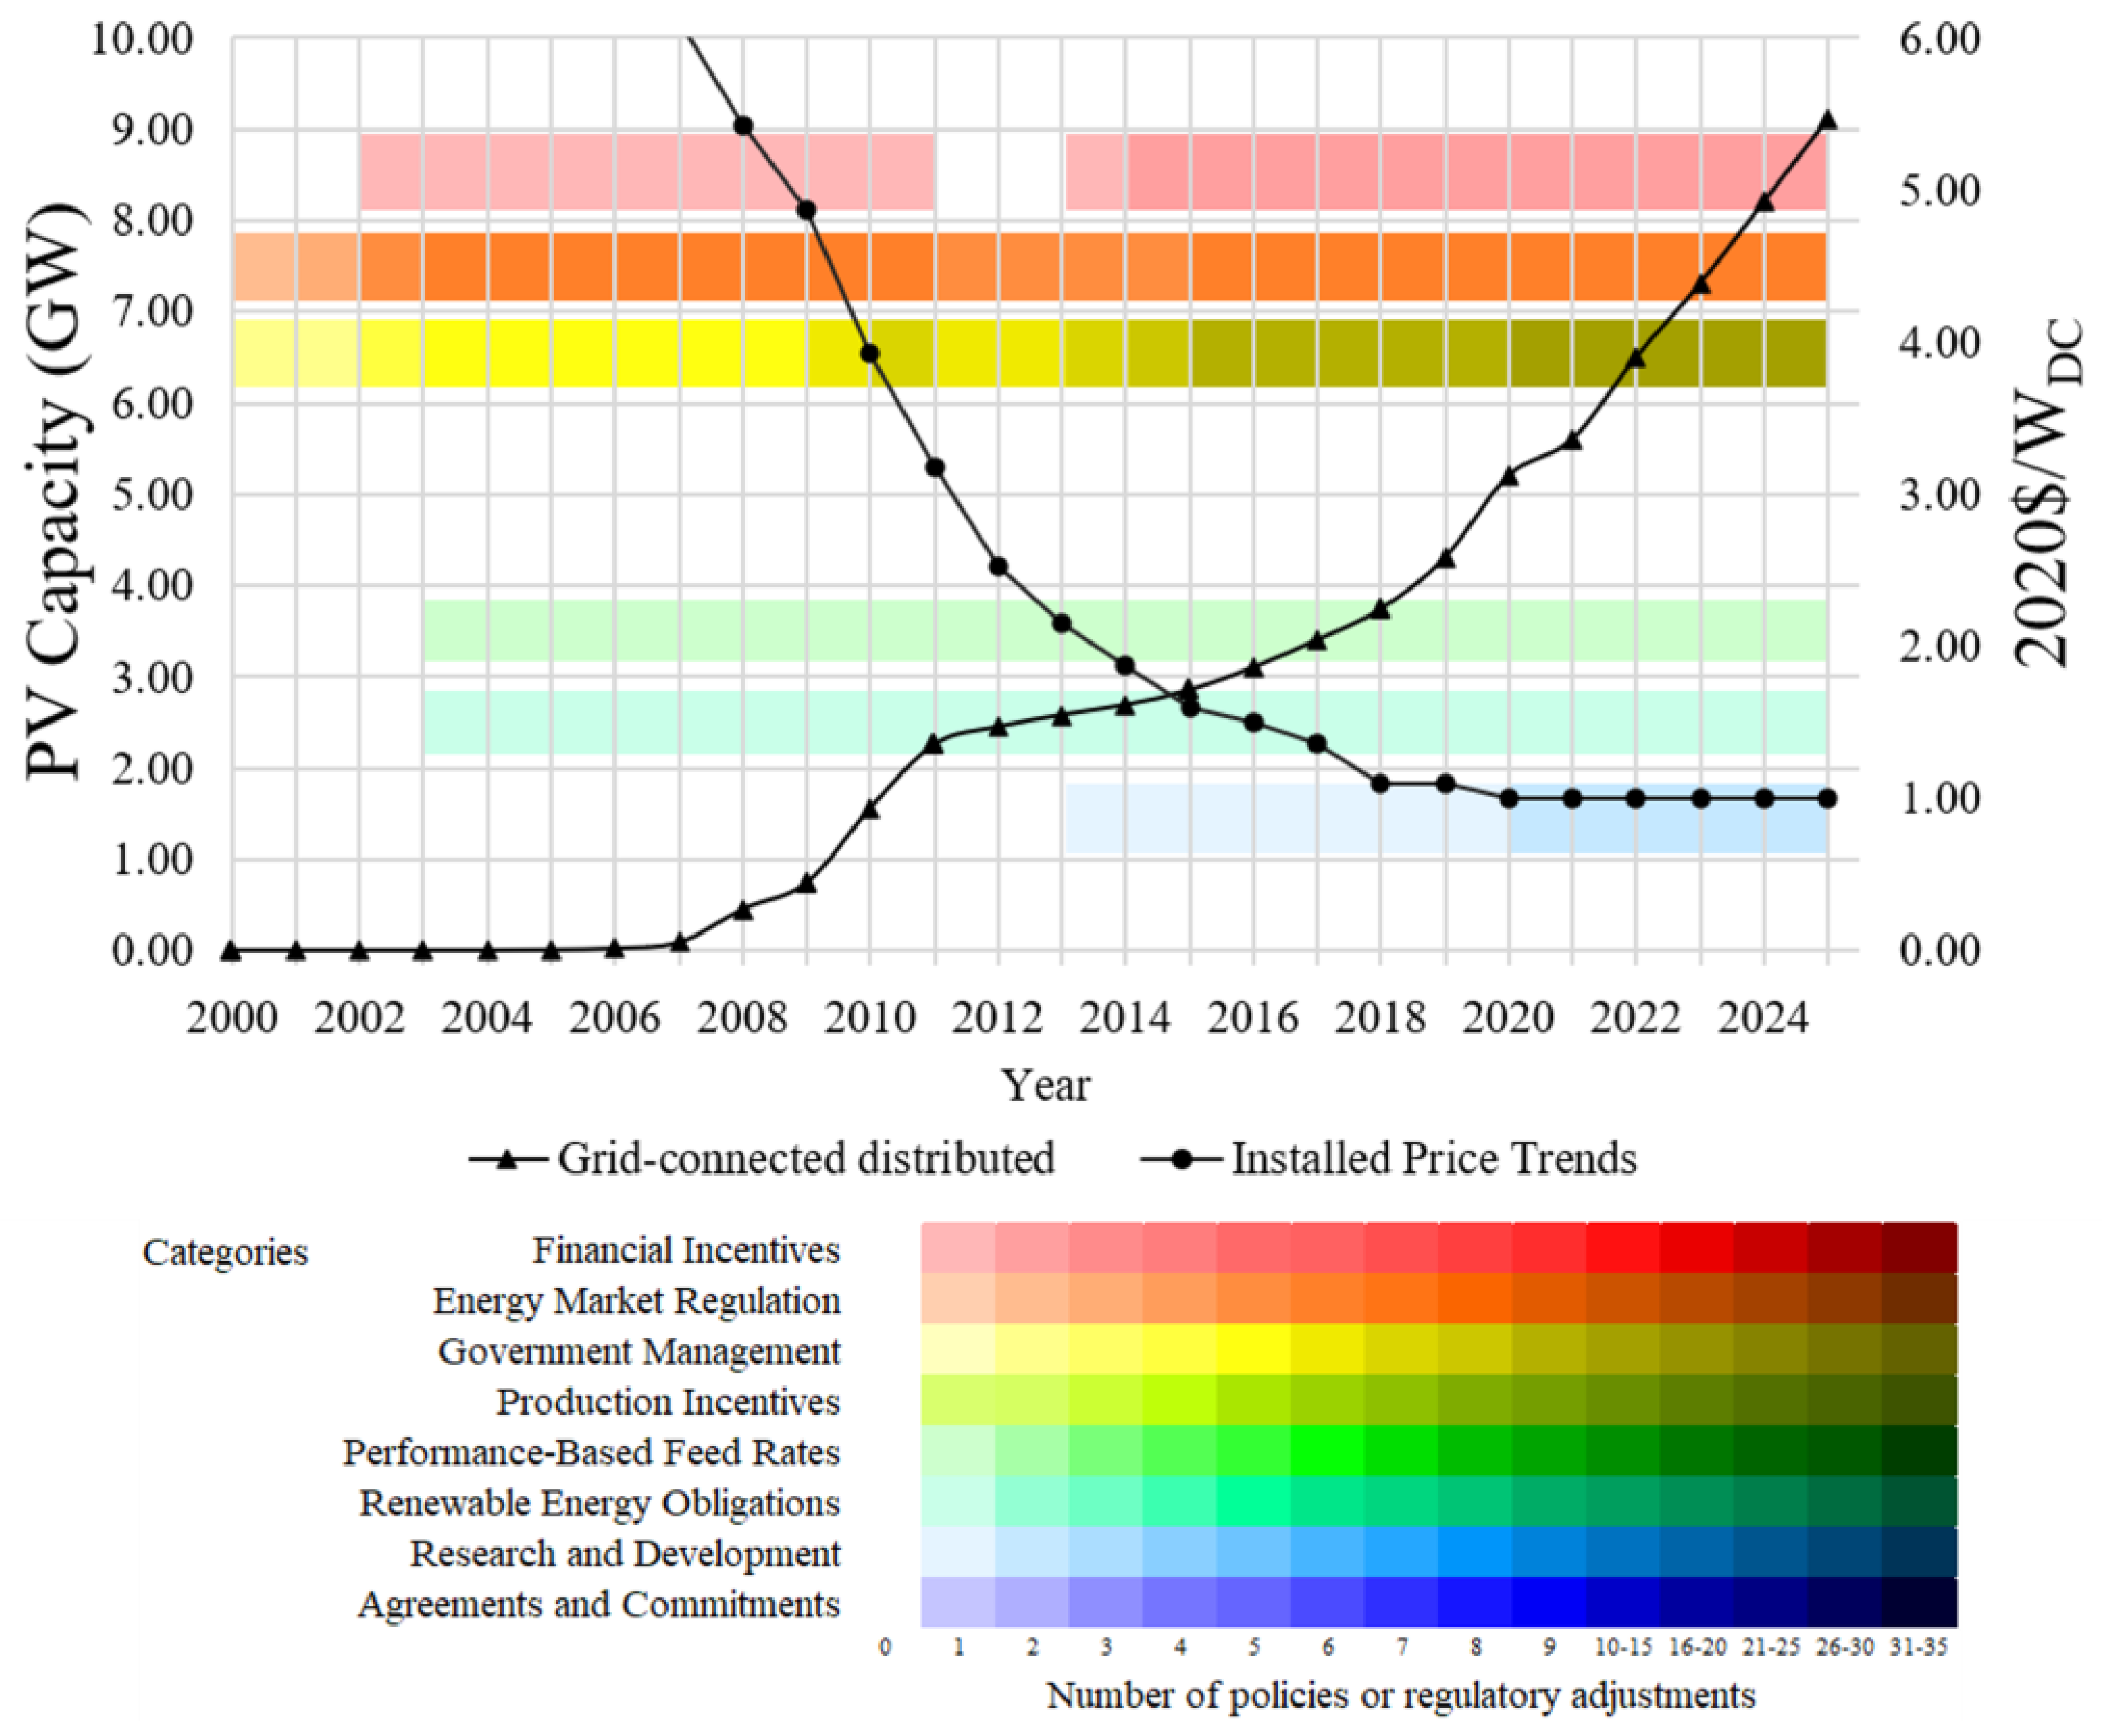
The deployment of distributed photovoltaic systems in Belgium experienced a significant upsurge in installed capacity beginning in 2007. This was accompanied by a notable decrease in the installed price of DGPV systems [92]. Between 2007 and 2011, the installed capacity exhibited an impressive growth rate, soaring from 0.09 GW to 2.26 GW. Subsequently, installed capacity continued to expand, albeit at a more subdued pace, registering an annual growth rate ranging from 2% to 6%. As of 2016 and 2019, the installed capacity had risen to 3.1 GW and 4.2 GW, respectively. Various policies were implemented over the years to facilitate this growth, including energy market regulation, which featured net metering, government management, direct financial incentives, and renewable energy obligations, which incorporated a quota system of green certificates [93,94]. In 2022, the installed capacity reached a record of 6.5 GW. Figure 16 illustrates the correlation between the expansion of installed capacity in distributed solar energy systems and variations in installation costs over the studied period, specifically in Belgium.
After examining individual country trends, a comprehensive analysis is consolidated, highlighting the specific policies driving the increase in installed capacity and the downward trajectory of installation prices. Table 4 presents the distribution of each policy type applied during the year, exhibiting the highest growth in installed capacity for each country. Similarly, Table 5 displays the frequency of policies implemented during the year that witnessed the most significant reduction in installation costs. The analysis reveals that Direct Financial Incentives, Energy Market Regulation, and Government Management policies consistently drove increased installed capacity and reduced installation costs across countries.

3.3. Mapping Renewable Energy Policies to Key Stakeholder Incentives

Understanding the differential impact of each policy mechanism on the various stakeholders in the distributed solar energy sector is crucial to discerning their overall effectiveness. These results aim to elucidate the differential effects experienced by different sectoral agents, thus identifying the main actors that drive the development of DGPV. By assessing the relative capabilities of these entities to promote DGPV growth, these results seek to determine the most effective policy measures to increase their capabilities. Depending on how the policy is implemented, it can provide benefits to multiple parties [95]. Prosumers (The term "prosumer" combines "producer" and "consumer," referring to individuals who both consume and generate electrical energy within their own consumer units), for instance, can benefit from demand-side policy measures, while integrators, equipment and component manufacturers, utilities, and research institutions can benefit from supply-side policy measures [96].

3.3.1. Prosumers

Prosumers can benefit from tax incentives and financial measures that encourage purchasing DGPV systems by offsetting acquisition, installation, and operating costs, making them more affordable. Energy market regulations that prioritize network access by DGPV systems, regulate energy credit markets, and promote self-consumption and demand management control can also benefit prosumers [97]. Additionally, government management can assist prosumers by providing technological roadmaps and planned initiatives to expand DGPV adoption. Performance-based feed-in tariffs can incentivize prosumers to generate electricity at or above market rates. Renewable energy obligations, agreements, and commitments can also promote investment in DGPV systems by providing involved entities with a stable and predictable financial structure [98,99]. As consumers and producers, prosumers have a crucial impact on the renewable energy market, actively transcending traditional passive positions.

3.3.2. Integrators

Direct financial incentives can benefit integrators and Engineering, Procurement, and Construction (EPC) companies directly or indirectly. Government management policies that promote the adoption of DGPV systems and directly impact prosumers or manufacturers can also indirectly affect integrators and EPC companies. As intermediaries in the energy sector, integrators and EPC companies are responsible for connecting producers and prosumers. Therefore, regulations and policies that benefit producers and prosumers can also have a significant impact on intermediaries [93].

3.3.3. Equipment and Component Manufacturers

The manufacturers of PV system equipment and components can benefit directly from tax incentives such as direct subsidies, tax exemptions, or tax reductions that promote production [100]. Government management policies that create technological roadmaps, establish production norms and requirements, and prescribe codes and reference standards can also impact PV equipment and component manufacturers. Additionally, government policies that require a minimum level of local production can facilitate the expansion of local production. Therefore, direct objective policies offering financial or technological incentives can be a valuable tool for incentivizing manufacturers. As the foundation of the PV sector, manufacturers of equipment and components play a pivotal role in shaping the industry’s growth [101].

3.3.4. Utilities

Utilities are vital agents in the renewable energy sector, benefiting from the growth of DGPV and the advantages they bring to the distribution system. Energy market regulation policies assign utilities to provide priority access to the grid for DGPV systems. Additionally, government guidelines establish renewable energy targets that utilities must meet. Renewable energy obligation mechanisms also require electricity providers to obtain a minimum proportion of their energy from renewable sources, driving utilities towards renewable energy adoption. Alternatively, utilities may have subsidiaries that produce renewable energy from DGPV and sell it on their marketplace [102]. In this case, agreements and commitments provide the stability and security necessary for utilities to invest and benefit directly from mechanisms and policies directed towards DGPV, thus becoming prosumers themselves. As agents responsible for managing the electricity generated by prosumers, utilities are responsible for accounting for the energy generated and consumed in the cycle [103].

3.3.5. Research Institutions

Research institutions provide an essential contribution to the growth and development of the photovoltaic sector. They receive specific incentives for research and development, which are vital for advancing and improving technology. These institutions are invested in particular funds to carry out research and develop new solutions that increase the efficiency, reliability, and scalability of photovoltaic systems while also reducing costs and increasing competitiveness in the energy market [104]. Table 6 presents the direct application of policies to each stakeholder. An analysis of these results reveals that prosumers emerge as the primary beneficiaries, with 585 policies directly targeting them, incentivizing investments in DGPV within their consumer units. Following prosumers, equipment and component manufacturers stand out, benefiting from 413 policies directly impacting their operations to bolster DGPV uptake. A more comprehensive examination indicates that Direct Financial Incentives and Government Management policies exhibit the broadest coverage across stakeholders, directly affecting three distinct agent categories. Specifically, the Direct Financial Incentives category impacts prosumers, integrators, and equipment and component manufacturers, while the Government Management policy category influences prosumers, integrators, equipment and component manufacturers, and utilities. Given their wide-ranging impact, Direct Financial Incentives and Government Management policies are identified as pivotal in driving DGPV development.

3.4. Examining Policy Mechanisms Across Renewable Energy Maturity Stages

The analysis reveals a clear progression in the number of policies supporting the development of DGPV technology across its various maturity phases, underscoring the critical role of policy in advancing solar PV technology. The results indicate a steady increase in implemented policies as DGPV technology matures. In the Initial Implementation Phase (TRL 1–3), characterized by low penetration rates and small installed capacities, 233 policies were recorded. The Initial Growth Phase (TRL 4–5), marked by moderate increases in capacity and initial cost reductions, saw the implementation of 276 distinct policies. The First Major Growth Phase (TRL 6–7) experienced a rapid rise in installed capacity and significant cost reductions, with 318 policy measures observed. Finally, the Mature Implementation Phase (TRL 8–9), defined by large installed capacities and stable, low installation costs, exhibited the highest number of policies, totaling 515. These findings highlight a strong correlation between the maturity of DGPV technology and the increasing number of supportive policies, emphasizing the importance of tailored policy measures in fostering the global advancement of solar PV technology. Displayed in Table 7 is an illustration of the correlation between implemented policies and the advancement of technology development phases.

3.5. Aligning DGPV Policy Strategies with Socioeconomic Development

Countries exhibit varying financial resources and public awareness levels, depending on their socioeconomic characteristics. Economic performance indicators such as the Gross Domestic Product (GDP) and the Human Development Index (HDI), which evaluates human well-being, are essential in comparative analyses. Countries with higher GDP have more outstanding financial capabilities to invest in DGPV systems. Conversely, countries with lower GDP require incentives and subsidies to make the technology more accessible to consumers. Countries with higher HDI possess a more educated population and are conscious of the significance of clean energy. Countries with lower HDI face additional challenges, such as inadequate infrastructure, low public awareness, and insufficient financial resources. Therefore, incentive-oriented policies must cater to the specific needs of each country [105].
The analysis of the top 10 countries that invested in GDFV reveals disparities in their GDP and HDI values, which vary both between countries and within the same country over the period under scrutiny. This study examined the policies implemented when GDP values fell within predetermined ranges, as well as the HDI. The results indicate that across all ranges of GDP per capita, spanning from 0 to 80,000 mi, the most frequently applied policies were government management, direct financial incentives, and regulation of the energy market. These policies were most observed in countries with a GDP per capita ranging from 4000 to 9999 mi and 60,000 to 69,999 mi. The distribution of policy implementation ratios in each category, stratified by GDP per capita value ranges, is presented in Table 8.
In terms of HDI, the analysis reveals that Government Management, Direct Financial Incentives, and Energy Market Regulation were the most frequently applied policy categories across all the HDI value ranges examined, ranging from 0.400 to 1.000. For a more comprehensive overview, Table 9 summarizes the distribution of policy categories for each HDI value range.

3.6. Exploring the Impact of Electricity Sector Scenarios on DGPV Incentive Mechanisms

The characteristics of the electricity sector in each country can significantly influence the formulation of policies promoting DGPV. The composition of the electricity generation mix is also an essential factor to consider. In countries that rely heavily on energy from fossil fuels, there may be a greater need to reduce greenhouse gas emissions, thereby incentivizing the adoption of clean energy generation technologies [106]. Conversely, if the country already has a diversified electrical mix, with a significant amount of energy generated from renewable sources, adopting incentive policies may be more restrained. The need to reduce electricity imports can encourage the adoption of DGPV.
This analysis examines two critical characteristics of the electricity sector in each of the ten countries under study. The first characteristic focuses on the proportion of electricity generated from renewable energy sources. Second, the analysis considers the extent of net electricity imports within each country. The analysis of the electricity sector in the 10 countries under study reveals that the policies and mechanisms employed are significantly influenced by the proportion of renewable energy and the volume of net electricity imports. Notably, the predominant strategies across both analyses were government management, direct financial incentives, and energy market regulation, in that order.
The proportion of renewables in electricity generation was categorized in distinct ranges. Countries with the lowest and highest shares of renewable energy implemented fewer policies to promote DGPV. Conversely, the median ranges exhibited the most significant implementation of policies. Detailed statistics can be found in Table 10.
Regarding net imports, countries with negative net imports (indicating energy export) exhibit the most extensive array of applied policies, followed by those with net imports ranging from 0 to 9.99 GWh. This pattern highlights the inverse relationship between the volume of imported energy and the number of policies favoring DGPV systems. For additional insights, please refer to Table 11.

4. Discussion and Policy Implications

This study, motivated by the current renewable energy landscape and focusing on DGPV, aims to identify the optimal policies for advancing DGPV. We highlight successful strategies that could be adapted to other contexts by examining policies crucial to growth in the top 10 investing countries. This approach categorizes and customizes these policies to strategically promote a DGPV development that aligns with regional realities. Table 12 provides an overview of the key findings from this endeavor. The study underscores the imperative of steering policy initiatives, mainly through interventions categorized under Government Management, to sculpt a regulatory environment conducive to DGPV growth. Furthermore, an analysis advocates for synergistically combining these policies with direct financial incentives to ensure the successful development of DGPV.
Analyzing these critical parameters reveals a prevailing emphasis on government management policy as the principal catalyst. This underscores the crucial role of political determination in propelling technological advancement. Additionally, direct financial incentives and energy market regulation emerged as critical drivers for fostering and sustaining the sustainable growth of DGPV, both during the early stages of development and throughout its technological maturity. This research underlines the crucial role of policy interventions in accelerating the adoption and cost reduction of DGPV. The findings of this study make a significant contribution by equipping decision makers with a range of mechanisms and policy options that have played instrumental roles in different phases of DGPV technology development.
The assessment indicates that direct financial incentives, energy market regulation, and government management policies consistently played a crucial role in reducing installation prices and boosting installed capacity, answering inquiries about policy impact on price trends and capacity growth. The study also aims to elucidate the most influential stakeholders in bolstering the DGPV sector and the specific policies and incentive mechanisms that directly benefit these stakeholders. Among the eight identified categories, six are directly linked to prosumers. Prosumers emerge as the pivotal agents capable of driving the development of DGPV systems. Consequently, to foster DGPV expansion, emphasis should be placed on implementing policies that favor prosumers.
Regarding technological maturity, the investigation aimed to identify the most suitable policies for each maturity level. The results indicate that government management, direct financial incentives, and energy market regulation were consistently applied across all maturity periods analyzed. Consequently, these three policy mechanisms are universally effective in fostering DGPV development, irrespective of technological maturity level.
Government management was found to be the most effective policy in lower-GDP nations by analyzing socioeconomic indicators of national readiness and commitment to invest in DGPV. In contrast, a mix of management and financial incentives is optimal for higher-GDP nations. This pattern also applies to HDI; countries with lower HDI benefit most from management policies, whereas those with higher HDI achieve better results when combining management with financial incentives.
Considering the electricity sector’s unique characteristics, the most suitable policies for DGPV integration have been identified. Direct financial incentives are most effective in low-renewable scenarios, while government management policies are more appropriate in high-renewable contexts. Likewise, government management policies remain the most suitable approach across different levels of net imports.
This study presents significant insights that can enhance the distributed photovoltaic sector by offering a strategic framework for the development of distributed photovoltaic generation. The research identifies essential policy approaches that can be tailored to various regional contexts through the analysis of successful policies from nations with the highest installed capacities. This enables governments and stakeholders to design localized and practical strategies that foster the adoption of distributed photovoltaics, ensuring the alignment with specific energy requirements and challenges. Consequently, this research has the potential to facilitate the increased deployment of distributed photovoltaic systems, mitigate barriers to adoption, and expedite the transition toward cleaner and more sustainable energy systems on a global scale.

5. Conclusions

The primary objective of this study was to evaluate the performance and influence of various policies on the penetration of DGPV technology. The analysis was drawn from the experiences of the top ten investing countries to identify key policies that have contributed significantly to the growth of the DGPV. By categorizing and adapting these policies to specific territorial contexts, the approach aims to strategically promote the development of DGPV in alignment with regional realities.
The main results of our research highlight the predominant role of government management policies, direct financial incentives, and energy market regulation in fostering the development and reducing the installation costs of DGPV. These policies were consistently effective across technological maturity and socioeconomic contexts. Government management policies are particularly effective in countries with lower GDP and HDI values. In comparison, combining government management and direct financial incentives proves optimal in higher GDP and HDI contexts.
Despite these significant insights, future studies are needed to explore the long-term effects of these policies on DGPV adoption and cost trends. Further research should also investigate the effectiveness of these policies in diverse socio-political environments and their adaptability to emerging renewable energy technologies. Analyzing and refining policy mechanisms can better equip decision makers with the tools necessary to accelerate the global transition to sustainable energy systems, particularly photovoltaic distributed generation.
In the long term, the success of DGPV surmounts several critical barriers, particularly those associated with political and financial challenges. Well-structured energy policies play a crucial role in overcoming these obstacles by establishing a stable and supportive environment conducive to technological advancement. Through effective policy frameworks, governments can alleviate financial risks and provide the necessary incentives to render distributed solar PV generation more accessible and attractive to consumers. These policies not only foster the adoption of this technology but also stimulate the development of more efficient and innovative solutions. In this regard, distributed solar PV generation contributes to reducing greenhouse gas emissions, diversifies the energy mix, and lessens dependence on foreign energy sources. Addressing long-term political barriers is essential to ensure that the growth of this technology remains sustainable and that its benefits, such as broadening access to abundant solar resources, can be thoroughly realized. Tackling these challenges establishes a solid foundation for the future of distributed solar PV generation, thereby supporting the transition toward a more sustainable and energy-independent future.

Author Contributions

Conceptualization, A.F.P.d.L. and A.M.S.; methodology, A.F.P.d.L. and A.M.S.; validation, A.F.P.d.L.; formal analysis, A.F.P.d.L. and A.M.S.; investigation, A.M.S.; resources, A.F.P.d.L.; data curation, A.M.S.; writing—original draft preparation, A.M.S.; writing—review and editing, A.F.P.d.L.; visualization, A.F.P.d.L.; supervision, A.F.P.d.L.; funding acquisition, A.F.P.d.L. All authors have read and agreed to the published version of the manuscript.

Funding

This research was funded by the National Council for Scientific and Technological Development (CNPq) of Brazil.

Data Availability Statement

Data are contained within the article.

Acknowledgments

This work was supported by the National Council for Scientific and Technological Development (CNPq) of Brazil. The authors acknowledge the use of AI-assisted technologies with sole objective of improving the language and readability of the paper.

Conflicts of Interest

The authors declare no conflicts of interest.

References

  1. UNFCCC Kyoto Protocol—Targets for the First Commitment Period. Available online: https://unfccc.int/process-and-meetings/the-kyoto-protocol/what-is-the-kyoto-protocol/kyoto-protocol-targets-for-the-first-commitment-period (accessed on 20 September 2023).
  2. Song, X.; Wang, P. Effectiveness of Carbon Emissions Trading and Renewable Energy Portfolio Standards in the Chinese Provincial and Coupled Electricity Markets. Util. Policy 2023, 84, 101622. [Google Scholar] [CrossRef]
  3. Pichou, M.; Dussartre, V.; Lâasri, M.; Keppler, J.H. The Value of Distributed Flexibility for Reducing Generation and Network Reinforcement Costs. Util Policy 2023, 82, 101565. [Google Scholar] [CrossRef]
  4. Meflah, A.; Chekired, F.; Drir, N.; Canale, L. Accurate Method for Solar Power Generation Estimation for Different PV (Photovoltaic Panels) Technologies. Resources 2024, 13, 166. [Google Scholar] [CrossRef]
  5. IEA-PVPS. Trends in Photovoltaic Applications 2024, 1st ed.; International Energy Agency: Redfern, Australia, 2024; pp. 1–104. [Google Scholar]
  6. McGreevy, D.M.; MacDougall, C.; Fisher, D.M.; Henley, M.; Baum, F. Expediting a Renewable Energy Transition in a Privatised Market via Public Policy: The Case of South Australia 2004-18. Energy Policy 2021, 148, 111940. [Google Scholar] [CrossRef]
  7. Heilmann, E. The Impact of Transparency Policies on Local Flexibility Markets in Electric Distribution Networks. Util Policy 2023, 83, 101592. [Google Scholar] [CrossRef]
  8. IEA-PVPS. Trends in Photovoltaic Applications 2023, 1st ed.; International Energy Agency: Redfern, Australia, 2023; pp. 1–96. [Google Scholar]
  9. IRENA. Renewable Power Generation Costs in 2020, 1st ed.; International Renewable Energy Agency: Abu Dhabi, United Arab Emirates, 2021; pp. 2–180. [Google Scholar]
  10. IRENA; IEA; REN21. Renewable Energy Policies in a Time of Transition, 1st ed.; International Renewable Energy Agency (IRENA), International Energy Agency (IEA), and Renewable Energy Policy Network for the 21st Century (REN21): Redfern, Australia, 2018; pp. 1–112. ISBN 9789292600617. [Google Scholar]
  11. Yetkiner, H.; Berk, I. Energy Intensity and Directed Fiscal Policy. Econ. Syst. 2023, 47, 101070. [Google Scholar] [CrossRef]
  12. Gunkel, P.A.; Bergaentzlé, C.M.; Keles, D.; Scheller, F.; Jacobsen, H.K. Grid Tariff Designs to Address Electrification and Their Allocative Impacts. Util Policy 2023, 85, 101676. [Google Scholar] [CrossRef]
  13. Liu, Y.; Dong, K.; Dong, X.; Taghizadeh-Hesary, F. Towards a Sustainable Electricity Industry in China: An Appraisal of the Efficacy of Environmental Policies. Util Policy 2024, 86, 101700. [Google Scholar] [CrossRef]
  14. Ding, L.; Zhang, Z.; Dai, Q.; Zhu, Y.; Shi, Y. Alternative Operational Modes for Chinese PV Poverty Alleviation Power Stations: Economic Impacts on Stakeholders. Util Policy 2023, 82, 101524. [Google Scholar] [CrossRef]
  15. Ali, A.; Shahid, M.; Qadir, S.A.; Islam, M.T.; Khan, M.W.; Ahmed, S. Solar PV End-of-Life Waste Re-cycling: An Assessment of Mechanical Recycling Methods and Proposed Hybrid Laser and High Voltage Pulse Crushing Method. Resources 2024, 13, 169. [Google Scholar] [CrossRef]
  16. IRENA. Policies and Regulations for Private Sector Renewable Energy Mini-Grids, 1st ed.; International Renewable Energy Agency: Abu Dhabi, United Arab Emirates, 2016; pp. 1–112. ISBN 9789295111455. [Google Scholar]
  17. Neves, D.; Scott, I.; Silva, C.A. Peer-to-Peer Energy Trading Potential: An Assessment for the Residential Sector under Different Technology and Tariff Availabilities. Energy 2020, 205, 118023. [Google Scholar] [CrossRef]
  18. Schaffer, L.M.; Bernauer, T. Explaining Government Choices for Promoting Renewable Energy. Energy Policy 2014, 68, 15–27. [Google Scholar] [CrossRef]
  19. Jain, P.; Bardhan, S. Sustainable Energy Deployment in Developing Countries: The Role of Composition of Energy Aid. Econ. Syst. 2024, 48, 101195. [Google Scholar] [CrossRef]
  20. IEA. Renewables 2022, 1st ed.; International Energy Agency: Paris, France, 2022; pp. 1–159. [Google Scholar]
  21. IEA. Renewables 2019, 1st ed.; International Energy Agency: Paris, France, 2019; pp. 1–204. [Google Scholar]
  22. Brown, A.; Bunyan, J. Valuation of Distributed Solar: A Qualitative View. Electr. J. 2014, 27, 1040–6190. [Google Scholar] [CrossRef]
  23. Mandelli, S.; Mereu, R. Distributed Generation for Access to Electricity: “Off-Main-Grid” Systems from Home-Based to Microgrid. In Renewable Energy for Unleashing Sustainable Development, 1st ed.; Colombo, E., Bologna, S., Masera, D., Eds.; Springer: Cham, Switzerland, 2013; pp. 75–97. ISBN 978-331900284-2/978-331900283-5. [Google Scholar] [CrossRef]
  24. Oprea, S.V.; Bâra, A. Generative Literature Analysis on the Rise of Prosumers and Their Influence on the Sustainable Energy Transition. Util Policy 2024, 90, 101799. [Google Scholar] [CrossRef]
  25. Baliozan, P.; Mourad, S.; Morse, D.; Kim, S.; Friedrich, L.; Preu, R. Photovoltaic Development Standardizing Based on Roadmaps and Technology Readiness Levels. In Proceedings of the European Photovoltaic Solar Energy Conference and Exhibition, Munich, Germany, 24 June 2016. [Google Scholar] [CrossRef]
  26. Fischer, M.; Woodhouse, M.; Baliozan, P. International Technology Roadmap for Photovoltaics (ITRPV)—2023 Results, 15th ed.; VDMA e. V. Photovoltaics Equipment, a Sector Group of EMINT: Frankfurt am Main, Germany, 2024; pp. 1–82. [Google Scholar]
  27. Zhao, Y.; Tang, K.K.; Wang, L. li Do Renewable Electricity Policies Promote Renewable Electricity Generation? Evidence from Panel Data. Energy Policy 2013, 62, 887–897. [Google Scholar] [CrossRef]
  28. Marques, A.C.; Fuinhas, J.A.; Manso, J.P. A Quantile Approach to Identify Factors Promoting Renewable Energy in European Countries. Environ. Resour. Econ. 2011, 49, 351–366. [Google Scholar] [CrossRef]
  29. IEA Policies Database Solar PV National. Available online: https://www.iea.org/policies?jurisdiction=National&technology%5B0%5D=Solar%20PV (accessed on 21 August 2023).
  30. Batlle, C. A Method for Allocating Renewable Energy Source Subsidies among Final Energy Consumers. Energy Policy 2011, 39, 2586–2595. [Google Scholar] [CrossRef]
  31. Altenburg, T.; Engelmeier, T. Boosting Solar Investment with Limited Subsidies: Rent Management and Policy Learning in India. Energy Policy 2013, 59, 866–874. [Google Scholar] [CrossRef]
  32. Mir-Artigues, P.; Del Río, P. Combining Tariffs, Investment Subsidies and Soft Loans in a Renewable Electricity Deployment Policy. Energy Policy 2014, 69, 430–442. [Google Scholar] [CrossRef]
  33. Schmidt, J.; Wehrle, S.; Rusbeh, R. A Reduction of Distribution Grid Fees by Combined PV and Battery Systems under Different Regulatory Schemes. In Proceedings of the International Conference on the European Energy Market, EEM 2016, Porto, Portugal, 6–9 June 2016. [Google Scholar]
  34. de Castro Vieira, S.; Tapia Carpio, L.G. The Economic Impact on Residential Fees Associated with the Expansion of Grid-Connected Solar Photovoltaic Generators in Brazil. Renew Energy 2020, 159, 1084–1098. [Google Scholar] [CrossRef]
  35. Gautier, A.; Hoet, B.; Jacqmin, J.; Van Driessche, S. Self-Consumption Choice of Residential PV Owners under Net-Metering. Energy Policy 2019, 128, 648–653. [Google Scholar] [CrossRef]
  36. Jonh, J.S. Breaking: California’s NEM 2.0 Decision Keeps Retail Rate for Rooftop Solar, Adds Time-of-Use. Available online: https://www.greentechmedia.com/articles/read/Californias-Net-Metering-2.0-Decision-Rooftop-Solar-to-Keep-Retail-Payme (accessed on 28 May 2020).
  37. Rehman, W.U.; Bhatti, A.R.; Awan, A.B.; Sajjad, I.A.; Khan, A.A.; Bo, R.; Haroon, S.S.; Amin, S.; Tlili, I.; Oboreh-Snapps, O. The Penetration of Renewable and Sustainable Energy in Asia: A State-of-the-Art Review on Net-Metering. IEEE Access 2020, 8, 170364–170388. [Google Scholar] [CrossRef]
  38. Singla, A.; Singh, K.; Yadav, V.K.; Padhy, N.P. Development of Distributed Solar Photovoltaic Energy Market in India. In Proceedings of the IEEE Power and Energy Society General Meeting 2015, Denver, CO, USA, 26–30 July 2015. [Google Scholar]
  39. Biresselioglu, M.E.; Nilsen, M.; Demir, M.H.; Røyrvik, J.; Koksvik, G. Examining the Barriers and Motivators Affecting European Decision-Makers in the Development of Smart and Green Energy Technologies. J. Clean. Prod. 2018, 198, 417–429. [Google Scholar] [CrossRef]
  40. Carfora, A.; Pansini, R.V.; Romano, A.A.; Scandurra, G. Renewable Energy Development and Green Public Policies Complementarities: The Case of Developed and Developing Countries. Renew. Energy 2018, 115, 741–749. [Google Scholar] [CrossRef]
  41. Noblet, C.L.; Teisl, M.F.; Evans, K.; Anderson, M.W.; McCoy, S.; Cervone, E. Public Preferences for Investments in Renewable Energy Production and Energy Efficiency. Energy Policy 2015, 87, 177–186. [Google Scholar] [CrossRef]
  42. Sharma, N.K.; Tiwari, P.K.; Sood, Y.R. Solar Energy in India: Strategies, Policies, Perspectives and Future Potential. Renew. Sustain. Energy Rev. 2012, 16, 933–941. [Google Scholar] [CrossRef]
  43. Qadir, S.A.; Al-Motairi, H.; Tahir, F.; Al-Fagih, L. Incentives and Strategies for Financing the Re-newable Energy Transition: A Review. Energy Rep. 2021, 7, 3590–3606. [Google Scholar] [CrossRef]
  44. Salleh, S.F.; Roslan, M.E.; Isa, A.M.; Nair, M.F.B.; Salleh, S.S. The Impact of Minimum Energy Performance Standards (MEPS) Regulation on Electricity Saving in Malaysia. In Proceedings of the IOP Conference Series: Materials Science and Engineering, Kuching, Malaysia, 7–8 August 2017; 2018; 341, p. 012022. [Google Scholar] [CrossRef]
  45. Sonnenschein, J.; Van Buskirk, R.; Richter, J.L.; Dalhammar, C. Minimum Energy Performance Standards for the 1.5 °C Target: An Effective Complement to Carbon Pricing. Energy Effic. 2019, 12, 387–402. [Google Scholar] [CrossRef]
  46. Liu, C.; Li, N.; Zha, D. On the Impact of FIT Policies on Renewable Energy Investment: Based on the Solar Power Support Policies in China’s Power Market. Renew. Energy 2016, 94, 251–267. [Google Scholar] [CrossRef]
  47. Campoccia, A.; Dusonchet, L.; Telaretti, E.; Zizzo, G. An Analysis of Feed’in Tariffs for Solar PV in Six Representative Countries of the European Union. Sol. Energy 2014, 107, 530–542. [Google Scholar] [CrossRef]
  48. Pyrgou, A.; Kylili, A.; Fokaides, P.A. The Future of the Feed-in Tariff (FiT) Scheme in Europe: The Case of Photovoltaics. Energy Policy 2016, 95, 94–102. [Google Scholar] [CrossRef]
  49. Leiren, M.D.; Reimer, I. Historical Institutionalist Perspective on the Shift from Feed-in Tariffs to-wards Auctioning in German Renewable Energy Policy. Energy Res. Soc. Sci. 2018, 43, 33–40. [Google Scholar] [CrossRef]
  50. Goodarzi, S.; Aflaki, S.; Masini, A. Optimal Feed-In Tariff Policies: The Impact of Market Structure and Technology Characteristics. Prod. Oper. Manag. 2019, 28, 1108–1128. [Google Scholar] [CrossRef]
  51. Shrimali, G.; Tirumalachetty, S. Renewable Energy Certificate Markets in India-A Review. Renew. Sustain. Energy Rev. 2013, 26, 702–716. [Google Scholar] [CrossRef]
  52. Pineda, S.; Bock, A. Renewable-Based Generation Expansion under a Green Certificate Market. Renew. Energy 2016, 91, 53–63. [Google Scholar] [CrossRef]
  53. Wiser, R.; Barbose, G.; Holt, E. Supporting Solar Power in Renewables Portfolio Standards: Experience from the United States. Energy Policy 2011, 39, 3894–3905. [Google Scholar] [CrossRef]
  54. Bird, L.; Chapman, C.; Logan, J.; Sumner, J.; Short, W. Evaluating Renewable Portfolio Standards and Carbon Cap Scenarios in the U.S. Electric Sector. Energy Policy 2011, 39, 2573–2585. [Google Scholar] [CrossRef]
  55. Jo, J.H.; Hayden, J.; Noll, S. Feasibility and Consumer Benefits of Meeting the Renewable Portfolio Standard for Distributed Generation in Illinois. Int. J. Sustain. Build. Technol. Urban Dev. 2014, 5, 171–182. [Google Scholar] [CrossRef]
  56. Ma, J.; Xu, T. Optimal Strategy of Investing in Solar Energy for Meeting the Renewable Portfolio Standard Requirement in America. J. Oper. Res. Soc. 2023, 74, 181–194. [Google Scholar] [CrossRef]
  57. Chang, K.; Xue, C.; Zhang, H.; Zeng, Y. The Effects of Green Fiscal Policies and R&D Investment on a Firm’s Market Value: New Evidence from the Renewable Energy Industry in China. Energy 2022, 251, 123953. [Google Scholar] [CrossRef]
  58. Yu, F.; Guo, Y.; Le-Nguyen, K.; Barnes, S.J.; Zhang, W. The Impact of Government Subsidies and En-terprises’ R&D Investment: A Panel Data Study from Renewable Energy in China. Energy Policy 2016, 89, 106–113. [Google Scholar] [CrossRef]
  59. Chen, Z.; Sun, P. Generic Technology R&D Strategies in Dual Competing Photovoltaic Supply Chains: A Social Welfare Maximization Perspective. Appl. Energy 2024, 353, 122089. [Google Scholar] [CrossRef]
  60. Emili, S.; Ceschin, F.; Harrison, D. Product–Service System Applied to Distributed Renewable Energy: A Classification System, 15 Archetypal Models and a Strategic Design Tool. Energy Sustain. Dev. 2016, 32, 71–98. [Google Scholar] [CrossRef]
  61. Funkhouser, E.; Blackburn, G.; Magee, C.; Rai, V. Business Model Innovations for Deploying Distrib-uted Generation: The Emerging Landscape of Community Solar in the U.S. Energy Res. Soc. Sci. 2015, 10, 90–101. [Google Scholar] [CrossRef]
  62. O’Shaughnessy, E.; Barbose, G.; Wiser, R.; Forrester, S.; Darghouth, N. The Impact of Policies and Business Models on Income Equity in Rooftop Solar Adoption. Nat. Energy 2021, 6, 84–91. [Google Scholar] [CrossRef]
  63. Strupeit, L.; Palm, A. Overcoming Barriers to Renewable Energy Diffusion: Business Models for Customer-Sited Solar Photovoltaics in Japan, Germany and the United States. J. Clean. Prod. 2016, 123, 124–136. [Google Scholar] [CrossRef]
  64. Walters, T.; Esterly, S.; Cox, S.; Reber, T.; Rai, N. Policies to Spur Energy Access: Volume 1 Engaging the Private Sector in Expanding Access To Electricity, 1st ed.; National Renewable Energy Laboratory: Golden, CO, USA, 2015; pp. 1–83. [Google Scholar]
  65. Barbose, G.; Darghouth, N.; O’Shaughnessy, E.; Forrester, S. Tracking the Sun—Pricing and Design Trends for Distributed Photovoltaic Systems in the United States, 1st ed.; Lawrence Berkeley National Laboratory: Berkeley, CA, USA, 2023; pp. 1–45. [Google Scholar]
  66. IEA-PVPS. Trends in Photovoltaic Applications 2022, 1st ed.; International Energy Agency: Redfern, Australia, 2022; pp. 1–88. [Google Scholar]
  67. Zhang, L.; Qin, Q.; Wei, Y.M. China’s Distributed Energy Policies: Evolution, Instruments and Recommendation. Energy Policy 2019, 125, 55–64. [Google Scholar] [CrossRef]
  68. Peng, H.; Liu, Y. A Comprehensive Analysis of Cleaner Production Policies in China. J. Clean. Prod. 2016, 135, 1138–1149. [Google Scholar] [CrossRef]
  69. Zhao, X.; Zeng, Y.; Zhao, D. Distributed Solar Photovoltaics in China: Policies and Economic Performance. Energy 2015, 88, 572–583. [Google Scholar] [CrossRef]
  70. Yang, F.f.; Zhao, X.-g. Policies and Economic Efficiency of China’s Distributed Photovoltaic and Energy Storage Industry. Energy 2018, 154, 221–230. [Google Scholar] [CrossRef]
  71. Gosens, J.; Kåberger, T.; Wang, Y. China’s next Renewable Energy Revolution: Goals and Mechanisms in the 13th Five Year Plan for Energy. Energy Sci. Eng. 2017, 5, 141–155. [Google Scholar] [CrossRef]
  72. IEA. Renewables 2023, 1st ed.; International Energy Agency: Paris, France, 2023; pp. 1–96. [Google Scholar]
  73. Muhammad-Sukki, F.; Abu-Bakar, S.H.; Munir, A.B.; Yasin, S.H.; Ramirez-Iniguez, R.; McMeekin, S.G.; Stewart, B.G.; Sarmah, N.; Mallick, T.K.; Rahim, R.A.; et al. Feed-in Tariff for Solar Photovoltaic: The Rise of Japan. Renew. Energy 2014, 68, 636–643. [Google Scholar] [CrossRef]
  74. Myojo, S.; Ohashi, H. Effects of Consumer Subsidies for Renewable Energy on Industry Growth and Social Welfare: The Case of Solar Photovoltaic Systems in Japan. J. Jpn. Int. Econ. 2018, 48, 55–67. [Google Scholar] [CrossRef]
  75. Lauber, V.; Jacobsson, S. The Politics and Economics of Constructing, Contesting and Restricting Socio-Political Space for Renewables—The German Renewable Energy Act. Environ. Innov. Soc. Transit. 2016, 18, 147–163. [Google Scholar] [CrossRef]
  76. Ruf, H. Limitations for the Feed-in Power of Residential Photovoltaic Systems in Germany – An Overview of the Regulatory Framework. Sol. Energy 2018, 159, 588–600. [Google Scholar] [CrossRef]
  77. Proudlove, A.; Daniel, K.; Lips, B.; Sarkisian, D.; Shrestha, A. The 50 States of Solar (Q2 2016 Policy Review): A Quarterly Look at America’s Fast-Evolving Distributed Solar Policy and Regulatory Conversation, 1st ed.; NC Clean Energy Technology Center: Raleigh, NC, USA, 2016; pp. 1–9. [Google Scholar]
  78. DSIRE Programs. Available online: https://programs.dsireusa.org/system/program?state=US (accessed on 15 September 2023).
  79. IEA Policies Database Energy System of United States. Available online: https://www.iea.org/policies?technology=Solar PV&topic=Renewable Energy&year=desc&country=United States (accessed on 15 September 2023).
  80. Sarrica, M.; Biddau, F.; Brondi, S.; Cottone, P.; Mazzara, B.M. A Multi-Scale Examination of Public Discourse on Energy Sustainability in Italy: Empirical Evidence and Policy Implications. Energy Policy 2018, 114, 444–454. [Google Scholar] [CrossRef]
  81. Schwarz, J. Italy: Summary, Support Schemes. Available online: http://www.res-legal.eu/search-by-country/italy/summary/c/italy/s/res-e/sum/152/lpid/151/ (accessed on 2 February 2025).
  82. Antonelli, M.; Desideri, U. The Doping Effect of Italian Feed-in Tariffs on the PV Market. Energy Policy 2014, 67, 583–594. [Google Scholar] [CrossRef]
  83. Li, H.X.; Edwards, D.J.; Hosseini, M.R.; Costin, G.P. A Review on Renewable Energy Transition in Australia: An Updated Depiction. J. Clean. Prod. 2020, 242, 118475. [Google Scholar] [CrossRef]
  84. van Rooijen, S.N.M.; van Wees, M.T. Green Electricity Policies in the Netherlands: An Analysis of Policy Decisions. Energy Policy 2006, 34, 60–71. [Google Scholar] [CrossRef]
  85. Climate Policy Database. Available online: https://www.climatepolicydatabase.org/policies?country%5B%5D=434&decision_date=&high_impact=All&jurisdiction%5B%5D=893&policy_type%5B%5D=907&keywords= (accessed on 16 September 2023).
  86. Anciaux, S. Netherlands: Summary, Support Schemes. Available online: http://www.res-legal.eu/search-by-country/netherlands/summary/c/netherlands/s/res-e/sum/172/lpid/171/ (accessed on 2 February 2025).
  87. Srivastava, S. Policy Framework for Developing and Promoting Decentralised Renewable Energy Livelihood Applications, 1st ed.; F. No. 32/18/2020-SPV Division Government of India Ministry of New & Renewable Energy: New Delhi, India, 2021; pp. 1–19. [Google Scholar]
  88. Shidore, S.; Busby, J.W. What Explains India’s Embrace of Solar? State-Led Energy Transition in a Developmental Polity. Energy Policy 2019, 129, 1179–1189. [Google Scholar] [CrossRef]
  89. IEA Jawaharlal Nehru National Solar Mission (Phase I, II and III). Available online: https://www.iea.org/policies/4916-jawaharlal-nehru-national-solar-mission-phase-i-ii-and-iii?technology=DistributedPV (accessed on 16 September 2023).
  90. Kapoor, T. National Solar Mission Target of Grid Connected Solar Power Projects, 1st ed.; F. No. 30/80/2014-15/NSM Government of India Ministry of New & Renewable Energy: New Delhi, India, 2015; pp. 1–6. [Google Scholar]
  91. Vidalic, H. France: Summary, Support Schemes. Available online: http://www.res-legal.eu/search-by-country/france/summary/c/france/s/res-e/sum/132/lpid/131/ (accessed on 2 February 2025).
  92. Wilkin, B. National Survey Report of PV Power Applications in Belgium 2018, 1st ed.; International Energy Agency: Redfern, Australia, 2018; pp. 1–20. [Google Scholar]
  93. Mihaylov, M.; Rădulescu, R.; Razo-Zapata, I.; Jurado, S.; Arco, L.; Avellana, N.; Nowé, A. Comparing Stakeholder Incentives across State-of-the-Art Renewable Support Mechanisms. Renew. Energy 2019, 131, 689–699. [Google Scholar] [CrossRef]
  94. Huijben, J.C.C.M.; Podoynitsyna, K.S.; Van Rijn, M.L.B.; Verbong, G.P.J. A Review of Governmental Support Instruments Channeling PV Market Growth in the Flanders Region of Belgium (2006–2013). Renew. Sustain. Energy Rev. 2016, 62, 1282–1290. [Google Scholar] [CrossRef]
  95. Yang, Q. Do Vertical Ecological Compensation Policies Promote Green Economic Development: A Case Study of the Transfer Payments Policy for China’s National Key Ecological Function Zones. Econ. Syst. 2023, 47, 101125. [Google Scholar] [CrossRef]
  96. Andresen, S.; Agrawala, S. Leaders, Pushers and Laggards in the Making of the Climate Regime. Glob. Environ. Change 2002, 12, 41–51. [Google Scholar] [CrossRef]
  97. Inderberg, T.H.J.; Tews, K.; Turner, B. Is There a Prosumer Pathway? Exploring Household Solar Energy Development in Germany, Norway, and the United Kingdom. Energy Res. Soc. Sci. 2018, 42, 258–269. [Google Scholar] [CrossRef]
  98. De Boeck, L.; Van Asch, S.; De Bruecker, P.; Audenaert, A. Comparison of Support Policies for Resi-dential Photovoltaic Systems in the Major EU Markets through Investment Profitability. Renew. Energy 2016, 87, 42–53. [Google Scholar] [CrossRef]
  99. Parag, Y.; Sovacool, B.K. Electricity Market Design for the Prosumer Era. Nat. Energy 2016, 1, 1–6. [Google Scholar] [CrossRef]
  100. Yu, J.J.; Tang, C.S.; Shenc, Z.J.M. Improving Consumer Welfare and Manufacturer Profit via Government Subsidy Programs: Subsidizing Consumers or Manufacturers? Manuf. Serv. Oper. Manag. 2018, 20, 752–766. [Google Scholar] [CrossRef]
  101. Jansson, P.M. Net Metering PV Distributed Resources Benefits All Stakeholders on PJM. In Proceedings of the SOLAR 2016-American Solar Energy Society National Solar Conference 2016 Proceedings, San Francisco, CA, USA, 10–13 July 2016; pp. 194–200. [Google Scholar]
  102. Chen, J.; Wang, X. Climate Policy Uncertainty and the Chinese Sectoral Stock Market: A Multilayer Network Analysis. Econ. Syst. 2024; in press. [Google Scholar] [CrossRef]
  103. MIT. Utility of the Future, 1st ed.; Massachusetts Institute of Technology: Cambridge, MA, USA, 2016; pp. 1–382. ISBN 9780692808245. [Google Scholar]
  104. Shum, K.L.; Watanabe, C. An Innovation Management Approach for Renewable Energy Deployment–the Case of Solar Photovoltaic (PV) Technology. Energy Policy 2009, 37, 3535–3544. [Google Scholar] [CrossRef]
  105. Hassan, M.; Oueslati, W.; Rousselière, D. Environmental Taxes, Reforms and Economic Growth: An Empirical Analysis of Panel Data. Econ. Syst. 2020, 44, 100806. [Google Scholar] [CrossRef]
  106. Ma, H.; Oxley, L.; Gibson, J. China’s Energy Economy: A Survey of the Literature. Econ. Syst. 2010, 34, 105–132. [Google Scholar] [CrossRef]
Figure 1. Schematic diagram illustrating the components typically utilized in a solar photovoltaic system. Source: created by the authors.
Resources 14 00028 g001
Figure 2. The most commonly utilized photovoltaic cell technologies. Source: created by the authors.
Resources 14 00028 g002
Figure 3. Total investment in solar PV manufacturing capacity by country and region, 2016–2027. Source: created by the authors based on data from [20].
Resources 14 00028 g003
Figure 4. Global distributed generation photovoltaic installed capacity in 2024. Source: created by the authors based on data from [21].
Resources 14 00028 g004
Figure 5. Global evolution of distributed generation photovoltaic installed capacity from 2018 to 2024. Source: created by the authors based on data from [21].
Resources 14 00028 g005
Figure 6. Methodology stage 1 summary. Source: author.
Resources 14 00028 g006
Figure 7. Cumulative installed grid-connected distributed PV capacity versus installed price trends in China. Source: created by the authors based on data from [9,72].
Resources 14 00028 g007
Figure 8. Cumulative installed grid-connected distributed PV capacity versus installed price trends in Japan. Source: created by the authors based on data from [9,72].
Resources 14 00028 g008
Figure 9. Cumulative installed grid-connected distributed PV capacity versus installed price trends in Germany. Source: created by the authors based on data from [9,72].
Resources 14 00028 g009
Figure 10. Cumulative installed grid-connected distributed PV Capacity versus installed price trends in USA. Source: created by the authors based on data from [9,65,72].
Resources 14 00028 g010
Figure 11. Cumulative installed grid-connected distributed PV Capacity versus installed price trends in Italy. Source: created by the authors based on data from [9,72].
Resources 14 00028 g011
Figure 12. Cumulative installed grid-connected distributed PV capacity versus installed price trends in Australia. Source: created by the authors based on data from [9,72].
Resources 14 00028 g012
Figure 13. Cumulative installed grid-connected distributed PV capacity versus installed price trends in Netherlands. Source: created by the authors based on data from [9,72].
Resources 14 00028 g013
Figure 14. Cumulative installed grid-connected distributed PV capacity versus installed price trends in India. Source: created by the authors based on data from [9,72].
Resources 14 00028 g014
Figure 15. Cumulative installed grid-connected distributed PV capacity versus installed price trends in France. Source: created by the authors based on data from [9,72].
Resources 14 00028 g015
Figure 16. Cumulative installed grid-connected distributed PV capacity versus installed price trends in Belgium. Source: created by the authors based on data from [9,72].
Resources 14 00028 g016
Table 1. Correlation between external factors and motivating research questions in policy analysis.
Related External FactorMotivating Question
  • Installed price trends
Which policy demonstrates the most significant impact on the trends in installation costs?
2.
Installed capacity
Which policy exerts the greatest influence on the expansion of installed capacity?
3.
Stakeholders
Among sector agents, which entity possesses the greatest capacity to drive the growth of DGPV, and which policy is best suited to enhance their capabilities?
4.
Technological maturity
What policies are most conducive to each stage of technology maturity?
5.
Socioeconomic factors
What political strategies are optimal for aligning with the various phases of the nation’s development trajectory?
6.
Characteristics of the electricity sector
Based on the characteristics of the electricity sector, which policies are most suitable for promoting the penetration of DGPV?
Table 2. Policies that encourage or impose the adoption of renewable energy from photovoltaic solar sources connected to the local distribution network located near the load.
Incentive
Category
Types of Policies
Considered in Each
Category
DescriptionReferences
Direct
Financial
Incentives
Payments, finance, and taxation
Loans/debt finance
Payments and transfers
Taxes, fees, and charges
Tax credits and exemptions
Grants
Direct financial incentives are monetary benefits provided by governments or utility companies to encourage the adoption and implementation of photovoltaic solar energy systems. These incentives can take the form of tax credits, rebates, subsidies, or grants and aim to lower the cost of installing and operating DGPV systems and make them more accessible and affordable for individuals and businesses.[30,31,32,33,34]
Energy
Market
Regulation
Regulation
Energy market regulation
Net energy metering
Time-of-use tariffs
Energy market regulation refers to the policies and rules established by governments or utility companies to govern the integration and participation of DGPV systems in the energy market. These regulations aim to promote the growth of renewable energy sources, encourage fair competition, and ensure the stability and reliability of the energy grid. Energy market regulation manages the buying and selling of energy, access to the grid priority, incentive for self-consumption, and demand control.[35,36,37,38]
Government ManagementTargets
Plans and framework legislation
Strategic plans/climate change strategies
Information and education
Awards/Education and training
Equity
Government-provided advice
Technology roadmaps
Public information
Codes and standards
Prescriptive requirements and standards
Government management is responsible for outlining the guidelines to be followed, setting GHG emission reduction and RE adoption goals, developing strategic plans for mitigating the effects of climate change, technological roadmaps, creating codes and reference standards, prescribing norms and qualitative requirements, as well as directly acting in the dissemination of knowledge to the public through public information, education and training projects, awarding of innovative projects, and democratization of energy seeking equity.[39,40,41,42,43]
Production IncentivesProduction motivation
Minimum energy performance Standards (MEPS)
Product-based MEPS
Production incentives refer to policies and mechanisms that aim to motivate and increase production. This can be achieved through various methods such as production motivation, Minimum Energy Performance Standards (MEPS), and product-based MEPS. Production motivation provides financial benefits to producers of DGPV systems. MEPS set a minimum energy efficiency level for DGPV systems, ensuring that the systems being used are of good quality. Product-based MEPS require that only DGPV systems that meet specific energy efficiency standards are sold and used.[44,45]
Performance-Based Feed RatesPerformance-based payments
Performance-based policies
Feed-in tariffs/premiums
Performance-based feed-in tariffs (PBFITs) are a type of financial incentive in the energy market that reward power producers for the amount of electricity they generate and feed into the grid. Unlike traditional feed-in tariffs, which offer a fixed rate per kilowatt-hour produced, PBFITs vary based on the performance of the energy system, usually based on factors such as capacity factor, availability, or efficiency.[46,47,48,49,50]
Renewable
Energy
Obligations
Renewable/non-fossil energy obligations
Obligations on average types of sales/output
Energy efficiency/fuel economy obligations
Green certificates
Renewable Portfolio Standard (RPS)/Renewable Purchase Obligation (RPO)
Renewable Energy Obligations (REOs) refer to the requirement for electricity suppliers to source a minimum proportion of their energy from renewable sources, as set by government mandates. This can be achieved through various schemes such as purchasing renewable energy directly, acquiring green certificates that represent renewable energy generation, or fulfilling obligations set by government agencies. The goal of REOs is to increase the adoption of renewable energy, promote investment in renewable energy production, and drive down the cost of renewable energy through economies of scale.[51,52,53,54,55,56]
Research and DevelopmentR&D
Operational funding for institutions
Research and Development (R&D) involves the allocation of funds and resources for the improvement and advancement of photovoltaic technologies. This includes providing operational funding for institutions such as universities and research centers to carry out research and develop new solutions, increase the efficiency, reliability and scalability of photovoltaic systems, as well as reduce costs and increase their competitiveness in the energy market.[57,58,59]
Agreements and
Commitments
Negotiated agreements
(public–private sector)
PPA/Unilateral commitments
(private sector)
Agreements and commitments encompass formal agreements and promises made by governments, organizations, or corporations. Such agreements and commitments can range from negotiated public–private partnerships to unilateral commitments to the private sector, providing a stable and predictable financial framework for the entities involved. This, in turn, enables them to secure funding and plan for future investments with greater confidence.[60,61,62,63,64]
Table 3. Number of policies adopted.
ChinaJapanGermanyUSAItalyAustraliaNetherlandsIndiaFranceBelgiumTotal
Direct Financial Incentives207123113281620253175
Energy Market Regulation19366134101511794
Government Management3731241182313322211212
Production Incentives7001003051026
Performance-Based Feed Rates1027087477153
Renewable Energy Obligations212136392130
Research and Development30116511368255
Agreements and Commitments010713414021
Total52112061323829404114338
Table 4. Number of policies applied during peak installed capacity growth period.
ChinaJapanGermanyUSAItalyAustraliaNetherlandsIndiaFranceBelgiumTotal
Direct Financial Incentives812136147815175
Energy Market Regulation2222846116649
Government Management6111510113187577
Production Incentives50020000108
Performance-Based Feed Rates402057262129
Renewable Energy Obligations101124162119
Research and Development200922235025
Agreements and Commitments000612012012
Table 5. Number of policies applied during peak installation price reduction periods.
ChinaJapanGermanyUSAItalyAustraliaNetherlandsIndiaFranceBelgiumTotal
Direct Financial Incentives7142223789164
Energy Market Regulation2204206112635
Government Management61522233182567
Production
Incentives
500601001013
Performance-Based Feed Rates302000261115
Renewable
Energy
Obligations
100103161114
Research and Development2011101231021
Agreements and Commitments00050201109
Table 6. Summary of policies directly targeting stakeholders in DGPV development.
Key StakeholderProsumersIntegratorsEquipment and Component ManufacturesUtilitiesResearch Institutions
Direct Financial Incentives175175175--
Energy Market Regulation94--94-
Government Management212-212212-
Production Incentives-2626--
Performance-Based Feed Rates53----
Renewable Energy Obligations30--30-
Research and Development----55
Agreements and Commitments21--21-
Table 7. The correlation between policy types and mechanisms, and their influence on the stages of technological development.
Development PhasesInitial Implementation Phase (TRL 1–3)Initial
Growth Phase
(TRL 4–5)
First Major Growth Phase (TRL 6–7)Mature Implementation Phase (TRL 8–9)
Direct Financial Incentives567281123
Energy Market Regulation38485584
Government Management637185160
Production Incentives831321
Performance-Based Feed Rates21262439
Renewable Energy Obligations16181627
Research and Development22242842
Agreements and Commitments9141619
Total233276318515
Table 8. The association between policy types and mechanisms and Gross Domestic Product per capita (in million units).
Gross Domestic Product per Capita (mi)0
to
499
500 to 9991000 to 14991500 to 19992000 to 39994000 to 999910,000 to 19,99920,000 to 29,99930,000 to 39,99940,000 to 49,99950,000 to 59,99960,000 to 69,99970,000 to 79,999Over 80,000
Direct Financial Incentives015101412114711112115-
Energy Market Regulation036891611355652-
Government Management0310151726203711132211-
Production Incentives0123575001152-
Performance-Based Feed Rates0134555123245-
Renewable Energy Obligations0135522112235-
Research and Development0123432134496-
Agreements and Commitments0011100112232-
Table 9. The association between policy types and mechanisms and Human Development Index.
Human Development Index0.400 to 0.4990.500 to 0.5990.600 to 0.6990.700 to 0.7990.800 to 0.8990.900 to 1.000
Direct Financial Incentives031412511
Energy Market Regulation0591646
Government Management071726513
Production Incentives015701
Performance-Based Feed Rates035623
Renewable Energy Obligations025212
Research and Development024324
Agreements and Commitments011012
Table 10. The correlation between policy types and mechanisms and the percentage of renewables in power generation.
Share of Renewables in Power Generation (%)Under 00 to 9.9910 to 19.9920 to 29.9930 to 39.9940 to 49.9950 to 59.9960 to 69.9970 to 79.9980 to 89.99Over 90
Direct Financial Incentives-91198------
Energy Market Regulation-4788------
Government Management-7141411------
Production Incentives-1210------
Performance-Based Feed Rates-2443------
Renewable Energy Obligations-2222------
Research and Development-3432------
Agreements and Commitments-2212------
Table 11. The relationship between policy types and mechanisms and net electricity imports (in GWh).
Net Electricity imports (GWh)Under 00 to 9.9910 to 19.9920 to 29.9930 to 39.9940 to 49.9950 to 59.9960 to 69.9970 to 79.9980 to 89.99Over 90
Direct Financial Incentives11972-------
Energy Market Regulation10696-------
Government Management1713119-------
Production Incentives2200-------
Performance-Based Feed Rates4231-------
Renewable Energy Obligations3221-------
Research and Development3321-------
Agreements and Commitments2220-------
Table 12. Summary of study conclusions: policy directions for DGPV development.
Direct Financial IncentivesEnergy Market RegulationGovernment ManagementProduction IncentivesPerformance-Based Feed RatesRenewable Energy ObligationsResearch and DevelopmentAgreements and Commitments
Reduction in installation costs XXX
Growth in installed capacityXXX
The most influential stakeholder for sectoral growth: ProsumersX X
Technological maturity—Different stages of technologyXXX
Socioeconomic factors—various phases of the nation’s development trajectoryX X
Lowest shares of renewable energyX
Highest shares of renewable energy X
Various net imports ranging X
Disclaimer/Publisher’s Note: The statements, opinions and data contained in all publications are solely those of the individual author(s) and contributor(s) and not of MDPI and/or the editor(s). MDPI and/or the editor(s) disclaim responsibility for any injury to people or property resulting from any ideas, methods, instructions or products referred to in the content.