Article

Energy, Exergy, and Exergo-Sustainability Analysis of a Brayton S-CO2/Kalina Operating in Araçuaí, Brazil, Using Solar Energy as a Thermal Source

1
Faculty of Engineering, Department of Mechanical Engineering, Universidad del Atlántico, Barranquilla 080001, Colombia
2
Faculty of Economic Sciences, Universidad del Atlántico, Barranquilla 080001, Colombia
*
Author to whom correspondence should be addressed.
Resources 2025, 14(2), 31; https://doi.org/10.3390/resources14020031
Submission received: 20 November 2024 / Revised: 26 January 2025 / Accepted: 6 February 2025 / Published: 14 February 2025

Abstract

:
Climate change and increasing energy demand drive the search for sustainable alternatives for power generation. In this study, an energy, exergy, and exergy-sustainability analysis was performed on a supercritical CO2 Brayton cycle with intercooling and reheating, coupled to a Kalina cycle for waste heat recovery, using solar energy as a thermal source in Araçuaí, Minas Gerais, Brazil, a city that holds the historical record for the highest temperature recorded in Brazilian territory. The results show that at 900 °C the maximum values of thermal efficiency (56.67%), net power (186.55 kW), and destroyed exergy (621.62 kW) were reached, while the maximum exergy efficiency, 24.92%, was achieved at 700 °C. At a turbine inlet pressure of 18 MPa, the maximum thermal (54.48%) and exergy (24.50%) efficiencies were obtained. Likewise, working with a compressor efficiency of 95%, a thermal efficiency of 54.98%, a net power of 165.84 kW, and an exergy efficiency of 24.62% was achieved, reducing the exergy destroyed to 504.95 kW. The solar field presented the highest rate of irreversibilities (~62.2%). Finally, the exergy-sustainability analysis identified 700 °C as the outstanding operating temperature. This research highlights the technical feasibility of operating Brayton S-CO2 combined cycles with concentrated solar power (CSP) systems in regions of high solar irradiation, evidencing the potential of CSP systems to generate renewable energy efficiently and sustainably under extreme solar conditions.

1. Introduction

Climate change is a global threat, a priority issue on the international agenda, and every year we witness global temperatures reaching new records [1,2]. This major problem is mainly caused by the increase in greenhouse gas (GHG) emissions from human activities [3]. Likewise, the generation of electrical energy using fossil fuels is one of the main sources of these emissions [4]. This scenario has catalyzed the urgent search for cleaner and more sustainable energy alternatives, where renewable energies emerge as a fundamental solution for the decarbonization of the energy sector [5].
In this line of thinking, Brazil faces the dual challenge of meeting a constantly growing energy demand while seeking to reduce its carbon footprint, aligning itself with international climate change mitigation commitments [6,7]. Although the country has a relatively clean energy matrix thanks to its considerable hydroelectric capacity [8], the effects of climate variability and prolonged drought cycles have highlighted the imperative need to diversify renewable generation sources [9,10]. Thus, solar energy emerges as a promising alternative for electricity generation in Brazil [11]. Brazil has a high solar irradiation index, which promotes the integration of solar energy into its energy matrix [12,13]. This renewable source represents an excellent option to move towards a more sustainable society, contributing to reducing the environmental impacts generated by conventional energy sources [14]. The solar potential of the country has become even more evident with the recent extreme weather events, such as the one recorded in Araçuaí, Minas Gerais, where on 19 November 2023, the highest temperature in the history of measurements in Brazil was reached with 44.8 °C [15]. This historical record is not only evidence of climate change in the region but also reflects the extreme weather conditions that occur in this area of the Brazilian territory.
This unconventional energy source can be used in advanced power generation technologies, such as Brayton cycles under supercritical conditions [16,17]. In these cycles, carbon dioxide has positioned itself as one of the most promising working fluids because its implementation allows a significant reduction in both equipment size and investment costs [18]. The relevance of supercritical carbon dioxide (S-CO2) Brayton cycles extends beyond the economic aspect, presenting itself as an environmentally responsible alternative in the use of unconventional resources [19]. From the thermodynamic perspective, these cycles have demonstrated high efficiency, operating in temperature ranges between 550 °C and 850 °C, with theoretical efficiencies reaching 50% [20]. Herrera et al. [20] developed a comparative analysis between four possible arrangements of the S-CO2 Brayton cycle, where the configuration with intercooling and reheating stood out for its ability to reduce the compression work by cooling in the flow stream, proving to be the most efficient by reaching a thermal efficiency of up to 56%.
On the other hand, the increase of the overall conversion efficiency has been studied by incorporating waste heat recovery technologies such as the Kalina cycle [21]. This cycle emerged as an alternative to the Rankine cycle to take advantage of low-temperature heat from industrial exhaust gases, cogeneration plants, and supercritical Brayton cycles, using, unlike the ORC, a binary mixture of ammonia and water as a working fluid, whose variable temperature system reduces entropy generation and irreversibilities in the evaporator, improving the exergy efficiency and making it a viable alternative to the ORC [22,23].
In this sense, Mahmoudi et al. [24] compared the performance of a combined Brayton S-CO2/Kalina recompression cycle (SCRB/KC) with a Brayton S-CO2 recompression cycle (SCRB), evaluating the exergy efficiency and the total unit product cost. The authors concluded that the combined SCRB/KC cycle offers up to 10% higher exergy efficiency and a reduction of up to 4.9% in total unit product costs compared to the SCRB cycle. On the other hand, Yousef and Santana [25] developed a combined cycle system that integrates a Brayton S-CO2 cycle with a modified Kalina cycle. Through an exergy-economic analysis, they compared the performance of the combined cycle against that of the Brayton cycle alone; their results showed that the Brayton/Kalina cycle offers an exergy efficiency up to 12.8% higher than that of the single Brayton cycle. Likewise, Zhang et al. [26] compared the thermal efficiency of a Brayton S-CO2 cycle with recompression combined with an ORC cycle and a Kalina cycle; the results showed that the efficiency of the Brayton/Kalina cycle is 8.508% higher with respect to the Brayton/ORC cycle.
In the scientific literature on Brayton cycles for power production, the evaluation of the environmental impact remains a little explored field. Although there is researche that evaluates this impact by means of life cycle analysis based on powers and heats, such as the one carried out by Tovar et al. [27], it is less frequent to find evaluations that employ exergo-sustainability indicators, despite their importance to quantify the degree of sustainability of the proposed configurations [28].
Under this context, this research proposes an energetic, exergy, and exergo-sustainability analysis of a Brayton S-CO2 cycle with intercooling and reheating, coupled to a Kalina cycle as a waste heat recovery system. The system operates with solar energy, an abundant resource in the municipality of Araçuaí, Minas Gerais, Brazil. The study evaluates the strengths and weaknesses of the proposed system through a sensitivity analysis that considers various parameters such as hourly irradiation, turbine inlet temperature and pressure, and compressor efficiencies. Additionally, its degree of sustainability is determined through indicators such as the process exergy waste rate (EWR), the environmental effect factor (EEF) and the exergy sustainability index (ESI). This research seeks to contribute to the development of more efficient and sustainable energy generation technologies, promoting the use of renewable sources and the reduction of adverse environmental impacts.

2. Methodology

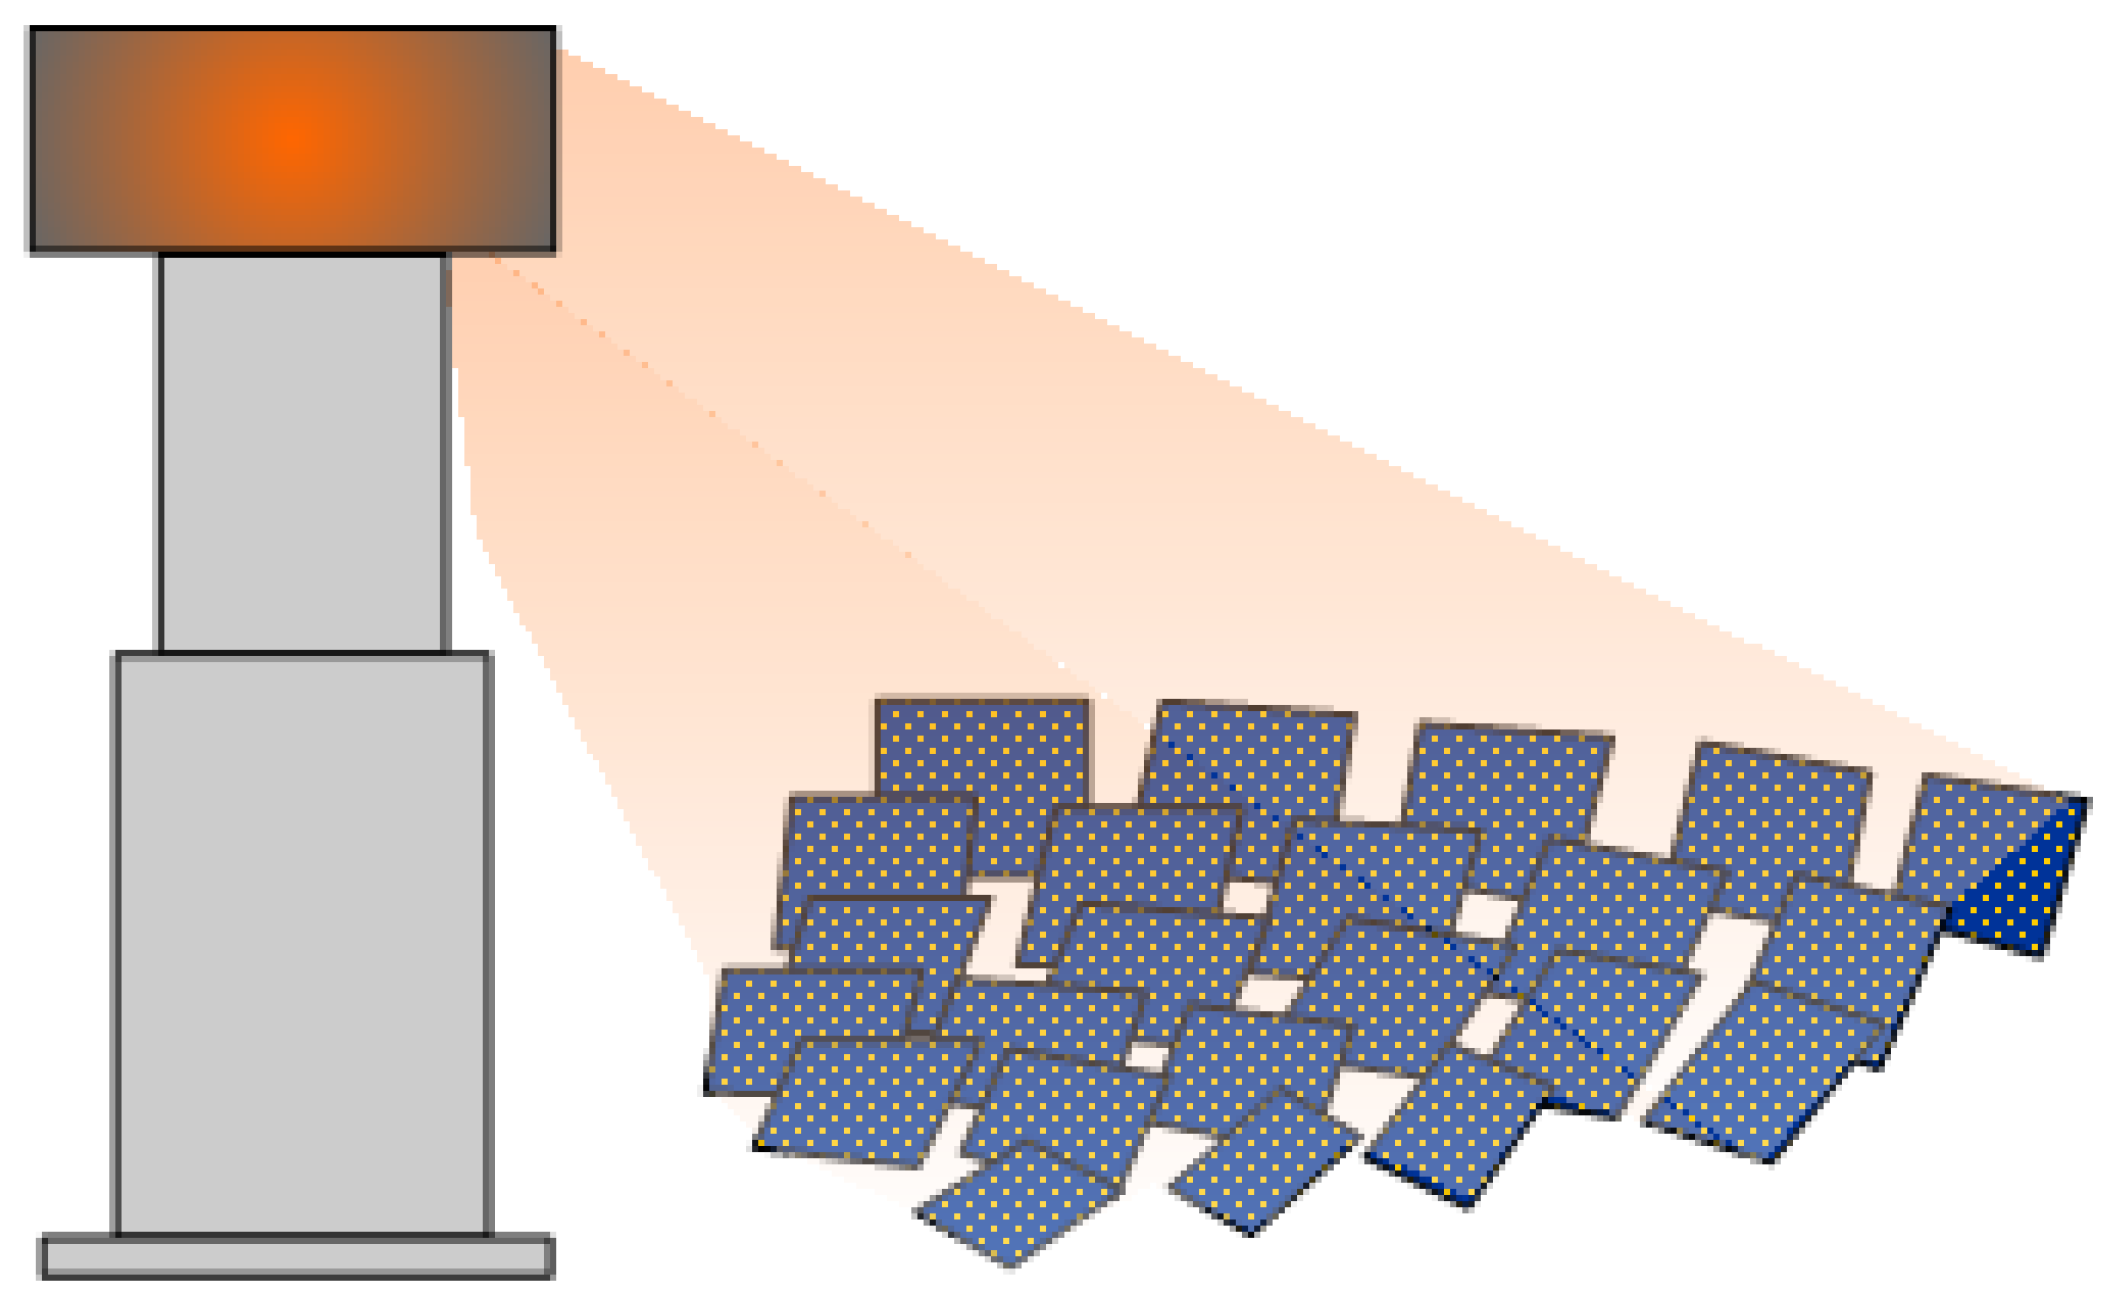
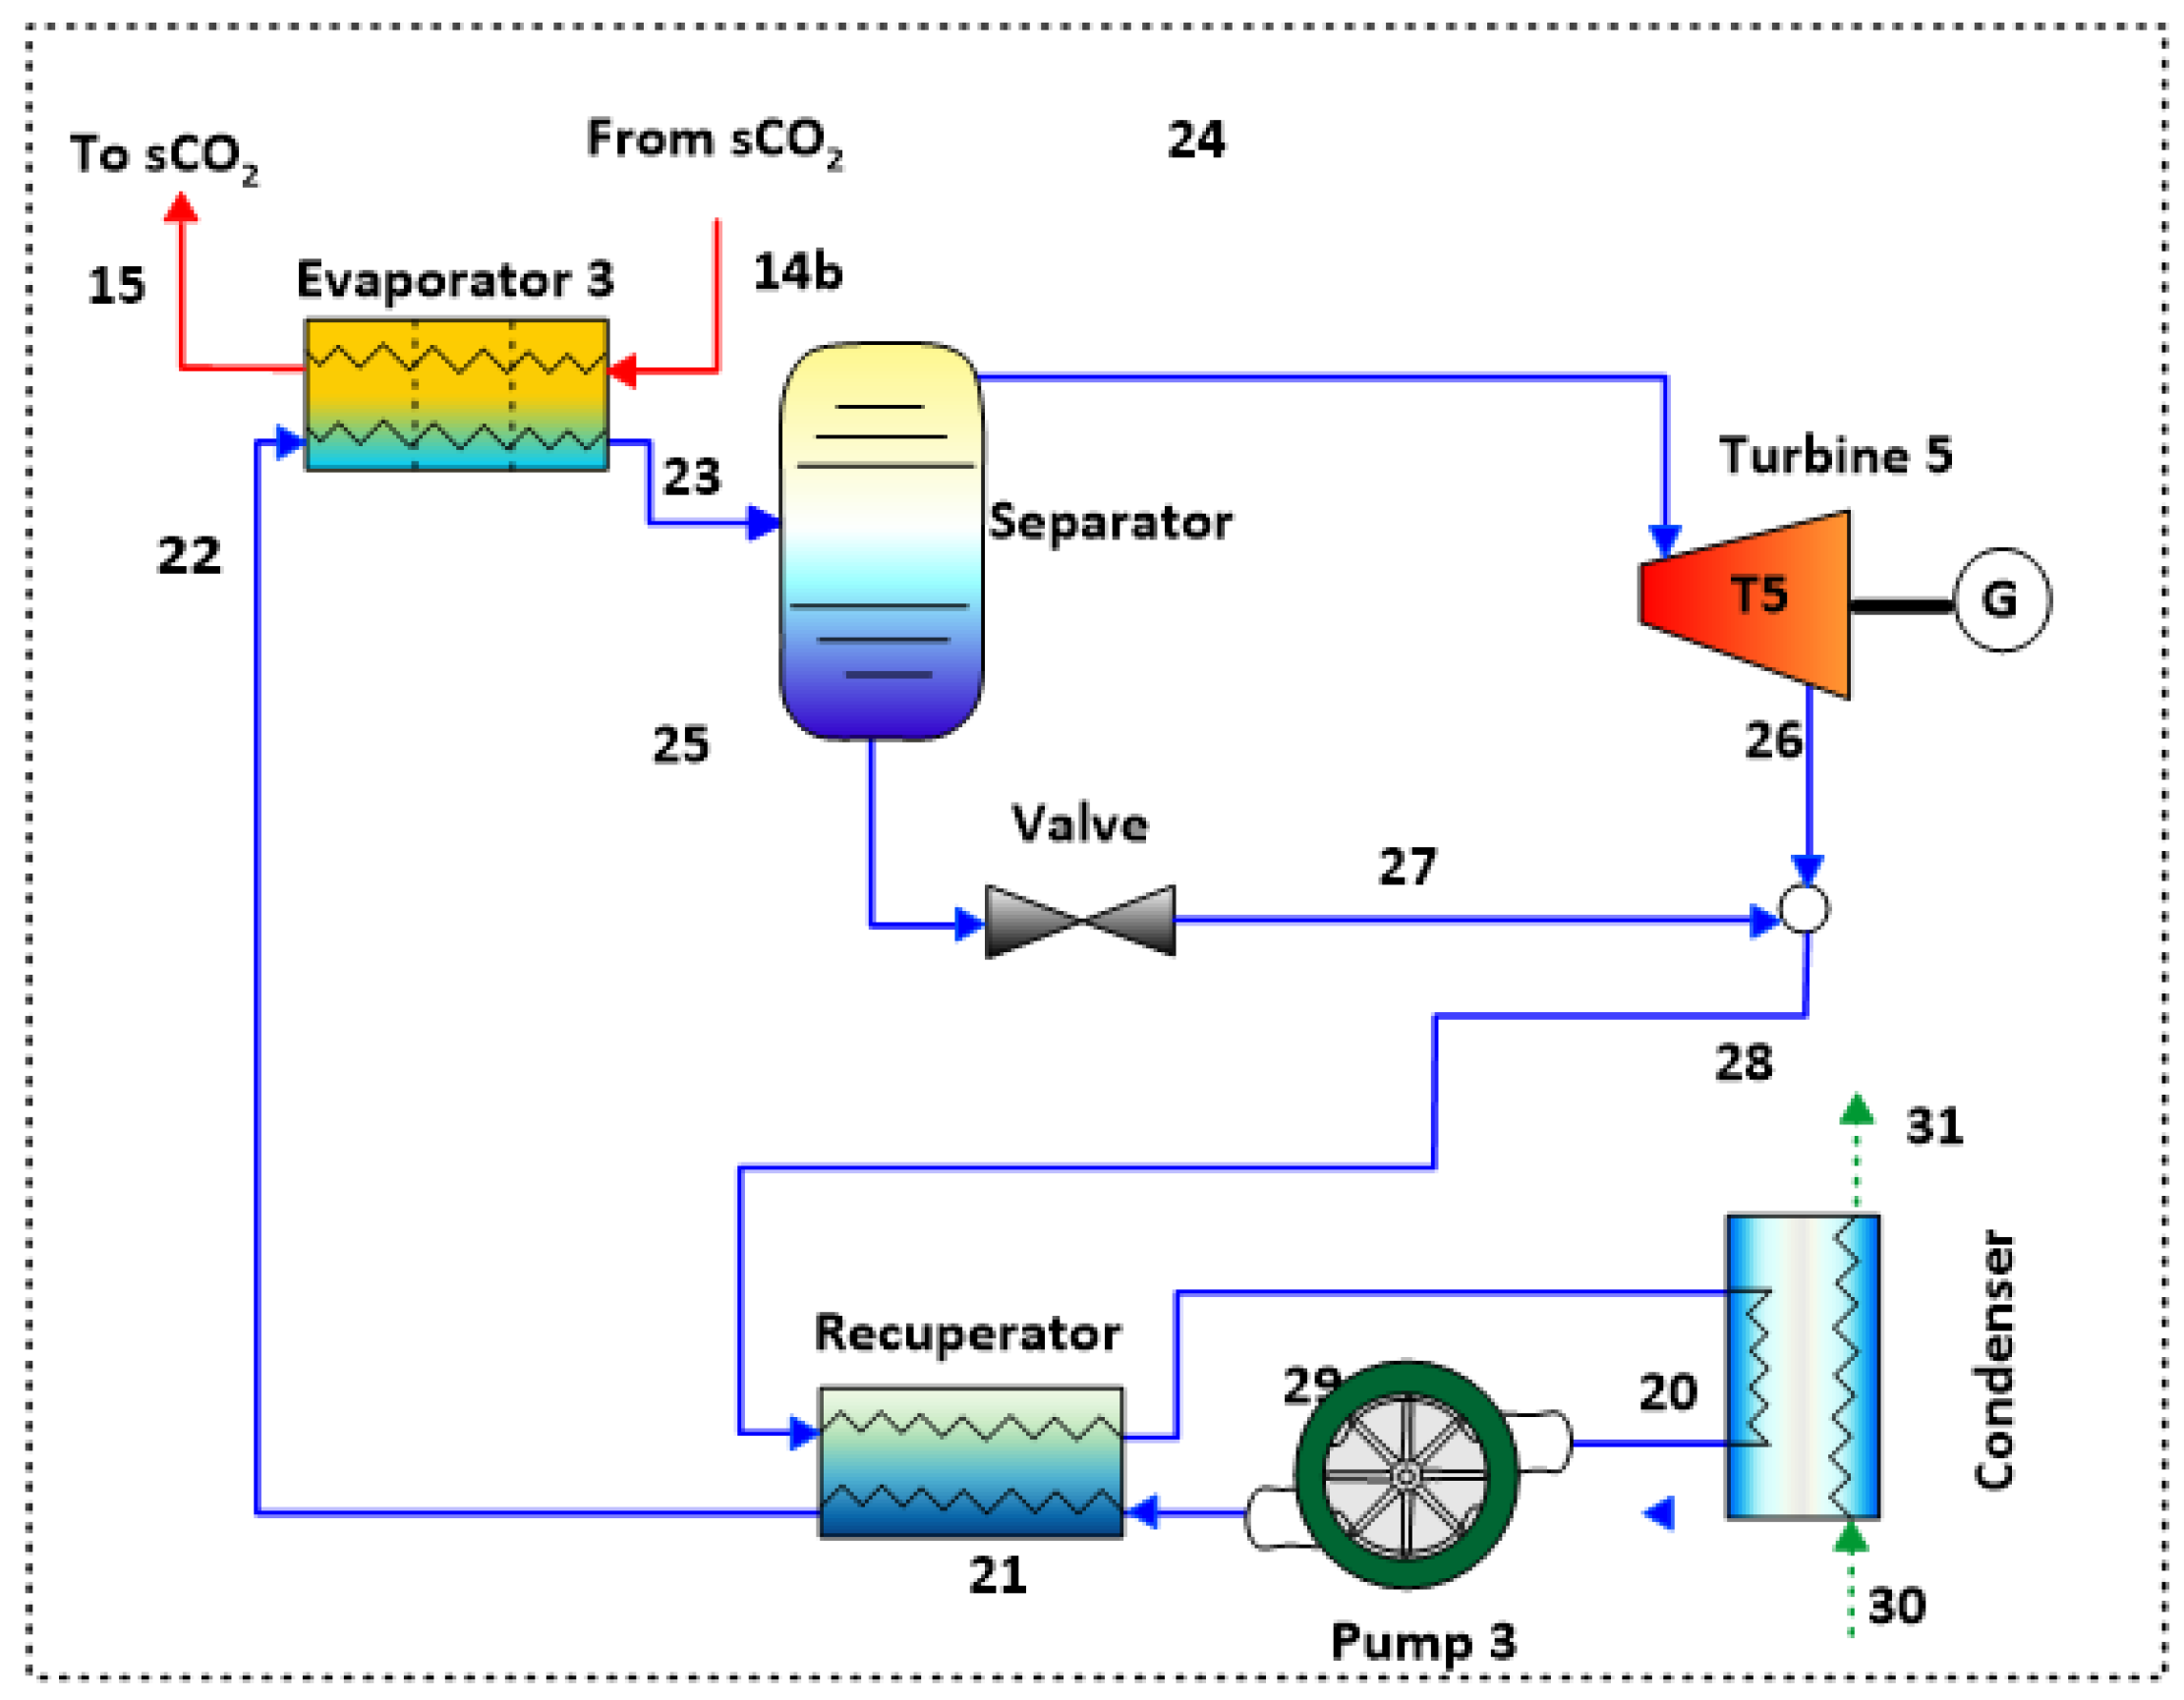
2.1. System Description

The system under study integrates a Brayton S-CO2 cycle with intercooling and reheating (Figure 1), driven by a concentrating solar power (CSP) tower as illustrated in Figure 2, and coupled to a Kalina cycle as a waste heat recovery system (Figure 3).
The process starts when the carbon dioxide is cooled to state 1 conditions, followed by compression in Compressor 1 to an intermediate pressure (states 1–2). Due to the increase of the specific gas volume with temperature, a cooling is implemented in cooler 2 (states 2–3) to reduce the required compression energy before compressing again to the maximum system pressure in Compressor 2 (states 3–4). The resulting stream is preheated in the low-temperature recuperator (LTR) by absorbing heat from a high-pressure stream (state 13). The resulting LTR stream (state 14) is split into two streams (14a and 14b), where stream 14a enters Compressor 3 to reach the maximum system pressure (states 14a-6). This strategic flow division increases the thermal capacity on the cold fluid side, avoiding pinch point problems. The streams coming from Compressor 3 (state 6) and LTR (state 5) are equalized in pressure and mixed (state 7). This mixture is heated in the high-temperature recuperator (HTR) by absorbing heat from the output stream of Turbine 2 and subsequently heated to the maximum system temperature (states 8–9) before expanding in Turbine 1 to generate power. The output stream (state 10) undergoes reheating to the maximum temperature (states 10–11) and expands in Turbine 2 to generate additional power. Meanwhile, stream 14b is directed to the Kalina cycle evaporator to transfer some of its heat. The cycle is completed when the waste heat from the gas is dissipated by cooling air in Condenser 1 (states 16-1).
The Kalina cycle uses an ammonia-water mixture as the working fluid, taking advantage of its distinctive characteristic of variable temperature during evaporation and condensation, unlike pure fluids. This property allows achieving better thermodynamic performance due to the thermal coupling in the two-phase region of the evaporator and condenser [29]. The cycle starts when the ammonia-water mixture leaves the condenser in a saturated liquid state (state 20) and enters the pump, where it is pressurized up to the evaporating pressure of the system. The pressurized stream undergoes a preheating process in the heat recovery unit, followed by heating in evaporator 3, where it absorbs heat from the S-CO2. Subsequently, the resulting two-phase mixture enters the separator (Figure 3), where it splits into two streams: saturated vapor (state 24) and saturated liquid (state 25). The saturated liquid expands through a valve to the low system pressure, while the saturated vapor is directed to the turbine, where it expands to generate work.
Figure 4 depicts the Temperature-Entropy (T-S) diagrams of the S-CO2 Brayton cycle and the DORC cycle.

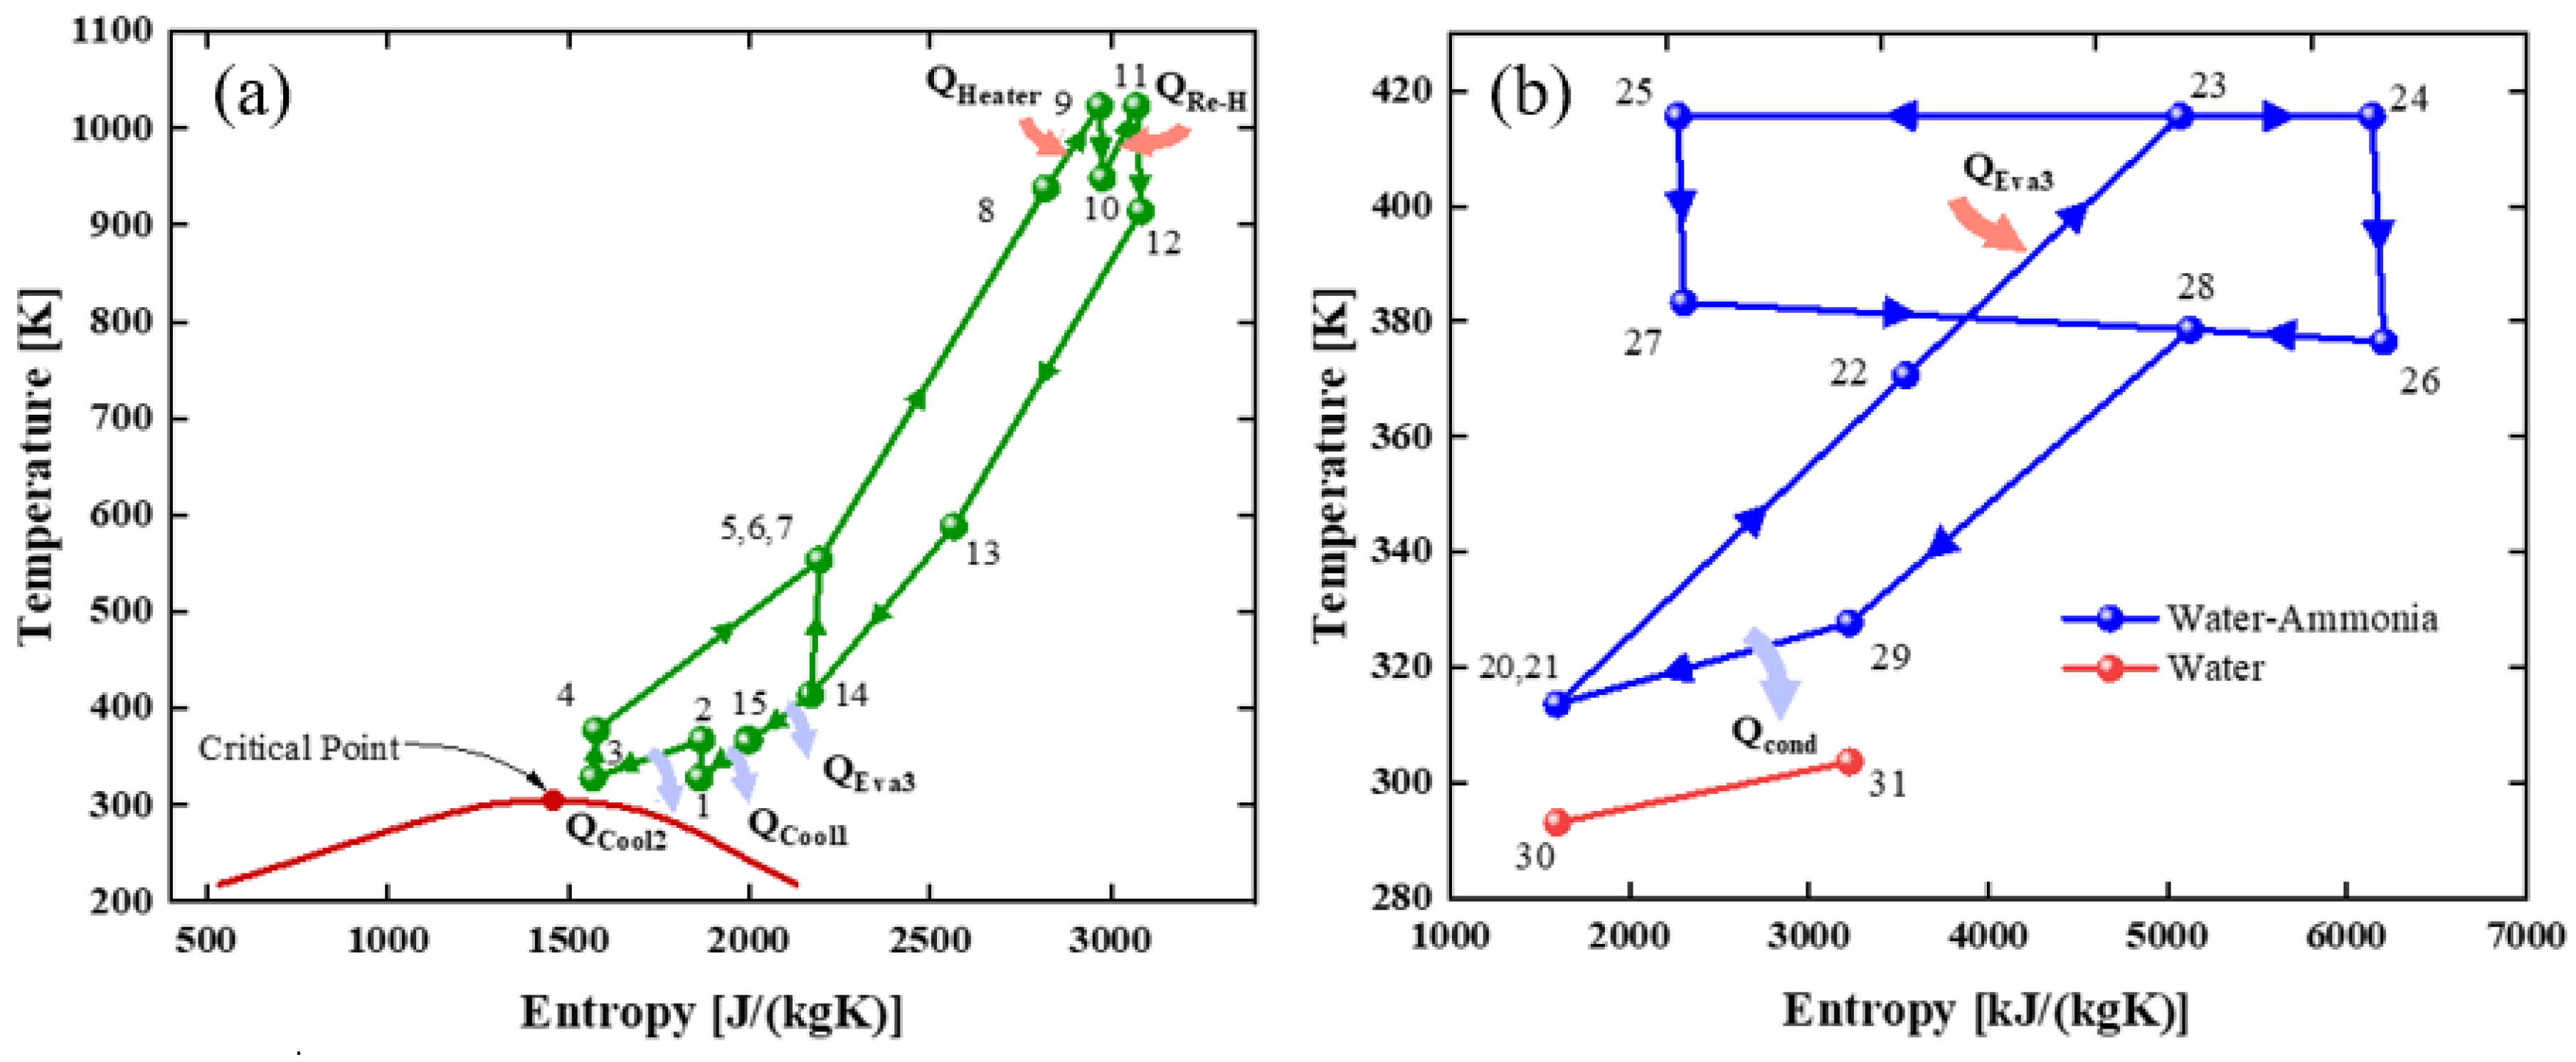
2.2. Thermodynamic Modeling

Thermodynamic models were developed for the proposed system (Brayton/Kalina) in order to quantify the energetic and exergetic performance of each of its components. Matlab ®2015a software was used to build the model, while thermodynamic and transport properties were obtained from Refprop 9.0.

Energy and Exergy Balance

The system components were analyzed independently, with separate control volumes, for which mass, energy, and exergy balances were applied to each control volume. The following considerations were applied:
  • Pressure drops in piping and heat exchangers were considered negligible.
  • Changes in potential and kinetic energy were considered negligible, as were losses due to friction.
  • Each component was worked as an open system operating at steady-state conditions.
  • There are no fluid losses in the cycle.
  • Heat losses in the solar field and receiver were included.
  • The valves are isentropic.
  • According to Equations (1) and (2), mass and energy balances were performed for each component.
Σṁin − Σṁout = 0,
ΣQ + Σṁinhin = ΣẆ + Σṁouthout,
where ṁ is the mass flow in kg/s, Q is the heat transferred in kW, h is the specific enthalpy (kJ/kg), and Ẇ is the power in kW.
The exergy analysis was developed to determine the amount of useful work in each process state and the exergy efficiencies of the components. When working with a Kalina cycle, it was necessary to calculate, in addition to the physical exergy, the chemical exergy, so the exergy in each state is given by Equation (3).
x = Ḝxph + Ḝxch,
where Ḝxph is the physical exergy and Ḝxch the chemical exergy (both in kW) quantified by Equations (4) and (5).
xph = ṁ · [(h − h0) − T0 · (s − s0)].
T0 represents the reference temperature, s denotes the entropy in kJ/(kg·K), and h corresponds to the enthalpy of the working fluid in kg/s. On the other hand, s0 and h0 indicate the entropy and enthalpy values evaluated under the reference conditions (T0 = 298.15 K and P0 = 101 kPa).
xch = ṁ· [(XNH3/PMNH3) · eq0NH3 + ((1−XNH3)/PMH20) · eq0H20],
where XNH3 is the ammonia composition in mass percentage, eq0 indicates the standard chemical exergies of ammonia and water (kJ/kmol), and PM refers to the molecular weights of the species involved in kg/kmol. Once the exergy values were determined in each state of the proposed system, the exergy balance was implemented for each component, using Equation (6) as a basis.
x,Q + Σṁinx,in = Σṁouthout + Ḝx,W + Ḝx,D.
In Equation (6), Ḝx,Q corresponds to the exergy associated with heat transfer in kW (Equation (7)), Ḝx,W represents the exergy related to the work done in units of kW (Equation (8)) and Ḝx,D indicates the exergy destruction (kW) quantified with Equation (9).
x,Q = Q(1 − T0/T).
x,W = Ẇ.
Exergy destruction was determined through the concept of exergy input (Ḝx,fuel), exergy loss (Ḝx,loss), and exergy output (Ḝx,pro). Thus, Equation (6) is expressed in terms of the exergy input and output, as shown in Equation (9).
x,D = Ḝx,fuel − Ḝx,loss − Ḝx,pro.
Table 1 presents the equations defining Ẇ, Q, and Ḝx,D for each component of the system in terms of kW. These equations were formulated from the energy and exergy balances previously established in Equations (2) and (6), respectively.
Based on the equations presented in Table 1, the overall energy efficiencies for the Brayton cycle and the Kalina cycle are given by Equation (10) and Equation (11), respectively.
nth,Brayton = (ẆT1 + ẆT2 − ẆC1 − Ẇc2 − Ẇc3)/(QHR + QRHR),
ηth,Kalina = (ẆT5 − ẆP3)/(QEva),
where, ẆT1 and ẆT2 are the power generated by turbines 1 and 2; ẆC1, Ẇc2, and Ẇc3 are the power consumed by compressors 1, 2, and 3, respectively; QHR and QRHR represent the heat supplied by the heater and superheater in the Brayton cycle. On the other hand, ẆT3 alludes to the power generated by turbine 3, ẆP is the power consumed by the pump in the Kalina cycle; finally, QEva corresponds to the waste heat recovered by the evaporator.
Likewise, the exergy efficiencies of the Brayton and Kalina configurations are expressed by Equations (12) and (13), respectively.
ηex/Brayton = (ẆT1+ ẆT2 − ẆC1 − Ẇc2 − Ẇc3)/(Ḝx,in/solar).
ηex/Kalina = (ẆT5 − ẆP3)/(Ḝx,14b − Ḝx,15).
The term Ḝx,in/solar in Equation (12) represents the exergy contribution of the solar source in units of kW, which is given by Equation (14).
x,in/solar = [1 − (4T0/3Te) (1 − cosϕ)1/4 + (1/3)(T0/Te)4][(QHR + QRHR)/(ηrηf)],
where T0 is the ambient temperature in K, Te is the equivalent solar temperature, ϕ is the sun cone angle, ηr and ηf refer to the solar receiver efficiency given by Equation (15), and the solar field efficiency defined in Table 2, respectively.
ηr = ϑ − [(κ·ρ·β·T4rec) + (Fcon·hcon)(T9 + δTrec − Tair)]/(ηsf·ϖ·θ),
where Trec is the surface temperature of the solar receiver in K; the remaining terms are shown in Table 2. In addition, the values used to determine the efficiency of the solar receiver and the solar parameters are shown in Equation (14).
In Equation (15), the term ϖ refers to the solar irradiation in the municipality of Araçuaí, Minas Gerais, in units of W/m2, where on 19 November 2023, the highest temperature recorded in Brazil’s history (44.8 °C) was registered [15]. Irradiation values for each hour of that day were taken. Solar irradiation data was obtained using NASA’s ‘POWER’ tool, while temperature and date data were determined using the database of the National Institute of Meteorology (INMET).
In this line of thought, Equations (14) and (15) quantify the exergy lost and destroyed by the solar receiver, respectively [31].
x,Loss/r = (QHR + QRHR)·[1 − (T0/(T9 + δTrec))]·((ϑ/ηr) −1).
x,D/r = Ḝx,in/solar·ηf − Ḝx,Loss/r + (Ḝx,10 − Ḝx,11) + (Ḝx,8 − Ḝx,9).

2.3. Exergo-Sustainability Indicators

To quantitatively evaluate the degree of sustainability of the proposed configurations, three exergo-sustainable indicators based on the second law of thermodynamics were implemented to evaluate and improve system performance [32]. Among these, the process Exergy Waste Ratio (EWR) stands out, which quantifies the ratio between the exergy lost during the process and the total exergy input to the system, expressed as defined by Equation (18) [28].
EWR = ξD,sysin,S-CO2.
To determine whether there is an environmental impact derived from the exergy destroyed, the Environmental Effect Factor (EEF), defined by Equation (19), is used [28].
EEF = EWR/ηexer,S-CO2.
And as a third indicator, to determine the degree of sustainability of the process, the Exergy Sustainability Index (ESI) is used, which is defined as the inverse of the Environmental Effect Factor (EEF) and is expressed by Equation (20) [28].
ESI = 1/EFF.

2.4. Model Validation

The validation of the models was performed independently for each cycle, comparing the results obtained with previous studies reported in the literature. Table 3 details the operating conditions used in other studies.
Figure 5 presents the comparative results of the models. For the Brayton S-CO2 cycle, Figure 5a shows the correlation between thermal efficiency and turbine inlet temperature, exhibiting remarkable agreement with the results of Padilla et al. [35], with relative errors approaching 1%. Regarding the Kalina cycle, Figure 5b illustrates the influence of evaporation pressure on the net power of the cycle, showing a close correlation with the results reported by Yari et al. [34]. The consistency observed in these comparisons validates the reliability of the models proposed for the evaluation of these configurations.

3. Results and Discussion

The most relevant findings derived from the indicators established in the methodology are presented in this part of the study. The research analyzes how several factors influence the energy, exergy, and exergo-sustainability performance of the proposed system. Specifically, the impact of three main variables is evaluated: the solar irradiation levels in Araçuaí, Minas Gerais; the temperature and pressure parameters at the turbine inlet (T1); and the thermal efficiency of the compressors. For the simulation of the case study, the parameters detailed in Table 4 were used.

3.1. Energy and Exergy Analysis of the Proposed System

This section presents the results obtained from the energy, exergy, and sustainability analysis of the Brayton S-CO2 cycle with intercooling and reheating, coupled with the Kalina cycle for waste heat recovery. The results of the sensitivity analysis are addressed, where the effects of critical parameters, such as hourly solar irradiation of Araçuaí-Minas Gerais, turbine inlet temperature and pressure (T1), and compressor efficiency on the system performance were examined. The results obtained from the exergo-sustainability indicators applied to the proposed system are also discussed.

3.1.1. Effect of Solar Radiation on the System Performance

Figure 6 shows the radiation behavior on 19 November 2023 in Araçuaí, a day in which the highest temperature in the history of measurements in Brazil was obtained [15]. In this scenario, the effect of climatic conditions on the system’s energy performance is evaluated for each of the hours of the day.
The irradiance values obtained by the POWER tool during the diurnal cycle showed a peak solar irradiance of 1072.67 W/m2 at 11:00 am. Our analysis revealed a remarkable synchronization between this peak and the maximum value of the system’s exergetic efficiency, which reached 24.46%, subsequently reducing the values, demonstrating the dependence of this in relation to the amount of solar energy available.
The system shows high exergy efficiency during periods of maximum solar irradiation, which highlights its ability to operate effectively under these conditions. To optimize the performance of the concentrated solar power (CSP) system and the Brayton-Kalina combined cycle, it is essential to adjust the operating parameters to correspond to the times of highest solar irradiation, which requires designing the system to maximize the utilization of the available solar energy during peak hours and reduce losses during periods of lower irradiation.
The conceptual results of this study show good feasibility in thermodynamic terms, considering the high exergy potential of solar radiation in supercritical Brayton cycles. The registered irradiations can be considered suitable to implement any type of solar technology, either medium or high temperature. In Araçuaí, specifically talking about CSP, the daily irradiation value of 8.19 kWh/(m2 day) greatly complies with the minimum values required of an effective CSP [37], achieving 48.9% more than required.

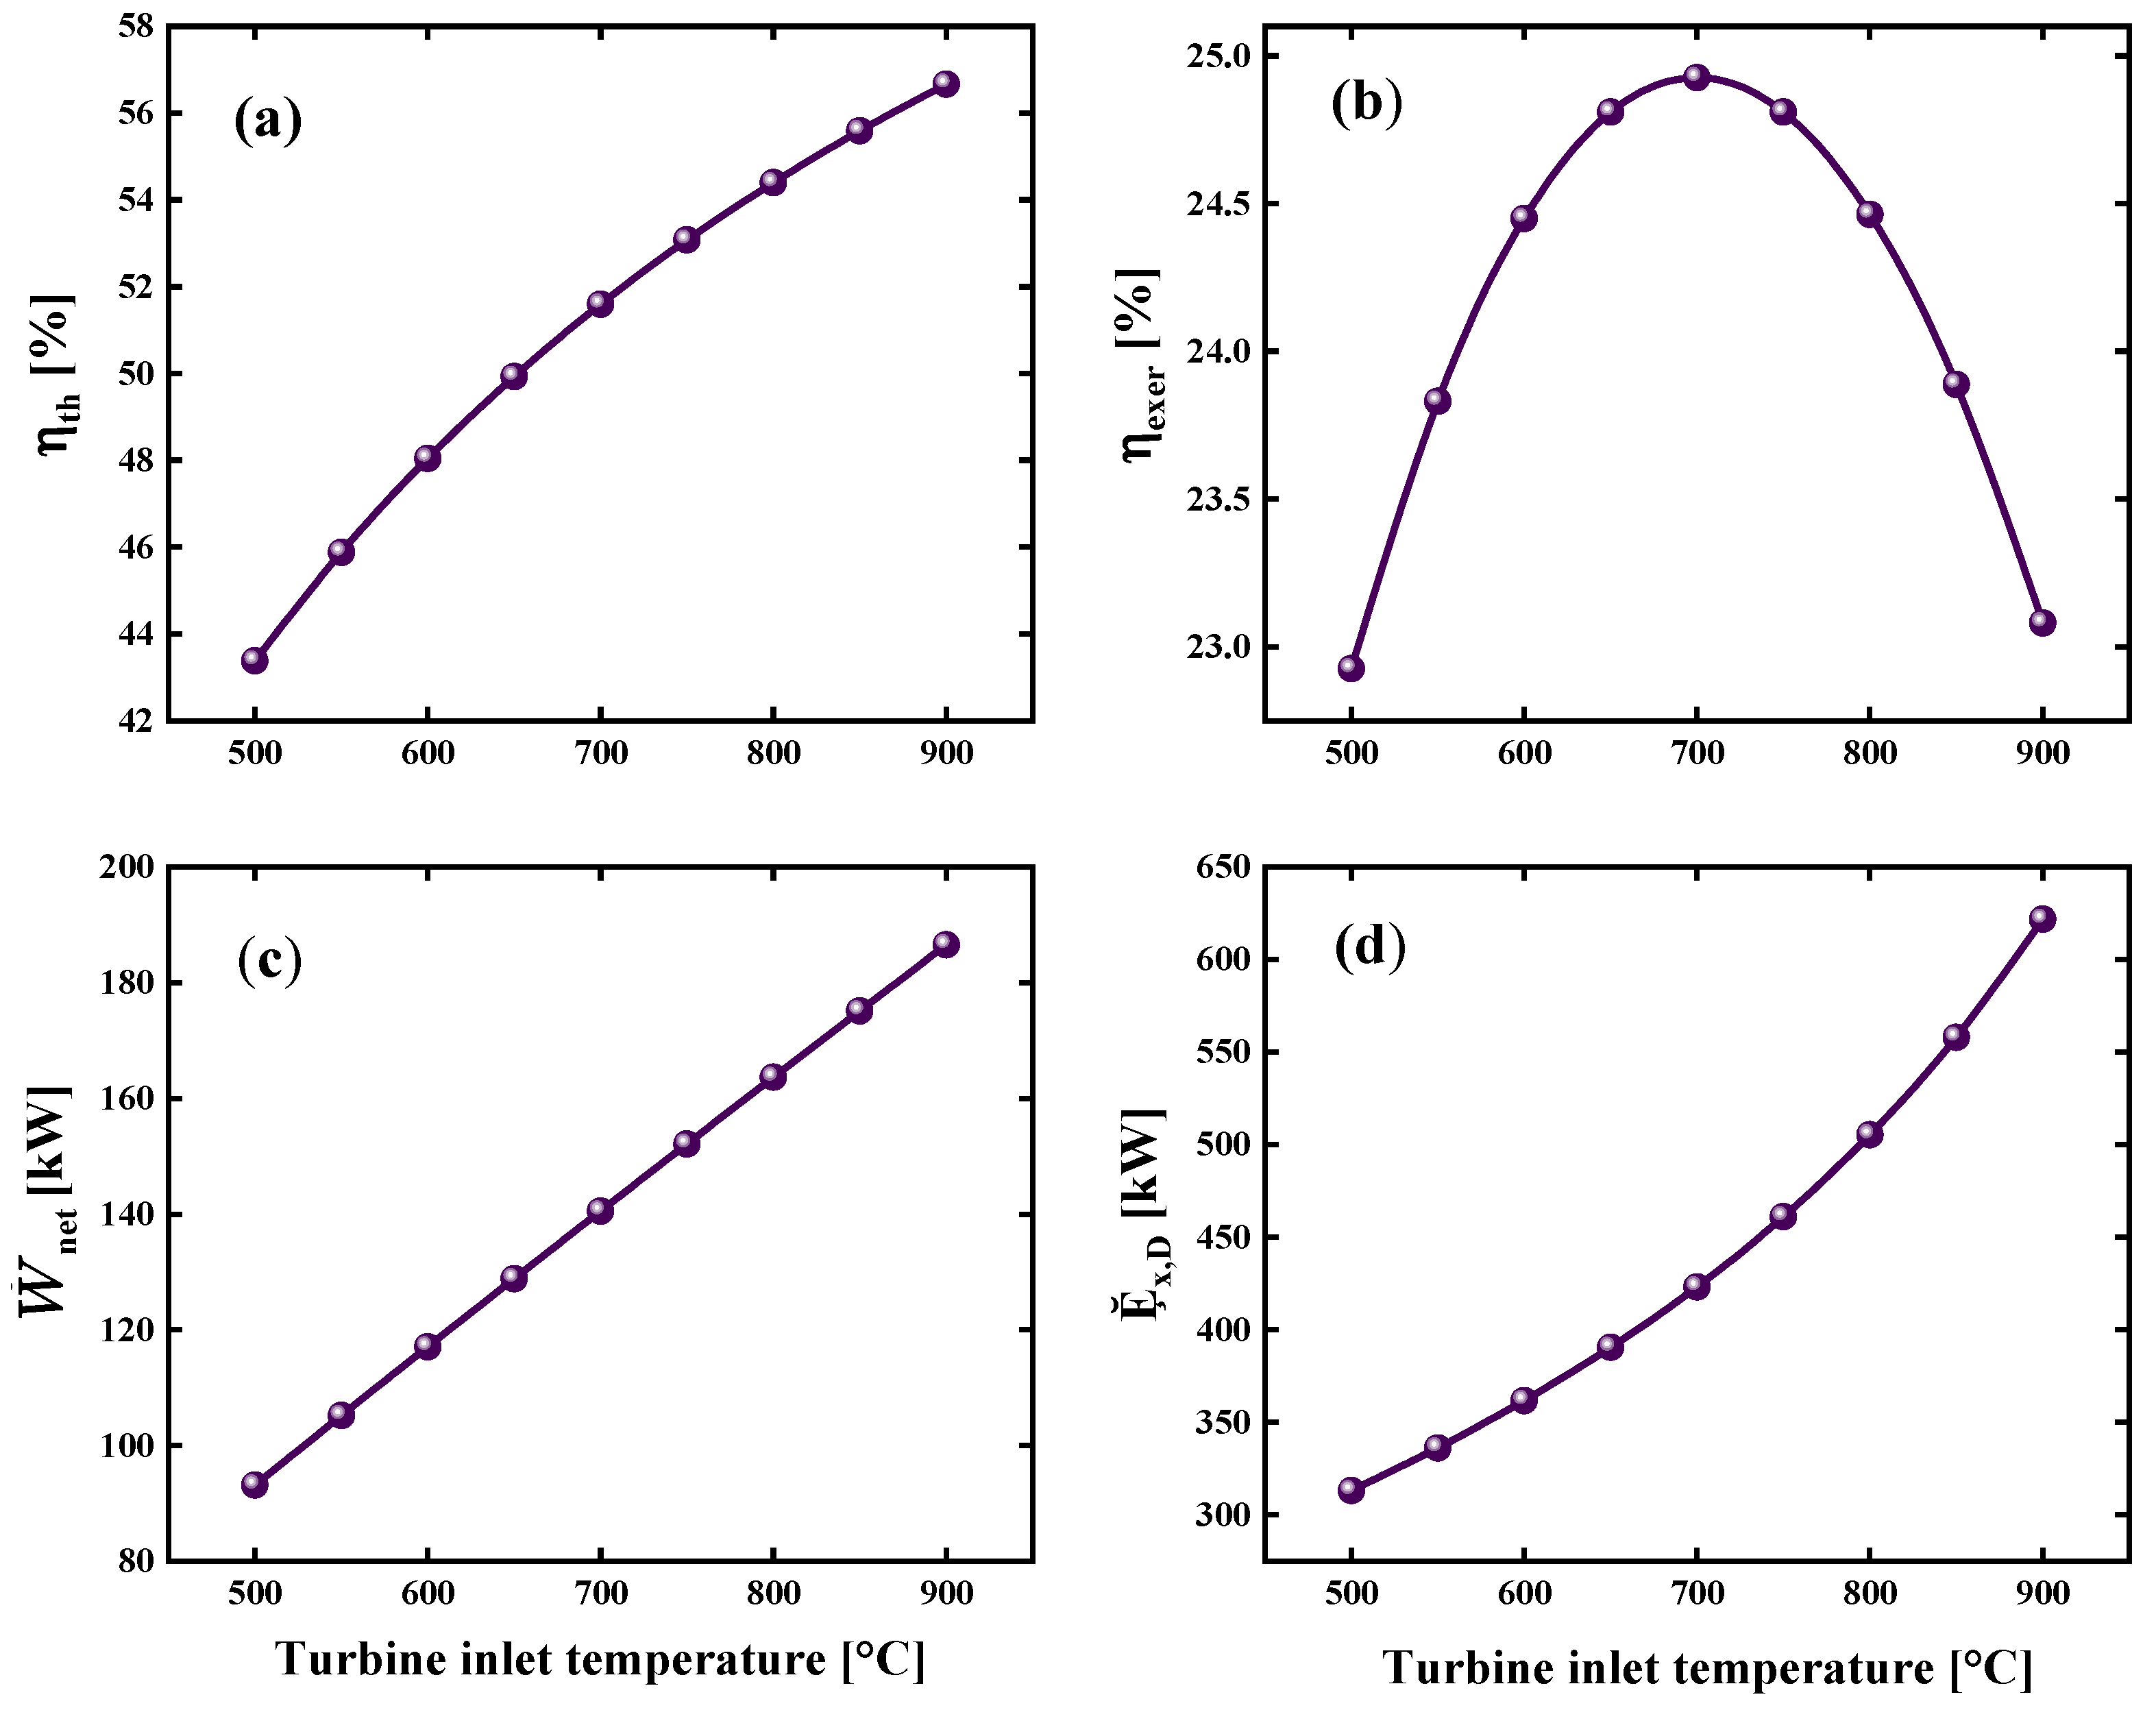
3.1.2. Effect of Turbine Inlet Temperature on System Performance

Figure 7 shows the effect of turbine inlet temperature, which varies between 500 and 900 °C, on the energy and exergy parameters of the Brayton S-CO2/Kalina combined cycle.
In Figure 7a, it is observed that the thermal efficiency η t h increases continuously with the inlet temperature, from a minimum value of 43.38% at 500 °C and a maximum of 56.67% at 900 °C; this indicates that the system improves its ability to convert thermal energy into useful work at higher temperatures. The exergy efficiency, shown in Figure 7b, exhibits a parabolic behavior, reaching a maximum value of 24.92% at 700 °C and subsequently decreasing to 23.08% at 900 °C, so the highest exergy utilization is obtained in an intermediate temperature range. As for the net power generated W ˙ n e t , shown in Figure 7c, a linearly ascending trend is evident, starting at 93.16 kW at 500 °C and reaching 186.55 kW at 900 °C, reflecting an increase in net work generating capacity with increasing inlet temperature. Finally, Figure 7d illustrates the total exergy destroyed Ε ˇ x , D varies from 313.21 kW at 500 °C to 621.62 kW at 900 °C, indicating an increase in irreversibilities at higher temperatures. The results described above indicate that, although increasing the inlet temperature favors thermal efficiency and net power, the operating point with the highest exergy efficiency, around 700 °C, allows an adequate balance between work generation and minimization of irreversibilities, this being the most favorable range for the thermo-environmental performance of the system.
The analysis of the effect of turbine inlet temperature on the energy and exergy parameters of the Brayton S-CO2/Kalina cycle presents similarities with the study of Li et al. [38] on a supercritical Brayton cycle integrated with a Kalina cycle for heat recovery. In both studies, increasing the inlet temperature increases the thermal efficiency continuously, while the exergy efficiency reaches its maximum in an intermediate range due to the increase of irreversibilities at higher temperatures. Also, the exergy destroyed grows with the inlet temperature, indicating a trade-off between thermal efficiency improvement and exergy sustainability, which is consistent with the work of Li et al. [38].

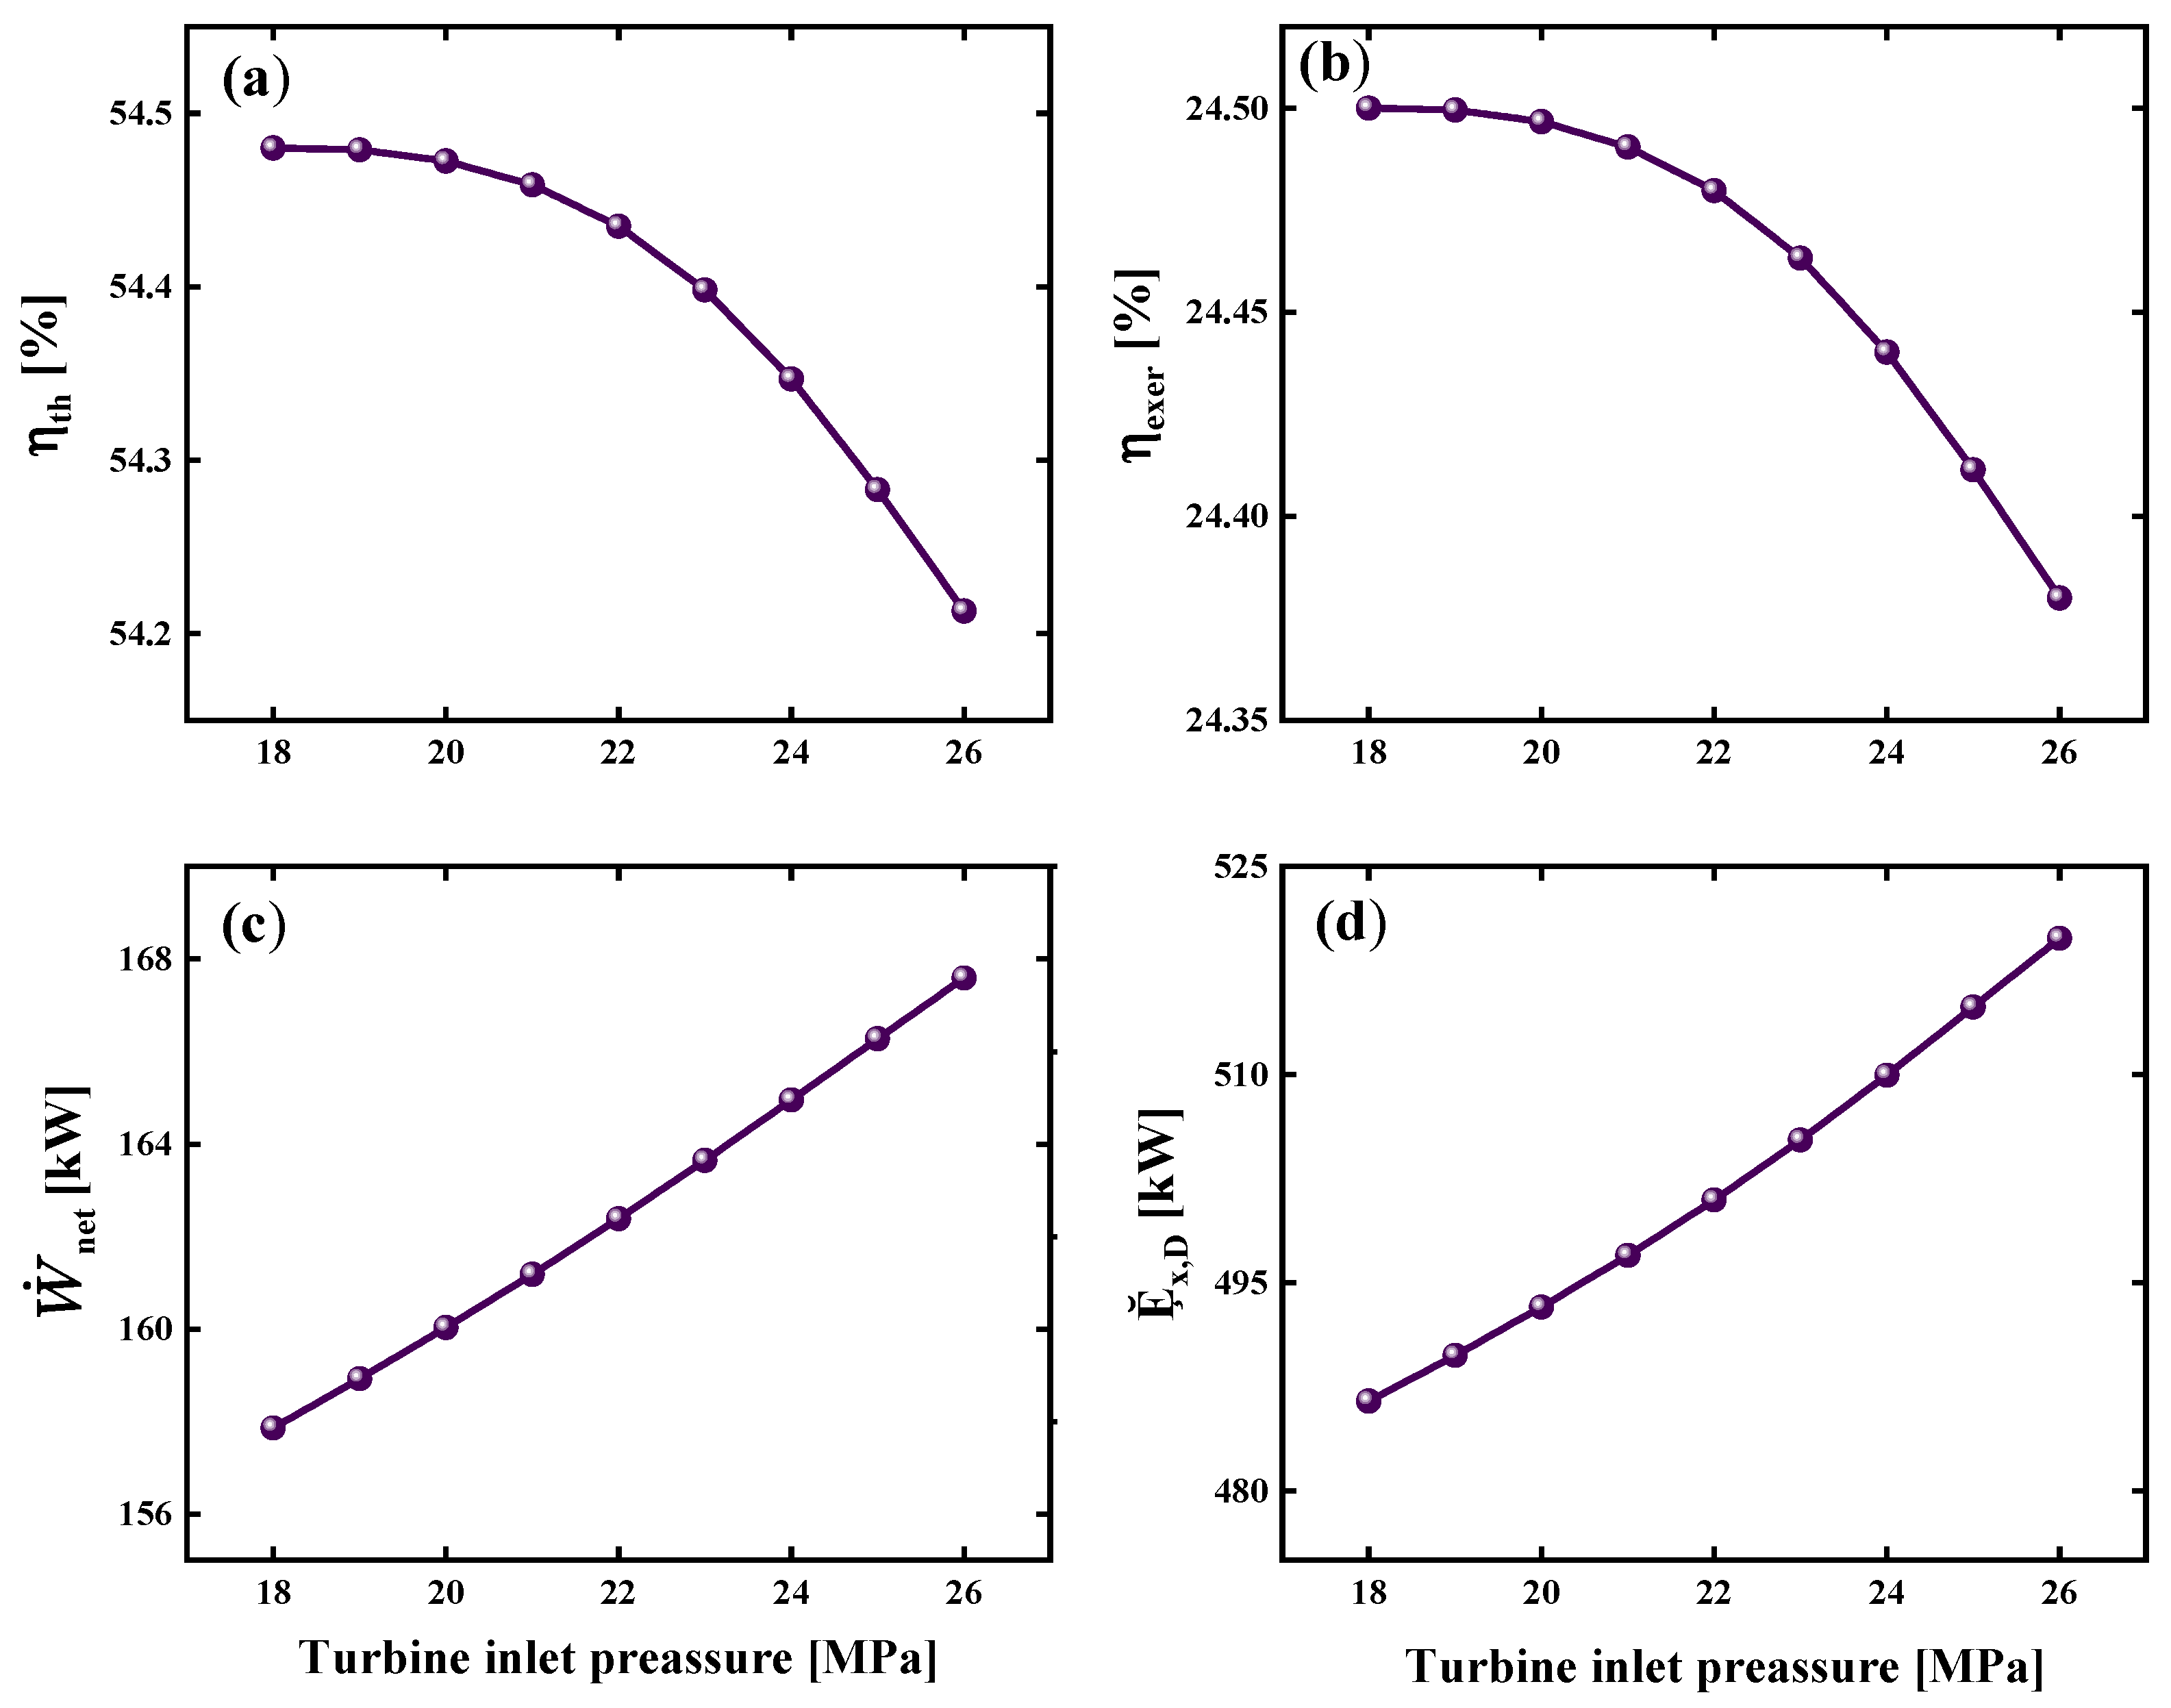
3.1.3. Effect of Turbine Inlet Pressure on the System Performance

Figure 8 presents the analysis of the energy and exergetic parameters of the Brayton S-CO2/Kalina combined cycle as a function of turbine inlet pressure, which fluctuates between 18 and 26 MPa.
The increase in turbine inlet pressure has a direct impact on the energy and exergy parameters of the Brayton S-CO2/Kalina combined cycle. In particular, the η t h decreases slightly from 54.48% to 54.18% (Figure 8a) between 18 MPa and 26 MPa, as a result of a higher energy demand associated with the compression of the working fluid, a phenomenon commonly reported in supercritical CO2 cycles, where the exergy losses increase due to irreversibilities in the compression processes [39]. On the other hand, η e x e r follows a similar pattern, decreasing from 24.50% to 24.38% over the same range of pressures (Figure 8b). It follows that the system operates more exergy-efficiently at lower pressures, where irreversibilities are less significant, as evidenced by studies on Brayton cycle configurations optimized for low-pressure conditions [40].
Regarding the net power generated W ˙ n e t , the results in Figure 8c indicate a linear increase from 157.86 kW to 167.59 kW with increasing inlet pressure. This behavior is related to a higher density of the working fluid at high pressures, which increases the useful work generation capacity, as documented in research on Brayton cycles integrating thermal sources such as solar energy [41]. However, this increase must be evaluated considering the balance between generated work and associated losses because the destroyed exergy Ḝx,D showed an increase of 30.5 kW with increasing pressure, going from 489.77 kW to 519.82 kW (Figure 8d). This increase can be attributed to additional irreversibilities introduced by higher pressure gradients, which raise the thermal and mechanical losses in the system components.

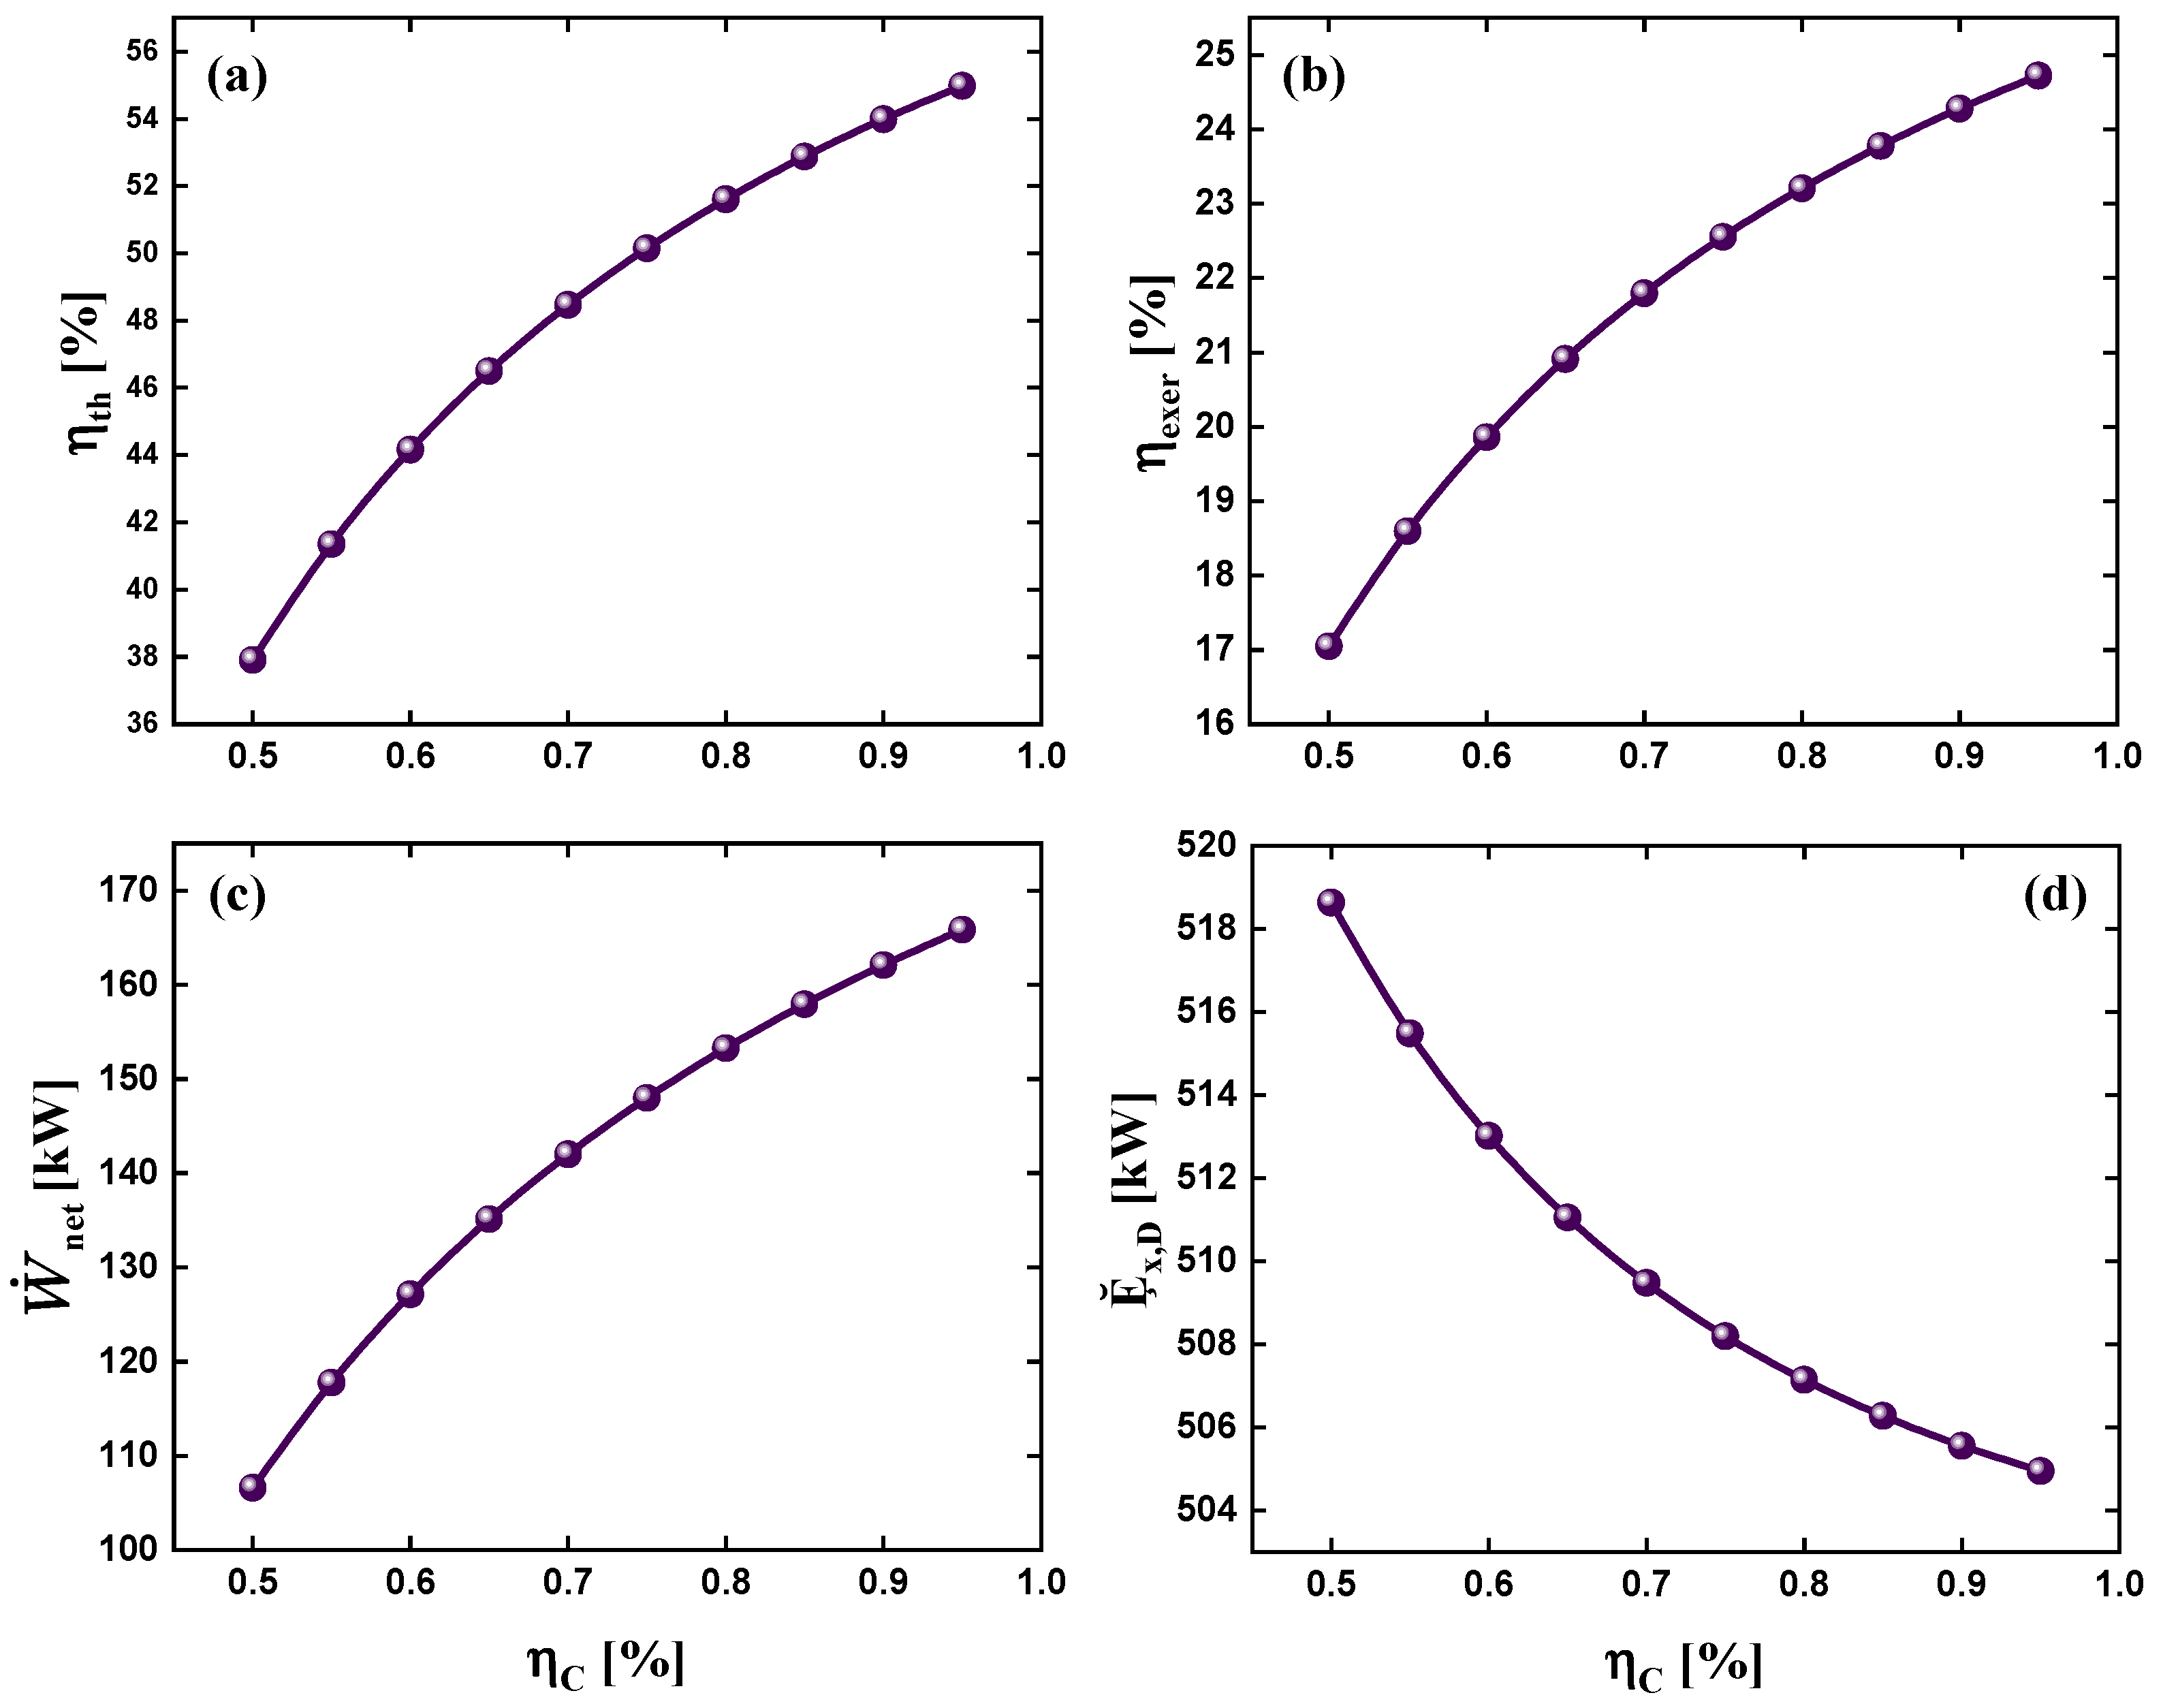
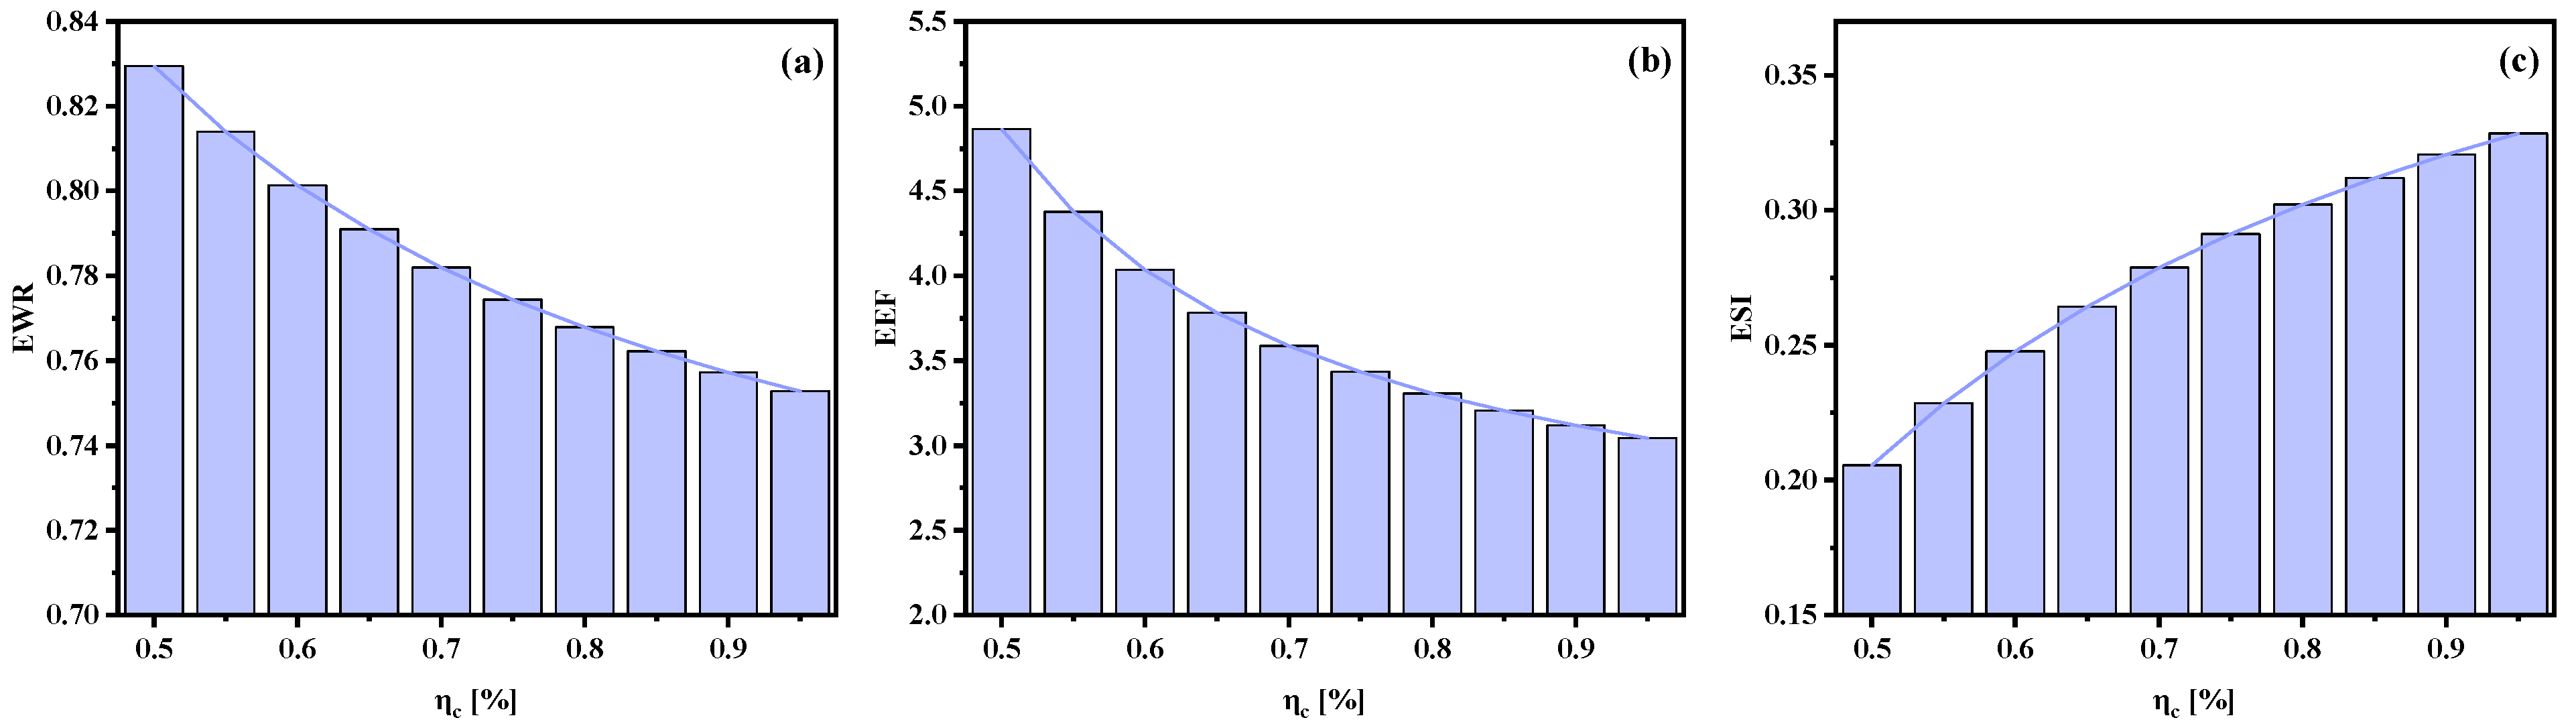
3.1.4. Effect of Compressor Efficiency on System Performance

Figure 9 shows the impact of compressor efficiency η c on the energy and exergetic parameters of the Brayton S-CO2/Kalina cycle.
As the compressor efficiency increases from 50% to 95%, the thermal efficiency η t h shows a continuous increase from 37.91% to 54.98% (Figure 9a). This increase is explained by the reduction of mechanical and thermal losses inside the compressor, which improves the conversion of heat into useful work as demonstrated by Yousef et al. in [39]. ηexer, on the other hand, increases by 44%, from 17.05% to 24.62% for the range of 50% ≤ η c   95%. This indicates that the reduction of irreversibilities in the compression process maximizes the utilization of the available exergy, aligning with previous studies highlighting the crucial role of high-efficiency compressors in optimized Brayton cycles [39]. For the net power W ˙ n e t the results show an increase from 106.60 kW to 165.84 kW in the above range as the compressor efficiency improves; the net useful work increases due to the decrease in energy consumed in compression. Figure 9d shows that the exergy destruction decreases from 518.63 kW to 504.95 kW as the compressor efficiency increases. This behavior highlights the inverse relationship between compressor efficiency and irreversibilities in the system, which has been extensively documented in research on supercritical CO2 cycles [41].

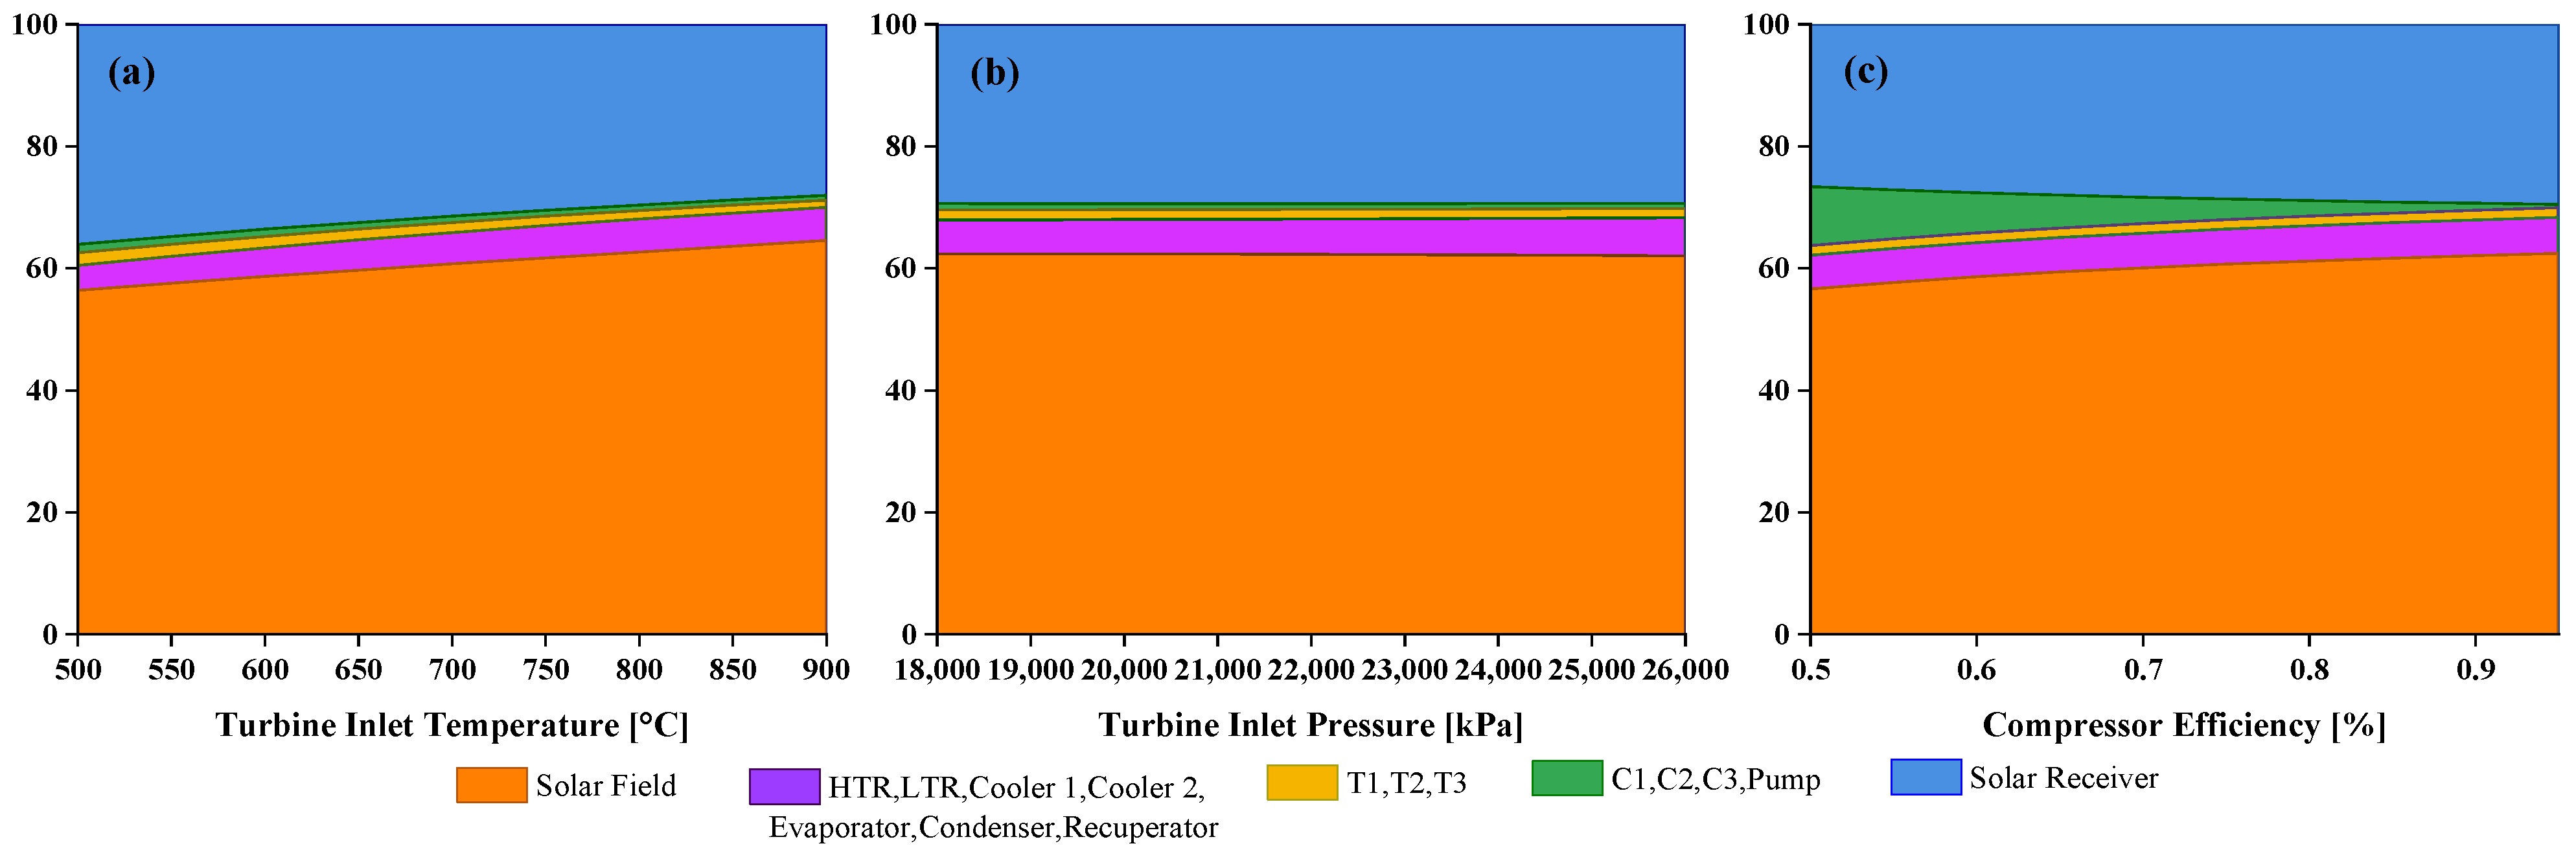
3.2. Exergy Destruction Study

For the exergy destruction study, the values contributed by the separator and the valve in the Kalina cycle were disregarded, since they were insignificant. To analyze the behavior of the exergy destroyed per component in the proposed configuration, Figure 10 shows the trend of exergy destruction as a function of the increase in turbine inlet temperature (Figure 10a), turbine inlet pressure (Figure 10b), and compressor efficiency (Figure 10c), taking into account the total irreversibilities, both internal and external, known as lost exergy.
It was observed that by increasing the turbine inlet temperature (Figure 10a), the exergy destruction, mainly in the solar field, increases significantly, from 162.5 kW to 323.3 kW, respectively, which represents a variation of 98.95% between 500 °C and 900 °C. The receiver is the second component that shows a greater amount of exergy destroyed. These components represented, on average, 60.6% and 31.7% of the total exergy destroyed; this behavior is due to the fact that the increase in the turbine inlet temperature increases the irreversibilities in the heat transfer and solar irradiation processes [42]. The heat exchangers, in turn, showed a tendency to increase the exergy destroyed, reaching a maximum of 27 kW at 900 °C. Although they are not the components that destroy the most exergy, they are the ones that show the greatest increase, with 128.81%, so they could be considered the most sensitive components to the increase in the turbine inlet temperature.
As the turbine inlet pressure increases, Figure 10b, the solar field and the receiver continue to contribute most of the destroyed exergy of the system, with 62.2% and 29.4% respectively, however, as the pressure increases, the increase in the exergy destroyed is not as significant as in the case of the turbine inlet temperature, in this case the solar field goes from 257.73 kW to 274.96 kW in the range of pressures analyzed, while the receiver has an increase from 121.55 kW to 130.16 kW, for its part, the heat exchangers show an increase in the exergy destroyed from 23.1 kW to 27.7 kW, the turbines and compressors show a decreasing trend in the exergy destroyed, however their contribution is minimal when compared to the solar field and the receiver, this is due to the stabilization of the thermodynamic processes in systems with high pressures, mitigating the exergy losses in components with a considerable thermal transfer, however, this does not reduce the irreversibilities in devices such as the receiver or the solar field [43].
When evaluating the exergy destruction as a function of compressor efficiency (Figure 10c), although, as previously observed, the solar field and the receiver continue to contribute the largest amounts of exergy destruction to the system—60.02% and 28.32%, respectively—the reduction in exergy destruction by the compressors stands out. It decreases from 42.82 kW to 2.38 kW as the compressor efficiency varies from 50% to 95%. This behavior indicates that higher compressor efficiency reduces irreversibilities in the fluid compression process, allowing a greater amount of energy to be utilized for performing useful work.

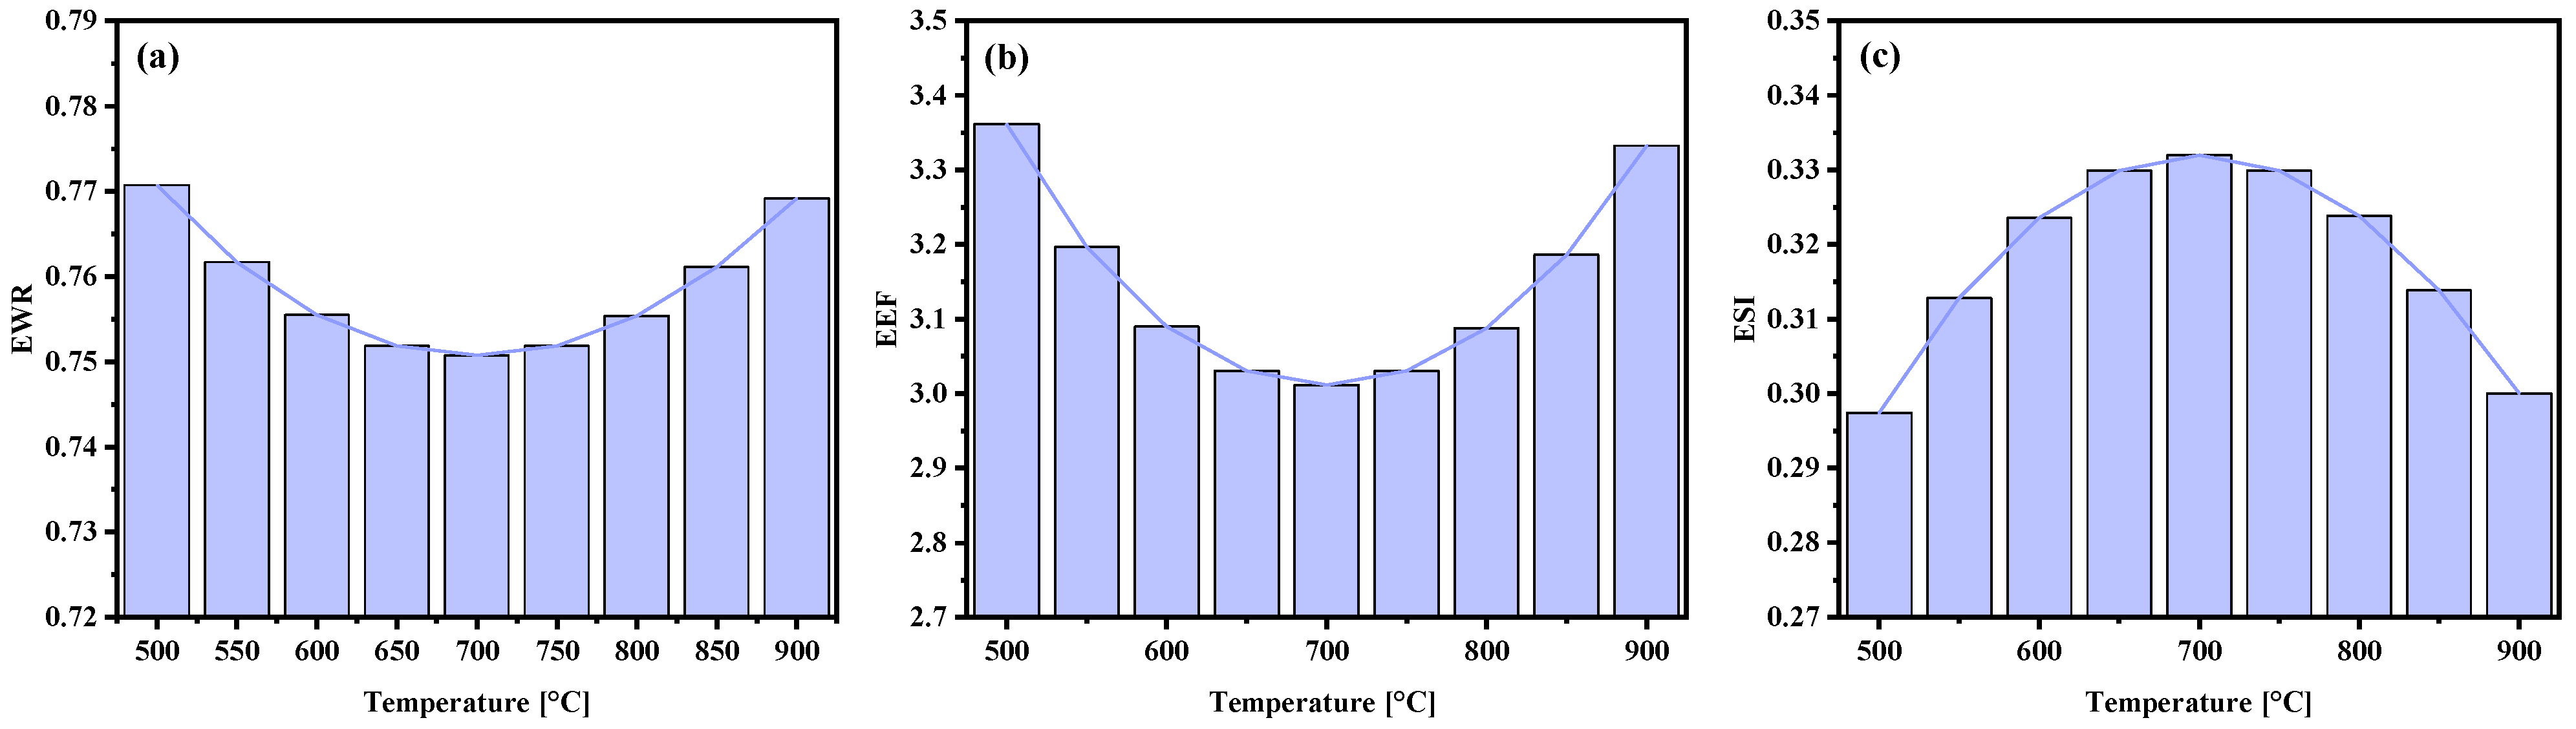
3.3. Exergo-Sustainability

For the cycle proposed in this research, a sensitivity analysis was performed on three indicators of energy sustainability (EWR, EEF, and ESI), varying three relevant thermodynamic parameters, such as turbine inlet temperature (T1), pressure, and compressor efficiency. Figure 11 shows the results of the EWR, EEF, and ESI indicators, showing a parabolic trend in all three cases within the temperature range of 500 °C to 900 °C.
The EWR showed a reduction of 2.59% from 0.77 to 0.75 from 500 °C to 700 °C (Figure 11b); from this temperature, it showed an increase of 2.39% to 0.769 at 900 °C. The same behavior is observed in Figure 11b where the EEF experienced a reduction of 10.41% between 500 °C and 700 °C decreasing from 3.36 to 3.01, followed by an increase of 9.62% up to 900 °C. Since the ESI is the inverse of the EEF, it can be seen in Figure 11c that its behavior is the opposite, increasing in the range from 500 °C to 700 °C and then increasing up to 900 °C. This indicates that the exergy sustainability of the cycle is greatest around 700 °C, where the EWR and EEF have their minimum values and the ESI, its maximum value.
Figure 12 shows the results obtained for the exergy indicators as a function of turbine inlet pressure.
The EWR (Figure 12a) presents a polynomial behavior, with a gradual increase as the pressure increases from 18 MPa to 26 MPa, going from 0.7549 to 0.7561, which indicates that the increase in pressure generates greater exergy destruction. Similarly, the EEF (Figure 12b) shows a slight increase from 3.08 to 3.10 with increasing pressure, which is consistent with the behavior of the EWR; the ESI (Figure 12c), on the other hand, decreased with increasing pressure, from 0.3245 to 0.3224. These results indicate that operating conditions at lower pressures favor the exergo-sustainability of the system, reducing irreversibilities and maximizing the exergy efficiency of the cycle.
When analyzing the effect of compressor efficiency on the exergo-sustainability of the system (Figure 13), it is observed that, for the EWR (Figure 12a), as the compressor efficiency increases from 50% to 95%, the EWR decreases polynomially from 0.829 to 0.752, a total reduction of 9.25%. For its part, the EEF (Figure 12b) showed a considerable decrease of 37.42%, from 4.86 to 3.04 in the study range. The ESI, in agreement with the behavior of the EEF, presented an increase from 0.205 to 0.328 with the variation of the compressor efficiency. These results are as expected according to what was seen in Figure 13c, where the exergy destruction was minimized by increasing the efficiency.

4. Conclusions

In this study, an energy, exergy, and exergy-sustainability analysis was performed on a Brayton S-CO2/Kalina cycle, where the thermal efficiency and net power of the system increase as the turbine inlet temperature increases, obtaining maximum values at 900 °C, with 56.57% and 186.55 kW; however, this also increased the exergy destroyed. The exergy efficiency showed better performance at intermediate turbine inlet temperature ranges in the range studied, around 700 °C, reaching a value of 24.92%.
As for the turbine inlet pressure, it slightly reduces the first and second law efficiencies by 0.3% and 0.12%, respectively, although it increases the net power of the system.
It was demonstrated that the compressor efficiency plays a fundamental role in the thermal and exergy efficiencies, reaching maximum values of 54.98% and 24.62%, as in the net power and a reduction of the exergy destroyed from 518.63 kW to 504.95 kW.
For the exergy-sustainability indicators analyzed, exergy waste ratio (EWR), exergetic efficiency factor (EEF), and exergetic sustainability index (ESI), an outstanding operating temperature of 700 °C was determined as it presents better results in exergo-sustainability.
In general, it is recommended to operate the Brayton S-CO2/Kalina combined cycle at a turbine inlet temperature close to 700 °C, since this temperature range shows a better relationship between cycle efficiencies, exergy destruction, and power production.
Finally, it is concluded that the solar irradiation conditions in Araçuaí, Minas Gerais, are highly favorable for the development of concentrated solar power (CSP) systems coupled to Brayton S-CO2/Kalina cycles, showing a high potential for exergetic efficiency, especially during periods of maximum irradiation. The results highlight that the system reaches an exergetic efficiency of 24.46% during peak irradiation times (1072.67 W/m2), confirming the technical feasibility of its implementation, given that the daily irradiation values exceed the minimum required for effective CSP systems by 48.9%. However, additional studies are required to evaluate the behavior of the system under different climatic conditions, as well as its economic viability and associated environmental impact. Adjusting operating parameters to maximize energy use during irradiation peaks is key to consolidating this technology as an efficient and sustainable solution for renewable energy generation.
It is suggested to continue with the research and development of technologies for the solar field and the receiver, since these are the components with the greatest potential for improvement of the analyzed cycle, which would allow improving the efficiency and sustainability of the combined cycle. In this regard, future studies could address the following key questions:
  • How can the solar receiver design be optimized to reduce thermal losses and increase the energy efficiency of the system?
  • What materials could improve the absorption of solar energy in the receiver and its resistance to high temperatures?
  • What operation and maintenance strategies could minimize deterioration and maximize the service life of the solar field and receiver components?
  • What is the relationship between operating conditions and capital, operating, and maintenance costs to maximize the economic viability of the Brayton and S-CO2/Kalina cycle in CSP systems?

Author Contributions

Conceptualization, J.C. and G.V.; methodology, J.C.; software, G.V.; validation, G.V. and B.M.; formal analysis, G.V.; investigation, J.C.; resources, B.M.; data curation, B.M.; writing—original draft preparation, J.C. and G.V.; writing—review and editing, J.C. and B.M.; visualization, B.M.; supervision, J.C.; project administration, G.V.; funding acquisition, B.M. All authors have read and agreed to the published version of the manuscript.

Funding

The authors thank the Universidad del Atlántico for the resources received under the Internal Call for Strengthening Research Groups for Creation, Innovation and Research-2024. For the project entitled “Análisis termodinámico, energético, económico y de impacto ambiental de ciclos Brayton de producción de potencia acoplados a tecnologías de recuperación de calor residual, a partir de fuentes no convencionales de energía en el departamento del Atlántico” with funding code ING712-CII2024.

Data Availability Statement

No new data created.

Acknowledgments

The authors wish to acknowledge the support received by the research group “Gestión eficiente de la energía, Kai”, especially the mechanical engineers, Luis Rodriguez, Denilson Gonzalez, and José Tovar.

Conflicts of Interest

The authors declare no conflicts of interest. The funders had no role in the design of the study; in the collection, analyses, or interpretation of data; in the writing of the manuscript; or in the decision to publish the results.

References

  1. Abbass, K.; Qasim, M.Z.; Song, H.; Murshed, M.; Mahmood, H.; Younis, I. A review of the global climate change impacts, adaptation, and sustainable mitigation measures. Environ. Sci. Pollut. Res. 2022, 29, 42539–42559. [Google Scholar] [CrossRef] [PubMed]
  2. Lindsey, R.; Dahlman, L. Climate Change: Global Temperature; NOAA Climate: Silver Spring, MD, USA, 2024; pp. 1–5. [Google Scholar]
  3. Guamán, V.J.; Espinoza, E.E. Educación para el cambio climático. Rev. Metrop. Cienc. Apl. 2022, 5, 17–24. Available online: https://www.redalyc.org/pdf/7217/721778114003.pdf (accessed on 14 November 2024). [CrossRef]
  4. Olabi, A.G.; Abdelkareem, M.A. Renewable energy and climate change. Renew. Sustain. Energy Rev. 2022, 158, 112111. [Google Scholar] [CrossRef]
  5. Holechek, J.L.; Geli, H.M.E.; Sawalhah, M.N.; Valdez, R. A Global Assessment: Can Renewable Energy Replace Fossil Fuels by 2050? Sustainability 2022, 14, 4792. [Google Scholar] [CrossRef]
  6. Leme, J.V.; Casaca, W.; Colnago, M.; Dias, M.A. Towards Assessing the Electricity Demand in Brazil: Data-Driven Analysis and Ensemble Learning Models. Energies 2020, 13, 1407. [Google Scholar] [CrossRef]
  7. UNFCCC. Federative Republic of Brazil Nationally Determined Contribution (NDC) to the Paris Agreement Under the UNFCC; UNFCCC: Brasilia, Brazil, 2023; Available online: https://unfccc.int/sites/default/files/NDC/2023-11/Brazil%20First%20NDC%202023%20adjustment.pdf (accessed on 14 November 2024).
  8. Balanço Energético Nacional 2024. Epe: Empresa de Pesquisa Energética. Available online: https://www.epe.gov.br/pt/publicacoes-dados-abertos/publicacoes/balanco-energetico-nacional-2024 (accessed on 14 November 2024).
  9. Arias, M.E.; Farinosi, F.; Lee, E.; Livino, A.; Briscoe, J.; Moorcroft, P.R. Impacts of climate change and deforestation on hydropower planning in the Brazilian Amazon. Nat. Sustain. 2020, 3, 430–436. [Google Scholar] [CrossRef]
  10. da Silva, B.C.; Virgílio, R.M.; Nogueira, L.A.H.; Silva, P.D.N.; Passos, F.O.; Welerson, C.C. Assessment of Climate Change Impact on Hydropower Generation: A Case Study for Três Marias Power Plant in Brazil. Climate 2023, 11, 201. [Google Scholar] [CrossRef]
  11. da Silva, H.M.F.; Araújo, F.J.C. Energia solar fotovoltaica no Brasil: Uma revisao bibliográfica. Rev. Ibero-Am. Humanidades Ciências Educ. 2022, 8, 859–869. [Google Scholar] [CrossRef]
  12. Bernadete, M.; Gutierrez, S. Governance for the Transition to a Sustainable Energy Sector in Brazil: Integrating Energy and Climate Change Policies. International Association for Energy Economics, 2021. Available online: https://iaee2021online.org/download/contribution/fullpaper/433/433_fullpaper_20210601_222348.pdf (accessed on 14 November 2024).
  13. de Andrade Santos, J.A.F.; de Jong, P.; da Costa, C.A.; Torres, E.A. Combining wind and solar energy sources: Potential for hybrid power generation in Brazil. Util. Policy 2020, 67, 101084. [Google Scholar] [CrossRef]
  14. Paraschiv, L.S.; Paraschiv, S. Contribution of renewable energy (hydro, wind, solar and biomass) to decarbonization and transformation of the electricity generation sector for sustainable development. Energy Rep. 2023, 9, 535–544. [Google Scholar] [CrossRef]
  15. Boletim Agroclimatológico Mensual; Instituto Nacional de Meteorología: Nampula, Mozambique, 2025. Available online: https://portal.inmet.gov.br/boletinsagro# (accessed on 14 November 2024).
  16. Zhai, R.; Chen, Y.; Li, J.; Du, M.; Yang, Y. Intelligent construction and optimization based on the heatsep method of a supercritical CO2 brayton cycle driven by a solar power tower system. Sol. Energy Mater. Sol. Cells 2024, 276, 113075. [Google Scholar] [CrossRef]
  17. Li, M.-J.; Li, M.-J.; Jiang, R.; Du, S.; Li, X.-Y. Study on the dynamic characteristics of a concentrated solar power plant with the supercritical CO2 Brayton cycle coupled with different thermal energy storage methods. Energy 2024, 288, 129628. [Google Scholar] [CrossRef]
  18. Chowdhury, A.S.; Ehsan, M.M. A Critical Overview of Working Fluids in Organic Rankine, Supercritical Rankine, and Supercritical Brayton Cycles Under Various Heat Grade Sources. Int. J. Thermofluids 2023, 20, 100426. [Google Scholar] [CrossRef]
  19. Xiao, T.; Liu, C.; Wang, X.; Wang, S.; Xu, X.; Li, Q.; Li, X. Life cycle assessment of the solar thermal power plant integrated with air-cooled supercritical CO2 Brayton cycle. Renew Energy 2022, 182, 119–133. [Google Scholar] [CrossRef]
  20. Palomino, M.H.; Pacheco, E.C.; Forero, J.D.; Lascano, A.F.; Padilla, R.V. Análisis exergético de un ciclo Brayton supercrítico con dióxido de carbono como fluido de trabajo. Inge Cuc 2018, 14, 159–170. [Google Scholar] [CrossRef]
  21. Nihaj, A.N.M.; Shan, U. A Review of Kalina Cycle. 2020. Available online: https://setee.globalpublisher.org/article_180394_21e49de16f7d8798550e581a3d3fb57d.pdf (accessed on 14 November 2024).
  22. Fan, G.; Dai, Y. Thermo-economic optimization and part-load analysis of the combined supercritical CO2 and Kalina cycle. Energy Convers. Manag. 2021, 245, 114572. [Google Scholar] [CrossRef]
  23. Omar, A.; Saghafifar, M.; Mohammadi, K.; Alashkar, A.; Gadalla, M. A review of unconventional bottoming cycles for waste heat recovery: Part II–Applications. Energy Convers. Manag. 2019, 180, 559–583. [Google Scholar] [CrossRef]
  24. Mahmoudi, S.S.; Akbari, A.D.; Rosen, M. Thermoeconomic Analysis and Optimization of a New Combined Supercritical Carbon Dioxide Recompression Brayton/Kalina Cycle. Sustainability 2016, 8, 1079. [Google Scholar] [CrossRef]
  25. Yousef, M.S.; Santana, D. Thermodynamic and Exergoeconomic Analysis of Utilizing a Modified Kalina Cycle for a Recompression Supercritical CO2 Cycle Waste Heat Recovery. In Proceedings of the 2023 6th International Conference on Electrical Engineering and Green Energy (CEEGE), Grimstad, Norway, 6–9 June 2023; IEEE: Piscataway, NJ, USA, 2023; pp. 253–259. [Google Scholar] [CrossRef]
  26. Zhang, D.; Zhang, H.; Luo, Y.; Zhao, S. Comparative and optimal study of energy, exergy, and exergoeconomic performance in supercritical CO2 recompression combined cycles with organic rankine, trans-critical CO2, and kalina cycle. Energy 2024, 311, 133347. [Google Scholar] [CrossRef]
  27. Tovar, J.M.; Ochoa, G.V.; Casseres, D.M. Thermodynamic and environmental comparative analysis of a dual loop ORC and Kalina as bottoming cycle of a solar Brayton sCO2. Int. J. Thermofluids 2024, 24, 100895. [Google Scholar] [CrossRef]
  28. Hassan, R.; Barua, H.; Das, B.K. Energy, exergy, exergo-environmental, and exergetic sustainability analyses of a gas engine-based CHP system. Energy Sci. Eng. 2021, 9, 2232–2251. [Google Scholar] [CrossRef]
  29. Yu, A.; Su, W.; Lin, X.; Zhou, N. Recent trends of supercritical CO2 Brayton cycle: Bibliometric analysis and research review. Nucl. Eng. Technol. 2021, 53, 699–714. [Google Scholar] [CrossRef]
  30. Ho, C.K.; Iverson, B.D. Review of high-temperature central receiver designs for concentrating solar power. Renew. Sustain. Energy Rev. 2014, 29, 835–846. [Google Scholar] [CrossRef]
  31. Pantaleo, A.M.; Camporeale, S.M.; Sorrentino, A.; Miliozzi, A.; Shah, N.; Markides, C.N. Hybrid solar-biomass combined Brayton/organic Rankine-cycle plants integrated with thermal storage: Techno-economic feasibility in selected Mediterranean areas. Renew. Energy 2020, 147, 2913–2931. [Google Scholar] [CrossRef]
  32. Abam, F.I.; Okon, B.B.; Edem, I.F.; Ndukwu, M.C.; Ekpo, E.B.; Diemuodeke, O.E. Environmental assessment and CO2 emissions of Brayton cycle configurations based on exergo-sustainability, economic and ecological efficiency using multi-criteria optimization technique. Future Technol. 2024, 3, 1–12. [Google Scholar] [CrossRef]
  33. Padilla, R.V.; Too, Y.C.S.; Benito, R.; Stein, W. Exergetic analysis of supercritical CO2 Brayton cycles integrated with solar central receivers. Appl. Energy 2015, 148, 348–365. [Google Scholar] [CrossRef]
  34. Yari, M.; Mehr, A.S.; Zare, V.; Mahmoudi, S.M.S.; Rosen, M.A. Exergoeconomic comparison of TLC (trilateral Rankine cycle), ORC (organic Rankine cycle) and Kalina cycle using a low grade heat source. Energy 2015, 83, 712–722. [Google Scholar] [CrossRef]
  35. Padilla, R.V.; Too, Y.C.S.; Benito, R.; McNaughton, R.; Stein, W. Multi-objective thermodynamic optimisation of supercritical CO2 Brayton cycles integrated with solar central receivers. Int. J. Sustain. Energy 2018, 37, 1–20. [Google Scholar] [CrossRef]
  36. Merchán, R.P.; Santos, M.J.; Medina, A.; Hernández, A.C. High temperature central tower plants for concentrated solar power: 2021 overview. Renew. Sustain. Energy Rev. 2022, 155, 111828. [Google Scholar] [CrossRef]
  37. Jennings, T.; Parsons, L. Concentrated Solar Power-Focusing the Sun’s Energy for Large-Scale Power Generation; Environmental and Energy Study Institute: Washington, DC, USA, 2009; pp. 1–4. [Google Scholar]
  38. Li, H.; Wang, M.; Wang, J.; Dai, Y. Exergoeconomic Analysis and Optimization of a Supercritical CO2 Cycle Coupled with a Kalina Cycle. J. Energy Eng. 2017, 143, 04016055. [Google Scholar] [CrossRef]
  39. Yousef, M.S.; Santana, D. Novel supercritical CO2-Based Low-Carbon multige-neration System: Multi-Objective optimization for combined Power, Cooling, Heating, and desalination. Energy Convers. Manag. X 2024, 23, 100649. [Google Scholar] [CrossRef]
  40. Luo, Y.; Su, Z.; Li, Z.; Zheng, N.; Wei, J. Off-design performance analysis of super-critical CO2 mixture Brayton cycle with floating critical points. Sol. Energy 2024, 276, 112665. [Google Scholar] [CrossRef]
  41. Shokrkar, M.H.; Dehghan, A.; Ghasemi, H.; Ameri, M. Simultaneous optimizati-on of combined supercritical CO2 Brayton cycle and organic Rankine cycle integrated with concentrated solar power system. Energy 2020, 213, 118791. [Google Scholar] [CrossRef]
  42. Stand, L.M.; Ochoa, G.V.; Forero, J.D. Energy and exergy as-sessment of a combined supercritical Brayton cycle-orc hybrid system using solar radia-tion and coconut shell biomass as energy source. Renew. Energy 2021, 175, 119–142. [Google Scholar] [CrossRef]
  43. Zhou, Y.; Zhang, Y.; Li, H.; Yang, Y.; Bai, W.; Zhang, C.; Zhang, X.; Yao, M. Thermo-economic and environmental analyses of supercritical car-bon dioxide Brayton cycle for high temperature gas-cooled reactor. Prog. Nucl. Energy 2024, 177, 105461. [Google Scholar] [CrossRef]
Figure 1. Brayton S-CO2 cycle with intercooling and reheat.
Resources 14 00031 g001
Figure 2. Concentrated solar power (CSP) tower.
Resources 14 00031 g002
Figure 3. Kalina cycle.
Resources 14 00031 g003
Figure 4. T-S diagram of the proposed cycles. (a) Brayton cycle; (b) Kalina cycle.
Resources 14 00031 g004
Figure 5. Model validation: (a) Brayton S-CO2 cycle with intercooling and reheat; (b) Kalina cycle.
Resources 14 00031 g005
Figure 6. Effect of solar radiation on system exergy performance.
Resources 14 00031 g006
Figure 7. Effect of turbine inlet temperature on (a) thermal efficiency, (b) exergy efficiency, (c) net power, and (d) total exergy destroyed for the Brayton S-CO2/Kalina cycle.
Resources 14 00031 g007
Figure 8. Effect of turbine inlet pressure on (a) thermal efficiency; (b) exergy efficiency; (c) net power; (d) total exergy destroyed for the Brayton S-CO2/Kalina cycle.
Resources 14 00031 g008
Figure 9. Effect of compressor efficiency on (a) thermal efficiency; (b) exergy efficiency; (c) net power; (d) total exergy destroyed for the Brayton S-CO2/Kalina cycle.
Resources 14 00031 g009
Figure 10. Exergy destroyed by components as a function of (a) turbine inlet temperature; (b) turbine inlet pressure; (c) compressor efficiency.
Resources 14 00031 g010
Figure 11. Exergo-sustainability indicators as a function of temperature: (a) EWR; (b) EEF; (c) ESI.
Resources 14 00031 g011
Figure 12. Exergo-sustainability indicators as a function of pressure: (a) EWR; (b) EEF; (c) ESI.
Resources 14 00031 g012
Figure 13. Exergo-sustainability indicators as a function of com-pressor efficiency: (a) EWR; (b) EEF; (c) ESI.
Resources 14 00031 g013
Table 1. Energy and exergy balance for each component.
CycleComponentQx,D
Brayton S-CO2Turbine 19·(h9 − h10)-(Ḝx,9 − Ḝx,10) − ẆT1
Turbine 211·(h11 − h12)-(Ḝx,11 − Ḝx,12) − ẆT2
Compressor 11·(h2 − h1)-C1 − (Ḝx,2 − Ḝx,1)
Compressor 23·(h4 − h3)-C2 − (Ḝx,4 − Ḝx,3)
Compressor 314a·(h6 − h14)-C3 − (Ḝx,6 − Ḝx,14a)
HTR-12·(h12 − h13)(Ḝ12 − Ḝ13) − (Ḝx,8 − Ḝx,7)
LTR-13·(h13 − h14)(Ḝ13 − Ḝ14) − (Ḝx,5 − Ḝx,4)
Cooler 1-16·(h15 − h1)(Ḝx,15 − Ḝx,1) − (Ḝx,17 − Ḝx,16)
Cooler 2-2·(h2 − h3)(Ḝx,2 − Ḝx,3) − (Ḝx,20 − Ḝx,19)
Heater-8·(h8 − h9)Equation (17)
Reheater-10·(h10 − h11)
K
C
Turbina 324·(h24 − h26)-(Ḝ24 − Ḝ26) − ẆT5
Pumpwf·(h20 − h21)-B3 − (Ḝ21 − Ḝ20)
Evaporator-wf·(h23 − h22)(Ḝ14b − Ḝ15) − (Ḝ23 − Ḝ22)
Condenser-wf·(h29 − h20)(Ḝ29 − Ḝ30) − (Ḝ31 − Ḝ30)
Recuperator-wf·(h28 − h29)(Ḝ28 − Ḝ29) − (Ḝ22 − Ḝ21)
Valve--25 − Ḝ27
Table 2. Parameters used for receiver efficiency calculation [30].
ParametersUnitValue
Annual heliostat field efficiency, ηf,-0.60
The equivalent temperature of the sun, TsK6073.15
Cone angle of the sun, ϕRad0.05
Absorption, ϑ-0.95
Thermal Emittance, κ-0.85
View factor, β-1
Convective heat loss factor, Fcon-1
Convective heat transfer coefficient, hconW/(m2·K)10
Solar receiver temperature approach, δTrecK423.15
Concentration ratio, θ-900
Table 3. Input parameters for model validation.
Brayton S-CO2 ParametersValueRef.Kalina ParametersValueRef.
Turbine inlet temperature500–850 °C
(773.15–1123.15 K)
[33]Thermal source temperature120 °C (393.15 K)[34]
High cycle pressure25 MpaThermal source pressure0.2 MPa
Turbine efficiency93%Thermal source mass flow100 kg/s
Compressor efficiency90%Condensation pressure1.4 MPa
Pinch temperature difference5 °C
(278.15 K)
Evaporation pressure24–40 Bar (2.4–4 MPa)
Effectiveness of exchangers95%Turbine efficiency85%
CO2 mass flow rate1 kg/sPump efficiency85%
Ammonia concentration0.9%
Table 4. Parameters used for the simulation of the system under study.
Brayton S-CO2 ParametersValueRefs.Kalina ParametersValueRef.
Pressure ratio 1, r p 1 = P 9 / P 12 1.66[35]Optimum ammonia concentration75%[34]
Pressure ratio 2, r p 2 = P 9 / P 10 3.57[35]Evaporating pressure30 bar
(3 MPa)
[34]
Pressure ratio 3, r p 3   = P 9 / P 2 2.57[35]Condensing temperature, T 20 40 °C
(313.15 K)
[34]
Cooling temperature, T 1 50 °C (323.15 K)[31,36]
Disclaimer/Publisher’s Note: The statements, opinions and data contained in all publications are solely those of the individual author(s) and contributor(s) and not of MDPI and/or the editor(s). MDPI and/or the editor(s) disclaim responsibility for any injury to people or property resulting from any ideas, methods, instructions or products referred to in the content.

