Article

Transforming Biomass Waste into Hydrochars and Porous Activated Carbon: A Characterization Study

by
Suhas
1,*,
Monika Chaudhary
2,
Shubham Chaudhary
1,
Shivangi Chaubey
1,
Isabel Pestana da Paixão Cansado
3,*,
Mohammad Hadi Dehghani
4,5,
Inderjeet Tyagi
6 and
Rama Gaur
7
1
Department of Chemistry, Gurukula Kangri (Deemed to be University), Haridwar 249404, India
2
Department of Chemistry, Hariom Saraswati P.G. College, Dhanauri, Haridwar 247667, India
3
MED—Mediterranean Institute for Agriculture, Environment and Development & Change—Global Change and Sustainability Institute and Department of Chemistry and Biochemistry, School of Science and Technology, University of Évora, Rua Romão Ramalho, nº 59, 7000-671 Évora, Portugal
4
Department of Environmental Health Engineering, School of Public Health, Tehran University of Medical Sciences, Tehran 1416634793, Iran
5
Center for Solid Waste Research, Institute for Environmental Research, Tehran University of Medical Sciences, Tehran 1416634793, Iran
6
Centre for DNA Taxonomy, Molecular Systematics Division, Zoological Survey of India, Kolkata 700053, India
7
Department of Chemistry, School of Energy Technology, Pandit Deendayal Energy University, Knowledge Corridor, Raisan, Gandhinagar 382426, India
*
Authors to whom correspondence should be addressed.
Resources 2025, 14(3), 34; https://doi.org/10.3390/resources14030034
Submission received: 29 January 2025 / Accepted: 17 February 2025 / Published: 20 February 2025

Abstract

:
Hydrothermal carbonization (HTC) is an environmentally friendly process for transforming biomass into sustainable hydrochar, which is a carbon-rich material with a variety of potential applications. Herein, Tectona grandis seeds (TGs) were transformed into hydrochars using HTC at low temperatures (180–250 °C) and autogenous pressure. The prepared hydrochars were rich in oxygenated functional groups. The optimized hydrochar, HC-230-4 (prepared at 230 °C, for 4 h), presented a ratio of H/C = 0.95 and O/C = 0.29, an improved degree of coalification, and a high heating value (26.53 MJ kg−1), which can replace bituminous coals in the power sector. The prepared hydrochar was further activated in the presence of CO2 to prepare activated carbon (AC). XRD, TGA, FTIR, FE-SEM, and BET techniques were used to characterize raw biomass (TGs), hydrochar, and ACs, to identify the potential applications for the developed materials. BET studies revealed that the hydrochar has limited porosity, with a low surface area (14.41 m2g−1) and porous volume. On the other hand, the derived AC (AC-850-5) has a high surface area (729.70 m2g−1) and appreciable total and microporous volumes (0.392 cm3g−1 and 0.286 cm3g−1). The use of biomass, mainly waste biomass, for the production of carbon-rich materials is an effective strategy for managing and valorizing waste biomass resources, reducing environmental pollution, and improving sustainability, being in line with the principles of circularity.

1. Introduction

The world’s demand for carbon-rich materials has considerably increased in recent years due to their numerous applications, such as energy storage, soil remediation, pharmaceutical delivery, and water treatment. However, economic constraints associated with the high cost of non-renewable precursors and energy-intensive expenses in the commercial production of carbonaceous materials are the major issues faced by the global community [1]. To overcome these problems, great efforts have been made to produce carbonaceous materials from low-cost, widely accessible, and renewable raw materials [2,3,4,5]. Biomass, especially less-utilized or waste biomass, being one of the most abundantly available renewable resources, has been analyzed and exploited by researchers as a precursor, for the sustainable production of low-cost carbon materials, such as biochar or activated carbons [2,3,4,5,6].
In this work, the seeds of Tectona grandis (TGs) were utilized as a precursor for the production of hydrochar and, subsequently, activated carbon. Tectona grandis Linn F. is a member of the Lamiaceae family. It is mainly cultivated in different states of India, namely Uttarakhand, Gujarat, Tamil Nadu, Kerala, Orissa, Madhya Pradesh, Andhra Pradesh, Assam, Karnataka, and Uttar Pradesh, with an annual production of 5131 hectares per year [7,8]. Generally, the seed production ranges from 0.02 to 7.0 kg per tree [7]. The seed is a drupe globose, 5 to 20 mm in size, enclosed by an accrescent calyx with a thick shaggy exocarp of matted hairs [9]. Some of the seeds hang on the tree throughout the hot season, but most achieve maturity between November and January and gradually fall off the tree [8].
TG seeds could be collected and germinated to create new healthy plants for plantations or reforestation since Tectona grandis wood has a high commercial value [5,6,7]. TG seeds could also be valorized throughout composting or energy production. However, the seeds that fall from trees can be contaminated with soil debris or other contaminants. TGs in the form of solid waste or leftovers, can also be converted into carbon-rich materials, which represent a method to reduce solid waste and promote local income and sustainability [5].
Different techniques, such as pyrolysis, torrefaction [10,11], and gasification [12], have been intensively investigated, in recent decades for the development of carbon-based materials. A diversity of published works described the production of activated carbon through physical or chemical activation, with different physical (CO2, water vapor, air) or chemical (KOH, ZnCl2, H3PO4, K2CO3) activating agents, using various precursors (natural or synthetic origin) [1,2,3,4,5,6]. Nevertheless, the pre-drying of biomass and the high energy requirements of these techniques make them inadequate for the achievement of current targets.
Hydrothermal Carbonization (HTC) is a thermal technique for the conversion of biomass into carbonaceous materials. It overcomes all the drawbacks witnessed by other conventional methodologies. HTC is particularly well-suited for processing wet feedstock, as the reaction medium is water. Unlike pyrolysis, which is energy-intensive and requires a dewatering step, HTC is a more convenient and efficient process. HTC is generally performed at temperatures ranging between 180 and 250 °C and under auto-generated pressures [13], producing a carbon-rich material, namely, hydrochar. The hydrochars as a result of different reactions like hydrolysis, dehydration, decarboxylation, re-condensation, and aromatization, are versatile materials and have wide applications [14,15].
The HTC process involves a complex network of chemical transformations that change biomass to carbonaceous material at medium temperatures and high pressures with water acting as a medium [16,17]. Primarily in the aqueous phase, the biomass undergoes a thermal decomposition, at which point complex organic molecules like cellulose, hemicellulose, and lignin decompose [16]. Water also acts as a solvent in the early stages, where hydrolysis occurs with the breaking down of complex carbohydrates into simple sugars, acids, and even smaller compounds [18]. After hydrolysis, decarboxylation, and dehydration take place, where hydrolyzed products degrade. Most of the intermediate compounds produced from dehydration and decarboxylation reactions of monomers undergo condensation, polymerization, and aromatization, resulting in a solid product called hydrochar [19]. Using the HTC process, the biomass’s oxygen and hydrogen content decrease, which gives it coal-like properties [17]. As a carbon-rich substance with a lot of oxygenated functional groups on its surface, hydrochar is a perfect starting point for the production of activated carbon [5,14].
In the present work, a less-utilized sustainable biomass, Tectona grandis seeds (TGs), was selected and used as a precursor for the production of hydrochar. The prepared hydrochars were further utilized to produce activated carbons using a physical activation approach under CO2 gas flow. A pictorial representation of the development of activated carbon via hydrothermal carbonization is shown in Figure 1. The activated carbons are generally developed using an energy-intensive process, namely pyrolysis; however, here we are using a more energy-efficient route for their preparation. The activated carbons are versatile adsorbents and are used for different applications, namely water remediation, electrode materials for energy storage, fuels, etc.
Based on our current knowledge, no work is available to date on the development of hydrochar and activated carbon employing Tectona grandis seeds as a precursor. This study presents the morphological, textural, thermogravimetric properties, functional groups on the surface, and ultimate and proximate analyses of Tectona grandis seeds, hydrochars, and activated carbons.
To better elucidate the returns of using an HTC to prepare activated carbon, a bibliometric search was performed on the Elsevier database, using the following keywords: hydrochar, activated carbon, characterization, and applications. With these keywords, 165 papers were identified, and a scheme presenting the relation between them is shown in Figure 2, using VOSviewer 1.6.20 software.
In Figure 2, the red cluster is in the center, and it is linked to all the other clusters, highlighting the growing dynamism and importance of the relation between biomass, hydrochar, and activated carbon. From this cluster, the different methods used to valorize biomass and the assortments of applications for the carbon materials obtained are highlighted, such as catalysts, energy purposes, and wastewater treatment. The green cluster includes the chemical and physiochemical properties of the hydrochar and ACs, and the different techniques used to achieve this goal. The blue cluster is directly related to the specific applications of hydrochar and ACs in wastewater treatment.
The purpose of this work is to develop low-cost carbon-rich materials from biomass waste (TGs) using the hydrothermal carbonization (HTC) process, followed by physical activation with CO2, to produce activated carbon with different burn-offs. Besides developing these materials, the study aims to identify their textural, thermal, and physical properties. A thorough characterization of these materials will provide important information about their suitability for practical environmental solutions, including energy storage and water remediation. This research has been performed using an energy-efficient and low-carbon process to produce high-performance materials as an alternative to traditional pyrolysis. Eventually, the research aims to contribute to the waste management and development of sustainable, high-performance carbon materials with wide applications, in environmental and energy solutions. Finally, the process used to valorize biomass waste by transforming it into hydrochar and activated carbon is in line with the principles of the circular economy.

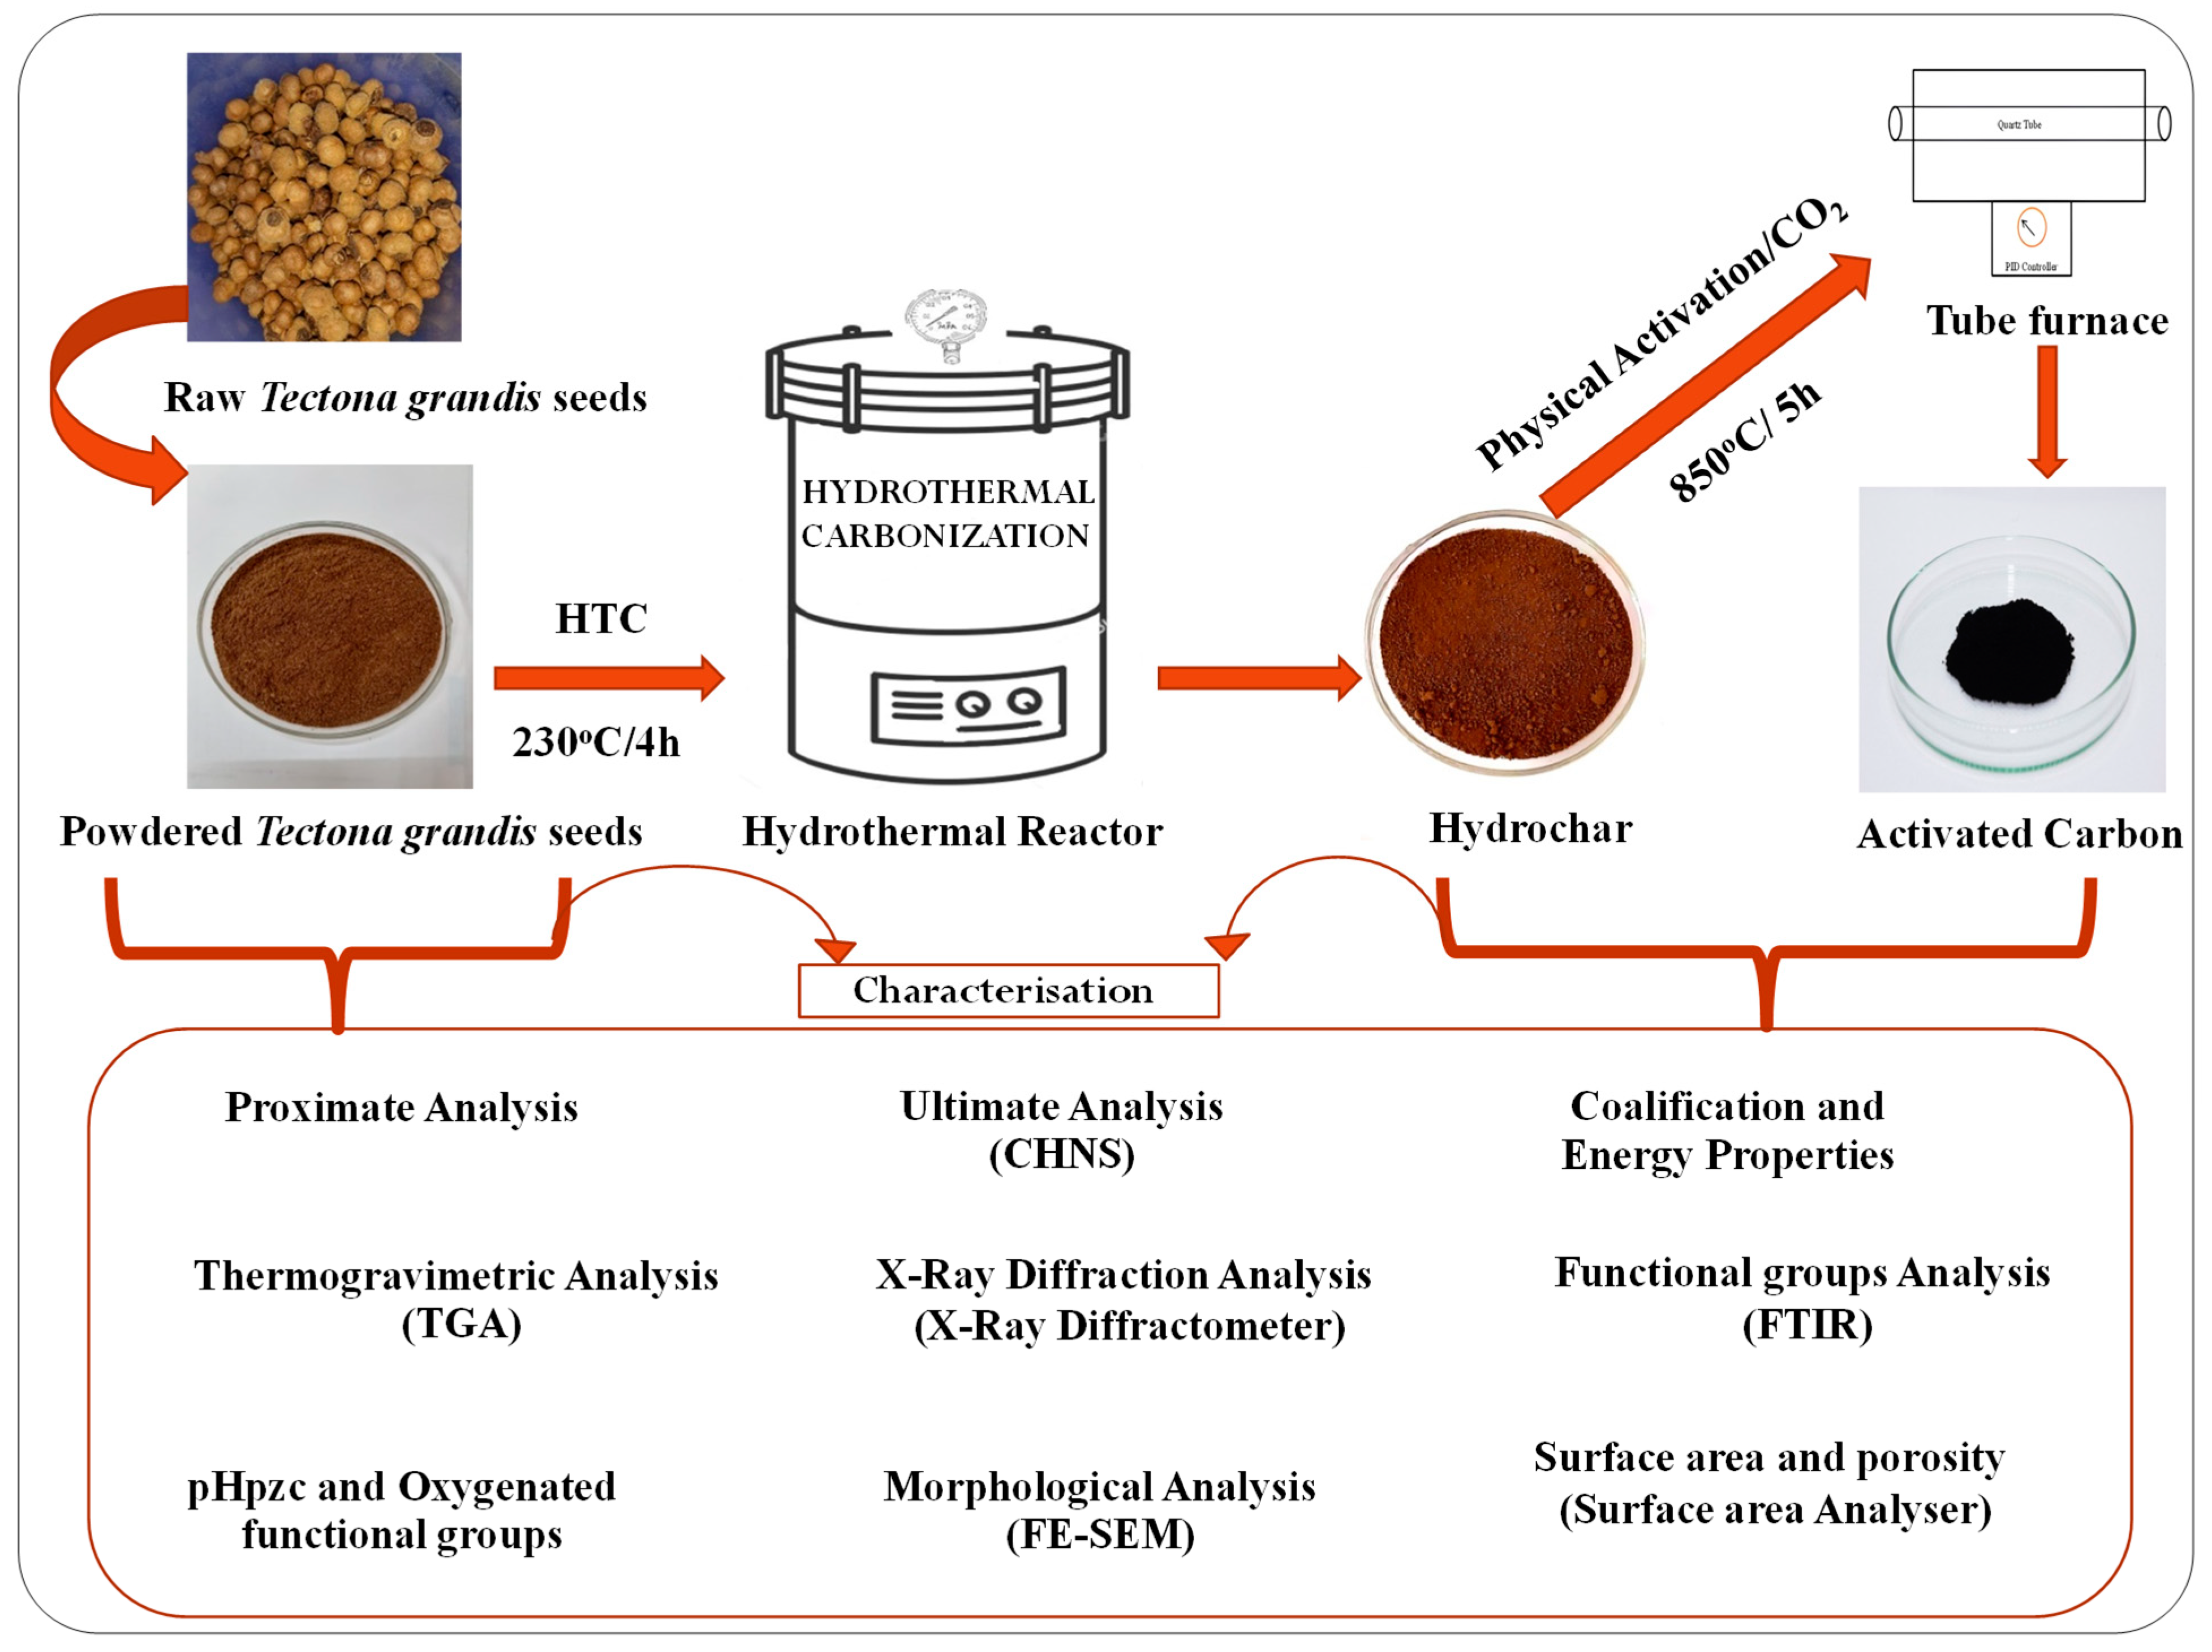
2. Materials and Methods

2.1. Pretreatment of Precursor

The seeds (TGs) were collected from Haridwar, India, and were utilized as a precursor for the preparation of hydrochar and subsequently activated carbon. The as-obtained TGs were properly washed to eliminate the adhered impurities and then dried. The dried seeds were further ground to a powdered form and sieved to obtain a homogeneous size (10–30 mesh). The homogeneous powdered TGs obtained were further dried in an oven (NSW-143, NSW, New Delhi, India) at 105 °C, for 24 h. Finally, the powdered TG sample was kept in air-tight containers for further use.

2.2. Hydrochar Production

Different hydrochars were prepared using the hydrothermal carbonization (HTC) process, which was carried out in a 600 mL reactor (Parr, Model-4838, Moline, IL, USA) designed to operate at a maximum pressure and temperature of up to 200 bars and 350 °C, respectively. To obtain hydrochar, 10 g of the powdered TGs and 100 mL of water (precursor: water ratio: 1:10 W/V) were processed in a Teflon-lined reactor, in the temperature range of 180–250 °C for 1h. Based on the carbon content and surface area analysis, the sample prepared at 230 °C was selected for further optimization of residence time (ranging from 1 to 5 h). The hydrochar prepared at 230 °C for 4 h (HC-230-4) exhibited the best textural results (high surface area and porous volume) and was selected for further analysis. The autogenous pressure, within the vessel was observed from the pressure gauge in the reactor, and it ranged between 8 and 38 bar for samples prepared at 180 to 250 °C for 1 h. However, it reached a maximum pressure of 40 bars for the sample prepared at 230 °C, for 4 h. Post-HTC, the reactor was cooled to ambient temperature, and the resulting slurry was separated using the Whatman filter paper No.1. The filtered solid, denoted as hydrochars, was dried out in an oven for 24 h, weighed, and kept in a desiccator for further use. The hydrochar samples were named HC-xxx-y, where xxx and y correspond to the temperature (°C) and the residence time (h), respectively.

2.3. Activated Carbon Production

The precursor (HC-230-4) used to produce ACs was chosen based on its highest carbon content, surface area, degree of coalification, and higher heating value when compared to the other hydrochars produced under different conditions. For the production of ACs, about 5 g of pre-dried HC-230-4 were taken in an alumina boat and placed in a horizontal quartz tube furnace (Carbolite Gero, Model-TF1-1200, Hope Valley, UK) under a controlled atmosphere. The hydrochar was heated at a rate of 5 °C min−1 to a temperature range of 750–950 °C in a N2 flow of 100 mL min−1. Upon reaching the targeted temperature, the nitrogen flow was exchanged for CO2 gas (400 mL min−1). The CO2 flow was kept for a duration of 1, 3, 5, or 7 h, which corresponds to the activation time. Upon completion of the activation, CO2 gas was replaced by a flow of 100 mL min−1 of nitrogen, and the furnace was gradually cooled down to room temperature. Besides these, another sample designated AC-850-5(P) was prepared through direct carbonization of TGs at 600 °C for 1 h, in N2 flow, followed by an activation step at 850 °C using CO2 gas, for 5 h. Upon completion of the activation process, the furnace was gradually cooled down to room temperature, under a flow of 100 mL min−1 of nitrogen. The obtained samples were abbreviated as AC-xxx-y, where xxx and y corresponded to the temperature and the activation time, respectively, at which the AC samples were prepared. The samples obtained were stored in air-tight sample boxes, which were kept in a desiccator for further use.

2.4. Characterization of Tectona grandis Seeds, Hydrochars, and Activated Carbons

Tectona grandis seeds, resulting in hydrochars and activated carbons (ACs), were characterized using several techniques, and the details of the utilized methods, conditions, and instruments are discussed in the subsequent sections.

2.4.1. Proximate, Ultimate, and Yield Analysis

The volatile matter, ash, and moisture contents of raw seeds of Tectona grandis and produced hydrochars and ACs were determined according to the ASTM standard methods D3175-07, E1755-01, and D4442-07, respectively.
The quantitative determination of C, H, N, and S was achieved via Vario Micro CHNS Analyzer (Elementar, Ronkonkoma, NY, USA). The elemental analysis was also used to evaluate the atomic ratios of O/C and H/C, which were plotted in the van Krevelen diagram to express the degree of coalification upon HTC. The percentage yield of the prepared hydrochars and ACs were estimated using the following expressions (Equation (1a,b)):
Yield   HC   ( % ) = W e i g t h   o f   H C W e i g t h   o g   T G s
Yield   AC   ( % ) = W e i g h t   o f   A C W e i g t h   o f   H C

2.4.2. Higher Heating Value (HHV), Fuel Ratio, Energy Yield, and Ratio of Energy Densification

The HHV, fuel ratio, energy densification ratio, and energy yield analysis of TGs and hydrochars were performed according to Equations (2)–(5), respectively [20,21].
HHV = 0.3491 × C + 1.1783 × H + 0.1005 × S − 0.1034 × O − 0.015 × N − 0.021 × A
Fuel Ratio = Fixed Carbon/Volatile Matter
Energy Densification = HHV of Hydrochar/HHV of TGs
Energy Yield = Hydrochar Yield × Energy Densification
where C, H, N, S, O, and A are carbon, hydrogen, nitrogen, sulfur, oxygen, and ash content, respectively.

2.4.3. XRD Analysis

DMax-2200 powder X-ray diffractometer (Rigaku, Tokyo, Japan) with copper radiation (Cu-Kα) at 40 kV/40 mA was used to find out the sample’s structural information. A scanning step of 0.02° at 2θ angles of 5–80° with a scanning rate of 1° min−1 was used for all the samples.

2.4.4. Thermogravimetric Analysis

The thermal analysis of TGs and hydrochar (HC-230-4) was studied using an Exstar TG/DTA 6300 thermo-gravimetric analyzer (Seiko Instruments Inc., Chiba, Japan) in a constant nitrogen flow and a heating rate of 5 °C min−1, between 30 and 1000 °C.

2.4.5. Point of Zero Charge (pHpzc) and Oxygen Containing Functional Groups

The pH at the point of zero charge (pHpzc) of TGs, hydrochar, and ACs was determined as described elsewhere [22], while Boehm’s method [23,24] was used to quantify the functional groups containing oxygen.

2.4.6. FTIR Analysis

The Fourier-transform infrared spectroscopy (FTIR), used for the qualitative estimation of the functional groups on the sample surface, was carried out using a Spectrum Two FTIR spectrometer (Perkin Elmer, Shelton, CT, USA). For sample preparation, dried TGs, hydrochar, and AC samples were mixed with dried KBr, in a ratio of 1:450 and ground to fine powder. A pellet of nearly 170 mg was prepared and used to collect the spectra, ranging from 4000 to 400 cm−1. The spectra were obtained by overlapping 20 scans, using a resolution of 4 cm−1.

2.4.7. Morphological Analysis

Mira3 Tescan, (Libusina, Brno, Czech Republic) Field Emission Scanning Electron Microscope (FE-SEM) with an accelerating voltage of 3 kV was used for the morphological analysis of samples. The samples were sputter-coated with Au on an Al sample holder supported by conductive carbon tape prior to analysis.

2.4.8. Textural Analysis

The Quantachrome (Boynton Beach, FL, USA) NOVA II and Autosorb iQ surface area analyzers were used to obtain the different textural properties of the precursor, hydrochar, and ACs. The nitrogen adsorption–desorption isotherms were obtained at 77 K. Nitrogen is the model adsorbate used for this purpose, as it has a well-known effective molecular diameter (3.54 Å) and cross-sectional area (16.2 Å2). Prior to nitrogen adsorption–desorption analysis, the adsorbents were outgassed at 300 °C for 4 h. The BET method was used to evaluate the surface areas, whereas pore volumes and pore sizes of the materials were calculated using the BJH method. The total pore volumes were determined by the amount of nitrogen adsorbed at p/p0 values of 0.99.

3. Results

3.1. Proximate, Ultimate, and Yield Analysis

The proximate and ultimate analyses of TGs and hydrochars have been carried out and results are shown in Table 1. In hydrochars, the moisture content (M), volatile matter (VM), and ash content (A) decrease as the production temperature increases. On the other hand, the fixed carbon content (FC) increases with the temperature rise up to 230 °C. For higher temperatures, a slight decrease was observed. The reason for the above change may be attributed to polymerization reactions occurring during HTC of biomass [25].
The values of the atomic ratio for the TGs and hydrochar were plotted on the Van Krevelen diagram (Figure 3). The hydrochar developed at 230 °C for 4 h lies nearly in the bituminous coal range, whereas the other hydrochars prepared between 180 and 250 °C correspond to lignite. Thus, this shows that hydrochar prepared at 230 °C for 4 h is a promising precursor and it was used for AC production.
The ultimate analysis of TGs and hydrochars indicates that the carbon content (Table 1) increases upon hydrothermal carbonization. The carbon content increased by 3% (in the case of HC-180-1) in comparison to the TGs (48.47%), which further increased up to 60.11% for the HC prepared at 230 °C for 1 h. For higher temperatures, a slight decrease in the C content was observed. Therefore, the temperature of 230 °C was selected to evaluate the effect of residence time (1 to 4 h) on the produced hydrochars. For the HTC, with an increasing residence time from 1 to 4 h, the carbon content increased from 60.11 to 66.19%, and thereafter, a slight decrease was observed. A decreasing trend was also observed in the yield of HC as the temperature increased, which could be linked to the escape of volatile matter (Table 1).
The atomic ratios (H/C and O/C), TG samples, and hydrochars are presented in Table 1. The low H/C and O/C ratios for the optimized sample (HC-230-4) shows an increase in the degree of coalition compared to others [26].
The ultimate analysis of the activated carbons showed that the carbon content increased with temperature, reaching 83.93% for AC-850-7. However, due to a minor difference in carbon content (Table 2) between AC-850-7 and AC-850-5, the latter was selected as a representative sample. The AC-850-5(P) prepared through direct pyrolysis had a lower carbon content than AC-850-5. Furthermore, yield analysis of activated carbon production showed a decreasing trend with increasing temperature, data provided in Table 2.

3.2. Energy Properties of Hydrochars
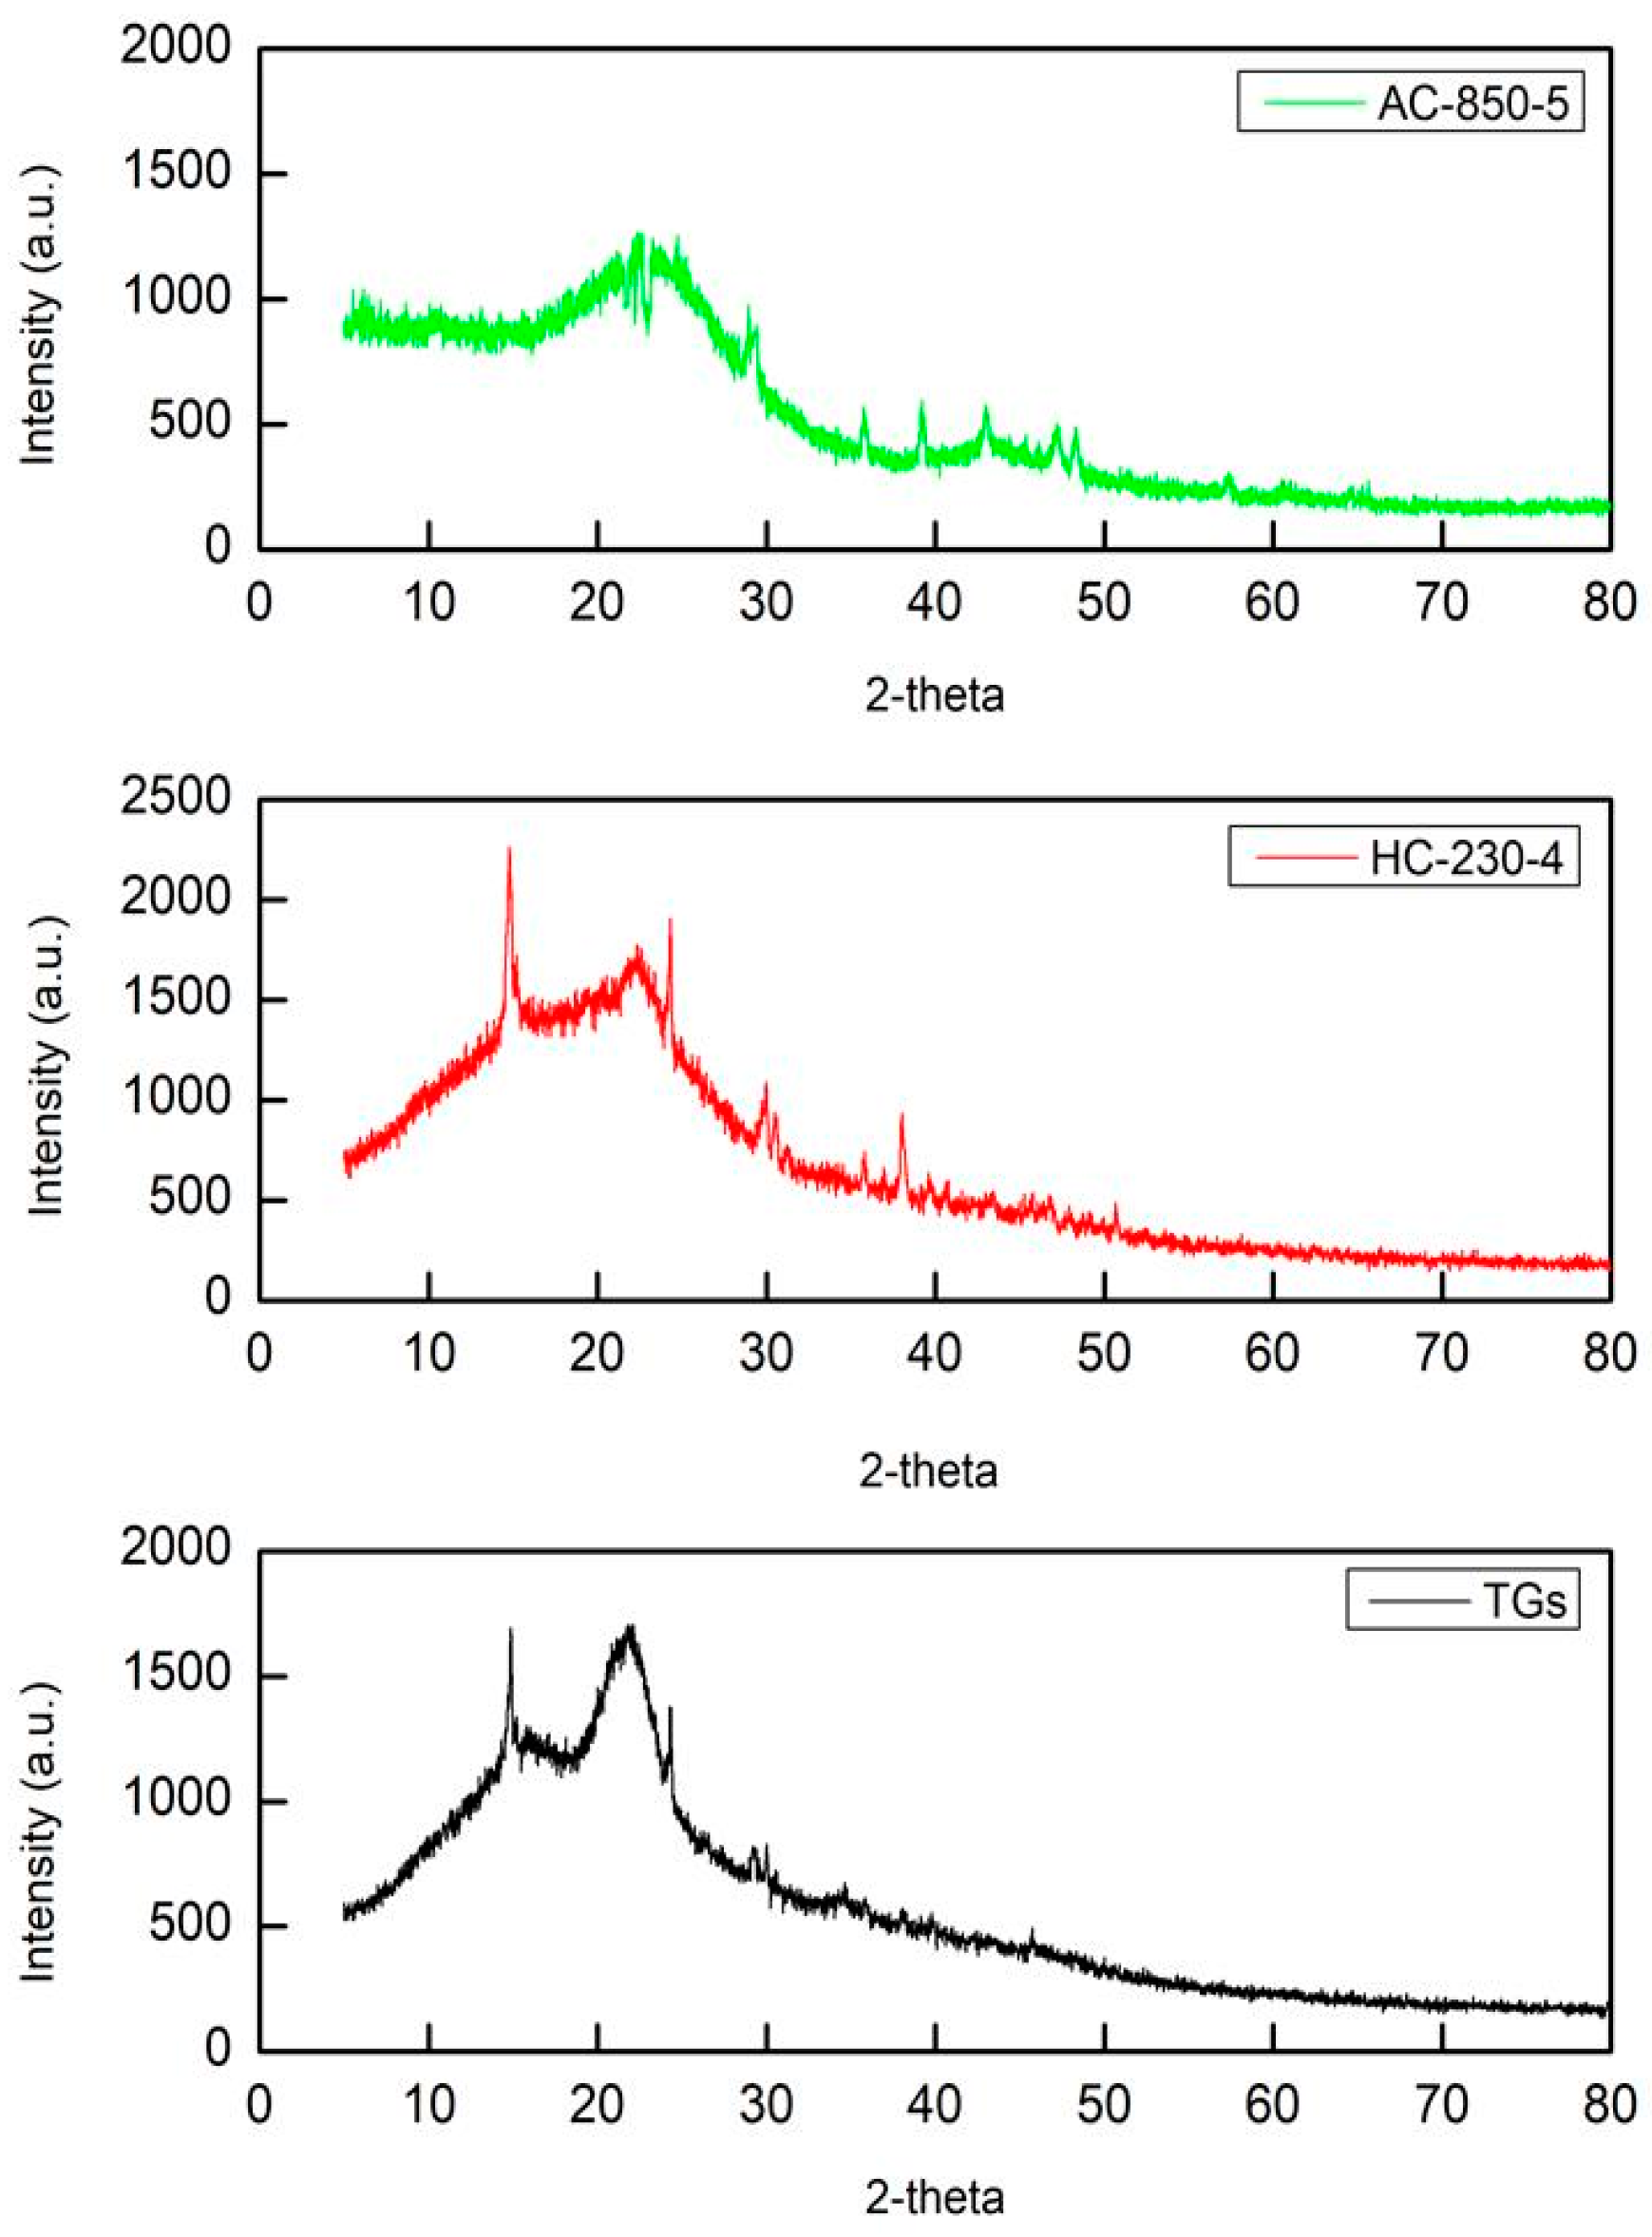
The energy characteristics of TGs and hydrochars, including higher heating value (HHV), fuel ratio, energy densification ratio, and energy yield, were assessed, and the results are presented in Table 1. The HHV for TGs is 20.39 MJ kg−1, which increased to 26.53 MJ kg−1 for the optimized hydrochar (HC-230-4). The HHV of HC-230-4 is comparable to the charcoal and bituminous coal values, which has an HHV of 28.7 MJ kg−1 [27]. The HHV for the other hydrochars (Table 1) is comparatively lower and falls within the range of lignite coal. Therefore, HC-230-4 could be considered a promising alternative to charcoal and bituminous coal for use as fuel, in the power sector.
The fuel ratio of TGs was 0.22, and it increased to 0.41 for HC-230-1, indicating an enhancement in the fuel properties of hydrochars with temperature through the HTC process. However, with an increase in residence time, the fuel ratio reached 0.48 and 0.5 for hydrochars prepared at 4 and 5 h, respectively. Due to the minor difference in the fuel ratio values, HC-230-4 was selected as the optimized hydrochar.
The energy densification ratio of the hydrochars increased with HTC temperature and residence time, ranging from 1.06 to 1.30, reaching a maximum for HC-230-4. These findings are consistent with those obtained from HC prepared from coconut shells and macroalgae [28,29]. Lastly, the energy yield, which measures the energy recoverable from the prepared hydrochars, decreased as the temperature increased (Table 1). This decrease in energy yield can be attributed to the decomposition of hemicellulose and cellulose at higher temperatures. Interestingly, it is notable that the energy yield exceeded the mass yield of the hydrochars at the same HTC temperature, demonstrating that the hydrochars possess a higher energy density.

3.3. XRD Analysis

Based on the best textural properties of hydrochars and activated carbons, such as higher apparent surface area, pore volume, and mean pore size, a representative sample was chosen to be submitted for a complete characterization. The structures of TGs, HC-230-4, and AC-850-5 were analyzed using X-ray diffraction (XRD), and the results are presented in Figure 4. As observed from Figure 4, TGs and HC-230-4 show almost similar diffraction patterns with two major peaks around 15° and 22° corresponding to the (101) and (002) lattice planes, which are characteristic peaks of cellulose [30]. A peak with low intensity near 40° in HC-230-4 may be attributed to the formation of some graphitic structures during HTC. Remarkably, HC-230-4 maintains the original morphology and structural elements of its precursor (TGs) despite undergoing the HTC process, which suggests that the HTC has not converted TGs into completely amorphous carbon.
The peaks at 15° and 22° become broader (Figure 4) with sample activation (AC-850-5) at high temperatures, which can be associated with the degradation and conversion of the cellulosic structure and the development of amorphous carbon material [31]. A further peak at approximately 40° indicates that AC-850-5 has a more ordered graphitic structure with smaller distance layers when compared to HC-230-4 and TGs [32].

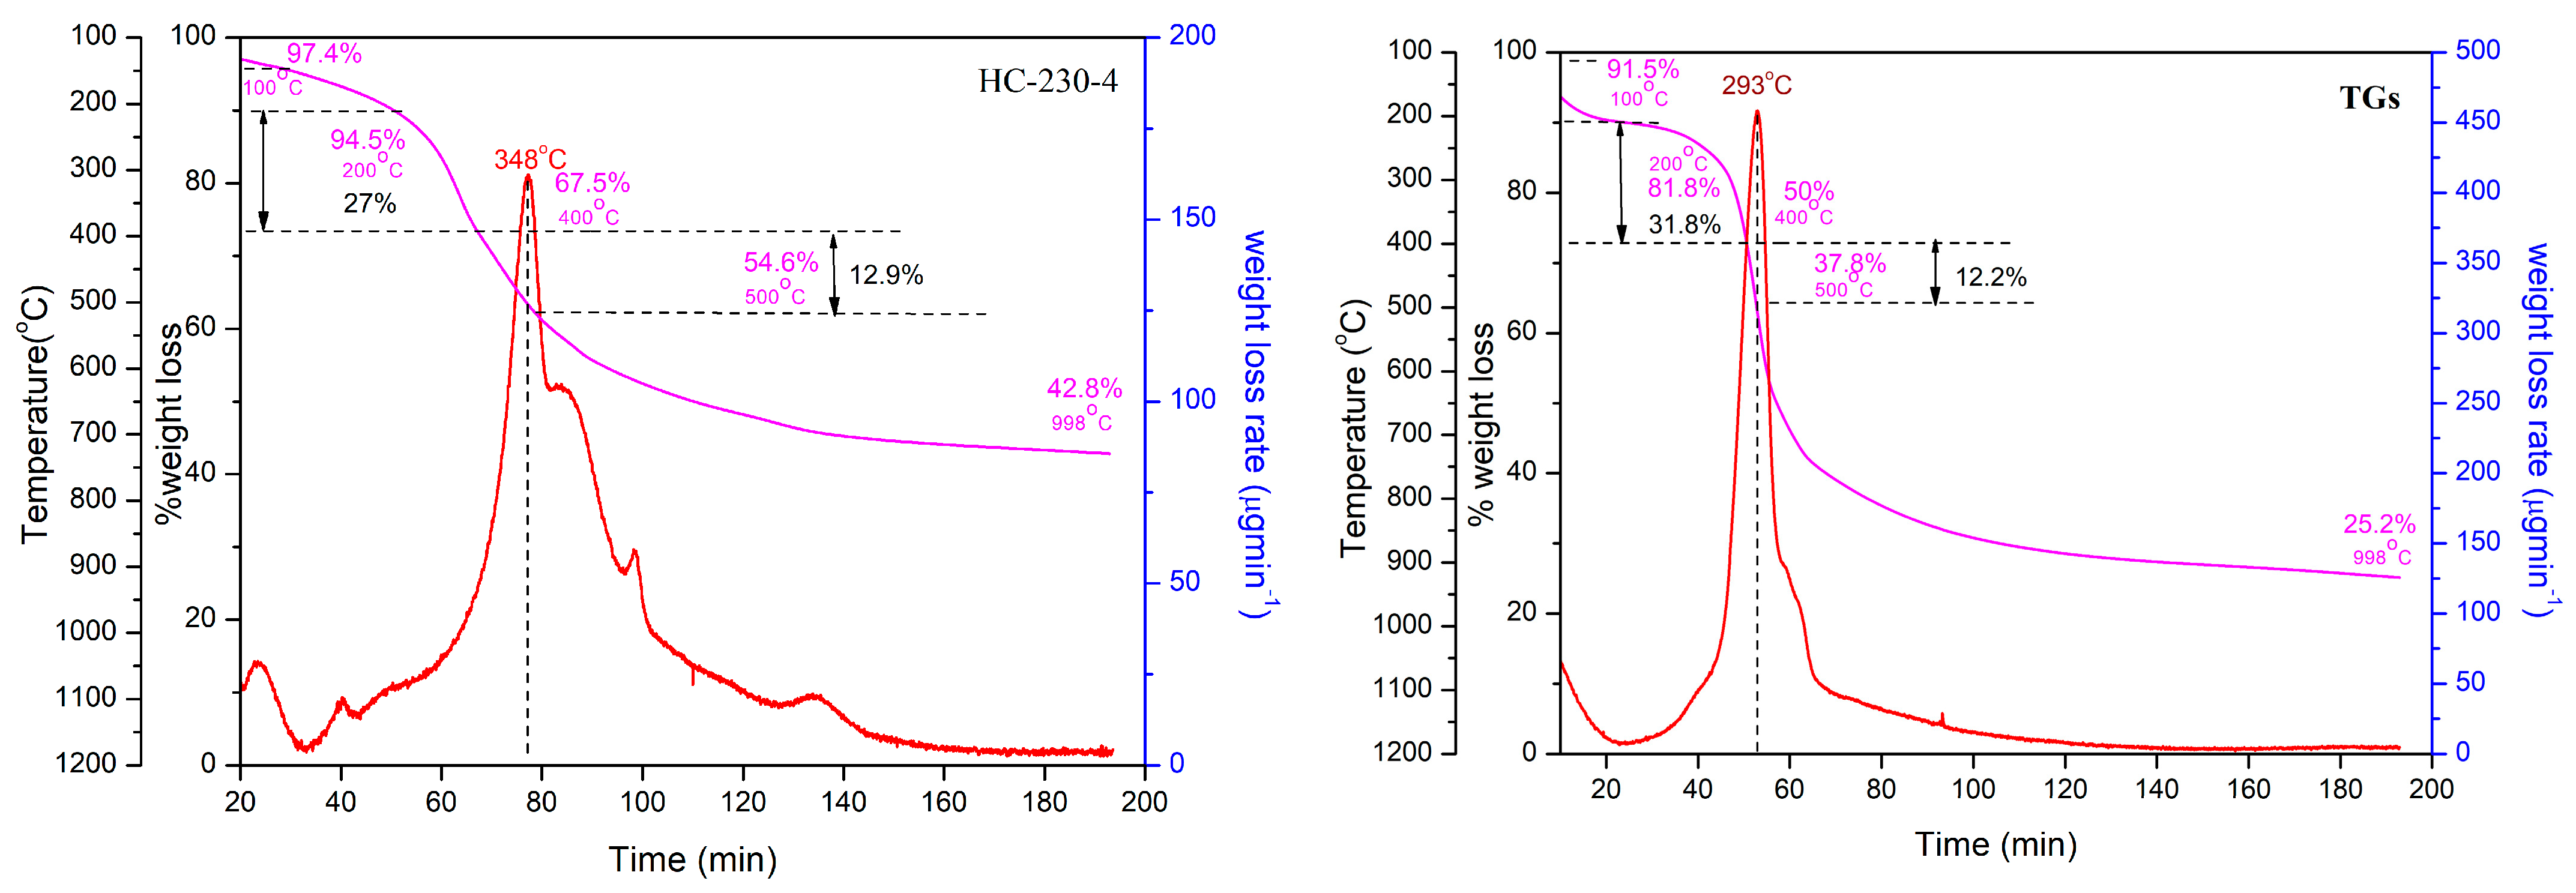
3.4. Thermogravimetric Analysis

The thermogravimetric (TG) degradation curves and the corresponding DTG curves for TGs and HC-230-4, obtained under N2 flow, are shown in Figure 5. Both curves show a three-stage trend for weight loss. For TGs, the sample weight initially decreases by 8.5% at around 100 °C, which may be associated with the escape of the residual moisture content. The low weight loss (2.6%) for the HC-230-4 in the initial stage, may be due to the development of a hydrophobic structure upon HTC and the loss of residual moisture content [33]. Both samples experience a sharp and major weight loss in the second stage, as described in the following two steps. In the first step, the TGs lose 31.8%, and HC-230-4 loses (27%) between 200 and 400 °C, which may be associated with the substantial release of volatiles (due to the decomposition of hemicellulose and cellulose). During this step, the weight loss for TGs was high compared to HC-230-4, which may be attributed to hemicellulose and cellulose degradation during hydrochar production, with stable structures [34,35]. A weight loss of 12.2 and 12.9% for raw TGs and HC-230-4, due to the oxidation of char, was observed between 400 and 500 °C. The third stage, which starts after 500 °C, is related to the degradation of lignin (175–800 °C) and the development of carbon structures [36]. Upon further increasing the temperature up to 1000 °C, a low weight loss was observed, with a remaining weight of 25.2 and 42% for TGs and HC-230-4, respectively. This finding supports the fact that the thermal stability of the sample was improved with HTC [33]. Another reason for the increase in the degradation temperature of HC-230-4 may be attributed to the structural changes in the cellulosic network during HTC, which forms aromatic compounds [33].
The positions of the peaks in the DTG curves (Figure 5) were used to determine the temperatures at which the maximum weight losses occurred. The sharp degradation peaks of raw TGs and HC-230-4 were observed at approximately 293 and 348 °C, respectively.

3.5. Point of Zero Charge and Oxygen Containing Functional Groups Determination

The pH at the point of zero charge (pHpzc) determines the charge present on the surface of the materials in different pH solutions. The pHpzc of TGs, HC-230-4, and activated carbon (AC-850-5) was investigated and found to be 4.2, 4.3, and 6.2, respectively, as presented in Table 3. The parameter indicates that, if solutions have a pH > pHpzc then a negative charge predominates on the sample surface and conversely positive charge dominates if solutions have a pH< pHpzc. Therefore, for pH < pHpzc, the surface of the prepared materials favors the adsorption of negatively charged pollutants, whereas it favors the adsorption of positively charged adsorbate through electrostatic attraction at pH > pHpzc.
The basic and acidic/oxygen-containing functional groups (OFGs) present on the surface of a sample are critically important to determine, as they behave as the ion-exchange sites on the hydrochar’s surface for different environmental applications [37]. To investigate the presence and quantity of these groups, Boehm’s titration was used, and the findings are presented in Table 3.
The results show that the hydrochar (HC-230-4) had a remarkably higher amount of acidic groups/OFGs compared to TGs, with a value of 1.32 mmol g−1 versus 0.32 mmol g−1, respectively. The basic groups decreased during the HTC of the TGs, indicating that in the HCs, the acidic characteristics predominate.
Furthermore, the AC-850-5, which was activated at a higher temperature under a CO2 flow, had a lower amount of acidic groups/OFGs (0.432 mmol g−1) compared to HC-230-4. Remarkably, among the acidic functional groups, carboxylic groups predominated, followed by lactonic and phenolic groups for both HC-230-4 and TGs. Comparatively, AC-850-5 had a lower amount of carboxylic (0.317 mmol g−1) and phenolic groups (0.115 mmol g−1), whereas lactonic groups were nearly absent. Interestingly, the total basic groups slightly increased on the AC-850-5 compared to the HC-230-4, which agreed well with the pHpzc analysis. On the basis of the above-mentioned findings, it can be inferred that the amount of OFGs significantly increased on HTC. Similar behavior was also observed by other researchers for biomass samples, in which the OFGs enhanced on HTC [37,38].

3.6. Fourier Transform Infrared Spectroscopic (FTIR) Analysis

The TGs, HC-230-4, and AC-850-5 were analyzed by the FTIR to investigate the surface chemistry and the changes in functional groups upon hydrothermal carbonization and activation. The spectra of the materials are shown in Figure 6, and the major assignments of the bands are presented in Table 4.
The spectrum of TGs and HC-230-4 shows that the bands associated with the OFGs increased with hydrothermal carbonization. Notably, these findings are consistent with the results of Boehm’s method. Furthermore, a broad band observed in the region around 3400 cm−1 could be associated with the vibrations of -OH in hydroxyl groups for TGs and HC-230-4 [39]. C-H stretching vibrations indicating the presence of aliphatic structures in TGs and HC-230-4 were observed at 2927 and 2905 cm−1 [40]. The spectra of TGs show peaks at 1716, 1631, 1511, 1403, 1330, and 1255 cm−1 corresponding to lactonic, carboxylic, ketones, aromatic ring skeleton, and ester groups [36,41]. Interestingly, the peaks in the region of 1700-1200 cm−1 increased after HTC (of TGs), strengthening the fact of an increase in OFGs on hydrothermal carbonization. The signals detected at 1048 cm−1 for TGs and 1058 cm−1 for HC-230-4 can be associated with C-O-C groups, corresponding to polysaccharide character [42]. C-H bending vibrations were observed at 606 and 548 cm−1 for TGs and HC-230-4, respectively. Some characteristic peaks are shown in Table 4.
A significant decrease in functional groups post-activation of hydrochar was noted, as shown in Figure 6. The C-H stretching bands corresponding to 2905 cm−1 observed in hydrochar were weakened in AC-850-5, indicating a decrease in aliphatic groups in activated carbon. Additionally, the peak for the hydroxyl groups (3500–3400 cm−1) was weakened too. The peak in the region for lactonic groups (~1700 cm−1) disappeared, whereas the carboxylic group’s peak, with weak intensity, was observed around 1622 cm−1. Remarkably, these findings are also in accordance with the results of Boehm’s method. Moreover, the peaks at 1384 and 1115 cm−1, which are related to the aromaticity and have a resemblance with the HC-230-4 and TGs, were present with weak intensity in the spectra of AC-850-5.

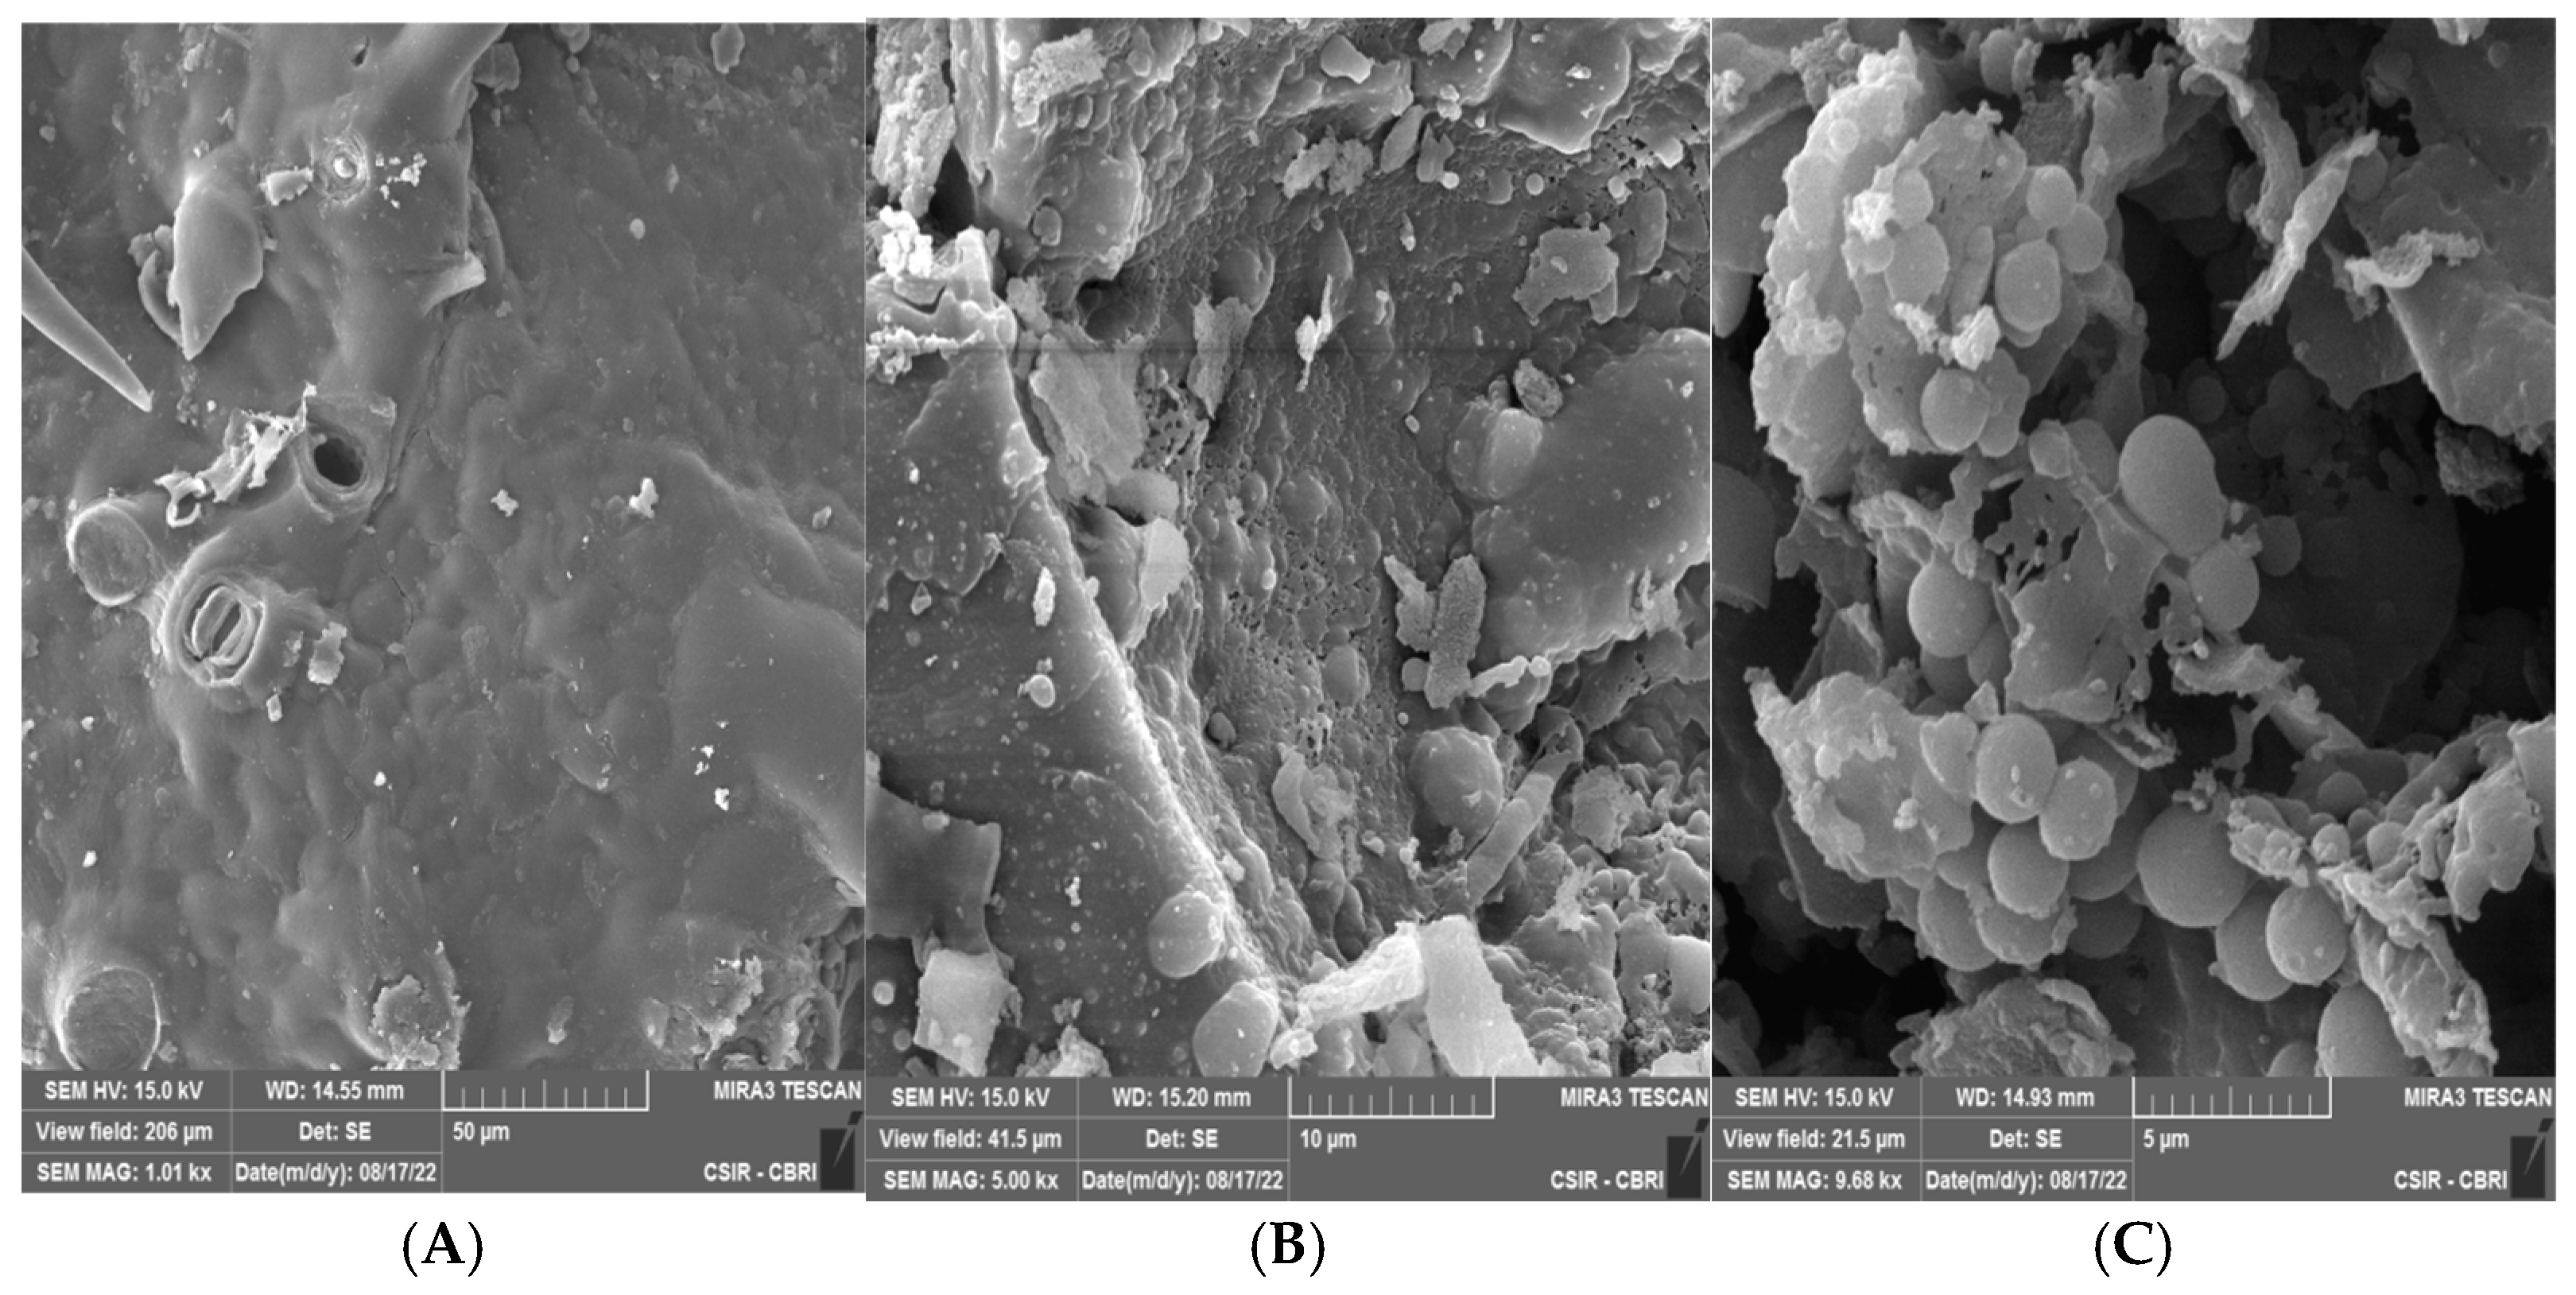
3.7. Morphological Analysis

The FE-SEM images of TGs, HC-230-4, and AC-5 were obtained and are presented in Figure 5. A comprehensible difference was observed in the morphology of the TGs and HC-230-4 (Figure 7A,B). The raw precursor (TGs) shows a smooth surface; however, after the HTC, some spherical structures were observed on the HC-230-4 surface, owing to the decomposition of cellulose, hemicellulose, and lignin [40].
Interestingly, these spherical shapes formed by the micro-particles after HTC may result in the hydrophobic nature and enhanced surface area of the sample [43]. Figure 7C reveals that the spherical shape of the hydrochar remained intact after activation. Nevertheless, following the activation of HC-230-4 in CO2, more extensive agglomerated microspheres were formed, possibly due to the use of a higher activation temperature [44].

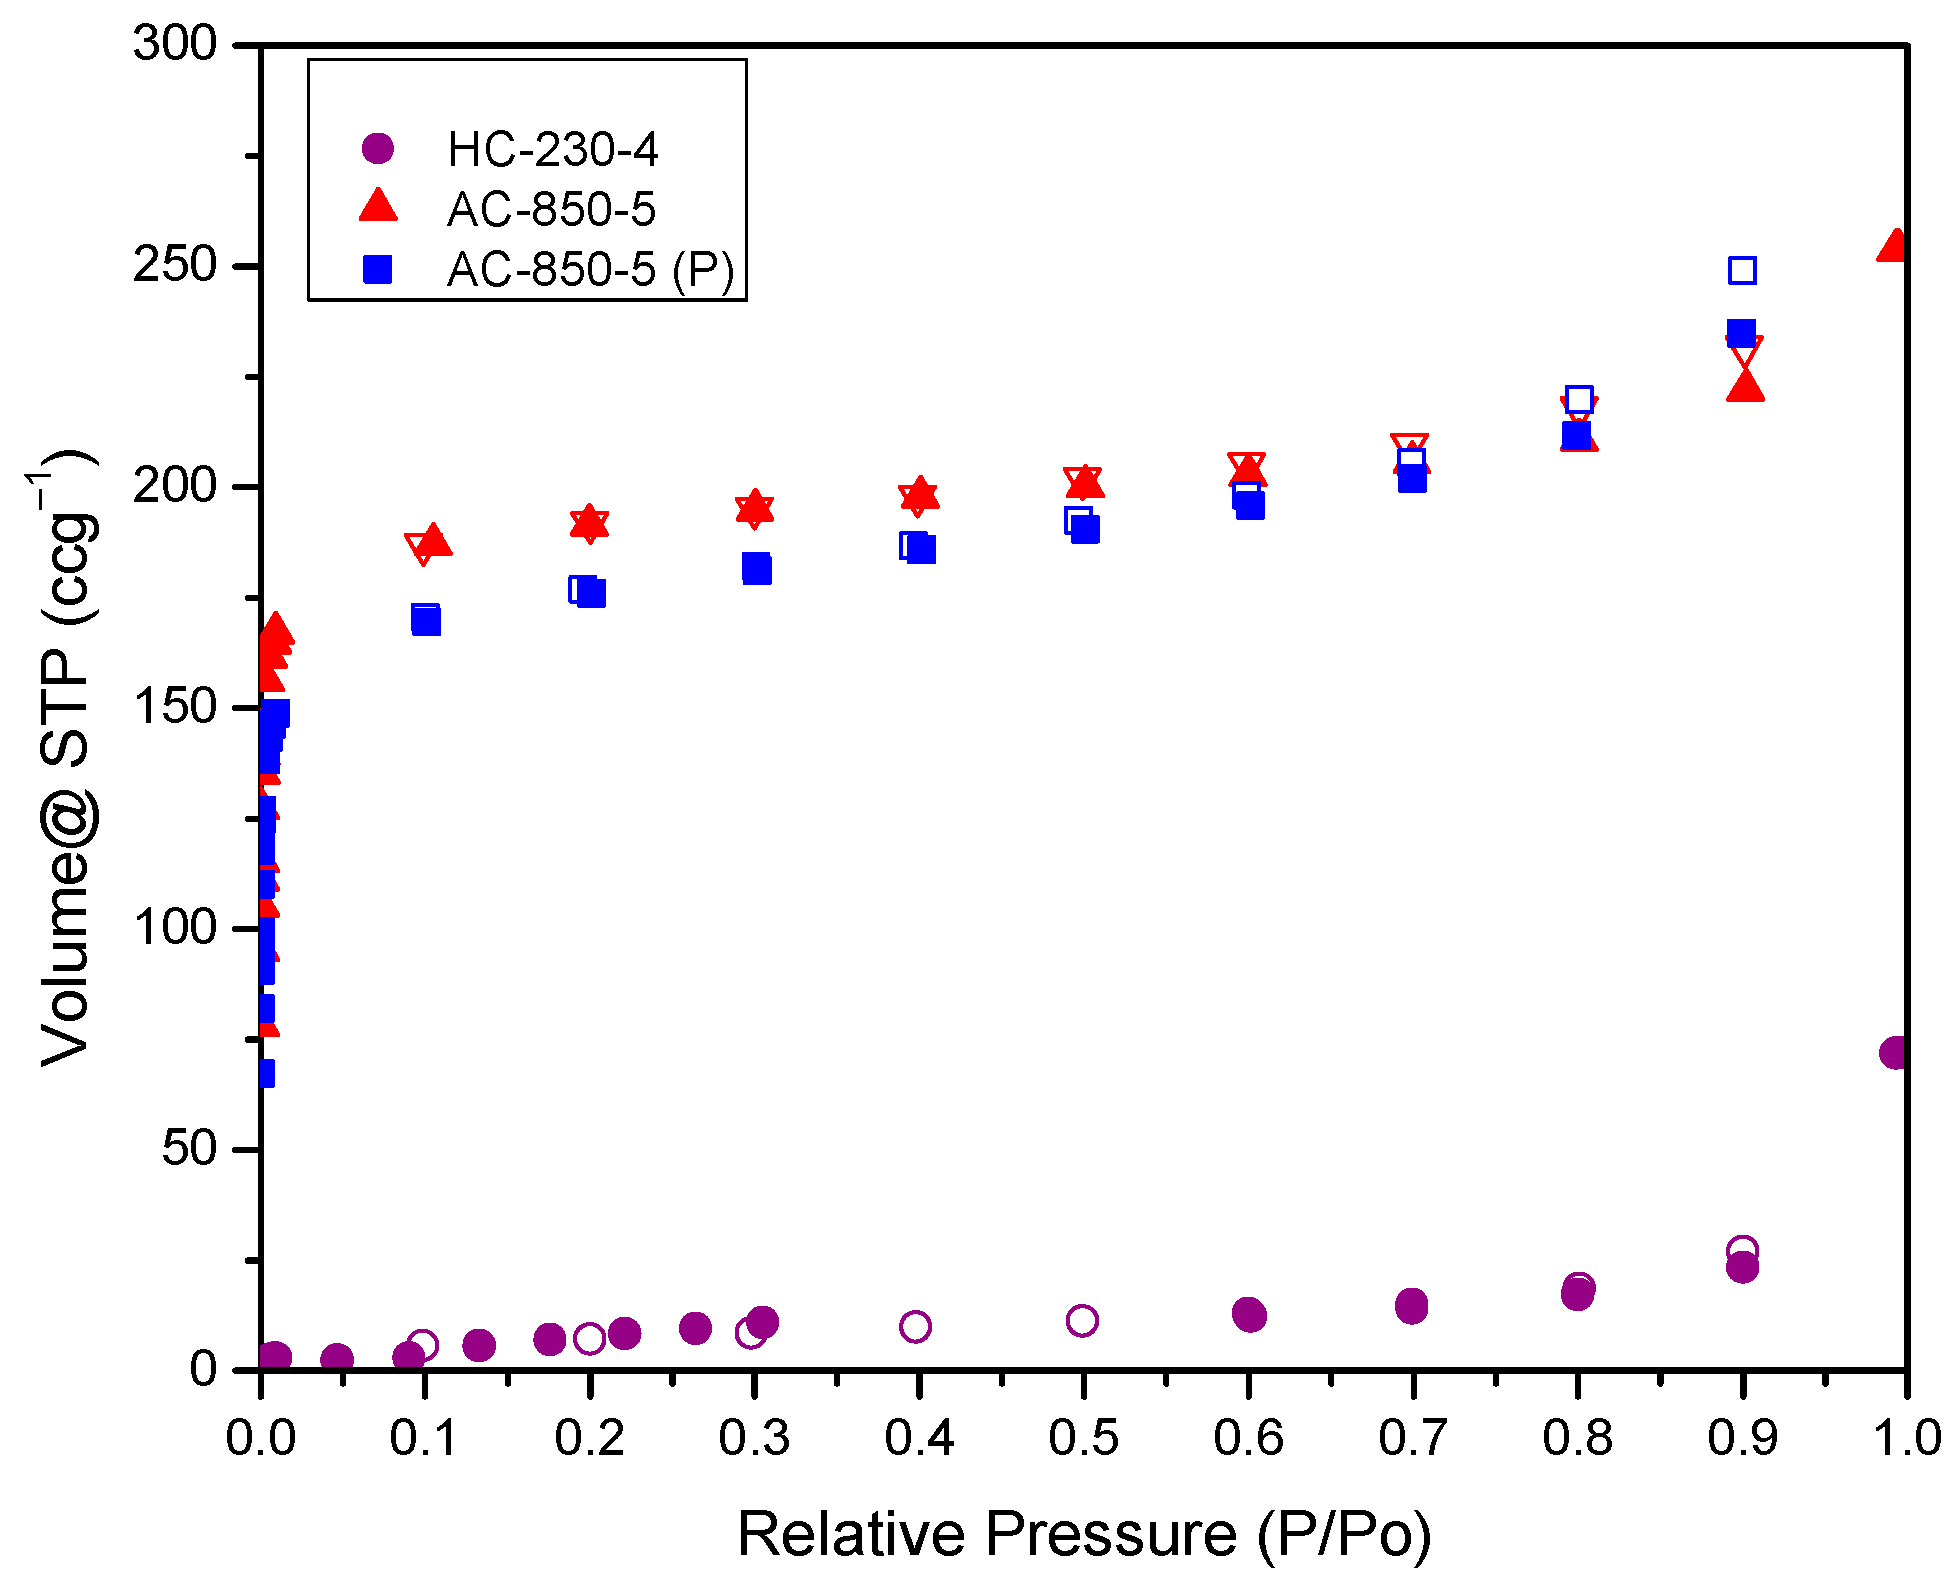
3.8. Textural Analysis

The adsorption–desorption isotherms analyses were carried out at 77 K, with nitrogen gas (effective molecular diameter- 3.54 Å; cross-sectional area: 16.2 Å2) used as the adsorbate. The samples were outgassed at 300 °C for 4 h prior to the analysis. The N2 adsorption–desorption isotherms, for the HC-230-4, AC-850-5, and AC-850-5(P) samples, are shown in Figure 8, and the textural parameters are shown in Table 5. BET analysis was performed to evaluate the surface area and other textural parameters of the prepared samples are included in Table 1, Table 2 and Table 5.
TGs showed low surface area (3.6 m2g−1); hence, complete isotherms are not presented here. The low surface area observed for TGs (biomass) is consistent with previous findings [45,46]. On the other hand, the surface area increased on HTC, and the best value (14.41 m2g−1) was achieved on HC-230-4. Similar reports are also available in the literature for the hydrochars obtained from various biomass materials [47,48,49]. Keeping in view, the above findings and discussions made in previous paragraphs, the optimized sample HC-230-4 was selected for further preparation of ACs. ACs prepared from HC-230-4 under varying conditions were also subjected to surface area analysis, and the results are shown in Table 2.
The influence of temperature and activation time on surface area development was studied by submitting the precursors to physical activation between 750 and 950 °C. As observed from Table 2, the surface area increased up to 850 °C, and decreased thereafter, which may be associated with the shrinkage of carbon structures and collapsing of pores at temperatures above 850 °C. The impact of activation time (1 to 7 h) on surface area was also studied, and the sample prepared at 5 h (AC-850-5) exhibited the highest surface area (729.70 m2g−1) and microporosity (0.286 cm3g−1). Therefore, AC-850-5 was subjected to a detailed analysis of complete N2 adsorption–desorption isotherm, which corresponds to the type I with slight hysteresis, indicating wider micropores (Figure 8). Pore size and pore volume for AC-850-5 were calculated using the BJH method and demonstrated that the sample has most of the pores in the microporous range with a small amount of mesopores. This behavior is in agreement with the fact that when CO2 is used as an activating agent, it promotes a widening of the pores [50]. As shown in Table 5, the total pore volume and micropore volume of AC-850-5 are 0.392 and 0.286 cm3g−1, respectively, with a pore diameter of 2.15 nm.
To observe the effect of hydrothermal carbonization on the textural characteristics of ACs, an activated carbon developed by direct activation (pyrolysis) of TGs (biomass) at the optimized conditions (850 °C, 5 h, CO2) was prepared and subjected to nitrogen adsorption, as presented in Figure 7 and the data in Table 5. A decrease in the surface area (664.52 m2g−1) and an increase in the total pore volume (0.505 cm3g−1) and mean pore size (3.6 nm) were observed, indicating that HTC is beneficial for the development mainly of microporous ACs. Additionally, the utilization of a lower temperature (230 °C) during HTC is also beneficial compared to pyrolysis (600 °C), making it an energy-efficient and sustainable process. Furthermore, in HTC the energy-intensive pre-drying step of the precursor is not required as in pyrolysis, showing that HTC is an energy-efficient process [51]. A comparison of the developed HC-230-4 and AC-850-5 in terms of preparation conditions and surface areas with other similar materials, reported in the literature, is provided in Table 6 and Table 7, respectively.

4. Conclusions

This research has proven that it is beneficial to produce, mainly microporous ACs, AC-850-5, with a high surface area (729 m2g−1), from a sustainable biomass source, waste Tectona grandis seeds, using a hydrothermal carbonization process followed by CO2 activation. The study revealed that hydrothermal carbonization increased the carbon content while decreasing the mass yield. HC-230-4, among the hydrochars, exhibited a high heating value (26.53 MJ kg−1), which is comparable to bituminous coal. Moreover, the hydrochars displayed higher energy yields compared to their mass yields at the same HTC temperature, indicating superior energy density. It is thus concluded that HC-230-4 could be considered a promising alternative for bituminous coal, for use as fuel, in the power sector. Furthermore, the approach can be more sustainable with the use of biomass waste from agricultural or industrial activities, which are else decomposed in the open, burned, or sent to landfills. Structural analysis indicated an increase in functional groups after HTC and their subsequent decrease upon further activation. The activated carbon retained a spherical microstructure with enhanced spherical shapes post-activation. The high carbon content and high thermal stability of hydrochar suggest its potential as a precursor for AC development, surpassing biomass sources. This research highlights the viability of hydrothermal carbonization in producing hydrochar and high-quality activated carbon. Additionally, the conversion of Tectona grandis seeds into ACs meets the principles of the circular economy, supporting waste management and valuing practices. The excellent properties of the ACs produced indicate that they can be successfully used for water remediation, namely pollutants, dyes, pesticides, and pharmaceuticals, directly contributing to environmental protection and pollution control. The ACs produced are also promising candidates for energy storage applications, thereby helping generate environmentally friendly energy storage technologies. However, further research is needed to fully explore hydrochar properties and behavior in different environments. The findings of this study pave the way for the development of efficient methods for AC production, contributing to a more circular and environmentally friendly economy.

Author Contributions

S.: Conceptualization; Funding Acquisition; Investigation; Resources; Supervision; Writing—Original Draft; and Writing—Review and Editing. M.C.: Formal Analysis; Visualization; and Writing—Review and Editing. S.C. (Shubham Chaudhary): Formal Analysis; Investigation; Methodology; Writing—Original Draft; and Writing—Review and Editing. S.C. (Shivangi Chaubey): Visualisation; and Writing—Review and Editing. I.P.d.P.C.: Visualization, Writing—Review and Editing; M.H.D.: Software; and Writing—Review and Editing. I.T.: Software; and Writing—Review and Editing. R.G.: Formal Analysis; and Writing—Review and Editing. All authors have read and agreed to the published version of the manuscript.

Funding

This research was funded by DST, New Delhi, India, under the Water Technology Initiative (Project No: DST/TMD/EWO/WTI/2K19/EWFH/2019/90).

Data Availability Statement

Data will be made available on request.

Acknowledgments

The authors would like to acknowledge the financial support provided by DST, New Delhi, India, under the Water Technology Initiative (Project No: DST/TMD/EWO/WTI/2K19/EWFH/2019/90).

Conflicts of Interest

The authors declare no conflicts of interest.

References

  1. Hassan, M.F.; Sabri, M.A.; Fazal, H.; Hafeez, A.; Shezad, N.; Hussain, M. Recent trends in activated carbon fibers production from various precursors and applications—A comparative review. J. Anal. Appl. Pyrolysis 2020, 145, 104715. [Google Scholar] [CrossRef]
  2. Suhas; Gupta, V.K.; Singh, L.P.; Chaudhary, M.; Kushwaha, S. A novel approach to develop activated carbon by an ingenious hydrothermal treatment methodology using Phyllanthus emblica fruit stone. J. Clean. Prod. 2021, 288, 125643. [Google Scholar] [CrossRef]
  3. Diaz, E.; Manzano, F.J.; Villamil, J.; Rodriguez, J.J.; Mohedano, F.A. Low-Cost Activated Grape Seed-Derived Hydrochar through Hydrothermal Carbonization and Chemical Activation for Sulfamethoxazole Adsorption. Appl. Sci. 2019, 9, 5127. [Google Scholar] [CrossRef]
  4. Mbarki, F.; Selmi, T.; Kesraoui, A.; Seffen, M. Low-cost activated carbon preparation from Corn stigmata fibers chemically activated using H3PO4, ZnCl2 and KOH: Study of methylene blue adsorption, stochastic isotherm and fractal kinetic. Ind. Crops Prod. 2022, 178, 114546. [Google Scholar] [CrossRef]
  5. Cansado, I.P.P.; Geraldo, P.F.; Mourão, P.A.M.; Castanheiro, J.E.; Carreiro, E.P.; Suhas. Utilization of Biomass Waste at Water Treatment. Resources 2024, 13, 37–52. [Google Scholar] [CrossRef]
  6. Cansado, I.P.P.; Belo, C.R.; Mourão, P.A.M. Valorisation of Tectona Grandis tree sawdust through the production of high activated carbon for environment applications. Bioresour. Technol. 2018, 249, 328–333. [Google Scholar] [CrossRef]
  7. Gunaga, R.P. Status of fruit yield in seed production areas of teak (Tectona grandis Linn.) in India: Implications for management. Teaknet Bull 2011, 4, 1–9. [Google Scholar]
  8. Hanna Fathima, A.C.; Adithya, D.; George, N. Exploring Tectona grandis: Phytochemicals, medicinal value, and green innovations: A review article. J. Pharmacogn. Phytochem. 2024, 13, 102–111. [Google Scholar] [CrossRef]
  9. Palanisamy, K.; Hegde, M.; Yi, J.-S. Teak (Tectona grandis Linn. f.): A renowned commercial timber species. J. For. Environ. Sci. 2009, 25, 1–24. [Google Scholar]
  10. Jain, A.; Balasubramanian, R.; Srinivasan, M.P. Hydrothermal conversion of biomass waste to activated carbon with high porosity: A review. Chem. Eng. J. 2016, 283, 789–805. [Google Scholar] [CrossRef]
  11. Isemin, R.; Melezhyk, A.; Kuzmin, S.; Nebyvayev, A.; Muratova, N.; Mikhalev, A.; Milovanov, O.; Teplitskii, Y.; Buchilko, E.; Pitsukha, E. Production of Activated Carbon from Biochar Obtained by Wet Torrefaction of Chicken Manure as Sole Feedstock, and in Mixture with Sawdust in a Fluidized Bed Powered with Superheated Steam. Chem. Eng. Trans. 2021, 86, 1519–1524. [Google Scholar]
  12. Maneerung, T.; Liew, J.; Dai, Y.; Kawi, S.; Chong, C.; Wang, C.-H. Activated carbon derived from carbon residue from biomass gasification and its application for dye adsorption: Kinetics, isotherms and thermodynamic studies. Bioresour. Technol. 2016, 200, 350–359. [Google Scholar] [CrossRef]
  13. Smith, A.M.; Singh, S.; Ross, A.B. Fate of inorganic material during hydrothermal carbonisation of biomass: Influence of feedstock on combustion behaviour of hydrochar. Fuel 2016, 169, 135–145. [Google Scholar] [CrossRef]
  14. Sevilla, M.; Maciá-Agulló, J.A.; Fuertes, A.B. Hydrothermal carbonization of biomass as a route for the sequestration of CO2: Chemical and structural properties of the carbonized products. Biomass Bioenergy 2011, 35, 3152–3159. [Google Scholar] [CrossRef]
  15. Masoumi, S.; Dalai, A.K. Optimized production and characterization of highly porous activated carbon from algal-derived hydrochar. J. Clean. Prod. 2020, 263, 121427. [Google Scholar] [CrossRef]
  16. Kambo, H.S.; Dutta, A. A comparative review of biochar and hydrochar in terms of production, physico-chemical properties and applications. Renew. Sustain. Energy Rev. 2015, 45, 359–378. [Google Scholar] [CrossRef]
  17. Funke, A.; Ziegler, F. Hydrothermal carbonization of biomass: A summary and discussion of chemical mechanisms for process engineering. Biofuels Bioprod. Biorefin. 2010, 4, 160–177. [Google Scholar] [CrossRef]
  18. Kruse, A.; Funke, A.; Titirici, M.-M. Hydrothermal conversion of biomass to fuels and energetic materials. Curr. Opin. Chem. Biol. 2013, 17, 515–521. [Google Scholar] [CrossRef]
  19. Reza, M.T.; Andert, J.; Herklotz, B.; Busch, D.; Pielert, J.; Lynam, J.; Mumme, J. Review Article: Hydrothermal Carbonization of Biomass for Energy and Crop Production. Appl. Bioenergy 2014, 1, 11–29. [Google Scholar] [CrossRef]
  20. Channiwala, S.A.; Parikh, P.P. A unified correlation for estimating HHV of solid, liquid and gaseous fuels. Fuel 2002, 81, 1051–1063. [Google Scholar] [CrossRef]
  21. Sharma, H.B.; Panigrahi, S.; Dubey, B.K. Hydrothermal carbonization of yard waste for solid bio-fuel production: Study on combustion kinetic, energy properties, grindability and flowability of hydrochar. Waste Manag. 2019, 91, 108–119. [Google Scholar] [CrossRef] [PubMed]
  22. Carrott, P.J.M.; Carrott, M.M.L.R.; Vale, T.S.C.; Marques, L.; Nabais, J.M.V.; Mourão, P.A.M.; Suhas, P.A.M. Characterisation of Surface Ionisation and Adsorption of Phenol and 4-Nitrophenol on Non-Porous Carbon Blacks. Adsorpt. Sci. Technol. 2008, 26, 827–841. [Google Scholar] [CrossRef]
  23. Boehm, H.-P. Surface Chemical Characterization of Carbons from Adsorption Studies. In Adsorption by Carbons; Eduardo, J., Bottani, J.M.D.T., Eds.; Elsevier: Amsterdam, The Netherlands, 2008; pp. 301–327. [Google Scholar]
  24. Boehm, H.P. Chemical Identification of Surface Groups. In Advances in Catalysis; Eley, D.D., Pines, H., Weisz, P.B., Eds.; Academic Press: Cambridge, MA, USA, 1966; Volume 16, pp. 179–274. [Google Scholar]
  25. Lin, Y.; Ma, X.; Peng, X.; Yu, Z. A Mechanism Study on Hydrothermal Carbonization of Waste Textile. Energy Fuels 2016, 30, 7746–7754. [Google Scholar] [CrossRef]
  26. Saetea, P.; Tippayawong, N. Recovery of Value-Added Products from Hydrothermal Carbonization of Sewage Sludge. ISRN Chem. Eng. 2013, 2013, 268947. [Google Scholar] [CrossRef]
  27. Park, S.-W.; Jang, C.-H. Characteristics of carbonized sludge for co-combustion in pulverized coal power plants. Waste Manag. 2011, 31, 523–529. [Google Scholar] [CrossRef]
  28. Elaigwu, S.E.; Greenway, G.M. Characterization of Energy-Rich Hydrochars from Microwave-Assisted Hydrothermal Carbonization of Coconut Shell. Waste Biomass Valorization 2019, 10, 1979–1987. [Google Scholar] [CrossRef]
  29. Xu, Q.; Qian, Q.; Quek, A.; Ai, N.; Zeng, G.; Wang, J. Hydrothermal Carbonization of Macroalgae and the Effects of Experimental Parameters on the Properties of Hydrochars. ACS Sustain. Chem. Eng. 2013, 1, 1092–1101. [Google Scholar] [CrossRef]
  30. Zhang, L.; Wang, Q.; Wang, B.; Yang, G.; Lucia, L.A.; Chen, J. Hydrothermal Carbonization of Corncob Residues for Hydrochar Production. Energy Fuels 2015, 29, 872–876. [Google Scholar] [CrossRef]
  31. Guo, S.; Dong, X.; Wu, T.; Shi, F.; Zhu, C. Characteristic evolution of hydrochar from hydrothermal carbonization of corn stalk. J. Anal. Appl. Pyrolysis 2015, 116, 1–9. [Google Scholar] [CrossRef]
  32. Hou, Y.; Huang, G.; Li, J.; Yang, Q.; Huang, S.; Cai, J. Hydrothermal conversion of bamboo shoot shell to biochar: Preliminary studies of adsorption equilibrium and kinetics for rhodamine B removal. J. Anal. Appl. Pyrolysis 2019, 143, 104694. [Google Scholar] [CrossRef]
  33. Huang, G.-g.; Liu, Y.-f.; Wu, X.-x.; Cai, J.-j. Activated carbons prepared by the KOH activation of a hydrochar from garlic peel and their CO2 adsorption performance. New Carbon Mater. 2019, 34, 247–257. [Google Scholar] [CrossRef]
  34. Nizamuddin, S.; Jayakumar, N.S.; Sahu, J.N.; Ganesan, P.; Bhutto, A.W.; Mubarak, N.M. Hydrothermal carbonization of oil palm shell. Korean J. Chem. Eng. 2015, 32, 1789–1797. [Google Scholar] [CrossRef]
  35. Zhang, X.; Xiang, W.; Wang, B.; Fang, J.; Zou, W.; He, F.; Li, Y.; Tsang, D.C.W.; Ok, Y.S.; Gao, B. Adsorption of acetone and cyclohexane onto CO2 activated hydrochars. Chemosphere 2020, 245, 125664. [Google Scholar] [CrossRef]
  36. Álvarez-Murillo, A.; Román, S.; Ledesma, B.; Sabio, E. Study of variables in energy densification of olive stone by hydrothermal carbonization. J. Anal. Appl. Pyrolysis 2015, 113, 307–314. [Google Scholar] [CrossRef]
  37. Saha, N.; Saba, A.; Reza, M.T. Effect of hydrothermal carbonization temperature on pH, dissociation constants, and acidic functional groups on hydrochar from cellulose and wood. J. Anal. Appl. Pyrolysis 2019, 137, 138–145. [Google Scholar] [CrossRef]
  38. Sun, K.; Tang, J.; Gong, Y.; Zhang, H. Characterization of potassium hydroxide (KOH) modified hydrochars from different feedstocks for enhanced removal of heavy metals from water. Environ. Sci. Pollut. Res. 2015, 22, 16640–16651. [Google Scholar] [CrossRef] [PubMed]
  39. Kang, S.; Li, X.; Fan, J.; Chang, J. Characterization of Hydrochars Produced by Hydrothermal Carbonization of Lignin, Cellulose, d-Xylose, and Wood Meal. Ind. Eng. Chem. Res. 2012, 51, 9023–9031. [Google Scholar] [CrossRef]
  40. Sevilla, M.; Fuertes, A.B. The production of carbon materials by hydrothermal carbonization of cellulose. Carbon 2009, 47, 2281–2289. [Google Scholar] [CrossRef]
  41. He, C.; Giannis, A.; Wang, J.-Y. Conversion of sewage sludge to clean solid fuel using hydrothermal carbonization: Hydrochar fuel characteristics and combustion behavior. Appl. Energy 2013, 111, 257–266. [Google Scholar] [CrossRef]
  42. Borel, L.D.M.S.; Lira, T.S.; Ribeiro, J.A.; Ataíde, C.H.; Barrozo, M.A.S. Pyrolysis of brewer’s spent grain: Kinetic study and products identification. Ind. Crops Prod. 2018, 121, 388–395. [Google Scholar] [CrossRef]
  43. Fernandez, M.E.; Ledesma, B.; Román, S.; Bonelli, P.R.; Cukierman, A.L. Development and characterization of activated hydrochars from orange peels as potential adsorbents for emerging organic contaminants. Bioresour. Technol. 2015, 183, 221–228. [Google Scholar] [CrossRef] [PubMed]
  44. de Andrade, R.C.; Menezes, R.S.G.; Fiuza-Jr, R.A.; Andrade, H.M.C. Activated carbon microspheres derived from hydrothermally treated mango seed shells for acetone vapor removal. Carbon Lett. 2021, 31, 779–793. [Google Scholar] [CrossRef]
  45. Danso-Boateng, E.; Ross, A.B.; Mariner, T.; Hammerton, J.; Fitzsimmons, M. Hydrochars produced by hydrothermal carbonisation of seaweed, coconut shell and oak: Effect of processing temperature on physicochemical adsorbent characteristics. SN Appl. Sci. 2022, 4, 203. [Google Scholar] [CrossRef]
  46. Shen, F.; Wang, Y.; Li, L.; Zhang, K.; Smith, R.L.; Qi, X. Porous carbonaceous materials from hydrothermal carbonization and KOH activation of corn stover for highly efficient CO2 capture. Chem. Eng. Commun. 2018, 205, 423–431. [Google Scholar] [CrossRef]
  47. Diaz, E.; Sanchis, I.; Coronella, C.J.; Mohedano, A.F. Activated Carbons from Hydrothermal Carbonization and Chemical Activation of Olive Stones: Application in Sulfamethoxazole Adsorption. Resources 2022, 11, 43. [Google Scholar] [CrossRef]
  48. Román, S.; Valente Nabais, J.M.; Ledesma, B.; González, J.F.; Laginhas, C.; Titirici, M.M. Production of low-cost adsorbents with tunable surface chemistry by conjunction of hydrothermal carbonization and activation processes. Microporous Mesoporous Mater. 2013, 165, 127–133. [Google Scholar] [CrossRef]
  49. Titirici, M.M.; Thomas, A.; Yu, S.-H.; Müller, J.-O.; Antonietti, M. A Direct Synthesis of Mesoporous Carbons with Bicontinuous Pore Morphology from Crude Plant Material by Hydrothermal Carbonization. Chem. Mater. 2007, 19, 4205–4212. [Google Scholar] [CrossRef]
  50. Rodríguez-Reinoso, F. Production and applications of activated carbons. In Handbook of Porous Solids; Wiley: Hoboken, NJ, USA, 2002; pp. 1766–1827. [Google Scholar]
  51. Khan, T.A.; Saud, A.S.; Jamari, S.S.; Ab Rahim, M.H.; Park, J.-W.; Kim, H.-J. Hydrothermal carbonization of lignocellulosic biomass for carbon rich material preparation: A review. Biomass Bioenergy 2019, 130, 105384. [Google Scholar] [CrossRef]
  52. Parshetti, G.K.; Chowdhury, S.; Balasubramanian, R. Hydrothermal conversion of urban food waste to chars for removal of textile dyes from contaminated waters. Bioresour. Technol. 2014, 161, 310–319. [Google Scholar] [CrossRef] [PubMed]
  53. Phan, K.A.; Phihusut, D.; Tuntiwiwattanapun, N. Preparation of rice husk hydrochar as an atrazine adsorbent: Optimization, characterization, and adsorption mechanisms. J. Environ. Chem. Eng. 2022, 10, 107575. [Google Scholar] [CrossRef]
  54. Nzediegwu, C.; Naeth, M.A.; Chang, S.X. Carbonization temperature and feedstock type interactively affect chemical, fuel, and surface properties of hydrochars. Bioresour. Technol. 2021, 330, 124976. [Google Scholar] [CrossRef]
  55. Ishibashi, N.; Yamamoto, K.; Wakisaka, H.; Kawahara, Y. Influence of the hydrothermal pre-treatments on the adsorption characteristics of activated carbons from woods. J. Polym. Environ. 2014, 22, 267–271. [Google Scholar] [CrossRef]
  56. Genli, N.; Kutluay, S.; Baytar, O.; Şahin, Ö. Preparation and characterization of activated carbon from hydrochar by hydrothermal carbonization of chickpea stem: An application in methylene blue removal by RSM optimization. Int. J. Phytoremediat. 2022, 24, 88–100. [Google Scholar] [CrossRef] [PubMed]
Figure 1. Development of activated carbon via hydrothermal carbonization approach.
Resources 14 00034 g001
Figure 2. Network map papers, which contain keywords: hydrochar, activated carbon, characterization, and applications.
Resources 14 00034 g002
Figure 3. Van Krevelen diagram for TGs and hydrochars samples.
Resources 14 00034 g003
Figure 4. XRD patterns of TGs, HC-230-4, and AC-850-5.
Resources 14 00034 g004
Figure 5. TG and DTG patterns of TGs and HC-230-4.
Resources 14 00034 g005
Figure 6. FTIR spectra of TGs; HC-230-4, and AC-850-5.
Resources 14 00034 g006
Figure 7. SEM micrographs: (A) TGs; (B) HC-230-4; (C) AC-850-5.
Resources 14 00034 g007
Figure 8. N2 adsorption–desorption isotherms of HC-230-4, AC-850-5, and AC-850-5(P), closed symbols: adsorption and open symbols: desorption.
Resources 14 00034 g008
Table 1. Proximate, ultimate, energy properties, yield and surface areas of TGs, and hydrochars.
TGsHydrochars
HC-
180-1
HC-
190-1
HC-
200-1
HC-
210-1
HC-
220-1
HC-
230-1
HC-
240-1
HC-
250-1
HC-
230-2
HC-
230-3
HC-
230-4
HC-
230-5
Proximate
Analysis
VM71.8368.6364.7363.9863.7863.4663.1462.9862.8362.8162.2060.1959.61
FC *16.2020.2524.2025.0025.3125.6426.3826.3426.3626.6127.4429.4030.10
M8.78.28.148.118.038.077.717.697.657.697.647.617.59
A3.2682.9122.9242.9012.8722.8212.7652.7612.7592.7322.7192.7112.703
Ultimate
Analysis
C48.4751.1653.8358.9859.5359.2460.1159.1259.3261.7363.2266.1966.14
H6.4026.6375.9345.1383.575.1075.0045.2285.0574.9375.0395.2195.176
N1.1961.621.80.9421.4040.4560.7041.0211.0480.4320.2070.050.08
S1.0780.0550.06500.065000.0390000.0210
O **39.5837.6135.432.0332.5532.3731.4131.8331.8130.1628.8125.8025.83
H/C1.5841.5561.3221.0450.7191.0340.9981.0611.0220.9590.9560.9460.938
O/C0.6120.5510.4930.4070.4100.4090.3910.4030.4020.3660.3410.2920.292
Yield (%) -81.9276.3969.8869.1166.8263.4160.5859.4961.7357.3153.9953.78
Fuel Ratio 0.220.290.370.390.390.400.410.410.410.420.440.480.50
HHV (MJ kg−1) 20.3921.7122.0323.2521.5423.2823.5623.4323.3024.1824.9626.5326.48
Energy Densification Ratio -1.061.081.141.051.141.151.141.141.141.221.301.29
Energy Yield -87.2182.5479.6973.0276.2973.2669.6267.9873.2170.1770.2469.85
Surface Area 3.604.416.828.188.189.109.649.9210.0910.112.5114.4112.63
(VM), Volatile Matter; (FC), Fixed Carbon; (M), Moisture Content; (A), Ash Content; (C), Carbon Percent; (H), Hydrogen Percent; (N), Nitrogen Percent; (S), Sulfur Percent; (O), Oxygen Percent. * 100-(VM + M + A) (On as received basis). ** 100−(C + H + N + S + A) (by difference).
Table 2. Ultimate composition, yield, and surface areas of prepared activated carbons.
Sample AC-
750-1
AC-
850-1
AC-
950-1
AC-
850-3
AC-
850-5
AC-
850-7
AC-
850-5(P)
Preparation Conditions Temperature (°C)750850950850850850850
Activation time (h)1113575
Ultimate
Analysis
C 79.1179.4179.3581.2783.5783.9382.11
H 1.2971.3691.4211.5421.5971.5861.321
N 0.0620.05700000.071
S 0.0110.0190.0170.0230.0540.0580
Yield (%) 53.2635.9833.5418.8613.7611.8210.54
Surface Area (m2g−1) 337.7486.8367.4519.1729.7700.9664.6
Table 3. Basic and acidic/oxygenated functional groups of TGs, HC-230-4, and AC-850-5.
SamplepHpzcCarboxylic GroupsLactonic
Groups
Phenolic GroupsTotal Acidic GroupsTotal Basic Groups
(mmol g−1)(mmol g−1)(mmol g−1)(mmol g−1)(mmol g−1)
TGs4.20.1160.1040.1000.3200.23
HC-230-44.30.6600.5400.1201.320.19
AC-850-56.20.317BDL0.1150.4320.21
BDL: Below Detection Limit.
Table 4. Major assignments of bands for the TGs, HC-230-4, and AC-850-5.
SampleVibration Band (cm−1)AssignmentInference
TGs3405O-HStretching vibrations due to hydroxyl groups
2927C-HStretching vibrations due to aliphatic structures
1631, 1511C=OStretching vibrations of carboxylic groups in aromatic rings
1403C=CBending vibrations due to methyl groups
1255C-OEster and phenolic groups
1048C-O-CStretching vibrations of polysaccharides bands
606C-HBending vibrations due to aromatic structure
HC-230-43379O-HStretching vibrations due to hydroxyl groups
2905C-HStretching vibrations due to aliphatic structures
1605, 1513C=OStretching vibrations due to carboxylic groups and aromatic rings.
1458, 1428, 1318, 1271, 1210, 1159, 1111, 1058, 1031C-OStretching vibrations in hydroxyl, ester or ether, polysaccharides, and O-H bending vibrations
558C-HDeformation vibration due to aromatic structure
AC-850-53500–3400O-HStretching vibrations due to hydroxyl groups
2970C-HStretching vibrations due to aliphatic structures
1622C=OStretching vibrations due to carboxylic groups
1384O-HBending vibrations due to aromatic rings
1115C-O-CDue to aromatic structures
Table 5. Textural characteristics of HC-230-4, AC-850-5, and AC-850-5 (P).
SampleFeedstockPreparation TemperatureSurface Area (BET)Total Pore VolumeMesopore VolumeMicropore VolumePore Diameter
(°C)(m2g−1)(cm3g−1)(cm3g−1)(cm3g−1)(nm)
HC-230-4TGs23014.410.1110.1050.006--
AC-850-5HC-230-4850729.700.3920.1060.2862.15
AC-850-5(P)TGs850664.520.5050.2560.2493.60
Table 6. Comparison between the published conditions and experimental parameters used in this work to produce hydrochar.
MaterialBiomass/Water Ratio (gm:mL)Carbonization Temperature (°C)Residence Time (h)Surface Area (m2g−1)Reference
Saw dust1:12200204.4139[38]
Wheat straw1:12200209.1428[38]
Urban food waste1:4250206.07[52]
Rice husk1:51754013.09[53]
Wheat straw1:824044.54[54]
Canola straw1:824043.42[54]
Tectona grandis seeds1:10230414.41This study
Table 7. Comparison of the prepared AC with the activated carbons reported in the literature.
MaterialType of ActivationActivation Temperature (°C)Residence Time (h)Surface Area (m2g−1)Reference
Orange peel-derived hydrocharPhysical/CO275020301[43]
Orange peel-derived hydrocharPhysical/Air30020499[43]
Hickory wood chip-derived hydrocharPhysical/CO29006928[35]
Oak wood-derived hydrocharPhysical/CO29001903[55]
Chickpea stem-derived hydrocharChemical/KOH5005455[56]
Tectonagrandis seed-derived hydrocharPhysical/CO28504729.7This study
Disclaimer/Publisher’s Note: The statements, opinions and data contained in all publications are solely those of the individual author(s) and contributor(s) and not of MDPI and/or the editor(s). MDPI and/or the editor(s) disclaim responsibility for any injury to people or property resulting from any ideas, methods, instructions or products referred to in the content.

