Abstract
This article presents a methodology for risk assessment and management in the development of hard-to-recover hydrocarbon reserves. The proposed methodology integrates Monte Carlo simulation and fuzzy logic methods, which allows for the consideration of both quantitative stochastic risks (e.g., fluctuations in oil prices, variability in costs, and production volumes) and qualitative uncertainties (e.g., environmental, social, and technological risks) that are traditionally difficult to formalize. The approach facilitates the incorporation of uncertainties associated with complex field developments and aims to improve managerial decisions through comprehensive risk assessment. The article elaborates on the theoretical aspects of the proposed methodology, including risk identification stages, the formalization of qualitative data using fuzzy logic, and the application of the Monte Carlo method for integrating various risk categories. The results confirm the potential of this methodology as a tool to enhance the resilience and economic efficiency of projects involving the development of hard-to-recover hydrocarbon reserves.
1. Introduction
In the contemporary energy landscape, hydrocarbon resources remain fundamental to global energy security and economic development, even as the focus increasingly shifts toward low-carbon alternatives. While traditional oil and gas fields have historically supplied the majority of global production, they are gradually being depleted or becoming more challenging to develop. This situation has sparked a growing interest in unconventional hydrocarbons (e.g., shale oil, oil sands, and bituminous sands), often referred to as “hard-to-recover” or “complex” reserves.
The term “hard-to-recover reserves” (HTR) has various meanings in the scientific literature.
In the scientific literature, HTR reserves generally refer to hydrocarbon deposits with unfavorable geological or physical conditions that impede extraction by conventional means. Lushpeev [1] highlighted their economic inefficiency under current tax regimes and technologies, while Kryukov [2] included heavy oil and depleted formations in this broad category. Ankudinov [3] highlighted the role of ultra-low permeability in exacerbating production challenges. Other authors described similarly complex reservoirs—for instance, Bakken shale with its extremely low porosity and dense pore structure [4,5] or the Bazhenov formation in Western Siberia [6,7]—all of which require advanced methods, like hydraulic fracturing or CO₂ injection. Additional studies emphasized restricted fluid flow and the consequent need for enhanced oil recovery (EOR), such as CO₂-EOR or multi-stage fracturing [8,9,10]. Despite variations in focus, these works converge on the notion that HTR deposits demand specialized, capital-intensive techniques to overcome ultra-low permeability, high viscosity, and other unfavorable properties, rendering standard approaches economically unviable.
Thus, hard-to-recover reserves are hydrocarbon deposits characterized by unfavorable geological conditions and physical properties, such as ultra-low porosity and permeability. These features hinder traditional fluid flow, making extraction using standard technologies economically inefficient.
For clarity, we use “unconventional oil” to denote resources (e.g., shale oil, oil sands, and extra-heavy oil) [10,11,12,13,14,15] requiring specialized recovery methods, such as hydraulic fracturing and CO₂ injection, and “unconventional gas” for shale gas, coalbed methane (CBM), tight gas, and gas hydrates [9,11,16,17,18,19,20]. Table 1 combines the statistics providing a single overview of both reserves and production volumes.

Table 1.
Statistics on unconventional hydrocarbon reserves in the world.
For instance, Venezuela holds about 303 billion barrels of mostly extra-heavy oil, while Canada’s 168 billion barrels primarily come from bitumen-rich oil sands [21]. The United States leads in technically recoverable shale oil (78.2 billion barrels) and is also the top producer, reaching 3.04 billion barrels of shale oil in 2023 [26,27].
On the gas side, Canada’s unconventional reserves (750 Tcf) exceed those of the United States (615 Tcf) and China (235.5 Tcf), yet the U.S. remains the largest unconventional gas producer, delivering around 850 Bcf per year [28]. In China, major fields, such as Ordos and the Sichuan Basin, contain a combination of shale and tight gas, further driving production growth [20,38,39]. Meanwhile, countries like Argentina and Australia have rapidly expanded the shale and coal seam gas output, though they still trail major producers. These data highlight the considerable global potential of unconventional hydrocarbons but also underscore that commercial viability depends heavily on technological innovation, economic conditions, and regulatory frameworks.
Despite profitable prospects, the development of unconventional fields is associated with a high level of uncertainty and a multitude of interconnected risks—geological, technological, economic, and environmental. Traditional risk assessment systems, long used for evaluating conventional oil and gas projects, often prove inadequate for the complexity inherent in developing unconventional reservoirs. In particular, qualitative or “soft” risks, such as environmental impacts and social license to operate, are difficult to quantify. Therefore, a more robust methodological framework is needed to account for both the stochastic nature of measurable variables (e.g., price volatility and production rates) and qualitative uncertainties (e.g., environmental regulations and public resistance) that significantly influence the economic viability of a project.
Given these limitations, the aim of this research is to propose and justify a comprehensive conceptual and methodological approach to risk assessment and management in the development of unconventional hydrocarbon fields. Specifically, the study explores how the combination of Monte Carlo simulation (for stochastic quantitative parameters) and fuzzy logic (for qualitative or linguistically expressed risks) can provide a more holistic perspective on a project’s uncertainty profile. By systematically applying these methods, risk managers and decision-makers can gain a more accurate understanding of both the probability and the impact of various risk factors.
The principal objective of this research is to develop and validate a hybrid risk assessment methodology tailored specifically to HTR hydrocarbon fields. We aim to integrate Monte Carlo simulation (for stochastic, quantitative risks) with fuzzy logic (for subjective, qualitative risks) into a unified model, thus bridging a key gap in conventional risk assessment, which often fails to account for the interplay between quantifiable uncertainties (e.g., pricing or production variability) and hard-to-quantify risks (e.g., social acceptance or technological complexity).
Our novel contribution lies in:
1. Fusing fuzzy logic and Monte Carlo into a single, iterative workflow, ensuring that qualitative assessments (such as environmental constraints or public resistance) feed directly into probabilistic distributions for quantitative inputs.
2. Introducing calibrated thresholds and rule sets that align fuzzy logic categories with typical uncertainty ranges observed in HTR projects.
3. Demonstrating how both quantitative (e.g., price volatility) and qualitative (e.g., social risk) factors ultimately shape economic indicators (NPV, IRR, and PI), providing a more robust basis for scenario planning and resource allocation.
Hence, the object of this research is to formulate methods, tools, and strategic directions for advanced risk assessment in HTR projects, while the subject focuses on the methodological and instrumental foundations that integrate qualitative and quantitative risk factors into a single decision-making framework. In addressing this, we also explore the economic ramifications of various risk scenarios, guiding stakeholders to optimize resources and increase resilience.
Structurally, the article is organized as follows. First, we review the literature on unconventional fields and their associated risks, highlighting limitations in existing assessment methods. Next, we present our hybrid approach, detailing the Monte Carlo and fuzzy logic components [40,41] and illustrating how these elements operate as a unified system for multi-criteria risk evaluation. We then apply the methodology to a hypothetical example, demonstrating, in principle, how this integrated approach can inform strategic and operational decisions in exploration and production. Finally, we discuss how our proposed framework contributes to refined risk assessment protocols for unconventional hydrocarbon developments, aligning extraction objectives with economic performance, environmental protection, and broader sustainability goals.
2. Literature Review
2.1. Classification of Hard-to-Recover Hydrocarbon Reserves
Hard-to-recover oil reserves are classified based on their geological and extraction characteristics [42,43]. According to Zhao et al., unconventional reserves include resources such as shale oil, oil sands, and heavy oil, distinguished by low permeability and porosity [44]. Bizhani et al. described shale formations, such as the Bakken, as low-permeability reservoirs requiring hydraulic fracturing [4,12]. Agishev et al. emphasized the challenges of thinly layered formations, such as the Achimov formation, highlighting their unique geological and technological complexities [7]. Yuan and Wood expanded this classification to include coalbed methane and other low-permeability reservoirs characterized by significant geological heterogeneity and confined pore structures [9]. Advanced technologies, such as CO₂ injection, are required for efficient extraction from these reservoirs.
Chizhov et al. examined carbonate reservoirs with high clay content and dense matrices that limit fluid mobility and necessitate acid stimulation to enhance permeability [45]. Similarly, Mokheimer et al. classified heavy oil sands as reservoirs dependent on thermal recovery methods, such as in situ combustion [46]. Guo et al. categorized unconventional reservoirs based on their susceptibility to hydraulic fracturing, emphasizing the heterogeneity of stresses and formations [47]. Reynolds et al. underscored the economic viability of unconventional reservoirs, linking their development to infrastructure and market proximity [48].
Table 2 presents the classification of hard-to-recover hydrocarbon reserves based on reservoir type.
Table 2.
Classification of hard-to-recover reserves by reservoir type [4,7,9,13,44,45,46,47,49,50,51,52,53].
Reference [50] presented a comprehensive classification of residual oil reserves in mature oil fields, particularly in those with heterogeneous formations and low-permeability zones that are difficult to extract. It highlighted that residual oil accumulates in areas where water flooding cannot easily reach, such as lens-shaped reservoirs and zones with no flow. Residual oil is categorized based on its distribution in low-permeability formations, isolated zones, and capillary or film forms within porous structures.
Table 3 presents the types of residual oil and recommended methods for their extraction.
Table 3.
Types of residual oil and recommended extraction methods [50,54,55,56,57,58].
The study identified geological heterogeneity as a key factor affecting oil recovery efficiency [50]. This heterogeneity can be lithological-facial in nature, manifesting in variations in mineral content, grain size, and pore structure across different layers. These differences result in varying reservoir properties [59], necessitating specialized geological and technical interventions. Effective methods for enhancing oil recovery in such complex formations include cyclic water flooding, forced fluid extraction, hybrid methods that optimize filtration flow and capillary forces, as well as chemical and physical techniques, such as polymer flooding and hydraulic fracturing [60].
In global practice, aside from hard-to-recover reserves, there is a separate category of fields suitably referred to as reserves that are difficult to explore. This category includes hydrocarbon accumulations that arise in tectonically complex zones, such as fold-and-thrust belts within continental collisions and coastal sedimentary basins. Such resources do not fit the classic notion of hard-to-recover reserves, since the main challenge here lies not so much in the oil or gas’s physical or chemical characteristics, but rather in the extreme structural complexity of the deposits and the low predictability of where traps may occur. According to Cooper [61], fold-and-thrust belts often have a high density of structural traps, but their detection and confirmation call for expensive field studies, and seismic data interpretation is often hampered by sharply varying topography and inclined strata. Goffey et al. [62] drew similar conclusions, pointing out that such areas may be deliberately “steered clear of” by companies on account of high financial risks and uncertainties in assessing their prospects. Nevertheless, in zones like the Zagros orogenic belt, where the historical existence of giant oil fields is well documented, it turns out that, given effective in-depth investigations and the use of modern seismic exploration methods, very large discoveries can indeed be made.
Kendall and colleagues [63], by comparing fold-and-thrust belts in the Zagros, the Pyrenees, and the Bolivian Sub-Andean region, highlighted the critical importance of interactions between tectonic and sedimentary processes, whereby reserves that are difficult to explore arise in the course of complex structural and lithologic evolution. They emphasized that timing (the alignment of hydrocarbon migration and trap formation) is paramount in such belts, and that a detailed understanding of faults, thrusts, and the associated facies zones directly affects exploration results. Accordingly, whereas in “hard-to-recover” projects the main focus is on adapting extraction technologies and comprehensively analyzing economic feasibility, reserves that are difficult to explore in fold-and-thrust belts primarily require thorough structural and tectonic analysis, integration of multidimensional seismic data, and flexible exploration methods that can pinpoint zones of productive traps. These kinds of fields may remain both outside active development regions and in remote segments of continental collisions once deemed unpromising due to insufficient deep-structure data and the difficulties of interpreting seismic information. This is precisely why reserves that are difficult to explore are increasingly being viewed by researchers as a potential pool for future discoveries, especially in light of the progressive depletion of regions that are simpler in geological terms.
2.2. List of Classical Methods and Techniques for Risk Assessment and Analysis
The issues of risk assessment and analysis are particularly relevant in the development of hard-to-recover oil and gas reserves, as this category of reserves is characterized by significant qualitative risks [64].
The key international methodological documents for risk assessment and analysis are ISO 31000:2018 Risk Management—Guidelines, and IEC 31010:2019 Risk Management—Risk Assessment Technique [65,66]. Based on these documents, we can create an analytical table categorizing classical risk assessment methods into two groups: quantitative and qualitative.
Table 4 presents methods for quantitative risk assessment.
Table 4.
Methods and techniques for quantitative risk assessment [66].
Table 5 presents the methods used for qualitative risk assessment.
Table 5.
Methods and techniques for qualitative risk assessment [66].
It is important to note that the fuzzy logic method cannot be exclusively attributed to qualitative risk assessment methods, as fuzzy logic can provide the necessary quantitative distribution for qualitative risks when expert evaluations are available.
Thus, there is a significant toolkit for risk assessment across various industries. Each method and technique have their own advantages, limitations, and most suitable areas of application. This study focuses on reviewing relevant scientific publications on risk assessment in the oil and gas industry to identify the most current methods and techniques for risk analysis and assessment in this sector.
2.3. Modern Methods of Risk Assessment and Analysis in the Oil and Gas Industry
The oil and gas sector is characterized by a high degree of uncertainty and a variety of risks associated with technical, economic, environmental, and geopolitical factors. In recent years, risk assessment and management methods in this field have become significantly more complex, integrating both quantitative and qualitative approaches as well as advanced modeling and data analysis technologies. Several studies highlight modern risk assessment methodologies that deserve attention.
For instance, Stroykov and colleagues [67] proposed a structured methodology for assessing risks in energy investment projects, combining qualitative and quantitative methods. They applied the Monte Carlo method with 5000 iterations for quantitative risk assessment, considering the variability of key input parameters, such as capital expenditures and energy prices. For risks with insufficient statistical data, they utilized qualitative methods, including expert evaluations and risk premiums in project discount rates. Similarly, Korshunov et al. [68] proposed an improved matrix method for risk assessment in mining enterprises, using continuous probability and damage scales.
1. Probability index (P):
where λ is the expected frequency of adverse events (per day−1).
2. Damage index (Q):
where D is the degree of functional impairment (in percentage) caused by the hazard, and T is the duration of impairment (in days).
3. Overall professional risk index (R):
where P and Q are the probability and damage indices, respectively [68].
These formulas allowed the authors to enhance the accuracy of risk assessments by transitioning from discrete to continuous scales of probability and damage. This approach improved the precision and consistency of evaluations, reducing subjectivity and cognitive biases.
The use of advanced modeling methods plays a key role in modern risk assessment. The Monte Carlo method is widely applied to assess financial risks. Shokouhi et al. [69] used this method to simulate profitability metrics for oil refineries, considering economic and financial risks. The methodological algorithm includes the following steps.
1. Calculation of net present value (NPV):
where CFt is the cash flow in year t, r is the discount rate, and n is the number of project years.
2. NPV-at-risk (NPVaR):
where α is the confidence level (typically 5%), corresponding to the minimum expected NPV within the 1-α confidence interval.
Formulas (4) and (5) can also be presented integrally:
3. Expected shortfall (ES):
where W is the number of worst outcomes within the confidence level, and Xi,n represents the loss values in these intervals.
4. Use of probability distributions for modeling parameters:
- Crude oil price: Laplace distribution.
- Crack spread for gasoline and LPG: ExtValueMin distribution.
- Crack spread for diesel fuel and jet fuel: logistic distribution.
- Refinery utilization rate: uniform distribution.
5. Latin hypercube sampling (LHS): the LHS method divides the cumulative distribution function into equal intervals and performs stratified sampling to achieve more precise results compared to traditional Monte Carlo sampling [69].
Balas [70] combined a three-dimensional hydrodynamic model with the Monte Carlo method to assess risks in oil exploration projects, taking into account a wide range of environmental factors.
1. Spill risk index (SRI):
where:
- P(Uw), P(Hs), P(Vc), P(Ht), P(Δ), P(Ei): probabilities of impacts from corresponding environmental parameters—wind speed, wave height, current velocity, tsunami height, sea level changes, and other factors.
- P(TA): probability of an incident due to vessel movement.
- P(Qi): probability of an oil spill.
- Qi: volume of the spill.
- A, B—calibration coefficients for different risk levels.
2. Probability of an oil spill due to riser failure (Q4):
where Q4 is the spill volume in tons.
3. Parameter correlations: To account for interrelations between factors (e.g., sea level and tsunami height), correlation coefficients were used. For example, the correlation coefficient between sea level (Δ) and wave height (Hs) was ρ = 0.35 [70].
This model is notable for incorporating factors such as tsunamis, storms, and sea level changes into the risk assessment process. The model methodology uses hydrodynamic process data to predict the probabilities and scales of risks associated with oil spills.
Bayesian networks are also applied in this area. Wang et al. [71] proposed a dynamic risk assessment methodology using dynamic Bayesian networks for deepwater oil and gas equipment operations. Jong et al. [72] applied a similar approach combined with fuzzy set theory to model pipeline wear and evaluate the effectiveness of maintenance strategies.
Machine learning methods and neural networks are also used for risk assessment. Zhang et al. [73] investigated the impact of geopolitical risks on crude oil future volatility using advanced machine learning techniques, including transformer-based neural networks with causal convolutional networks. Al-Mhdawi et al. [74] integrated structural equation modeling with fuzzy set theory to assess risks in oil and gas construction projects.
Moreover, fuzzy logic and hybrid methods are widely applied. Abid et al. [75] developed a risk assessment framework for repurposing abandoned oil and gas wells into geothermal systems, using an approach based on features, events, and processes, integrated with fuzzy logic.
1. Risk assessment using the IPM matrix:
where:
- Probability: likelihood of the event occurring,
- Severity: degree of consequences.
2. Element intensity and domain:
where C is the causality score of the element (sum of row values in the interaction matrix), and E is the effect score (sum of column values).
3. Interaction matrix: This matrix defines the interactions between system elements, such as the cement sheath, casing, temperature, water composition, and wellhead assembly. Each interaction is assigned a numerical risk value based on expert evaluations.
4. Cause-and-effect diagram: by plotting causality and effect scores, the most vulnerable system components are visualized [75].
This methodology has proven highly effective in identifying and prioritizing risks associated with repurposing old wells. For instance, in the analyzed cases, the most vulnerable components were the casing and cement sheath, especially under high temperatures and cyclic loads.
Luo et al. [76] proposed a hybrid approach for risk scenario evaluation in the oil and gas industry, combining the best worst method (BWM), criteria importance through intercriteria correlation (CRITIC), and VIKOR (compromise ranking) approaches, integrated with probabilistic linguistic term sets (PLTS). The main mathematical elements and formulas of the approach are listed below.
1. Definition of probabilistic linguistic term (PLTS):
where Lk is a linguistic term, and pk is the corresponding probability.
2. Normalization of PLTS:
where for valid probabilities.
3. Determination of subjective weights using BWM:
4. Determination of objective weights using CRITIC:
where is the coefficient of variation, and is the correlation coefficient between criteria.
5. Combining subjective and objective weights:
where and represent the relative importance of subjective and objective weights.
6. Alternative evaluation using VIKOR:
6.1. Group utility value:
6.2. Individual regret minimization value:
6.3. Comprehensive evaluation:
This approach effectively accounts for uncertainties and expert preferences, making it a valuable tool for multi-criteria risk assessment in the oil and gas industry [76].
In the field of risk assessment in supply chains and logistics, Kovshov and Tingnting [77] utilized computer modeling to evaluate pipeline accident risks in permafrost conditions, applying SolidWorks and ANSYS for three-dimensional modeling and finite element analysis. Kovshov et al. [78] developed a methodology for ranking pipeline segments by accident probability, combining the “bow-tie” model and a modified checklist. Ilyas et al. [79] proposed a fuzzy-logic-based risk assessment system for crude oil transportation supply chains, considering financial costs, energy consumption, environmental impact, and safety risks.
The importance of supply chain resilience is also emphasized in research. Kang et al. [80] developed a data quality management system to assess equipment failure risks in the oil and gas industry, noting that data quality directly affects the accuracy of risk models. Wan et al. [81] introduced a model for analyzing energy supply resilience during oil supply disruptions in China.
Systemic risks and macroeconomic impacts are also subjects of contemporary studies. Liu and Shi [82] designed a framework to assess the macroeconomic consequences of extreme oil price shocks using Qual VAR and DSGE models. Wang et al. [83] explored the influence of oil price fluctuations on systemic financial risks through financial networks, employing CoVaR and LASSO-VAR methods. Caporin et al. [84] used the ΔCoVaR methodology to analyze systemic risks posed by U.S. oil and gas companies.
Geopolitical risks and economic policy uncertainty also significantly impact the industry. Zhang et al. [73] investigated the effects of various geopolitical risk subcategories on crude oil future volatility using machine learning and the SHAP method to rank risk factors. Zhou et al. [85] examined the impact of geopolitical risks and economic policy uncertainty on coal, natural gas, and oil rents in China, employing an advanced Fourier autoregressive distributed lag model.
In the area of occupational and operational risk management, Babyr et al. [86] proposed a methodology for analyzing coal mine accident risks with a focus on human factors, using a semi-quantitative approach and a risk index. Korshunov et al. [68] developed an improved matrix method for risk assessment in mining enterprises, enhancing accuracy and reducing subjectivity in evaluations. Al-Mhdawi et al. [74] emphasized the importance of human factors in risk assessment for oil and gas construction, identifying non-compliance with personal protective equipment requirements as a critical issue.
Environmental risks are also a crucial area of research. Chen et al. [87] proposed a hybrid methodology for assessing oil spill risks in the Arctic [88,89,90], combining an analytic network process and fuzzy comprehensive evaluation. Balas [70] applied a hybrid model combining a hydrodynamic model and the Monte Carlo method to assess oil spill risks in exploration projects. Torres et al. [91] reviewed risk assessment methods for water management during hydraulic fracturing, categorizing them into engineering and holistic approaches that consider technical and social factors.
In the context of contractual and economic aspects, Fedorov et al. [92] introduced a new contract system for oil exploration and production projects, focused on distributing risks and benefits between field operators and contractors, utilizing real options analysis and discounted cash flow methods. Shokouhi et al. [69] combined simulation and econometric modeling to assess investment profitability in oil refining under economic and financial risks, applying the Monte Carlo method and regression analysis.
Resilience and risks in energy infrastructure are key themes. Wang et al. [71] proposed a dynamic risk assessment methodology for deepwater oil and gas equipment operations, combining dynamic Bayesian networks and the matter-element theory. Jong et al. [93] modeled pipeline risk evolution under periodic maintenance using dynamic Bayesian networks and fuzzy set theory. Wan et al. [81] developed a model to simulate and evaluate dynamic energy supply resilience to disruption events, using dynamic analysis and static resilience metrics.
Research on systemic risks and financial stability also includes the work of Choi et al. [94], who used advanced econometric methods to study the relationships and risk spillover effects between natural gas, crude oil, and stock markets in major energy-producing and consuming countries. They applied wavelet coherence to analyze joint movements across different time and frequency domains, finding that natural gas showed significant hedging potential and acted as a safe haven during stock market downturns. Their study highlighted the asymmetry in risk spillovers, especially in producer countries like Russia and the United States.
In the field of fintech innovations and financial stability, Afshan et al. [95] examined dynamic interactions between fintech, digital currencies, exchange rates, oil price volatility, and financial risk from 2011 to 2023. Using Morlet wavelets and time–frequency decomposition, they analyzed both short-term and long-term associations, focusing on temporal and frequency aspects. Their study revealed significant temporal changes and interrelationships among variables, such as a positive relationship between fintech and digital currencies during certain periods and an inverse relationship between fintech innovations and oil price volatility.
Additionally, Khalilzadeh et al. [96] presented a hybrid methodology for analyzing and ranking risks in oil and gas exploration and production projects. They employed a combination of fuzzy Delphi, fuzzy DEMATEL, and fuzzy ANP methods, providing an integrated framework for addressing uncertainty and interdependencies between risk factors. Their approach identified and prioritized 17 risks, with political and economic sanctions identified as the most critical due to their significant influence on other risks, such as attracting foreign investment and infrastructure adequacy.
For better clarity and structure, the discussed methods are summarized in Table 6.
Table 6.
Modern risk assessment methods [67,68,70,71,74,75,76,77,78,79,81,87,95,96,97,98,99].
Thus, modern research in risk assessment within the oil and gas industry demonstrates significant progress in the application of advanced methodologies that integrate quantitative and qualitative approaches as well as modern technologies for modeling and data analysis. The use of machine learning methods, fuzzy logic, Bayesian networks, and Monte Carlo simulation enables more precise and efficient evaluation of risks associated with various factors. Future research may focus on further integrating these methods and developing comprehensive risk management systems that account for the dynamic and multifactorial nature of risks in the industry.
2.4. Analysis of Methodological Gaps in the Scientific Literature and Justification of the Proposed Methodology
Risk assessment in the development of hard-to-recover hydrocarbon reserves has traditionally relied on well-established quantitative and qualitative methodologies. The Monte Carlo simulation method is widely employed for stochastic modeling of financial and operational uncertainties, as demonstrated by Stroykov et al. [67] and Shokouhi et al. [69]. Meanwhile, fuzzy logic has been used to assess qualitative risks, particularly in scenarios where expert judgment is required to evaluate ambiguous or non-quantifiable parameters, as discussed by Abid et al. [75] and Luo et al. [76].
However, despite their widespread application, these methods exhibit several methodological limitations when applied independently. Monte Carlo simulations, while effective in modeling probabilistic variations in key project parameters, struggle to incorporate qualitative risks, such as social or environmental concerns, which do not lend themselves easily to numerical representation [100]. On the other hand, fuzzy logic, while powerful in translating qualitative assessments into quantitative scores, often lacks the probabilistic depth required for rigorous financial or operational forecasting [75].
A review of contemporary literature reveals notable methodological gaps in risk assessment frameworks for HTR reserves. First, conventional quantitative models assume that stochastic variables, such as price fluctuations and production decline rates, are statistically well defined, yet in reality, data for unconventional reservoirs often exhibit high variance and non-stationarity [70]. Many studies applying Monte Carlo methods, such as those by Wang et al. [71] and Balas [70], acknowledge these constraints but do not provide robust mechanisms to address them, leading to potential biases in risk estimations.
Second, qualitative risk assessment approaches in existing literature tend to be subjective and dependent on expert input, lacking standardized methodologies for integrating these risks into quantitative models. Studies like those of Korshunov et al. [68] and Al-Mhdawi et al. [74] recognize the significance of non-technical risks (e.g., regulatory changes and social opposition), yet these aspects are typically treated in isolation rather than being incorporated into integrated risk assessment frameworks.
Third, existing hybrid models that combine quantitative and qualitative techniques, such as Bayesian networks and scenario-based approaches, often require extensive historical data to calibrate probability distributions, which are rarely available for hard-to-recover reserves. While Bayesian models, as applied by Jong et al. [72], offer a structured approach to causal risk analysis, they rely on predefined conditional probabilities that may not accurately reflect the dynamic nature of unconventional field development.
The proposed methodology addresses these gaps by integrating Monte Carlo simulation with fuzzy logic, forming a hybrid model that effectively captures both probabilistic and qualitative uncertainties. Unlike conventional applications of these methods in isolation, the approach presented in this study establishes a direct link between qualitative risk assessments (expressed through fuzzy logic) and quantitative risk modeling (using Monte Carlo simulations). By adjusting probability distributions based on qualitative risk levels, this integration provides a more realistic representation of uncertainty in HTR projects.
Furthermore, the methodology introduces calibrated threshold values that align fuzzy logic categories with typical uncertainty ranges observed in unconventional field development. This structured approach ensures that qualitative risks—such as community opposition, regulatory shifts, and environmental constraints—are systematically integrated into stochastic modeling, enhancing risk-adjusted decision-making.
In summary, while prior research has laid the foundation for risk assessment in hydrocarbon projects, existing methodologies remain fragmented, often treating quantitative and qualitative risks separately. The proposed hybrid approach bridges this gap by offering a unified model that enhances the accuracy and applicability of risk evaluations in the development of hard-to-recover hydrocarbon reserves.
3. Materials and Methods
The proposed methodological approach to risk assessment and management in the development of hard-to-recover hydrocarbon resources was designed to address the inherent uncertainties of such projects. This methodology integrates Monte Carlo simulation and fuzzy logic, creating a hybrid framework that effectively evaluates both quantitative and qualitative risks. Below are the materials and step-by-step components of the methodology.
3.1. Risk Categorization and Selection
The first step in the methodology involved identifying and classifying risks characteristic of projects associated with hard-to-recover hydrocarbon reserves. Initially, risks were grouped into six main categories: geological, environmental, technical, economic, operational, and political–regulatory. It was determined that the category of social risks is often overlooked in scientific literature, and the importance of accounting for this risk category was justified. The consolidation of technical and operational risks into a single category of technological risks was substantiated. Among these, geological, environmental, technological, social, and political–regulatory risks were prioritized for inclusion in the methodology for assessing qualitative risks, as they carry significant qualitative characteristics and directly impact project feasibility. This category of qualitative risks requires a specialized approach to account for their uncertainty and subjectivity. These risks are inherently interconnected, influencing production processes, regulatory compliance, and public acceptance, and therefore require comprehensive analysis.
3.2. Fuzzy Logic for Qualitative Risk Analysis
To address the subjectivity and uncertainty of qualitative risks, the methodology employed fuzzy logic. This approach converts expert opinions and linguistic assessments into quantitative results that can be incorporated into broader risk assessment models. The application of fuzzy logic included the following steps:
1. Definition of linguistic variables: Each risk was characterized using linguistic variables, such as “low”, “medium”, or “high”. For instance, technological risks include uncertainty related to equipment failure, while environmental risks pertain to potential pollution and regulatory requirements.
2. Membership functions: The membership functions used in this study follow a triangular form, as they provide a simple yet effective way to model uncertainty in risk assessment. The choice of triangular functions was justified by their computational efficiency and ability to approximate expert judgments with minimal complexity. The general formula for a triangular membership function is given as follows:
where a, b, and c are the lower, middle, and upper bounds of the membership function, respectively. In this study, the specific values were determined based on statistical analyses of risk probability distributions and expert evaluations.
Figure 1 shows schematically the general view of the membership functions for the risk level. The threshold values of 0.3, 0.5, and 0.8 were chosen based on a combination of empirical observations and expert assessments. Specifically, the 0.3 threshold represents a low-risk level, where uncertainties have minimal impact on project performance. The 0.5 threshold signifies the transition from low to medium risk, aligning with the median of risk probability distributions, while the 0.8 threshold corresponds to a high-risk level, capturing extreme uncertainty scenarios where the likelihood of adverse events significantly increases. These values were derived from an analysis of historical data and expert opinion to ensure their applicability across various hard-to-recover reserve development projects.
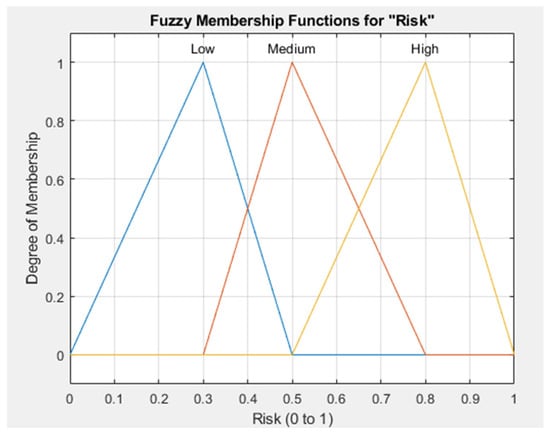
Figure 1.
Membership functions for the risk level (created by the authors).
3. Development of fuzzy rules: A set of rules was constructed to describe the interactions of various risk factors. For example, a rule might state: “If the technological risk is high and the environmental risk is medium, then the overall risk is high”. These rules reflect expert knowledge and relationships among different risks.
4. Fuzzy inference: using the defined rules, a fuzzy inference engine evaluated qualitative data to produce a comprehensive risk assessment in the form of fuzzy sets.
5. Defuzzification: Fuzzy results were converted into precise numerical values using methods such as the center of gravity method. This yielded a quantitative risk assessment , representing the aggregate impact of qualitative risks.
This process is schematically represented in Figure 2.
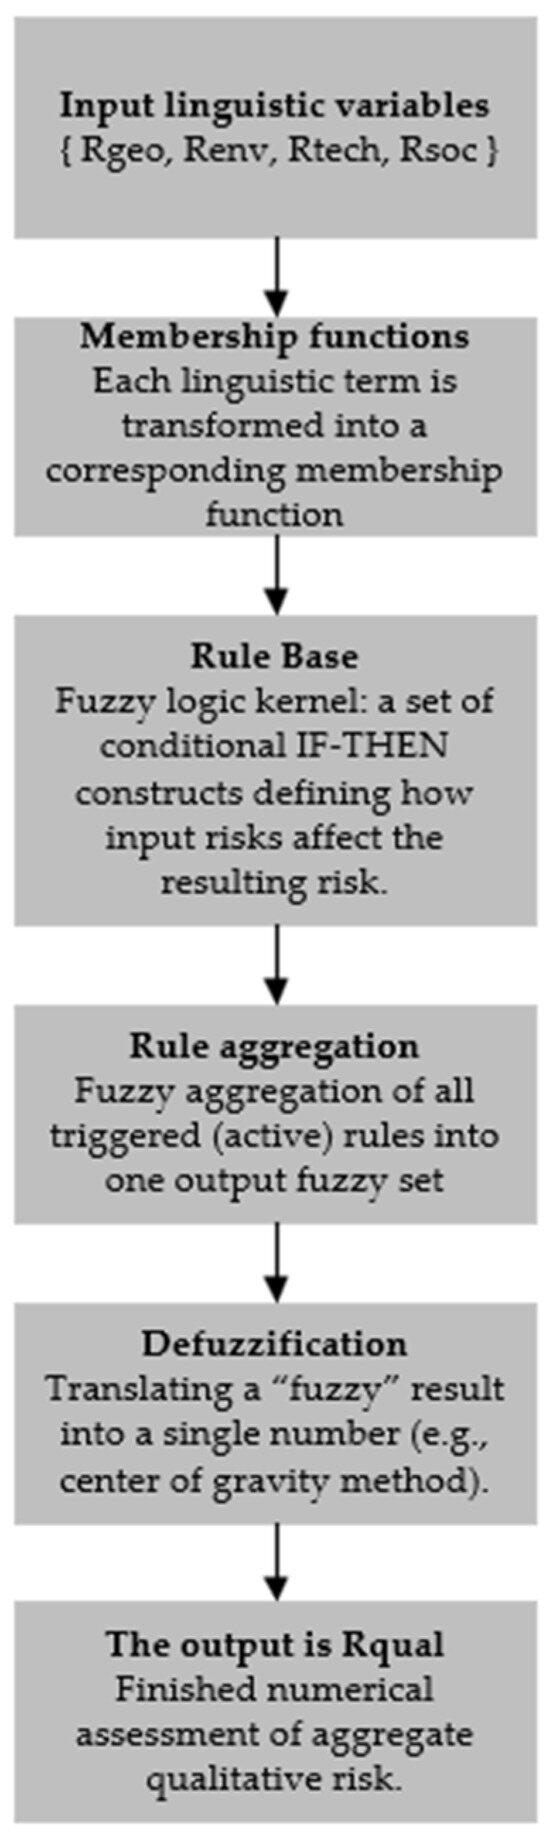
Figure 2.
Scheme of application of fuzzy logic mechanisms in the developed methodology.
3.3. Monte Carlo Simulation for Quantitative Risk Integration
Monte Carlo simulation was used to model the stochastic nature of quantitative risks, such as price volatility, production rate variations, and changes in capital and operational costs. The integration of qualitative risk assessments into the Monte Carlo system was achieved through the following steps:
1. Adjusting input distributions: The qualitative risk assessment Rqual was used to modify input parameters of the quantitative model. For example, higher qualitative risks may increase the variance of cost and production distributions, reflecting greater uncertainty.
2. Scenario weighting: Qualitative risks influence the likelihood of specific scenarios. For example, high social risks may increase the probability of scenarios with reduced project efficiency.
3. Modeling outcomes: using adjusted input data distributions, Monte Carlo simulation generated probabilistic outputs reflecting the potential range of economic indicators under various risk conditions.
Schematically, the process of conducting Monte Carlo simulations is presented in Figure 3.

Figure 3.
Schematic of the Monte Carlo simulation process.
3.4. Framework for Comprehensive Risk Assessment
The final stage of the methodology involved integrating qualitative and quantitative risks into a unified system. This approach combined the probabilistic modeling capabilities of Monte Carlo simulation with the nuanced assessment of qualitative risks provided by fuzzy logic. By merging these factors, the methodology created a holistic risk profile that considers both measurable and subjective uncertainties. This allowed for a more informed analysis of potential project outcomes and facilitated the development of targeted risk mitigation strategies.
The classification in Table 7 serves as the foundation for risk quantification within the developed methodology. Geological, environmental, and technical risks were incorporated into the fuzzy logic model, while economic and operational risks were directly integrated into Monte Carlo simulations. Political and regulatory risks were accounted for through scenario analysis, ensuring that all identified uncertainties contributed to a comprehensive probabilistic risk assessment.
Table 7.
Classification of risks in the development of hard-to-recover reserves [6,7,8,9,18,45,101,102,103,104,105,106,107,108].
In this study, the qualitative risk assessment (denoted as Rqual l) generated by the fuzzy inference system was directly used to modify both the shape and spread of the probability distributions in the Monte Carlo simulation. Specifically, three core steps were involved:
1. Parameter linking. Each quantitative variable in the project model (e.g., capital expenditures, operational costs, and production rates) was first assigned a baseline probability distribution (normal, triangular, or uniform) based on historical data or industry benchmarks. We then established “linkage rules” indicating which variables would be most affected by a rise in Rqual. For instance, social risks might have the strongest impact on operational downtime, whereas environmental risks could primarily alter remediation costs.
2. Scaling of distribution parameters. Each affected parameter’s mean and/or variance was scaled by a factor that depends on Rqual. For example, if Rqual is elevated (e.g., 0.7–0.8), the standard deviation of costs might be inflated by 10–20% to reflect higher uncertainty. Conversely, a lower fuzzy risk value (e.g., 0.2–0.3) would keep the parameter’s spread close to its baseline. This ensures that a “high” qualitative risk translates to broader or shifted distributions of the project’s key economic variables.
3. Iterative sampling. During each Monte Carlo iteration, random values of the risk-affected variables were drawn from these adjusted distributions. This means that as the fuzzy risk level increased, the drawn values for certain parameters were more likely to be either higher (in the case of costs) or lower (in the case of production volumes), capturing the interplay of subjective (qualitative) and stochastic (quantitative) uncertainties.
These adjustments effectively reflected the notion that high social or environmental risk can translate into cost overruns, extended project timelines, or reduced output. By systematically integrating the fuzzy logic output into the random sampling process, the methodology accounted for both the subtle, expert-driven nature of qualitative risks and the conventional probabilistic modeling of quantitative variables.
3.5. Methodology Summary
The proposed methodological framework provides a systematic approach to risk assessment in projects related to hard-to-recover hydrocarbon reserves. It addresses the limitations of traditional risk assessment methods by incorporating qualitative factors often overlooked in conventional models. The integration of fuzzy logic provides a structured means for quantifying subjective risks, while Monte Carlo simulation enables probabilistic modeling of quantitative uncertainties. Together, these methods form a comprehensive tool for assessing the overall risk landscape of complex hydrocarbon projects, providing a reliable basis for decision-making and strategic planning.
4. Results
4.1. Comprehensive Risk Classification in the Development of Hard-to-Recover Reserves
The development of HTR reserves is inherently linked to a wide range of risks that require thorough assessment and management. These risks stem from unique geological, environmental, technical, and economic challenges inherent in extracting HTR resources. Reservoirs such as oil-bearing strata, shale formations, and low-permeability carbonates present significant obstacles for traditional extraction methods, necessitating the adoption of advanced technologies, such as hydraulic fracturing, enhanced oil recovery (EOR) methods, and horizontal drilling [42].
The complexity of these reservoirs introduces uncertainty at every stage of development—from exploration and evaluation to production and abandonment [109,110]. Geological risks, including low porosity and permeability, often require detailed modeling and the development of enhanced recovery strategies. Environmental risks, such as water contamination and greenhouse gas emissions, demand strict compliance with regulatory standards and innovative approaches to mitigating impacts. Technical risks, including equipment failures and variability in extraction methods, further exacerbate the challenges of economically viable production.
Moreover, HTR hydrocarbon extraction projects face economic uncertainty related to high initial capital expenditures, volatile market conditions, and rapid production decline rates [111]. Operational risks, such as wellbore instability and fluid management, amplify these issues, making risk assessment and mitigation critical for ensuring project sustainability and profitability.
Therefore, a comprehensive risk analysis system is essential for the successful development of HTR resources. By integrating quantitative models, scenario forecasting, and adaptive management strategies, stakeholders can better understand and mitigate these risks, ultimately optimizing resource recovery and minimizing environmental and financial impacts. The analysis presented in the table below categorizes and evaluates key risk factors linked to HTR hydrocarbon development, as identified in the scientific literature. It further outlines their sources, impacts, and possible risk mitigation approaches.
Table 7 presents a comprehensive classification of risks relevant to the development of hard-to-recover reserves. These risks were identified based on a combination of expert analysis and literature review. The categorization aligns with the proposed hybrid methodology, wherein geological, environmental, technical, economic, operational, and regulatory risks were assessed using fuzzy logic and Monte Carlo simulation. The integration of these risk categories into the assessment framework enabled the modeling of both stochastic and qualitative uncertainties, enhancing the robustness of risk quantification in project evaluation.
While these risks were categorized into distinct groups (geological, environmental, technological, social, and political–regulatory), in practice, they are highly interdependent.
For example, geological risks, such as low permeability and reservoir heterogeneity, directly impact technological risks, as more advanced extraction methods (e.g., hydraulic fracturing and CO₂ injection) are required to enhance recovery.
Technological risks, in turn, influence environmental risks, as the use of enhanced recovery methods increases the likelihood of groundwater contamination or emissions.
Social risks, including public opposition to new drilling projects, are often triggered by environmental concerns and regulatory uncertainties.
Political and regulatory risks exacerbate economic risks, as sudden changes in tax policy or environmental regulations can make certain extraction methods financially unfeasible.
Recognizing these interdependencies is essential for developing a comprehensive risk assessment model, as isolated analysis of each category may overlook cascading effects that can significantly alter project feasibility and profitability.
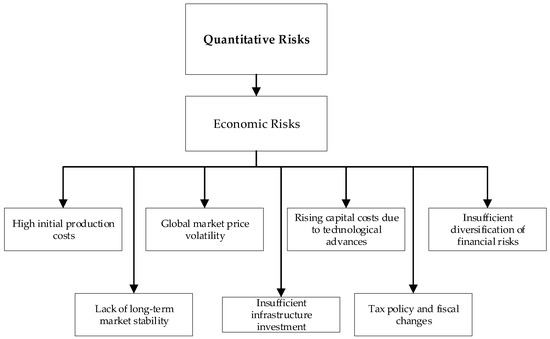
Figure 4.
Quantitative risks in projects for the development of hard-to-recover hydrocarbon reserves (created by the authors).
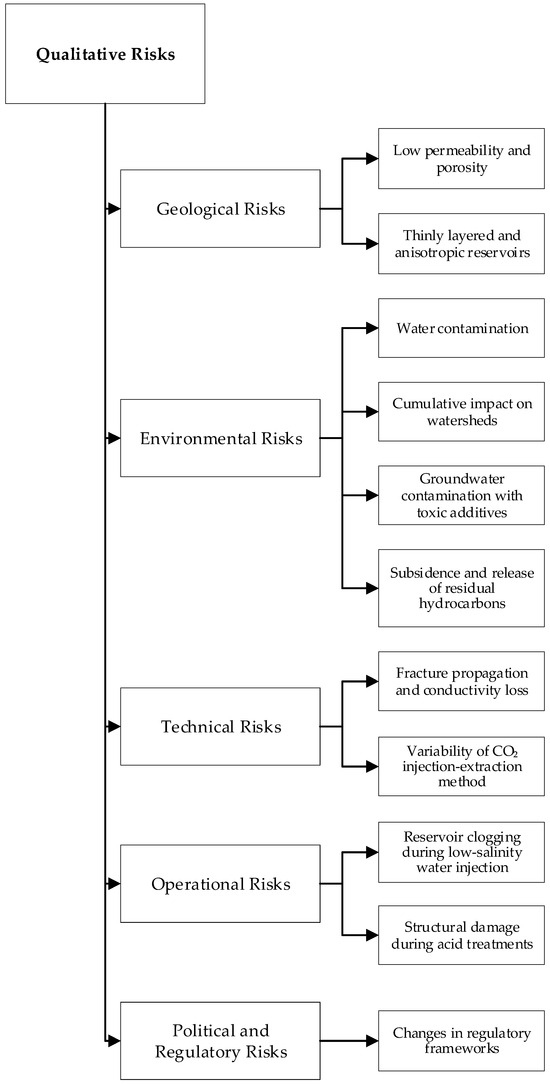
Figure 5.
Qualitive risks in projects for the development of hard-to-recover hydrocarbon reserves (created by the authors).
To further develop the methodology and apply it in practice, the categories of technical and operational risks will be combined into a single category of technological risks. Technical and operational risks often arise due to the same factors: design (engineering) errors, equipment failures, violations of technological regulations, etc. At the same time, “operational” risks are typically associated with the practical use or operation of specific technology or equipment. Factors leading to operational failures often originate at earlier stages, such as during design, material selection, or improper process setup. Thus, their separation may be artificial, as both types of risks stem from similar technical and engineering processes.
In scientific literature devoted to the development of hard-to-recover hydrocarbon reserves, the focus is usually placed on geological, technological, economic, and to some extent, environmental aspects, while the category of social risks is often undervalued or entirely overlooked.
This occurs due to the complexity of formalizing parameters such as public protest sentiments, perceptions of environmental threats, and interactions with local communities. Additionally, it stems from the historical emphasis of most researchers on quantitative methods, which are more convenient for addressing geology, finance, or technical issues. However, insufficient attention to the social component often leads to project delays, cost increases, and conflicts, potentially undermining the economic efficiency and reputation of the company. For this reason, the proposed methodology includes the assessment of social risks, alongside geological, environmental, technological, and political–regulatory risks, ensuring a more comprehensive management of uncertainties in field development.
The scientific novelty of this approach lies in integrating qualitative components reflecting the social environment into a unified risk assessment model using fuzzy logic and probabilistic methods. This allows the formalization of various levels of social tension and their possible impacts on the project, consideration of their interconnections with other categories, and, thereby, achieving a high degree of complexity in planning and management.
The development of hard-to-recover hydrocarbon reserves is characterized by a unique and multidimensional risk landscape. These projects face challenges spanning geological, technological, environmental, social, and regulatory domains, each capable of significantly impacting project feasibility and outcomes. The inclusion of these specific risk categories in the proposed methodology is driven by their critical role in defining project uncertainty and their interdependencies, which amplify their impact on economic viability.
HTR reservoirs, such as those with low permeability or thinly layered structures, pose significant challenges requiring advanced technologies, like hydraulic fracturing. These reservoirs inherently carry uncertainties related to fluid flow dynamics and production rates, necessitating their integration into the methodology to account for reservoir heterogeneity. Geological risks are foundational to successful resource extraction and influence decisions related to exploration and production technologies.
Technological risks, including equipment failures, variability in extraction methods, and the efficacy of enhanced oil recovery (EOR) techniques, directly affect operational efficiency and cost management. These risks demand rigorous modeling, as they often stem from the interplay of engineering constraints and innovative technologies tailored to unconventional reservoirs. Their inclusion ensures the methodology addresses uncertainties that could disrupt operational processes or lead to inflated capital expenditures.
Environmental risks encompass critical uncertainties, such as water contamination potential, greenhouse gas emissions, and the cumulative impact of operations on ecosystems. These risks are particularly acute for projects in highly regulated or ecologically sensitive areas. Incorporating environmental risks allows the methodology to address public concerns, regulatory compliance, and long-term sustainability, aligning with global trends in responsible resource management.
Social risks, including public opposition, workforce availability, and community perceptions of environmental threats, are often underestimated yet profoundly affect project timelines and costs. These risks are complex and subjective, complicating their quantification. Their inclusion reflects the need to address stakeholder concerns and secure local acceptance, which is vital for project continuity and reputation management.
Changes in regulatory frameworks and geopolitical dynamics can drastically alter the financial landscape of hydrocarbon projects. The unpredictability of these factors introduces an additional layer of uncertainty that cannot be ignored. By integrating regulatory and political risks, the methodology ensures project evaluations remain resilient to external shocks and policy shifts.
The comprehensive nature of the selected risks aligns with a hybrid approach combining Monte Carlo simulation and fuzzy logic. This integration enables the methodology to account for both stochastic quantitative uncertainties and subjective qualitative factors, creating a holistic risk assessment tool. By systematically incorporating these critical risk categories, the methodology enhances its relevance and applicability to the complex, uncertain environment of HTR hydrocarbon development.
Thus, the proposed methodological approach extends the boundaries of traditional analysis, laying the groundwork for more precise risk assessments encompassing both techno-economic and sociocultural aspects, which aligns with contemporary global trends in corporate sustainability and responsible resource management.
4.2. Methodological Foundations of Stochastic Modeling Using Monte Carlo Simulation
Monte Carlo simulation serves as the primary stochastic tool for modeling quantitative risks associated with the development of HTR hydrocarbon reserves. These risks, including price volatility, possible variability in the production tax rate, and variability in capital and operational expenditures, are inherently probabilistic and require advanced statistical methods for accurate evaluation. The methodology starts by defining input parameters, such as cost distributions, production rates, and market prices, based on historical data, industry standards, or expert assessments.
Monte Carlo simulation uses thousands of iterations to model potential project outcomes under varying conditions. In each iteration, random input data drawn from predefined probability distributions are used to calculate key performance indicators of the project, such as the net present value (NPV), internal rate of return (IRR), and payback periods. For example, oil prices might follow a normal distribution, while production volumes could exhibit a triangular distribution to capture their asymmetric nature. These iterations collectively produce probabilistic outcome distributions, allowing a more nuanced understanding of the project’s risk profile.
This method is particularly effective in scenarios with high levels of uncertainty, as it provides a probabilistic framework for assessing the impact of quantitative risk factors. By generating a range of potential outcomes, Monte Carlo simulation enables stakeholders to identify potential best- and worst-case scenarios, thereby facilitating informed decision-making with risk considerations.
4.3. Application of Fuzzy Logic for Qualitative Risk Assessment
Unlike quantitative risks, qualitative risks—such as technological, environmental, and social risks—are often characterized by subjectivity and ambiguity, making them difficult to model using standard statistical methods. To address this challenge, the methodology employs fuzzy logic, a computational approach designed to handle uncertainties and linguistic variables.
The process begins with the formalization of qualitative risks using linguistic variables that describe risk levels, such as “Low”, “Medium”, and “High” [112]. For example, technological risks may involve uncertainty related to equipment failures, environmental risks may include the likelihood of water contamination, and social risks may reflect community resistance or workforce issues. Each variable is assigned a membership function, typically triangular or trapezoidal, which maps these linguistic terms to numerical values within a defined range.
The fuzzy logic system then applies a set of “if–then” rules to model interactions between various risks. For instance:
Rule 1: “If technological risk is High and environmental risk is Medium, then the overall risk is High”.
Rule 2: “If all risks are Low, then the overall risk is Minimal”.
Using these rules, the fuzzy inference mechanism processes input variables to yield a fuzzy set representing the overall qualitative risk [113]. This fuzzy result is then defuzzified using methods such as the center-of-gravity method to obtain a crisp numerical value that quantitatively evaluates the aggregated qualitative risk. This value is normalized within a range (e.g., from 0 to 1) and serves as input for subsequent modeling stages [112].
4.4. Development of an Integrated Methodology Combining Monte Carlo and Fuzzy Logic
The methodology for integrating qualitative risks into Monte Carlo simulation is based on a step-by-step approach, allowing for the consideration of both quantitative and qualitative risks affecting the project. The process begins with identifying all potential risks. Quantitative risks, such as oil price volatility, possible variability in the production tax rate, and fluctuations in capital and operational costs, are amenable to statistical modeling and are inherently objective. In contrast, qualitative risks—technological, environmental, and social—are characterized by uncertainty and subjectivity, requiring methods capable of processing linguistic information. Schematically, this methodology can be represented as a diagram in Figure 6.
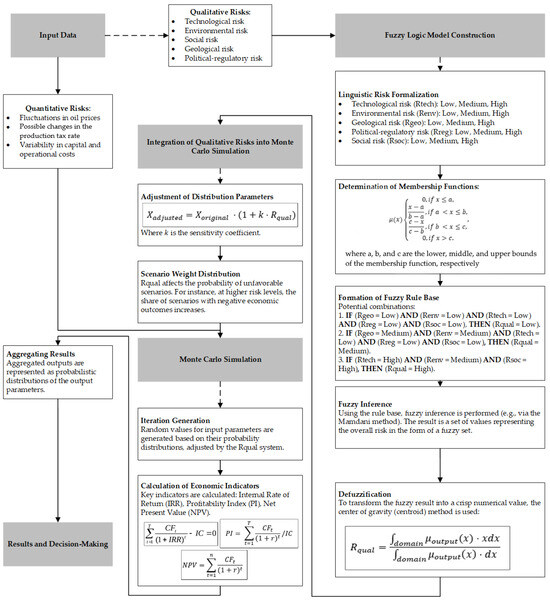
Figure 6.
Diagram of the proposed methodology (created by the authors).
To evaluate qualitative risks, a fuzzy-logic-based approach was employed. In the first stage, these risks were formalized using linguistic variables, such as “Low”, “Medium”, and “High”, for each type of risk.
Linguistic risk formalization:
- Geological risk (Rgeo): {Low, Medium, High}.
- Environmental risk (Renv): {Low, Medium, High}.
- Technological risk (Rtech): {Low, Medium, High}.
- Political–regulatory risk (Rreg): {Low, Medium, High}.
- Social risk (Rsoc): {Low, Medium, High}.
For example, technological risk may reflect the potential inefficiency of technology deployment, environmental risk may involve the probability of accidents or increased regulatory requirements, and social risk may include community resistance or a lack of qualified personnel. In the next stage, membership functions are defined, which translate linguistic terms into numerical form using mathematical functions, such as triangular or trapezoidal curves.
Example for «Low» level:
Example for «Medium» level:
Example for «High» level:
After defining these membership functions, a fuzzy inference rule base was constructed, describing the interactions between various risks and their influence on the final qualitative risk.
The thresholds of 0.3, 0.5, and 0.8 in the proposed risk assessment methodology were defined to segment the continuous spectrum of risk probabilities into discrete intervals that reflect meaningful shifts in project uncertainty and decision-making priorities. These critical thresholds align with inflection points in probabilistic distributions modeled through Monte Carlo simulations and fuzzy logic. Their scientific rationale is grounded in the following interrelated factors.
The selection of 0.3 as the upper boundary for low risk corresponds to scenarios where cumulative deviations from expected outcomes remain minimal. This threshold aligns with probabilistic modeling results, where 30% represents a conservative limit for uncertainties falling within standard deviations of key performance indicators, such as production rates or costs. Risks below this level are typically manageable through routine operational measures, as evidenced by historical data from HTR hydrocarbon projects. For instance, in stable geological formations or projects employing established technological approaches, uncertainty rarely exceeds this threshold, validating its role in classifying risks as low.
The 0.5 boundary, marking the transition from low to moderate risk, corresponds to the median of the risk probability distribution, where uncertainties exhibit higher variance and nonlinear impacts on project outcomes. This threshold is theoretically rooted in decision-making theory, where mid-range probabilities (e.g., 50%) represent conditions of maximum outcome ambiguity, necessitating structured risk mitigation strategies. In the context of this methodology, 0.5 serves as a critical juncture for qualitative risks, such as environmental compliance or social acceptance, where overlapping uncertainties require integration into quantitative frameworks. Empirically, this level reflects observations from HTR projects, where moderate variability in costs or technical performance leads to significant shifts in economic metrics, such as NPV or IRR.
The 0.8 threshold signifies high risk, representing scenarios where uncertainty dominates the probabilistic landscape, and the likelihood of adverse outcomes becomes substantial. Theoretically, this aligns with the upper quartile of risk distributions, where compounding technological, environmental, or regulatory uncertainties disproportionately affect project feasibility. Empirical studies cited in the paper validate 0.8 as a high-risk threshold, demonstrating that extreme values in Monte Carlo simulations highlight exponential escalations in economic losses or project delays when critical uncertainties are unaddressed. Additionally, this boundary correlates with critical points in fuzzy logic systems, where membership functions for high-risk scenarios approach maximum values, signaling decisive intervention points.
These thresholds are not arbitrary but derived from a synthesis of probabilistic modeling, fuzzy logic principles, and empirical validation. The values 0.3, 0.5, and 0.8 correspond to distinct segments of risk impact on project outcomes, ensuring the methodology accounts for both stochastic and qualitative uncertainties. By incorporating these scientifically grounded thresholds, the methodology provides a robust framework for classifying and managing risks in hard-to-recover hydrocarbon projects. This segmentation enhances decision-making efficiency, ensuring resource allocation and mitigation strategies are proportionate to risk magnitude and probability.
Table 8 contains the fuzzy rule base.
Table 8.
The fuzzy rule base (created by the authors).
In some projects, a single risk at the “High” level can immediately elevate the overall risk to “High”. It all depends on the weighting coefficients and policies defined by experts.
Based on these rules, the fuzzy inference process transformed input risk data into a range of possible values for the final risk. To obtain a clear result, defuzzification was performed, converting the fuzzy inference output into a numerical value of the final risk Rqual:
The resulting Rqual value was normalized (e.g., within a range of 0 to 1) to reflect the overall qualitative risk.
The next stage involved integrating qualitative risks into Monte Carlo simulation. Here, the Rqual value was used to adjust the parameters of quantitative risk distributions:
where k is the sensitivity coefficient.
The selection and calibration of the coefficient k played a crucial role in ensuring that qualitative risk assessments were meaningfully incorporated into the Monte Carlo simulation framework. The coefficient k determined the extent to which qualitative risks (Rqual) influenced the numerical parameters of the model, such as cost variability or production uncertainty. To ensure its robustness and practical relevance, the calibration of k was based on a combination of expert judgment, historical analogs, and statistical validation.
First, expert evaluation served as the initial basis for determining k. Industry specialists, including reservoir engineers, environmental risk analysts, and financial planners, provided estimates of how qualitative risk factors—such as regulatory uncertainty or social opposition—typically impact key project parameters. These assessments were expressed in percentage terms, indicating how much a “Moderate” or “High” risk scenario was expected to increase capital expenditures (CAPEX) or reduce production rates. For example, experts might estimate that strong social resistance typically leads to a 15–20% increase in cost variability. Such expert-derived estimates established the initial target range for k.
Second, where possible, historical data from analogous projects were analyzed to derive empirical multipliers. This involved identifying real-world cases where social, environmental, or regulatory risks have led to observable cost overruns or production delays. If historical records indicated that projects operating under high regulatory risk experienced CAPEX increases in the range of 15–20%, then k was calibrated such that when Rqual ≈ 1, the adjusted value, Xadjusted, aligned with this empirically observed range. This approach ensures that the model reflects actual industry behavior rather than relying solely on theoretical assumptions.
Finally, statistical testing was performed to validate and fine-tune k. Monte Carlo simulations were run using different values of k (e.g., 0.1, 0.2, and 0.3) to assess which value provided the best agreement between model outputs and historical or pilot project data. This step is essential to avoid both over-sensitivity, where small qualitative risks result in exaggerated quantitative impacts, and under-sensitivity, where qualitative risks fail to meaningfully influence the simulation outcomes. By systematically testing different k values, the model was refined to ensure that it realistically translated qualitative uncertainties into quantitative adjustments.
For example, an elevated level of qualitative risk can increase the variance in the distribution of capital costs or reduce the expected production volumes, which are initially plotted as inputs to the project. Additionally, Rqual was applied to scenario weighting, reflecting the probability of adverse events. Thus, qualitative risk adjusted not only the shape of distributions but also the probability of certain scenarios, such as low project performance due to social protests.
At the Monte Carlo simulation stage, random values of input parameters were generated, incorporating both quantitative risks and adjusted qualitative risks. For each iteration, the project’s key indicators, such as net present value (NPV), internal rate of return (IRR), and payback period, were calculated. After completing numerous iterations, probabilistic distributions of economic indicators were formed, enabling the assessment of the cumulative impact of all risks.
At the final stage, the results were analyzed. The indicator distributions allowed the identification of the most probable scenarios and the range of NPV and IRR values, as well as an evaluation of the influence of various risks on the overall project efficiency. Sensitivity analysis highlighted the parameters most impacted by qualitative risks. Based on the simulation results, recommendations for risk management were developed, such as technology testing or measures to engage with local communities.
4.5. Practical Application of the Developed Methodology
To better illustrate the applicability of this method, let us consider the process of applying this methodology on a hypothetical oil field with low-permeability reservoirs.
1. Description of the field
Reservoir type: a layered formation analogous to the Bazhenov horizon (low porosity ~5%, permeability ~0.01–0.1 mD, and highly heterogeneous).
Geological/physical parameters (averaged):
(1) Original oil in place (OOIP)~200 million barrels
(2) Low saturation, thinly layered collector
(3) Reservoir pressure ~ 250 bar, close to normal
(4) Project plan: 10 horizontal wells with multi-stage fracturing (MSF) brought online in stages over 3 years. Project lifespan is 15 years.
Key features:
(1) Strong sensitivity to multi-stage hydraulic fracturing (MSF) design and quality.
(2) Potential need for a pressure-maintenance approach (injection of gas or water).
(3) Limited regional infrastructure (logistics constraints).
2. Qualitative risks and their linguistic assessments
According to the methodology, we identified multiple risk categories, which we, therefore, treated with fuzzy logic. Table 9 shows the risk categories that were assessed using fuzzy logic.
Table 9.
The risk categories (created by the authors).
3. Example of a fuzzy rule base
Below are representative examples of if–then statements:
(1) Rule 1: If (Rgeo = Medium) AND (Rtech = Medium) AND (Rreg = Medium) AND (Rsoc = Low) AND (Renv = Low), then Rqual = Medium.
(2) Rule 2: If (Rgeo = High) OR (Rtech = High), then overall risk = High.
…and so forth.
After fuzzy inference (using membership functions and rule aggregation), assume the numerical result is Rqual ≈ 0.52, signifying a slightly above-medium risk level.
4. Linking the qualitative risk Rqual to Monte Carlo
4.1. Quantitative input distributions
To compute economic indicators (NPV and IRR) via Monte Carlo, we defined probability distributions for the main parameters:
(1) Oil price: triangular (60, 70, 80)—minimum USD 60/bbl, most likely USD 70, and maximum USD 80.
(2) Tax rate (e.g., production tax or rent): uniform (5, 8) USD/bbl.
(3) Initial production rate: About 200 barrels per day. Flow rate drop and complex entry are omitted for clarity.
(4) CAPEX per well: triangular (USD 3 million, 5 million, and 7 million).
(5) OPEX: in the range of USD 8–112/bbl.
4.2. Adjusting parameters based on Rqual.
Suppose we decide that a medium overall fuzzy risk (~0.5) translates into increased variance of certain parameters, reflecting higher project uncertainty. For instance, for CAPEX per well, we added 10% to the range:
with Rqual ≈ 0.52,
Similarly, if the medium political risk suggests a potential tax hike, we might expand the tax range from 8–12 USD/bbl to 9–13 USD/bbl, proportionally. Hence, the qualitative assessment influences the probability distributions used in Monte Carlo.
5. Executing the Monte Carlo simulation
(1) Number of iterations: 5000 (for example).
(2) In each iteration:
a. Randomly sample the oil price, tax rate, initial production, CAPEX (adjusted ~1.052), OPEX, etc.
b. Calculate the project’s discounted cash flows over 15 years → NPV and IRR.
(3) After 5000 iterations, we obtain an empirical distribution of NPV.
6. Illustrative results
Using MATLAB software (ver. R2024a), with the above input data and taking into account the resulting qualitative risk factor, a script was written to conduct a Monte Carlo simulation (Appendix A). The results are presented in Figure 7, Figure 8 and Figure 9.
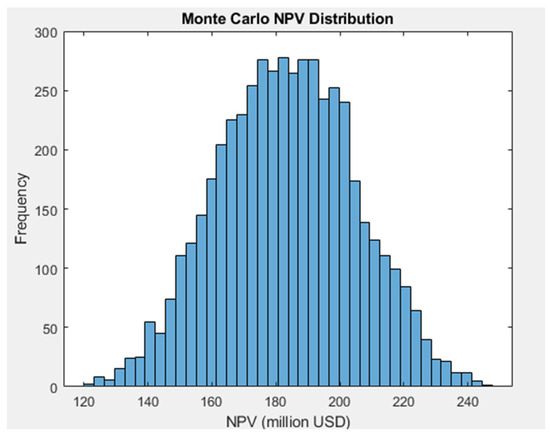
Figure 7.
NPV distribution (created by the authors).

Figure 8.
IRR distribution (created by the authors).

Figure 9.
PI distribution (created by the authors).
We obtained the following distribution statistics:
- Mean (average) NPV: USD 280 million
- Median (P50): USD 270 million
- P10 (optimistic 10th percentile): USD 450 million
- P90 (pessimistic 90th percentile): USD 100 million
- Probability of negative NPV: ~7%
The Monte Carlo simulation results for NPV revealed a near-normal distribution with a mean value of approximately USD 183.37 million and a median of USD 183.32 million, indicating a well-balanced investment scenario. The P10 value (USD 155.46 million) and P90 value (USD 211.68 million) demonstrated the range within which NPV was likely to fall with 80% confidence, signifying moderate financial risk. The absence of negative NPV values (0% probability) suggests a robust economic feasibility of the project.
The IRR distribution followed a slightly right-skewed pattern, reflecting variations in project returns due to fluctuating market conditions. The mean IRR was 74.97%, with a median IRR of 72.69%, which is indicative of strong investment attractiveness. The P10 value (57.54%) and P90 value (95.79%) highlighted a broad return spectrum, reinforcing the significance of risk mitigation strategies. Despite the inherent uncertainties, the high average IRR suggests that the project holds considerable potential for profitability.
The PI distribution further supported the project’s financial viability. With a mean PI of 4.63 and a median PI of 4.49, the results suggested a high return on investment relative to costs. The P10 value (3.57) and P90 value (5.89) indicated a range that remained above the threshold for acceptable investments. This distribution underscores the efficiency of capital allocation and the project’s resilience under various market conditions.
The combined use of Monte Carlo simulations and fuzzy logic in risk assessment offers a more holistic evaluation of uncertainties in hydrocarbon field development. The results indicated a financially promising investment with a well-contained risk profile. However, continuous monitoring and adaptive management strategies are recommended to mitigate external uncertainties, particularly related to regulatory, environmental, and technological factors. These findings provide a robust foundation for informed decision-making in the development of hard-to-recover hydrocarbon reserves.
5. Discussion
The integration of Monte Carlo simulation and fuzzy logic provides a new approach to risk assessment associated with HTR hydrocarbon resources. This study tackled a major limitation of traditional methods—the difficulty of accounting for qualitative uncertainties together with quantitative factors. By combining the probabilistic rigor of Monte Carlo modeling with the flexible representation of linguistic variables enabled by fuzzy logic, the methodology enabled a more holistic and realistic portrayal of project risks.
Compared to traditional risk assessment methods that primarily rely on either purely quantitative tools or stand-alone qualitative techniques, our hybrid approach demonstrated several advantages. First, standard Monte Carlo simulation effectively quantifies stochastic elements, such as price volatility and production rates, but struggles to incorporate subjective risks, like environmental concerns or social resistance. Similarly, solely using fuzzy logic for risk assessment provides a mechanism to handle ambiguous data but often lacks the probabilistic depth needed to evaluate extreme economic scenarios. By integrating these two methods, the proposed framework captured both the variability of measurable factors and the nuanced influences of qualitative risks.
This contrasts with other hybrid approaches, such as Bayesian networks or scenario-based analyses, which can offer structured ways to model causal dependencies but often require extensive historical datasets to calibrate conditional probabilities. In HTR hydrocarbon projects, where geological complexity and limited empirical data are common, calibrating Bayesian networks may become infeasible. Our framework alleviated this data-intensive requirement by using expert-driven fuzzy logic to represent qualitative risks, which were then directly translated into probability distribution adjustments within Monte Carlo. This allowed for an adaptive mechanism that can accommodate new expert insights and field data without overhauling the entire model.
Furthermore, the proposed methodology refined risk weighting by systematically linking fuzzy logic outputs (e.g., social risk intensity) to the shape or spread of quantitative distributions in Monte Carlo simulations. In traditional workflows, these dimensions are often separated: social and environmental aspects remain qualitative, whereas production and cost data typically undergo quantitative modeling. Here, a shift in fuzzy-based social risk from low to medium can dynamically change the variance or mean of capital expenditure, reflecting practical realities, such as project delays or added mitigation costs. This integrated treatment results in a more consistent representation of how real-world uncertainties compound and influence project feasibility.
Additionally, by combining fuzzy membership functions and iterative sampling, the methodology offers flexibility in scaling the relative importance of individual risk categories. This is particularly relevant in high-stakes, multidimensional environments like HTR hydrocarbon developments, where geological uncertainties can overlap with policy changes or stakeholder resistance. Traditional methods may underestimate these interdependencies by treating risks as isolated or static.
Despite these advantages, the hybrid approach still faces challenges. Reliance on expert input for fuzzy logic introduces a degree of subjectivity, and the computational costs of large-scale Monte Carlo runs may increase when incorporating dynamically adjusted distributions. Nonetheless, these limitations are counterbalanced by the richer insight gained into the interplay of quantitative and qualitative factors.
Nevertheless, certain limitations merit explicit acknowledgment. The accuracy and reliability of this hybrid approach depend heavily on the quality of input data, both in terms of historical records (for calibrating probability distributions in Monte Carlo simulations) and expert judgments (for defining membership functions in fuzzy logic). In HTR hydrocarbon projects, where field data may be sparse and geological conditions vary significantly, achieving robust statistical parameters can be challenging. Moreover, establishing well-founded fuzzy rules often requires multiple rounds of expert elicitation, which can be time-consuming and prone to bias if experts disagree or lack consensus.
Computational complexity also increases as the number of risk factors grows, since each additional parameter broadens the scope of the Monte Carlo simulation and may require multiple iterations to capture the effects of fuzzy logic adjustments. For large-scale projects involving many wells or complex supply-chain networks, running thousands or even tens of thousands of Monte Carlo iterations can become resource-intensive. Although modern computing power can often handle these loads, organizations with limited computational resources must plan accordingly.
In summary, the proposed hybrid methodology outperformed traditional risk assessment approaches by systematically integrating diverse uncertainties into a unified model. While purely quantitative or qualitative methods may overlook critical dimensions of HTR project risk, the combined Monte Carlo–fuzzy logic framework enables a more comprehensive and adaptable evaluation. By doing so, it offers stakeholders a robust foundation for decision-making, potentially improving the sustainability and economic outcomes of hard-to-recover hydrocarbon developments. Future research should focus on improving the mechanisms for integrating fuzzy logic and Monte Carlo simulation to enhance computational efficiency. Furthermore, extending the system by incorporating advanced machine learning methods for real-time data processing could improve its predictive capabilities.
The findings of this study contribute to both the theoretical and practical understanding of risk assessment in the development of HTR hydrocarbons. By providing a multidimensional assessment tool, this work enables decision-makers to make more informed choices under high uncertainty, ultimately promoting the sustainable and economically viable extraction of HTR resources.
6. Conclusions
This study developed a hybrid methodological framework combining Monte Carlo simulation and fuzzy logic to address the complex issue of risks associated with HTR hydrocarbon reserves. The results demonstrated the effectiveness of this approach, which combined the probabilistic rigor of quantitative methods with the flexibility required to manage qualitative uncertainties, such as social acceptability and environmental impact.
The proposed methodology serves as a comprehensive risk assessment tool capable of reflecting the multifaceted nature of challenges inherent in the development of HTR resources. Its ability to integrate various categories of risks—including geological, technological, social, and environmental factors—enables decision-makers to better anticipate and mitigate potential setbacks. Moreover, this approach aligns with global trends toward sustainable resource management, balancing economic feasibility with environmental responsibility.
However, the study also highlighted areas requiring further refinement. Enhancing the integration of qualitative and quantitative risk factors to improve computational efficiency, as well as incorporating real-time data processing capabilities, could further expand the applicability of this system. Testing the methodology in other high-risk sectors, such as renewable energy or critical infrastructure development, could provide valuable insights into its adaptability.
Ultimately, this research contributes to the theoretical and practical understanding of risk management in the energy sector, providing stakeholders with a reliable tool to navigate the uncertainties of HTR hydrocarbon projects. By supporting informed decision-making, this methodology promotes the sustainable and economically viable extraction of vital energy resources.
Author Contributions
Conceptualization, T.S.; methodology, T.S. and I.S.; formal analysis, I.S.; investigation, I.S.; writing—original draft preparation, T.S. and I.S. All authors have read and agreed to the published version of the manuscript.
Funding
This research received no external funding.
Data Availability Statement
The data used in this study are publicly available in the data from public sources. All the data used are presented in the tables within the article.
Conflicts of Interest
The authors declare no conflicts of interest.
Abbreviations
The following abbreviations are used in this manuscript:
| HTR | Hard-to-recover |
| CBM | Coalbed methane |
| EOR | Enhanced oil recovery |
| MSF | Multi-stage hydraulic fracturing |
| NPV | Net present value |
| IRR | Internal rate of return |
| PI | Profitability index |
Appendix A
Monte Carlo MATLAB Script
%% MC + Fuzzy Example with IRR and PI
% Demonstrates NPV, IRR, and profitability index (PI) for a small scale
% HTR project scenario, incorporating a “fuzzy-based risk” factor Rqual.
clear; clc; rng(‘shuffle’); % Cleanup workspace, random seed
%% -------------------------------
% 0. Basic Settings
% -------------------------------
numIterations = 5000; % Monte Carlo iterations
projectYears = 10; % 10-year project horizon
discountRate = 0.10; % 10% discount
nWells = 10; % 10 horizontal wells
dailyRate = 200; % 200 bbl/day per well (no decline for simplicity)
R_qual = 0.52; % from fuzzy logic block => “slightly above medium”
% Explanation of distributions (before risk adjustments):
% (1) Oil Price: Triangular(60,70,80) $/bbl
% (2) Tax: Uniform(5,8) $/bbl
% (3) OPEX: Uniform(8,12) $/bbl
% (4) CAPEX/well: Triangular(3,5,7) million USD
%
% We will incorporate “R_qual = 0.52” by:
% - adding ~+5.2% to CAPEX
% - shifting tax distribution from (5..8) to (6..9), e.g., +1.0
%
% We will calculate for each iteration:
% - NPV using 10% discount
% - IRR by building a cashflow vector CF (0..10)
% - PI (profitability index)
%% -------------------------------
% 1. Sample Probability Distributions
% -------------------------------
% (1) Oil Price => Triangular(60, 70, 80)
oilPrice = sampleTriangular(60, 70, 80, numIterations);
% (2) Tax => baseline Uniform(5,8). For “Medium” risk => shift => (6,9)
taxMinBase = 5; taxMaxBase = 8;
taxMin = taxMinBase + 1;
taxMax = taxMaxBase + 1;
taxSample = taxMin + (taxMax - taxMin)*rand(numIterations,1);
% (3) OPEX => Uniform (8,12)
opexMin = 8; opexMax = 12;
opexSample = opexMin + (opexMax - opexMin) * rand(numIterations,1);
% (4) CAPEX => Triangular(3, 5, 7) million USD => multiply by (1 + 0.1 * R_qual) => −1.052
capexBase = sampleTriangular(3, 5, 7, numIterations);
capexFinal = capexBase. * (1 + 0.1 * R_qual);
%% -------------------------------
% 2. Set up Monte Carlo
% -------------------------------
NPV_values = zeros(numIterations, 1);
IRR_values = zeros(numIterations, 1);
PI_values = zeros(numIterations, 1);
% We will assume each well has a constant dailyRate bbl/day, no decline,
% for 10 years. (Simplified.)
% daily * 365 => annual barrels per well => * nWells => total
dailyPerWell = dailyRate; % bbl/day
annualBblOneWell = dailyPerWell * 365;
annualBblField = annualBblOneWell * nWells;
% We will treat time = 0 as the moment we pay all CAPEX, then for years 1..10
% we get net revenue. This is more standard for IRR usage:
% CF(1) = - totalCapex (at t = 0)
% CF(t + 1) = net revenue at year t, for t = 1..10
% Then we discount it to get NPV or use IRR.
for i = 1:numIterations
price_i = oilPrice(i); % $/bbl
tax_i = taxSample(i); % $/bbl
opex_i = opexSample(i); % $/bbl
capexWell = capexFinal(i); % million USD per well
% Revenue each year => (price − tax − opex) * annualBblField
revenuePerYear = (price_i − tax_i − opex_i) * annualBblField;
% total CAPEX => nWells * capexWell * 1e6 ( convert to $ )
totalCapex = nWells * capexWell * 1e6;
%–--------------------
% Build CF array: length = projectYears + 1
% CF(1) => time = 0 => - CAPEX
% CF(t + 1) => time = t => revenue (t = 1..10)
%---------------------
CF = zeros (projectYears + 1,1);
CF(1) = -totalCapex; % at t = 0
for t = 1:projectYears
CF(t + 1) = revenuePerYear; % at end of each year
end
% --- (2a) NPV (using discountRate)
% NPV = sum(CF[t]/(1 + discountRate)^t ), t = 0..projectYears
% We will do it manually:
NPV_ = 0;
for t = 0:projectYears
NPV_ = NPV_ + CF(t + 1)/(1 + discountRate)^t;
end
% --- (2b) IRR
% Using built-in “irr” from Financial Toolbox (if available)
irr_val = NaN;
try
irr_val = irr(CF);
catch
% If user does not have Financial Toolbox, skip or do a custom solver
end
% --- (2c) PI (profitability index)
% Usually, PI = (present value of future inflows)/(|initial outflow|)
% Here, initial outflow is CF(1). Future inflows are CF(2..end) discounted.
discountedIn = 0;
for t = 1:projectYears
discountedIn = discountedIn + CF(t + 1)/(1 + discountRate)^t;
end
initInvestment = abs(CF(1)); % positive number
if initInvestment > 0
PI_ = discountedIn/initInvestment;
else
PI_ = NaN;
end
% Store
NPV_values(i) = NPV;
IRR_values(i) = irr_val; % might be NaN if “irr” not available
PI_values(i) = PI;
end
%% -------------------------------
% 3. Analyze & Display
% -------------------------------
meanNPV = mean(NPV_values);
medianNPV = median(NPV_values);
p10NPV = prctile(NPV_values, 10);
p90NPV = prctile(NPV_values, 90);
probNeg = mean(NPV_values < 0)*100;
% IRR summary
validIRR = IRR_values(~isnan(IRR_values)); % those that did not error
meanIRR = mean(validIRR) * 100;
medianIRR = median(validIRR) * 100;
p10IRR = prctile(validIRR,10) * 100;
p90IRR = prctile(validIRR,90) * 100;
% PI summary
meanPI = mean(PI_values);
medianPI = median(PI_values);
p10PI = prctile(PI_values,10);
p90PI = prctile(PI_values,90);
fprintf(‘--- Monte Carlo (n = %d), HTR Example with IRR & PI ---\n', numIterations);
fprintf(‘Discount rate = %.1f%%\n′, discountRate * 100);
fprintf(‘\nNPV Results (USD):\n′);
fprintf(‘ Mean NPV: %0.2f\n′, meanNPV);
fprintf(‘ Median NPV: %0.2f\n′, medianNPV);
fprintf(‘ P10 NPV: %0.2f\n′, p10NPV);
fprintf(‘ P90 NPV: %0.2f\n′, p90NPV);
fprintf(‘ Probability of negative: %0.2f %%\n′, probNeg);
if ~isempty(validIRR)
fprintf(‘\nIRR Results (%%):\n′);
fprintf(‘ Mean IRR: %0.2f %%\n′, meanIRR);
fprintf(‘ Median IRR: %0.2f %%\n′, medianIRR);
fprintf(‘ P10 IRR: %0.2f %%\n′, p10IRR);
fprintf(‘ P90 IRR: %0.2f %%\n′, p90IRR);
else
fprintf(‘\nIRR could not be computed. Possibly no Financial Toolbox.\n’);
end
fprintf(‘\nPI Results:\n′);
fprintf(‘ Mean PI: %0.2f\n′, meanPI);
fprintf(‘ Median PI: %0.2f\n′, medianPI);
fprintf(‘ P10 PI: %0.2f\n′, p10PI);
fprintf(‘ P90 PI: %0.2f\n′, p90PI);
% Plot histograms
figure(‘Name’,’NPV Distribution’);
histogram(NPV_values/1e6, 40);
xlabel(‘NPV (million USD)’);
ylabel(‘Frequency’);
title(‘Monte Carlo NPV Distribution (Moderate Example)’);
% If IRR was computed:
if ~isempty(validIRR)
figure(‘Name’,’IRR Distribution’);
histogram(validIRR*100, 40);
xlabel(‘IRR (%)’);
ylabel(‘Frequency’);
title(‘IRR Distribution (HTR Example)’);
end
figure(‘Name’,’PI Distribution’);
histogram(PI_values, 40);
xlabel(‘Profitability Index (PI)’);
ylabel(‘Frequency’);
title(‘PI Distribution (HTR Example)’);
%% ===========================
% Triangular Sampling Function
% ===========================
function x = sampleTriangular(a, m, b, n)
% sampleTriangular generates n random samples from a triangular distribution
% with lower limit a, mode m, and upper limit b.
%
% usage: x = sampleTriangular(a, m, b, n)
% method: Inverse transform.
x = zeros(n,1);
Fmode = (m - a)/(b - a);
U = rand(n,1);
for k = 1:n
if U(k) < Fmode
x(k) = a + sqrt(U(k) * (b − a) * (m − a));
else
x(k) = b − sqrt((1 − U(k)) * (b - a) * (b − m));
end
end
end
References
- Lushpeev, V.A.; Sokolov, A.N.; Galtseva, O.A.; Salimgareeva, E.M. Methodological Framework for Tight Reserve Provement for a Carbonate Reservoir. Actual Probl. Oil Gas 2023, 2, 201–215. [Google Scholar] [CrossRef]
- Kryukov, V.A.; Tokarev, A.N. Creation of Conditions for the Development of Hard-to-Recover Oil Reserves: Regional Aspects. Econ. Reg. 2022, 18, 755–769. [Google Scholar] [CrossRef]
- Ankudinov, A.A.; Arkhipov, V.N.; Starikov, M.A. Features of Technological Solutions for Developing TRIZ Reservoirs with Ultra-Low Permeability and Abnormally High Formation Pressure. Expoziya Neft I Gaz 2022, 8, 70–74. [Google Scholar] [CrossRef]
- Bizhani, M.; Ardakani, O.H.; Hawthorne, S.B.; Cesar, J.; Kurz, B.; Percival, J.B. CO2-Enhanced Oil Recovery Mechanism in Canadian Bakken Shale. Minerals 2022, 12, 779. [Google Scholar] [CrossRef]
- Mehana, M.; Kang, Q.; Viswanathan, H. Molecular-Scale Considerations of Enhanced Oil Recovery in Shale. Energies 2020, 13, 6619. [Google Scholar] [CrossRef]
- Mukhina, E.; Cheremisin, A.; Khakimova, L.; Garipova, A.; Dvoretskaya, E.; Zvada, M.; Kalacheva, D.; Prochukhan, K.; Kasyanenko, A.; Cheremisin, A. Enhanced Oil Recovery Method Selection for Shale Oil Based on Numerical Simulations. ACS Omega 2021, 6, 23731–23741. [Google Scholar] [CrossRef] [PubMed]
- Agishev, E.R.; Andreev, V.E.; Mukhametshin, V.S.; Kotenev, A.Y.; Stepanova, R.R.; Davydov, A.Y.; Malyshev, P.M. Improving the Efficiency of Putting Oil Deposits with Hard-to-Recover Reserves of Western Siberia into Development. In SOCAR Proceedings; Oil Gas Scientific Research Project Institute: Baku, Azerbaijan, 2023; pp. 78–88. [Google Scholar]
- Grishchenko, V.A.; Gareev, R.R.; Tsiklis, I.M.; Mukhametshin, V.V.; Yakupov, R.F. Expanding the Amount of Preferential Royalty Facilities with Hard-To-Recover Oil Reserves. SOCAR Proc. 2021, 2021, 8–17. [Google Scholar] [CrossRef]
- Yuan, B.; Wood, D.A. A Holistic Review of Geosystem Damage during Unconventional Oil, Gas and Geothermal Energy Recovery. Fuel 2018, 227, 99–110. [Google Scholar] [CrossRef]
- Zhao, H.; Zheng, J.; Zhang, Z.; Qin, H.; Wang, C.; Zhu, J.; Chen, A.; Chen, L.; Liu, P.; Yang, W.; et al. Research Progress and Prospects of Oil Saturation Evaluation Methods in Shale Oil Reservoirs. Processes 2024, 12, 2421. [Google Scholar] [CrossRef]
- Gu, T.; Yu, X.; Zhang, L.; Su, X.; Wu, Y.; Jie, Y.; Wang, H.; Zhou, D. A Study on the Influence of Natural Fractures in Tight Sandstone Reservoirs on Hydraulic Fracture Propagation Behavior and Post-Fracture Productivity. Processes 2024, 12, 2813. [Google Scholar] [CrossRef]
- Male, F.; Duncan, I.J. The Paradox of Increasing Initial Oil Production but Faster Decline Rates in Fracking the Bakken Shale: Implications for Long Term Productivity of Tight Oil Plays. J. Pet. Sci. Eng. 2021, 208, 109406. [Google Scholar] [CrossRef]
- Saputra, W.; Kirati, W.; Patzek, T. Forecast of Economic Tight Oil and Gas Production in Permian Basin. Energies 2022, 15, 43. [Google Scholar] [CrossRef]
- Prischepa, O.; Nefedov, Y.; Nikiforova, V.; Ruiming, X. Raw Material Base of Russia’s Unconventional Oil and Gas Reserves (Hydrocarbons Shale Strata). Front. Earth Sci. 2022, 10, 1–22. [Google Scholar] [CrossRef]
- Yu, W.; Lashgari, H.R.; Wu, K.; Sepehrnoori, K. CO2 Injection for Enhanced Oil Recovery in Bakken Tight Oil Reservoirs. Fuel 2015, 159, 354–363. [Google Scholar] [CrossRef]
- Rafati, R.; Smith, S.R.; Sharifi Haddad, A.; Novara, R.; Hamidi, H. Effect of Nanoparticles on the Modifications of Drilling Fluids Properties: A Review of Recent Advances. J. Pet. Sci. Eng. 2018, 161, 61–76. [Google Scholar] [CrossRef]
- Li, A.; Guo, H.; Peng, W.; Yu, L.; Liang, H.; Sun, Y.; Wang, D.; Guo, Y.; Ouyang, M. Application of Resistance Ring Array Sensors for Oil–Water Two-Phase Flow Water Holdup Imaging in Horizontal Wells. Coatings 2024, 14, 1535. [Google Scholar] [CrossRef]
- Conrad, C.L.; Ben Yin, Y.; Hanna, T.; Atkinson, A.J.; Alvarez, P.J.J.; Tekavec, T.N.; Reynolds, M.A.; Wong, M.S. Fit-for-Purpose Treatment Goals for Produced Waters in Shale Oil and Gas Fields. Water Res. 2020, 173, 115467. [Google Scholar] [CrossRef]
- Zinchenko, I.A.; Sharipov, B.I.; Krutoi, A.A.; Perlova, E.V.; Leonov, S.A. Unconventional Gas Resources and Reserves in Russia and Gazprom. Oil Gas Geol. = Geol. Neft. i Gaza 2018, 4s, 87–92. [Google Scholar] [CrossRef]
- Guo, T.; Wang, L.; Meng, X.; Shafiq, M.U.; Ci, J.; Lei, W. Layered Massive Fracturing of Carrier Beds Commercially Unveils the Deep Tight Sandstone Gas Reserves in Sichuan Basin. Fuel 2025, 379, 133084. [Google Scholar] [CrossRef]
- Egypt Oil&Gas Group. BP Raises Saudi Oil Reserve Estimitates by 12%. Available online: https://egyptoil-gas.com/news/bp-raises-saudi-oil-reserve-estimitates-by-12/ (accessed on 4 March 2025).
- S&P Global. Venezuela Faces Uphill Battle to Revive Oil Industry Even If Opposition Wins Presidential Election. Available online: www.spglobal.com/commodity-insights/en/news-research/latest-news/crude-oil/072624-venezuela-faces-uphill-battle-to-revive-oil-industry-even-if-opposition-wins-presidential-election (accessed on 4 March 2025).
- EnergiMedia. Existing Projects Largely Responsible for Continued Production Growth from Alberta Oil Sands. Available online: https://energi.media/news/existing-projects-largely-responsible-for-continued-production-growth-from-alberta-oil-sands (accessed on 4 March 2025).
- Alberta. Oil Sands Facts and Statistics. Available online: https://www.alberta.ca/oil-sands-facts-and-statistics (accessed on 4 March 2025).
- Institute of Energy Research. U.S. Miles Ahead in Global Shale Race. Available online: www.instituteforenergyresearch.org/fossil-fuels/gas-and-oil/only-four-countries-produce-shale-oilgas/ (accessed on 4 March 2025).
- DW Energy Group. Global Giants: A Guide to the World’s Leading Shale Oil and Gas Reserves. Available online: https://www.dwenergygroup.com/global-giants-a-guide-to-the-worlds-leading-shale-oil-and-gas-reserves/ (accessed on 4 March 2025).
- EIA. Frequently Asked Questions (FAQs). Available online: https://www.eia.gov/tools/faqs/ (accessed on 4 March 2025).
- Center for Sustainable Systems—University of Michigan. Unconventional Fossil Fuels Factsheet. Available online: https://css.umich.edu/publications/factsheets/energy/unconventional-fossil-fuels-factsheet (accessed on 4 March 2025).
- CMM Global Overview. Global Methan Initiative. Russian Federation. Available online: https://www.globalmethane.org/documents/toolsres_coal_overview_ch30_updated2020.pdf (accessed on 5 March 2025).
- NAO&GS. Sinopec Puts 1.3 Billion Barrels of Shale Oil Reserves on the Books. Available online: https://nangs.org/news/upstream/sinopec-postavila-na-balans-zapasy-slantsevoj-nefti-na-1-3-mlrd-barrelej (accessed on 4 March 2025).
- CMM Global Overview. Global Methan Initiative. China. Available online: https://www.globalmethane.org/documents/toolsres_coal_overview_ch7_updated2020.pdf (accessed on 5 March 2025).
- EIA. China Extracts Commercially Viable Natural Gas from Deeper Shale Formations. Available online: http://www.eia.gov/todayinenergy/detail.cfm?id=25372 (accessed on 8 October 2024).
- Reuters. Argentina’s Vaca Muerta Region Hits Record Oil Production in Q3, Rystad Says. Available online: https://www.reuters.com/markets/commodities/argentinas-vaca-muerta-region-hits-record-oil-production-q3-rystad-says-2024-11-29/ (accessed on 4 March 2025).
- USGS. Natural Gas Hydrates—Vast Resource, Uncertain Future. Available online: https://pubs.usgs.gov/fs/fs021-01/fs021-01.pdf (accessed on 5 March 2025).
- Semenova, T.; Martínez Santoyo, J.Y. Increasing the Sustainability of the Strategic Development of Oil Producing Companies in Mexico. Resources 2024, 13, 108. [Google Scholar] [CrossRef]
- Australian Government. Australia’s Energy Commodity Resources 2024 Overview. Available online: https://www.ga.gov.au/aecr2024/overview (accessed on 14 December 2024).
- Australian Energy Resource Assessment. Geoscience Australia. Available online: https://arena.gov.au/assets/2018/08/australian-energy-resource-assessment.pdf (accessed on 12 October 2020).
- Qi, Y.; Luo, S.; Tang, S.; Ruan, J.; Gao, D.; Liu, Q.; Li, S. Prediction of Carbonate Reservoir Porosity Based on CNN-BiLSTM-Transformer. Appl. Sci. 2025, 15, 3443. [Google Scholar] [CrossRef]
- Guo, T.; Xiong, L.; Ye, S.; Dong, X.; Wei, L.; Yang, Y. Theory and Practice of Unconventional Gas Exploration in Carrier Beds: Insight from the Breakthrough of New Type of Shale Gas and Tight Gas in Sichuan Basin, SW China. Pet. Explor. Dev. 2023, 50, 27–42. [Google Scholar] [CrossRef]
- Raoufi, M.; Fayek, A.R. Fuzzy Monte Carlo Agent-Based Simulation of Construction Crew Performance. J. Constr. Eng. Manag. 2020, 146, 337–348. [Google Scholar] [CrossRef]
- Sadeghi, N.; Fayek, A.R.; Pedrycz, W. Fuzzy Monte Carlo Simulation and Risk Assessment in Construction. Comput. Civ. Infrastruct. Eng. 2010, 25, 238–252. [Google Scholar] [CrossRef]
- Marinina, O.; Malikov, A.; Lyubek, Y.; Pasternak, S.; Reshneva, E.; Stolbovskaya, N. Selection of Enhanced Oil Recovery Method on the Basis of Clustering Wells. Processes 2024, 12, 2082. [Google Scholar] [CrossRef]
- Alekseev, A.D.; Zhukov, V.V.; Strizhnev, K.V.; Cherevko, S.A. Research of Hard-to-Recovery and Unconventional Oil-Bearing Formations According to the Principle «in-Situ Reservoir Fabric». J. Min. Inst. 2017, 228, 695–704. [Google Scholar] [CrossRef]
- Zhao, W.; Hu, S.; Hou, L.; Yang, T.; Li, X.; Guo, B.; Yang, Z. Types and Resource Potential of Continental Shale Oil in China and Its Boundary with Tight Oil. Pet. Explor. Dev. 2020, 47, 1–11. [Google Scholar] [CrossRef]
- Chizhov, A.P.; Rabaev, R.U.; Andreev, V.E.; Chibisov, A.V.; Kuangaliev, Z.A.; Efimov, E.R.; Ivanov, D.V. Theoretical Features of Improving the Oil Recovery Efficiency from Carbonate Reservoirs in the Volga-Ural Province. SOCAR Proc. 2020, 4, 9–14. [Google Scholar] [CrossRef]
- Mokheimer, E.M.A.; Hamdy, M.; Abubakar, Z.; Shakeel, M.R.; Habib, M.A.; Mahmoud, M. A Comprehensive Review of Thermal Enhanced Oil Recovery: Techniques Evaluation. J. Energy Resour. Technol. Trans. ASME 2019, 141, 030801. [Google Scholar] [CrossRef]
- Guo, X.; Aibaibu, A.; Wu, Y.; Chen, B.; Zhou, H.; Zhu, B.; Zhao, X. Numerical Modeling of Hydraulic Fracturing Interference in Multi-Layer Shale Oil Wells. Processes 2024, 12, 2370. [Google Scholar] [CrossRef]
- Reynolds, D.B.; Umekwe, M.P. Shale-Oil Development Prospects: The Role of Shale-Gas in Developing Shale-Oil. Energies 2019, 12, 3331. [Google Scholar] [CrossRef]
- Jin, Y.; Guo, K.; Gao, X.; Li, Q. Tight Oil Well Productivity Prediction Model Based on Neural Network. Processes 2024, 12, 2088. [Google Scholar] [CrossRef]
- Chudinova, D.Y.; Atse, Y.D.B.; Minniakhmetova, R.M.; Kotenev, M.Y. Classification of Residual Oil Reserves and Methods of Its Recovery. In SOCAR Proceedings; Oil Gas Scientific Research Project Institute: Baku, Azerbaijan, 2021; pp. 26–33. [Google Scholar]
- Cano-Londono, N.A.; Médina, O.E.; Mozo, I.; Céspedes, S.; Franco, C.A.; Cortés, F.B. Viability of the Steam-Based Extraction of Extra-Heavy Crude Oil Using Nanoparticles: Exergy and Life-Cycle Assessment. Energy 2024, 304, 131929. [Google Scholar] [CrossRef]
- Ruble, I. The U.S. Crude Oil Refining Industry: Recent Developments, Upcoming Challenges and Prospects for Exports. J. Econ. Asymmetries 2019, 20, e00132. [Google Scholar] [CrossRef]
- Palyanitsina, A.; Safiullina, E.; Byazrov, R.; Podoprigora, D.; Alekseenko, A. Environmentally Safe Technology to Increase Efficiency of High-Viscosity Oil Production for the Objects with Advanced Water Cut. Energies 2022, 15, 753. [Google Scholar] [CrossRef]
- Dvoynikov, M.V.; Sidorkin, D.I.; Yurtaev, S.L.; Grokhotov, E.I.; Ulyanov, D.S. Drilling of Deep and Ultra-Deep Wells for Prospecting and Exploration of New Raw Mineral Fields. J. Min. Inst. 2022, 258, 945–955. [Google Scholar] [CrossRef]
- Burkhanov, R.N.; Lutfullin, A.A.; Raupov, I.R.; Maksyutin, A.V.; Valiullin, I.V.; Farrakhov, I.M.; Shvydenko, M.V. Localization and Involvement in Development of Residual Recoverable Reserves of a Multilayer Oil Field. J. Min. Inst. 2024, 268, 599–612. [Google Scholar]
- Wu, M.; Li, B.; Ruan, L.; Zhang, C.; Tang, Y.; Li, Z. Effect of CO2 Concentration on the Performance of Polymer-Enhanced Foam at the Steam Front. Polymers 2024, 16, 2726. [Google Scholar] [CrossRef]
- Dou, X.; Qian, M.; Zhao, X.; Wang, A.; Lei, Z.; Guo, E.; Chen, Y. Fluid Flow Behavior in Nanometer-Scale Pores and Its Impact on Shale Oil Recovery Efficiency. Energies 2024, 17, 4677. [Google Scholar] [CrossRef]
- Sleptsov, A.; Medvedeva, L.; Marinina, O.; Savenok, O. Feasibility Study on the Applicability of Intelligent Well Completion. Processes 2024, 12, 1565. [Google Scholar] [CrossRef]
- Khuzin, R.R.; Andreev, V.E.; Mukhametshin, V.V.; Kuleshova, L.S.; Dubinskiy, G.S.; Safiullina, A.R. Influence of Hydraulic Compression on Porosity and Permeability Properties of Reservoirs. J. Min. Inst. 2021, 251, 688–697. [Google Scholar] [CrossRef]
- Sui, Y.; Cao, G.; Tian, Y.; Guo, T.; Xiao, Z.; Yao, L. Application, Progress, and Trend of Thickened Acid Fracturing in Carbonate Rock Reservoir Development. Processes 2024, 12, 2269. [Google Scholar] [CrossRef]
- Cooper, M. Structural Style and Hydrocarbon Prospectivity in Fold and Thrust Belts: A Global Review. Geol. Soc. Spec. Publ. 2007, 272, 447–472. [Google Scholar] [CrossRef]
- Goffey, G.P.; Craig, J.; Needham, T.; Scott, R. Fold-Thrust Belts: Overlooked Provinces or Justifiably Avoided? Geol. Soc. Spec. Publ. 2010, 348, 1–6. [Google Scholar] [CrossRef]
- Kendall, J.; Vergés, J.; Koshnaw, R.; Louterbach, M. Petroleum Tectonic Comparison of Fold and Thrust Belts: The Zagros of Iraq and Iran, the Pyrenees of Spain, the Sevier of Western USA and the Beni Sub-Andean of Bolivia. Geol. Soc. Spec. Publ. 2020, 490, 79–103. [Google Scholar] [CrossRef]
- Wu, Y.; Zheng, R.; Ma, L.; Feng, X. Uncertainty Quantification in Rate Transient Analysis of Multi-Fractured Tight Gas Wells Exhibiting Gas–Water Two-Phase Flow. Water 2024, 16, 2744. [Google Scholar] [CrossRef]
- ISO. 2018 ISO 31000:2018—Risk Management—Guidelines; ISO: Geneva, Switzerland, 2018; ISBN 2831889189. [Google Scholar]
- IEC. 2019 IEC 31010:2019 Risk Management—Risk Assessment Techniques; IEC: London, UK, 2019; Volume 2, ISBN 2831886376. [Google Scholar]
- Stroykov, G.A.; Babyr, N.V.; Ilin, I.V.; Marchenko, R.S. System of Comprehensive Assessment of Project Risks in Energy Industry. Int. J. Eng. Trans. A Basics 2021, 34, 1778–1784. [Google Scholar] [CrossRef]
- Korshunov, G.I.; Kabanov, E.I.; Cehlár, M. Occupational Risk Management in a Mining Enterprise with the Aid of an Improved Matrix Method for Risk Assessment. Acta Montan. Slovaca 2020, 25, 289–301. [Google Scholar] [CrossRef]
- Shokouhi, M.R.; Khademvatani, A.; Beiky, F. Analyzing Economic and Financial Risk Factors Affecting Profitability of Oil Refinery Investment Projects: A Case Study from an Iranian Oil Refinery. Energy Strateg. Rev. 2024, 52, 101348. [Google Scholar] [CrossRef]
- Balas, E.A. A Hybrid Monte Carlo Simulation Risk Model for Oil Exploration Projects. Mar. Pollut. Bull. 2023, 194, 115270. [Google Scholar] [CrossRef]
- Wang, C.; Cai, B.; Shao, X.; Zhao, L.; Sui, Z.; Liu, K.; Khan, J.A.; Gao, L. Dynamic Risk Assessment Methodology of Operation Process for Deepwater Oil and Gas Equipment. Reliab. Eng. Syst. Saf. 2023, 239, 109538. [Google Scholar] [CrossRef]
- Kim, J.H.; Lee, Y.G. Progress of Technological Innovation of the United States’ Shale Petroleum Industry Based on Patent Data Association Rules. Sustainability 2020, 12, 6628. [Google Scholar] [CrossRef]
- Zhang, H.; Wang, W.; Niu, Z. Geopolitical Risks and Crude Oil Futures Volatility: Evidence from Machine Learning. Resour. Policy 2024, 98, 105374. [Google Scholar] [CrossRef]
- Al-Mhdawi, M.K.S.; O’Connor, A.; Qazi, A. Structural Equation Modeling and Fuzzy Set Theory: Advancing Risk Assessment in Oil and Gas Construction Projects. Environ. Impact Assess. Rev. 2024, 109, 107622. [Google Scholar] [CrossRef]
- Abid, K.; Velasquez, A.F.B.; Sharma, A.; McSheridan, A.N.; Srivastava, S.; Teodoriu, C. Risk Assessment through Feature, Event, and Process for Repurposing Suspended Oil and Gas Wells for Geothermal Purposes. Renew. Energy 2024, 237, 121720. [Google Scholar] [CrossRef]
- Luo, Y.; Yang, Z.; Qin, Y. A Hybrid BWM–CRITIC–VIKOR Approach for Assessing Oil and Gas Risk Scenarios in Probabilistic Linguistic Term Set. Heliyon 2024, 10, e38514. [Google Scholar] [CrossRef]
- Kovshov, S.V.; Tingnting, S. Application of Computer Modeling for the Accident Rate Assessment on Separate Sites of the Mohe–Daqing Oil Pipeline in Permafrost Conditions. Transp. Infrastruct. Geotechnol. 2020, 7, 605–617. [Google Scholar] [CrossRef]
- Kovshov, S.V.; Alimhanova, T.A.; Kitsis, V.M. Ranking of the Sections of East Siberia–Pacific Ocean Main Pipeline by Accident Probability Using Bow-Tie Method and Checklist Support Tool. J. Pipeline Syst. Eng. Pract. 2020, 11, 05020003. [Google Scholar] [CrossRef]
- Ilyas, M.; Jin, Z.; Ullah, I.; Almujibah, H. A Fuzzy Logic-Based Risk Assessment Framework for the Crude Oil Transportation Supply Chain. Ocean Eng. 2024, 311, 118997. [Google Scholar] [CrossRef]
- Kang, J.; Al Masry, Z.; Varnier, C.; Mosallam, A.; Zerhouni, N. A Data Quality Management Framework for Equipment Failure Risk Estimation: Application to the Oil and Gas Industry. Eng. Appl. Artif. Intell. 2024, 136, 108834. [Google Scholar] [CrossRef]
- Wan, K.; Liu, B.Y.; Fan, Y.; Ikonnikova, S.A. Modelling and Assessing Dynamic Energy Supply Resilience to Disruption Events: An Oil Supply Disruption Case in China. Energy Econ. 2024, 140, 108013. [Google Scholar] [CrossRef]
- Liu, Z.; Shi, W. Oil Price Disaster Risk, Macroeconomic Dynamics and Monetary Policy. Int. Rev. Financ. Anal. 2024, 96, 103574. [Google Scholar] [CrossRef]
- Wang, K.; Wen, F.; Gong, X. Oil Prices and Systemic Financial Risk: A Complex Network Analysis. Energy 2024, 293, 130672. [Google Scholar] [CrossRef]
- Caporin, M.; Fontini, F.; Panzica, R. The Systemic Risk of US Oil and Natural Gas Companies. Energy Econ. 2023, 121, 106650. [Google Scholar] [CrossRef]
- Zhou, B.; Huang, Y.; Gao, K.; Luo, C. How Geopolitical Risk and Economic Policy Uncertainty Impact Coal, Natural Gas, and Oil Rent? Evidence from China. Resour. Policy 2024, 88, 104393. [Google Scholar] [CrossRef]
- Babyr, N.; Babyr, K. To Improve the Contact Adaptability of Mechanical Roof Support. In Proceedings of the E3S Web of Conferences, EDP Sciences, Saint Petersburg, Russia, 31 May–6 June 2021; Volume 266. [Google Scholar]
- Chen, X.; Liu, S.; Liu, R.W.; Wu, H.; Han, B.; Zhao, J. Quantifying Arctic Oil Spilling Event Risk by Integrating an Analytic Network Process and a Fuzzy Comprehensive Evaluation Model. Ocean Coast. Manag. 2022, 228, 106326. [Google Scholar] [CrossRef]
- Nevskaya, M.A.; Belyaev, V.V.; Pasternak, S.N.; Vinogradova, V.V.; Shagidulina, D.I. Accidental oil spills in the arctic: An assessment of potential soil damage. Sev. Rynok Form. Ekon. Porad. 2024, 27, 107–122. [Google Scholar] [CrossRef]
- Katysheva, E.G. The Role of the Russian Arctic Gas Industry in the Northern Sea Route Development. IOP Conf. Ser. Earth Environ. Sci. 2020, 539, 012075. [Google Scholar] [CrossRef]
- Carayannis, E.G.; Ilinova, A.; Cherepovitsyn, A. The Future of Energy and the Case of the Arctic Offshore: The Role of Strategic Management. J. Mar. Sci. Eng. 2021, 9, 134. [Google Scholar] [CrossRef]
- Torres, L.; Yadav, O.P.; Khan, E. A Review on Risk Assessment Techniques for Hydraulic Fracturing Water and Produced Water Management Implemented in Onshore Unconventional Oil and Gas Production. Sci. Total Environ. 2016, 539, 478–493. [Google Scholar] [CrossRef]
- Fedorov, S.; Lavrutich, M.; Hagspiel, V.; Lerdahl, T. Risk and Benefit Sharing Schemes in Oil Exploration and Production. Energy Econ. 2022, 116, 106401. [Google Scholar] [CrossRef]
- Zhong, W.; Cai, J.; Song, Y.; Liang, T.; Zhang, J.; Gao, Z. Risk Evolution of Crude Oil Pipeline under Periodic Maintenance Based on Dynamic Bayesian Network. J. Loss Prev. Process Ind. 2024, 87, 105229. [Google Scholar] [CrossRef]
- Choi, K.H.; Nekhili, R.; Mensi, W.; Boubaker, F.Z.; Yoon, S.M. Systemic Risk-Sharing between Natural Gas, Oil, and Stock Markets in Top Energy Producer and Consumer Countries. Int. Rev. Econ. Financ. 2024, 96, 103515. [Google Scholar] [CrossRef]
- Afshan, S.; Leong, K.Y.; Najmi, A.; Razi, U.; Lelchumanan, B.; Cheong, C.W.H. Fintech Advancements for Financial Resilience: Analysing Exchange Rates and Digital Currencies during Oil and Financial Risk. Resour. Policy 2024, 88, 104432. [Google Scholar] [CrossRef]
- Khalilzadeh, M.; Shakeri, H.; Zohrehvandi, S. Risk Identification and Assessment with the Fuzzy DEMATEL-ANP Method in Oil and Gas Projects under Uncertainty. Procedia Comput. Sci. 2021, 181, 277–284. [Google Scholar] [CrossRef]
- Ilyushin, Y.; Talanov, N. Development of Methods and Models for Assessing Technical Condition of Mines and Underground Structures. Int. J. Eng. 2025, 38, 1659–1666. [Google Scholar] [CrossRef]
- Peng, Y.; Chen, Z.; Xie, L.; Wang, Y.; Zhang, X.; Chen, N.; Hu, Y. Prediction of Shale Gas Well Productivity Based on a Cuckoo-Optimized Neural Network. Mathematics 2024, 12, 2948. [Google Scholar] [CrossRef]
- Li, H.; Sun, R.; Lee, W.J.; Dong, K.; Guo, R. Assessing Risk in Chinese Shale Gas Investments Abroad: Modelling and Policy Recommendations. Sustainability 2016, 8, 708. [Google Scholar] [CrossRef]
- Wang, H.; Zhang, J.; Yong, Z.; Qu, X. The Differential Enrichment Law of Tight Sandstone Gas in the Eighth Member of Shihezi Formation in the North and South of Ordos Basin. Energies 2024, 17, 5978. [Google Scholar] [CrossRef]
- Burton, G.A.; Basu, N.; Ellis, B.R.; Kapo, K.E.; Entrekin, S.; Nadelhoffer, K. Hydraulic “Fracking”: Are Surface Water Impacts an Ecological Concern? Environ. Toxicol. Chem. 2014, 33, 1679–1689. [Google Scholar] [CrossRef]
- Du, F.; Nojabaei, B. A Review of Gas Injection in Shale Reservoirs: Enhanced Oil/Gas Recovery Approaches and Greenhouse Gas Control. Energies 2019, 12, 2355. [Google Scholar] [CrossRef]
- Wang, K.; Vredenburg, H.; Wang, T.; Feng, L. Financial Return and Energy Return on Investment Analysis of Oil Sands, Shale Oil and Shale Gas Operations. J. Clean. Prod. 2019, 223, 826–836. [Google Scholar] [CrossRef]
- Uzun, O.; Kazemi, H. Assessment of Enhanced Oil Recovery by Osmotic Pressure in Unconventional Reservoirs: Application to Niobrara Chalk and Codell Sandstone. Fuel 2021, 306, 121270. [Google Scholar] [CrossRef]
- Yan, M.; Ai, C.; Zhang, J.; Lu, W.; Gao, R. Study on Near-Wellbore Fracture Initiation and Propagation with Fixed-Plane Perforation in Horizontal Well for Unconventional Reservoirs. Processes 2024, 12, 2280. [Google Scholar] [CrossRef]
- Jia, B.; Su, J. Advancements and Environmental Implications in Oil Shale Exploration and Processing. Appl. Sci. 2023, 13, 7657. [Google Scholar] [CrossRef]
- Golovina, E.; Karennik, K. Modern Trends in the Field of Solving Transboundary Problems in Groundwater Extraction. Resources 2021, 10, 107. [Google Scholar] [CrossRef]
- Golovina, E.I.; Tselmeg, B. Cost estimate as a tool for managing fresh groundwater resources in the russian federation. Geol. Miner. Resour. Sib. 2023, 4, 81–91. [Google Scholar] [CrossRef]
- Yao, Q.; Yang, B.; Zhang, Q. Dynamic Uncertain Causality Graph Applied to the Intelligent Evaluation of a Shale-Gas Sweet Spot. Energies 2021, 14, 5228. [Google Scholar] [CrossRef]
- Katysheva, E. Analysis of the Interconnected Development Potential of the Oil, Gas and Transport Industries in the Russian Arctic. Energies 2023, 16, 3124. [Google Scholar] [CrossRef]
- Salygin, V.; Guliev, I.; Chernysheva, N.; Sokolova, E.; Toropova, N.; Egorova, L. Global Shale Revolution: Successes, Challenges, and Prospects. Sustainability 2019, 11, 1627. [Google Scholar] [CrossRef]
- Aziz, A.; Suzon, M.M.; Hasan, R. A Fuzzy Logic-Based Risk Evaluation and Precaution Level Estimation of Explosive, Flammable, and Toxic Chemicals for Preventing Damages. Heliyon 2025, 11, e41216. [Google Scholar] [CrossRef] [PubMed]
- Ohia, N.P.; Paul, C.; Asolo, E.; Adewa, T.A.; Chukwu, C.F.; Ubi, P.A.; Itam, D.H.; Nnaji, D.U. Artificial Intelligence-Driven Fuzzy Logic Approach for Optimal Well Selection in Gas Lift Design: A Brown Field Case Study; Elsevier: Amsterdam, The Netherlands, 2025; ISBN 0009000708732. [Google Scholar]
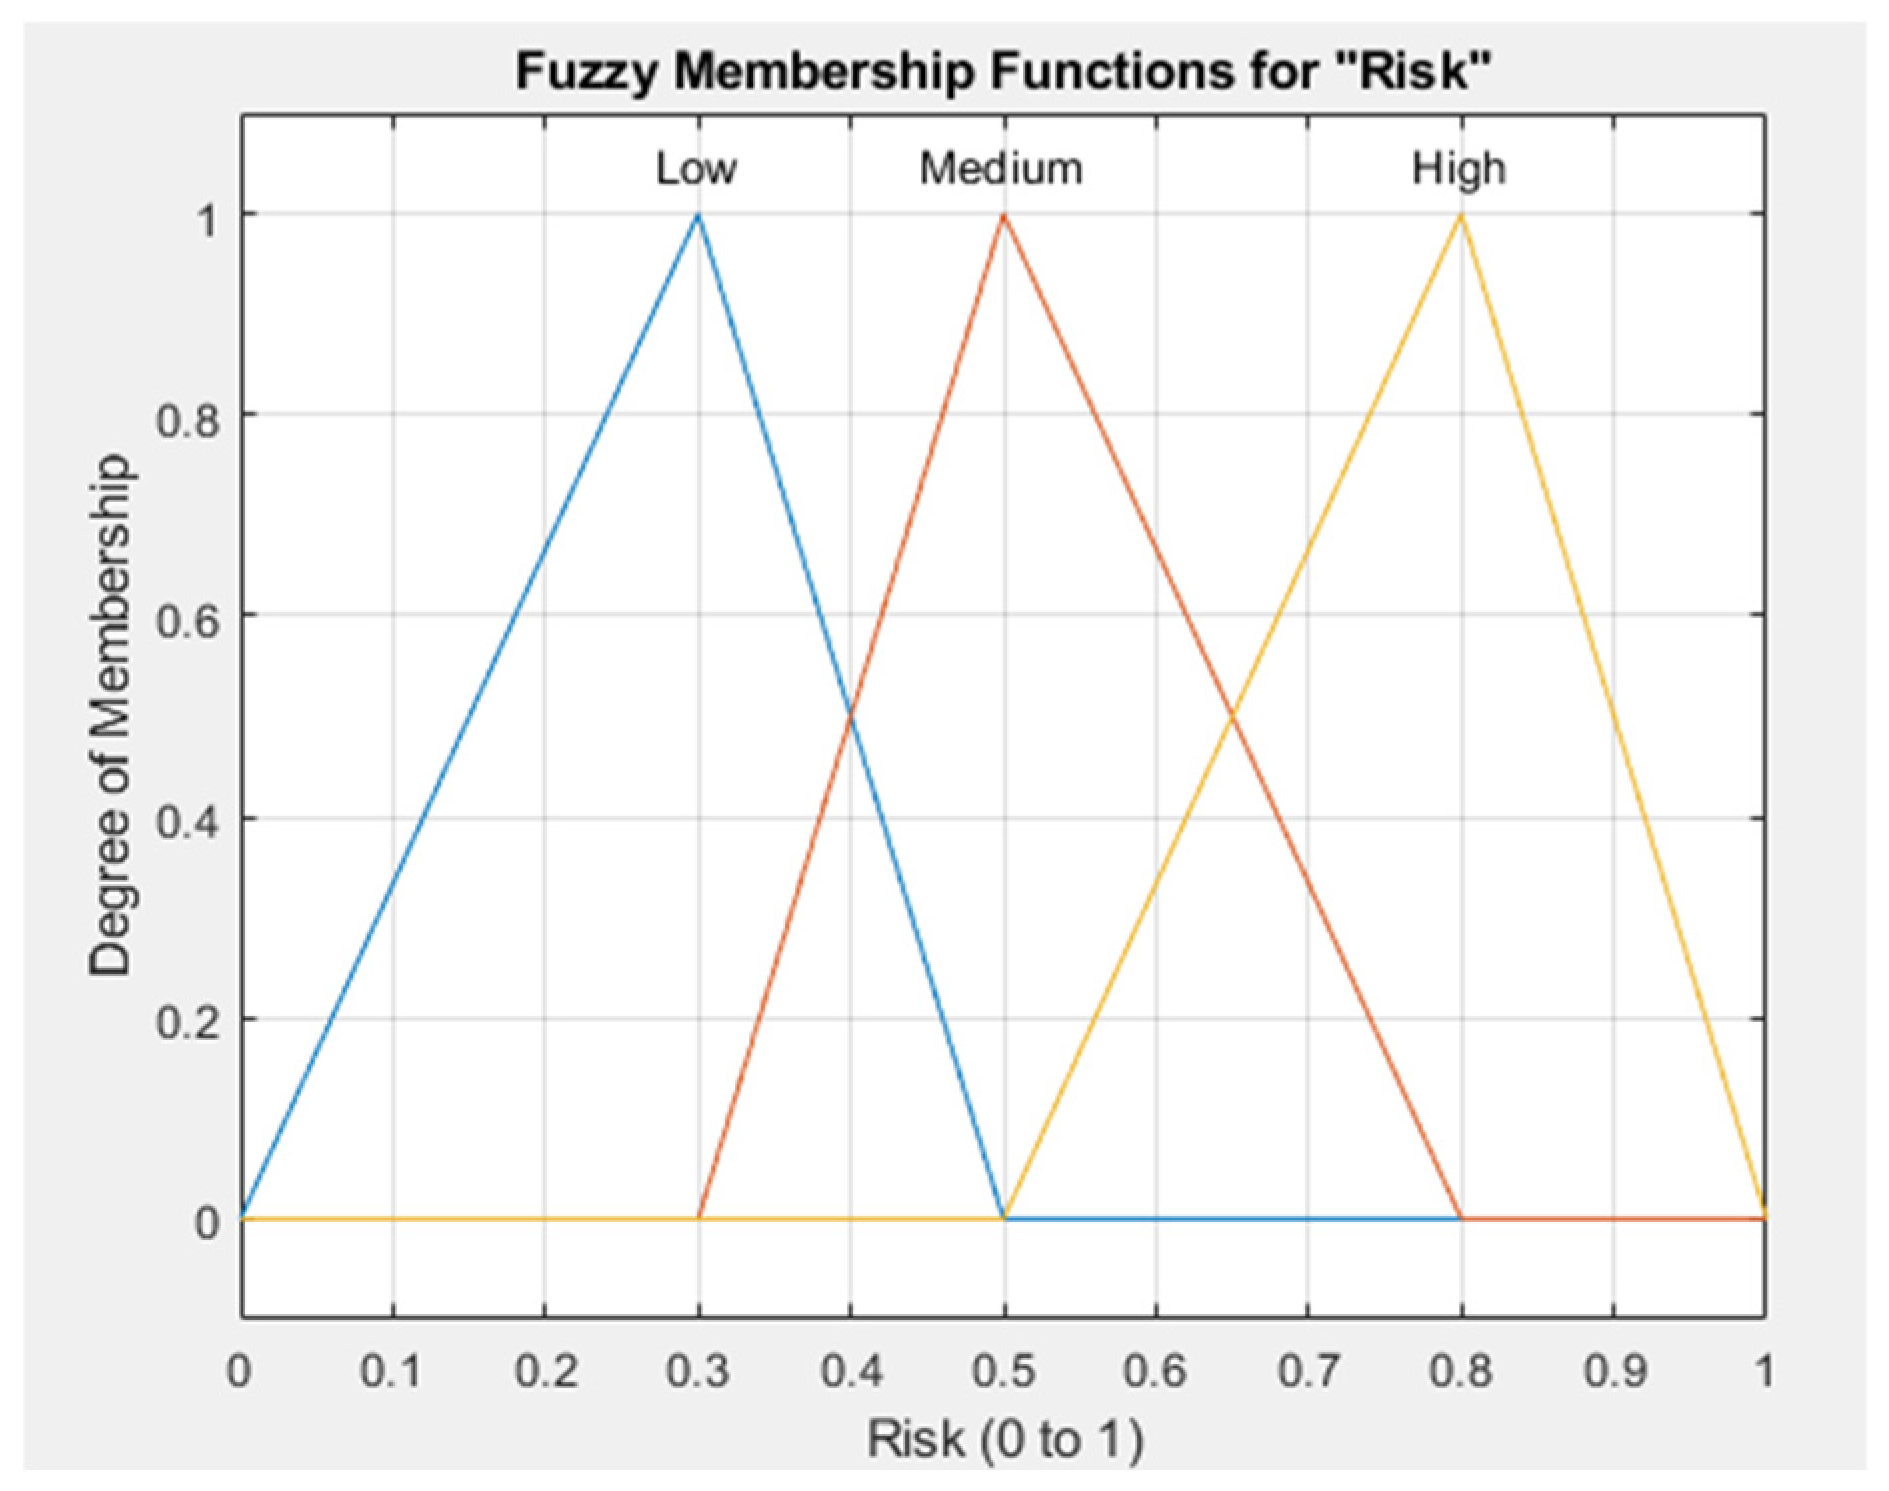
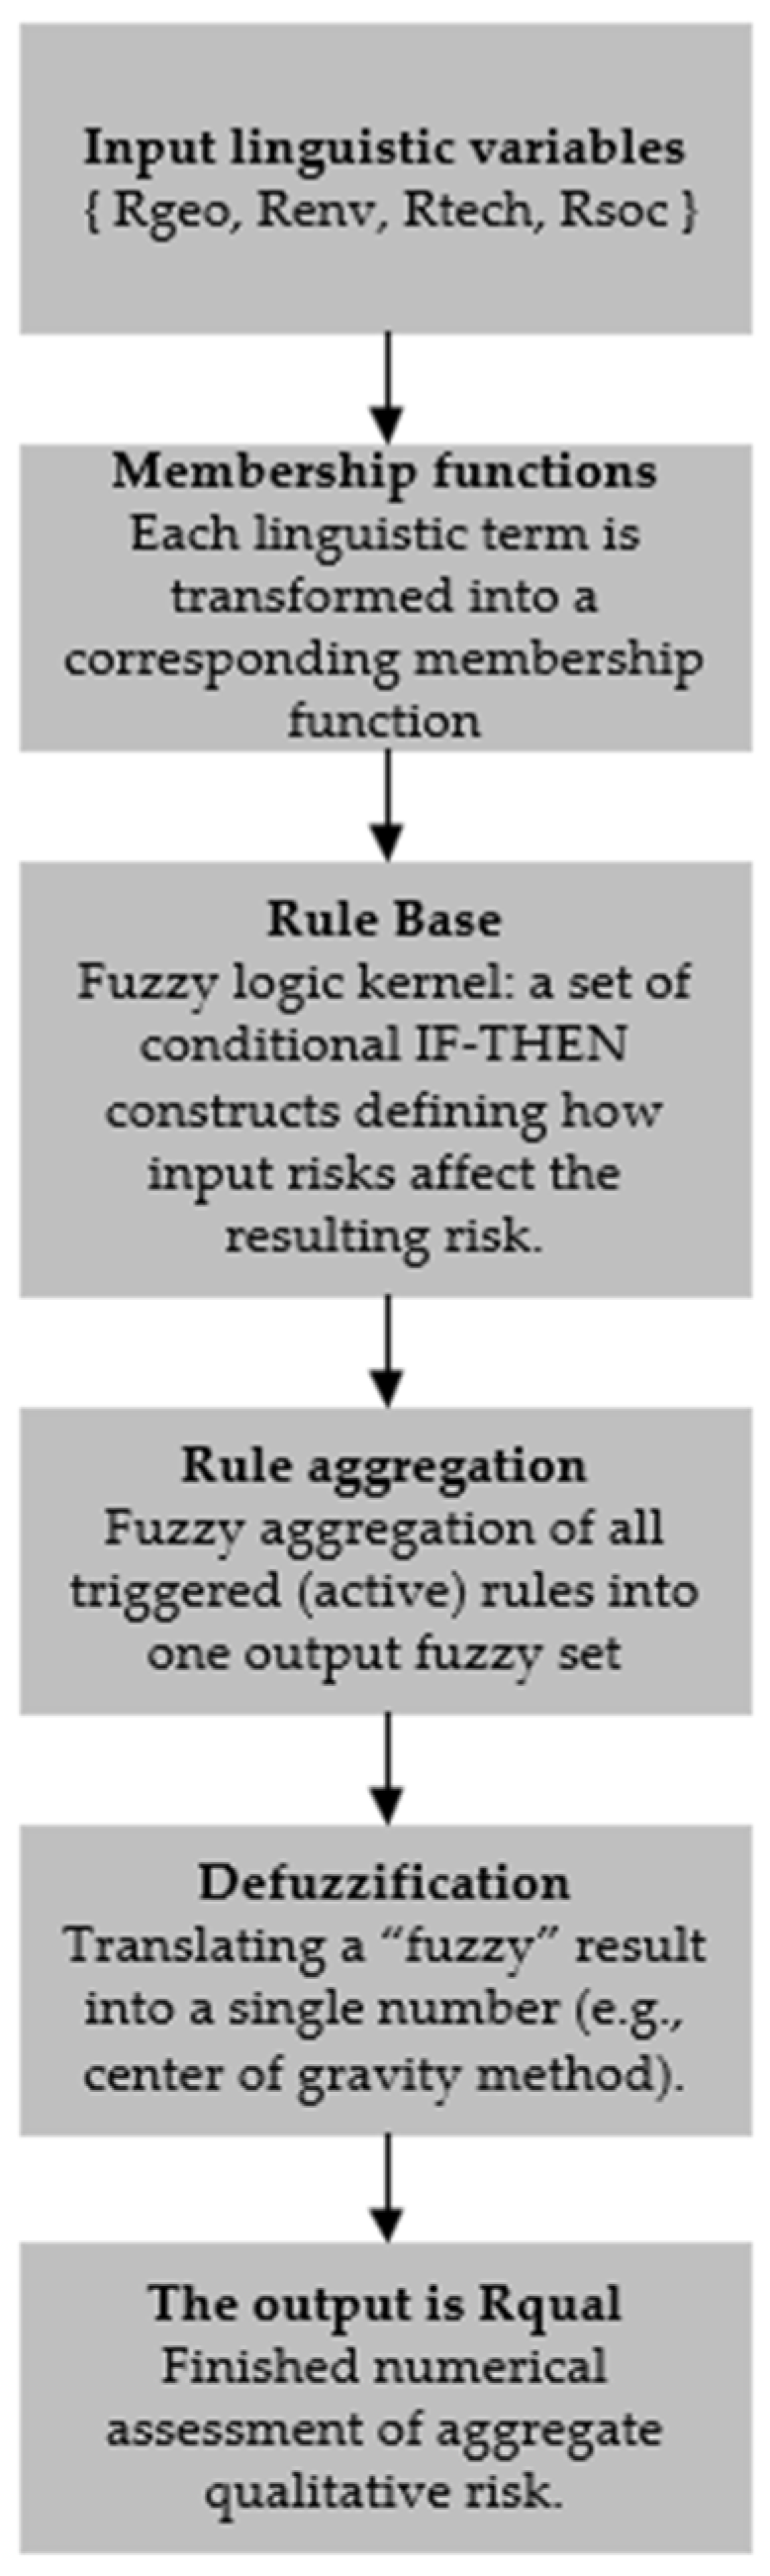
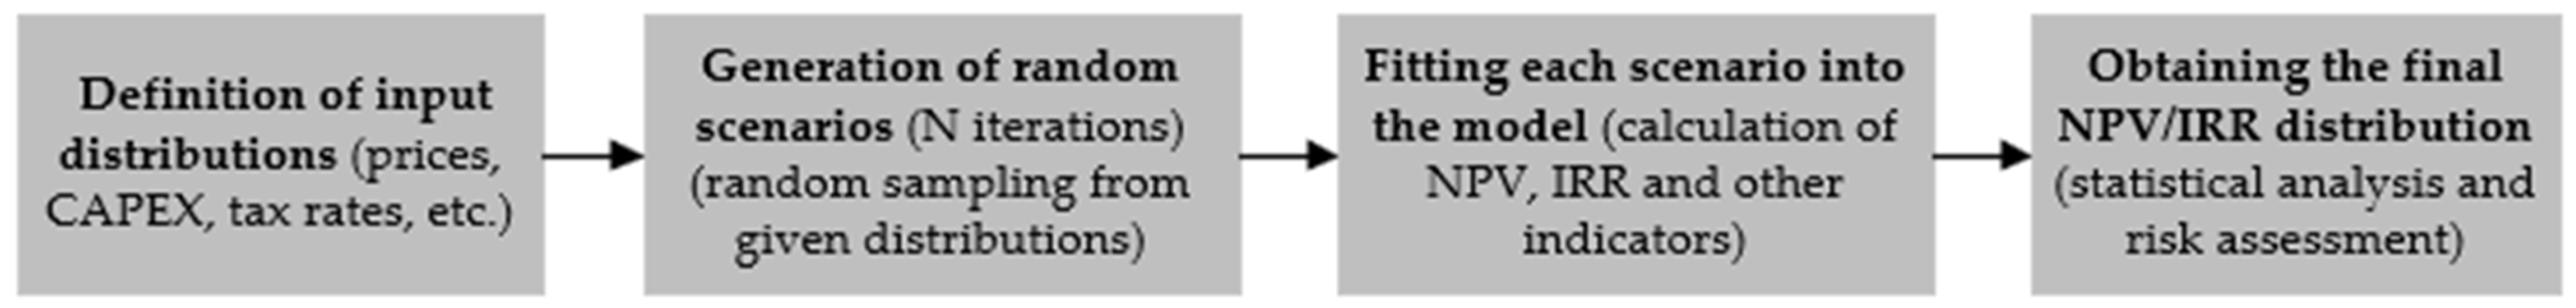
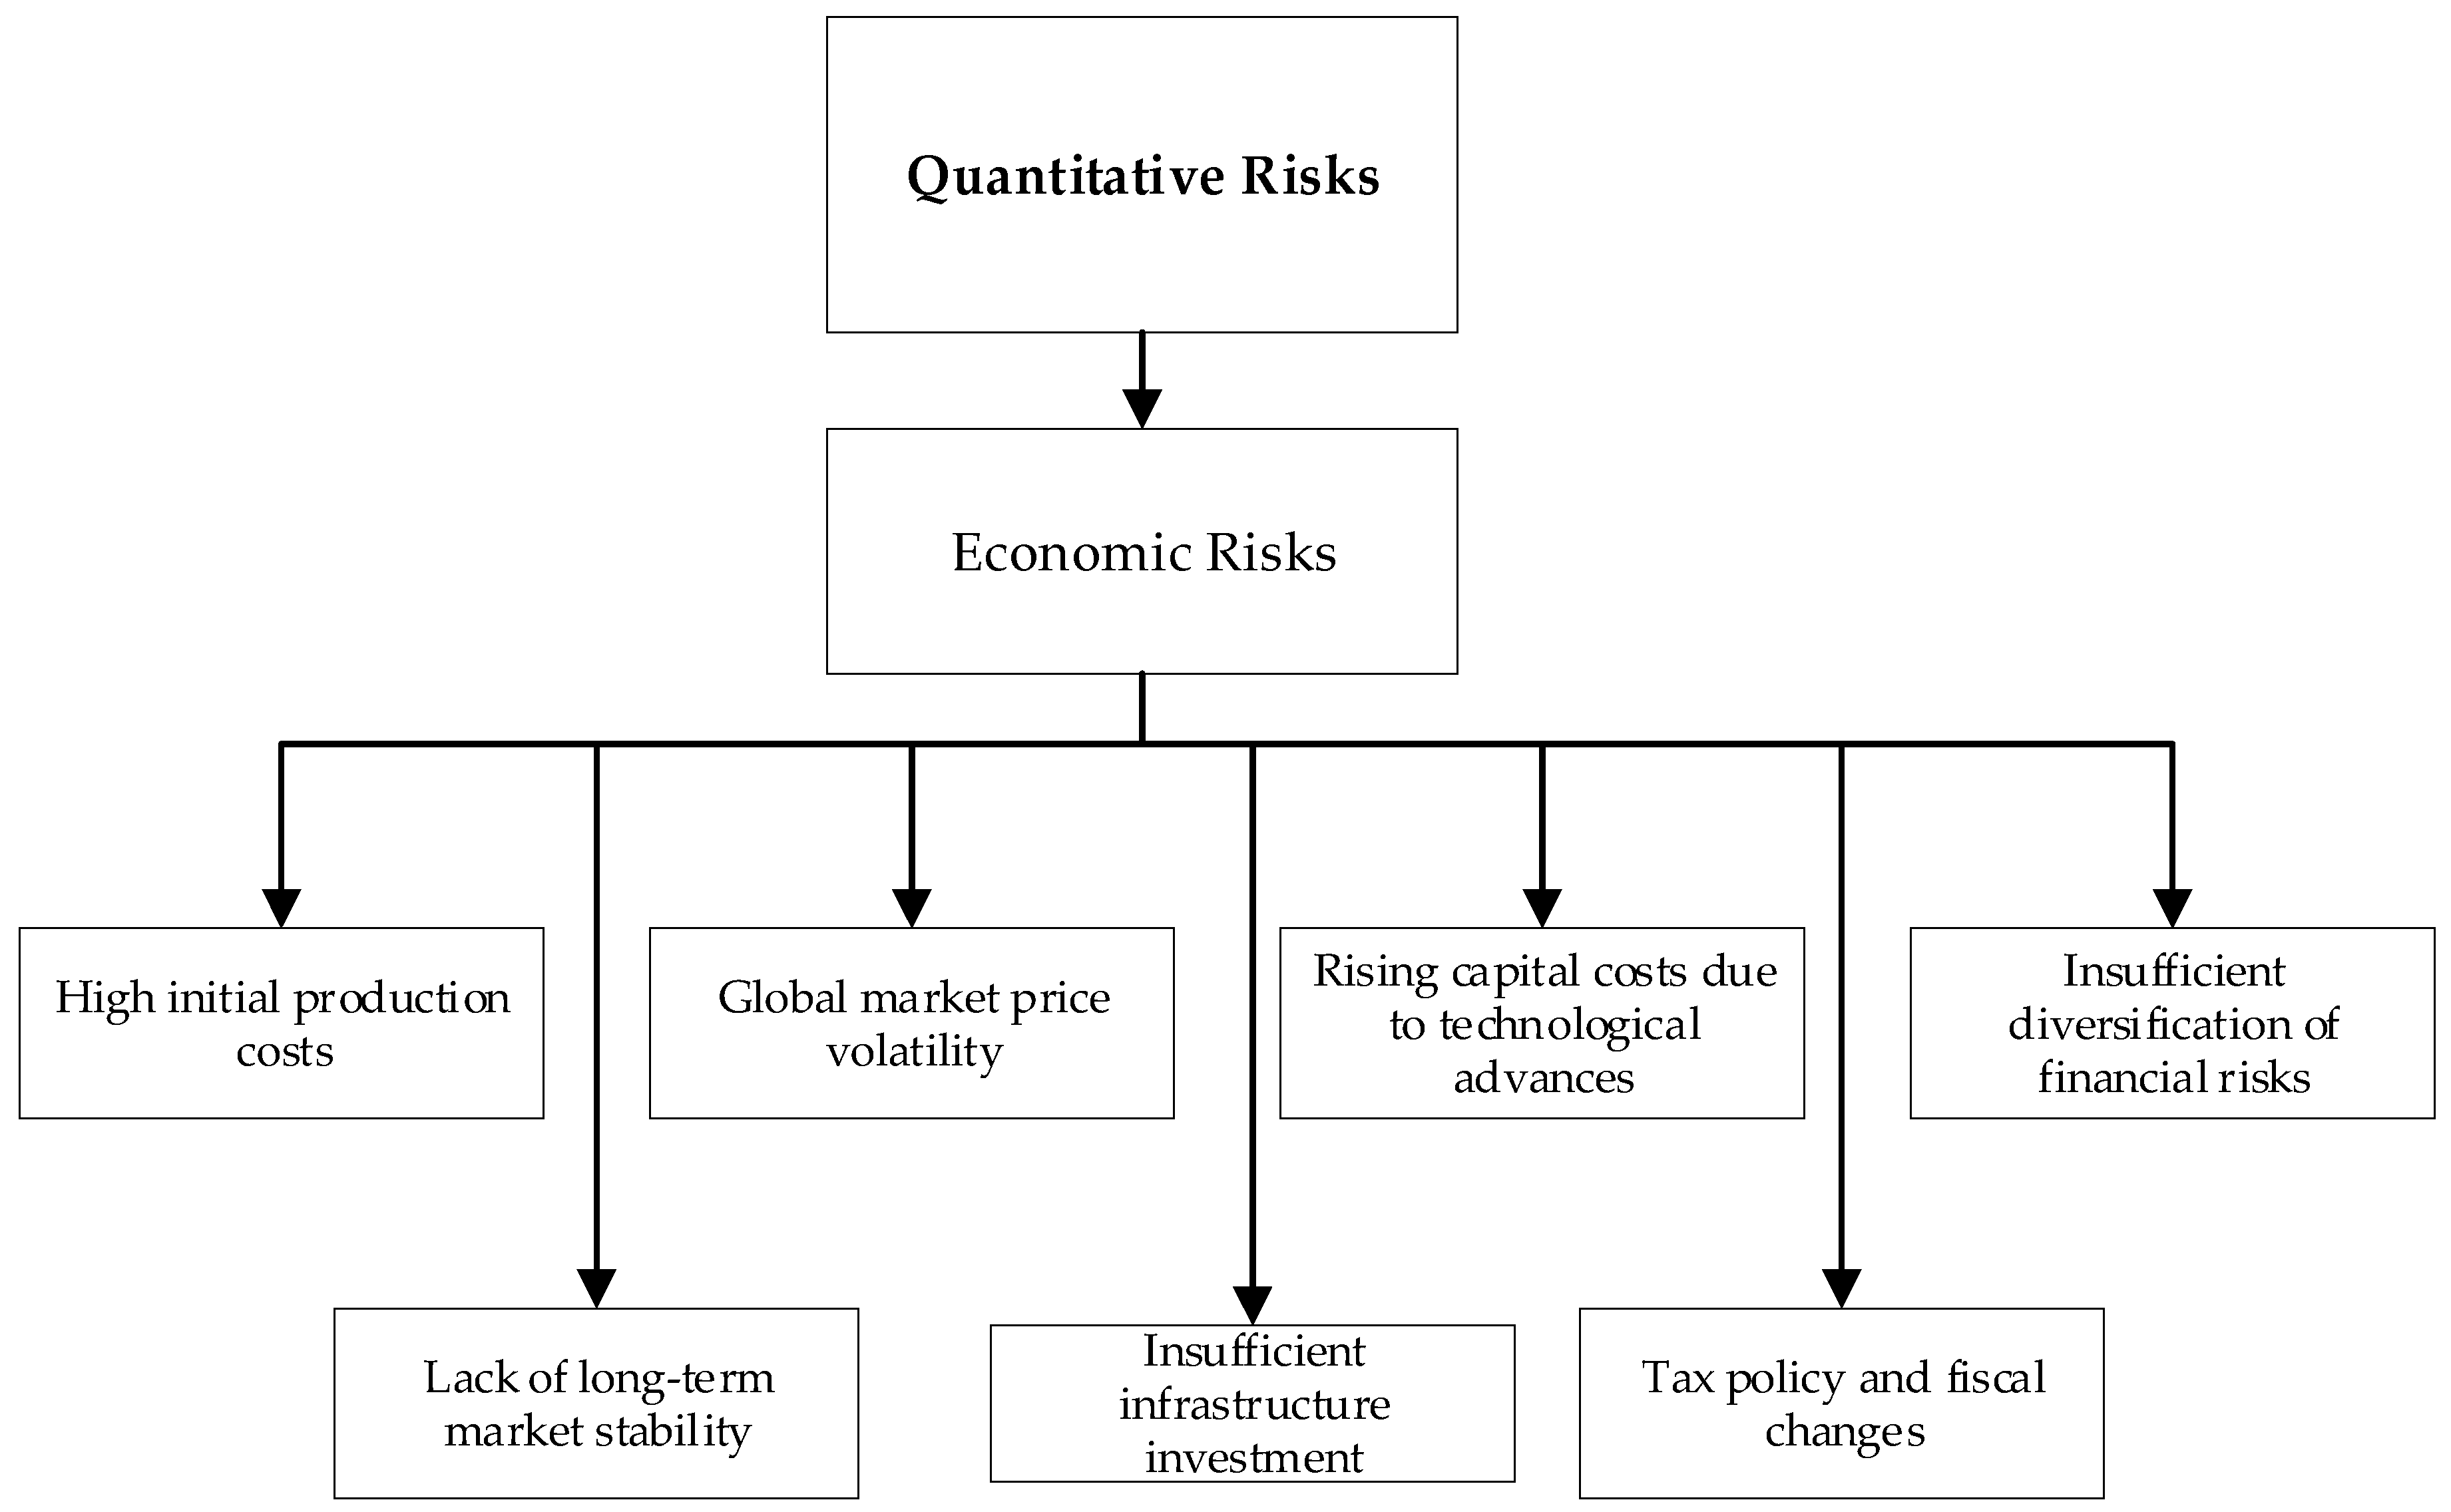
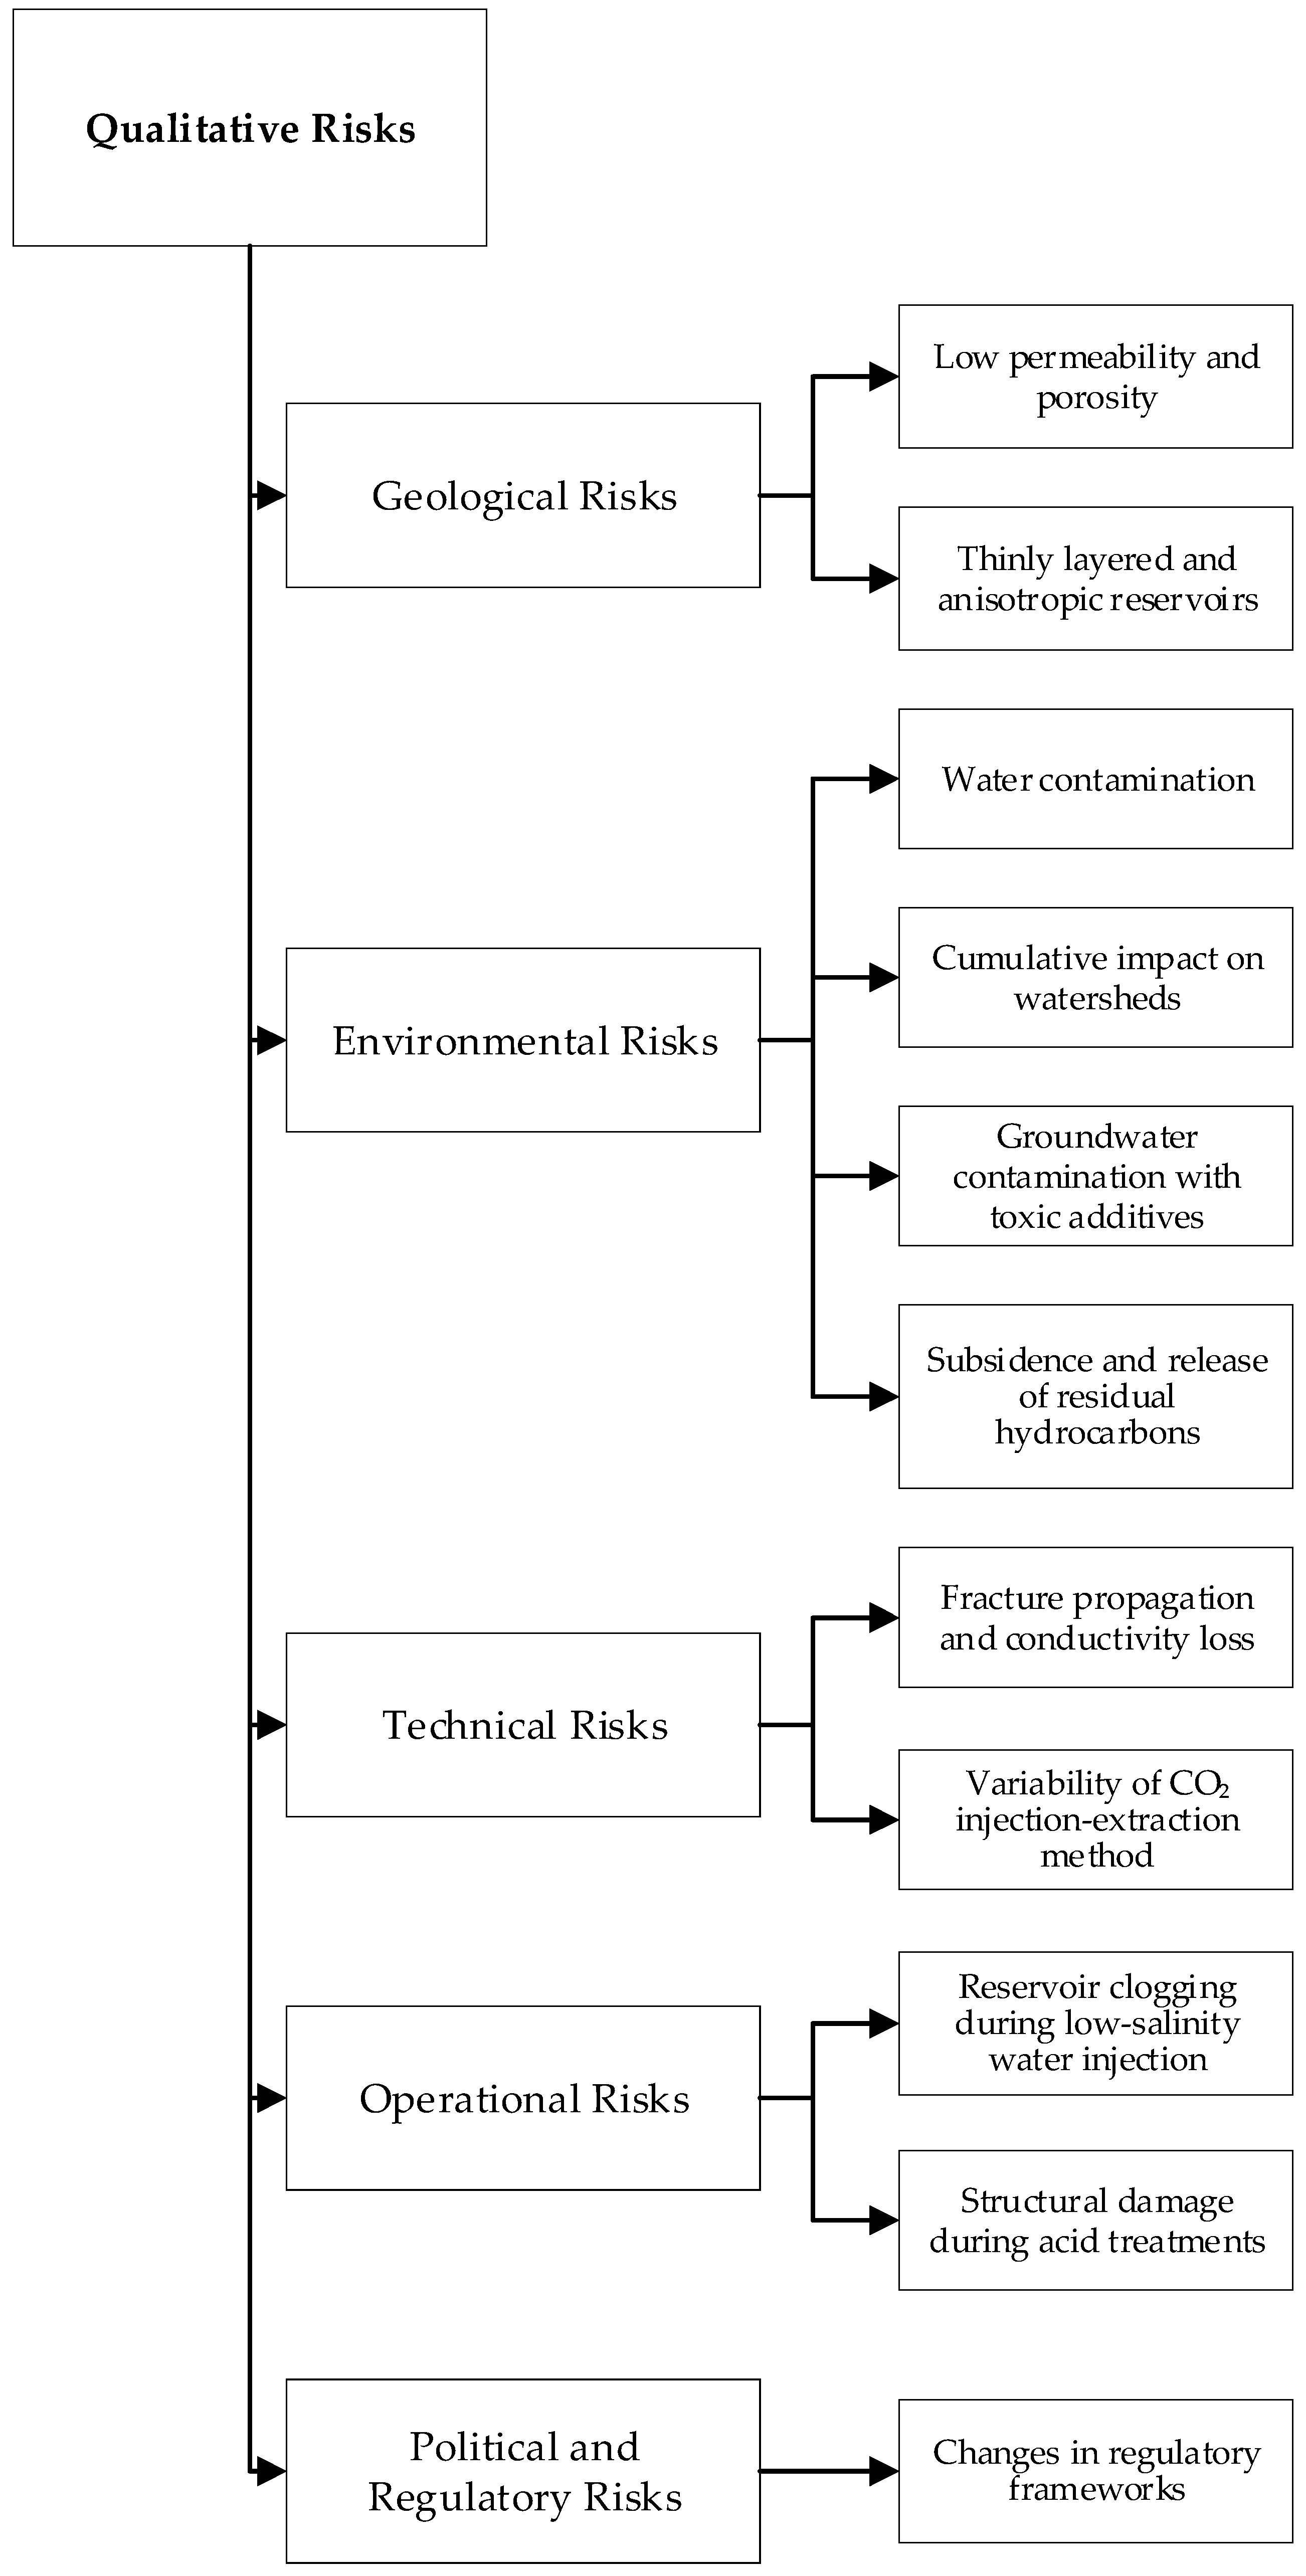
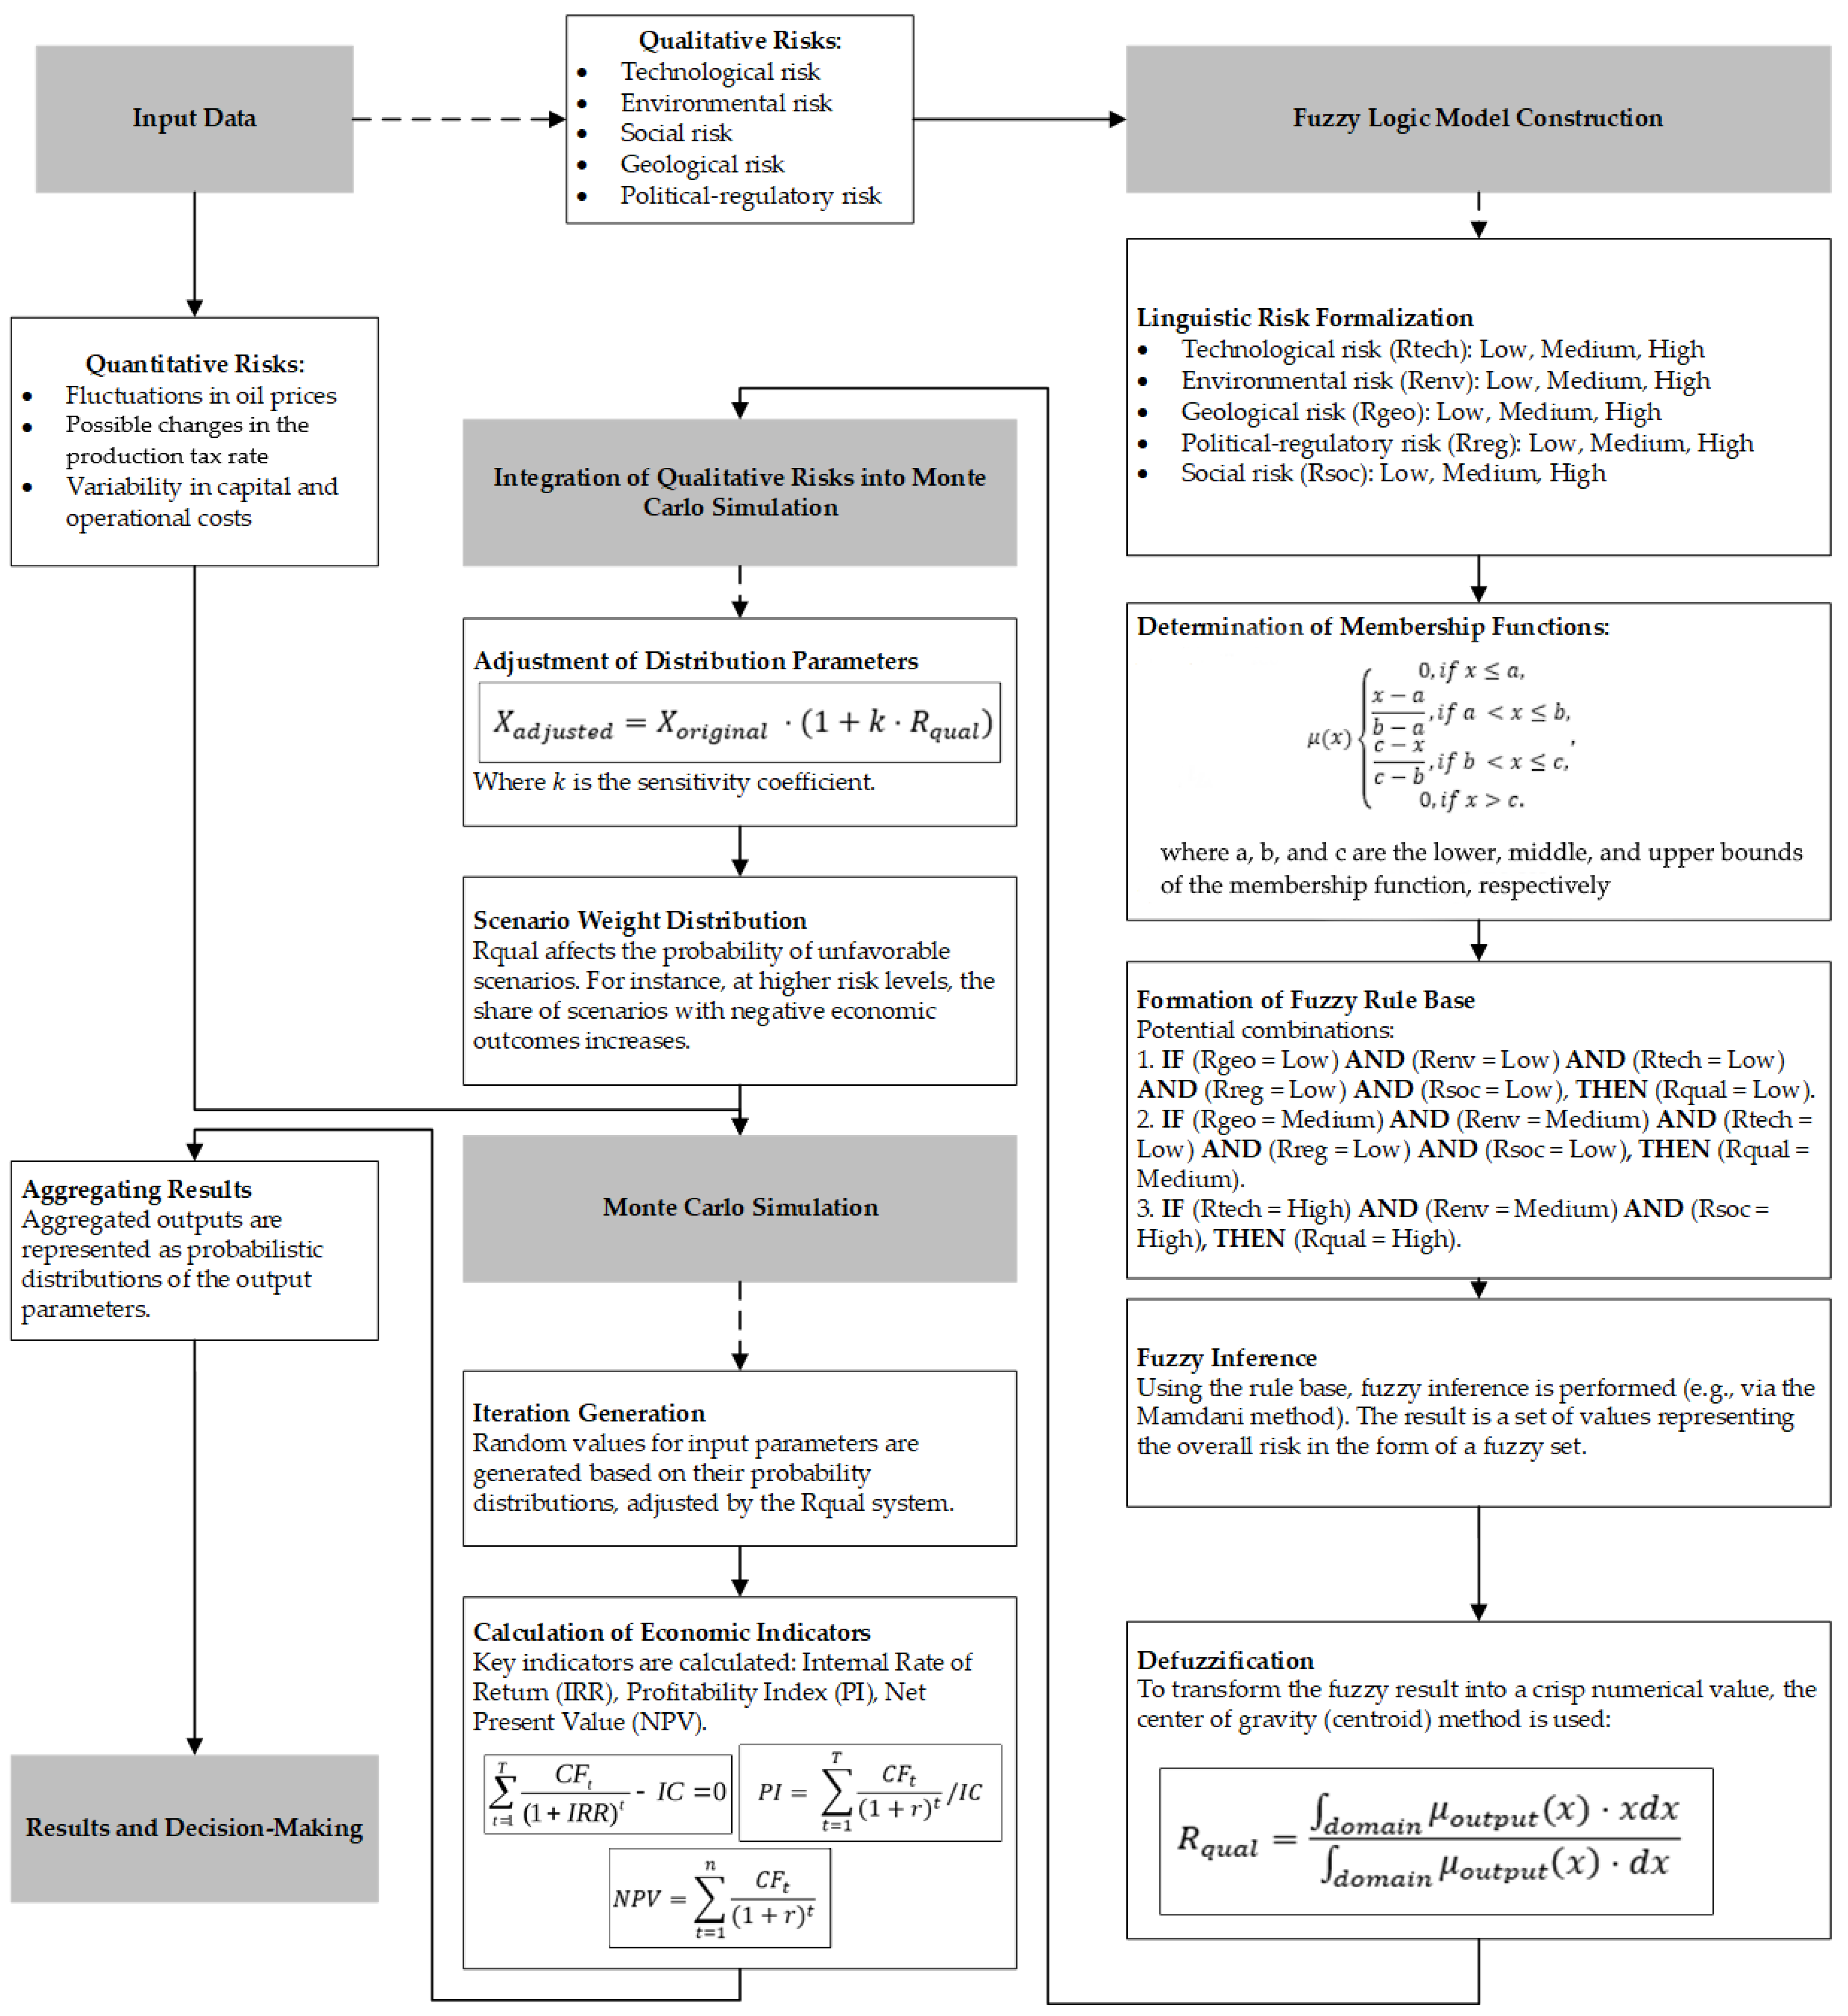
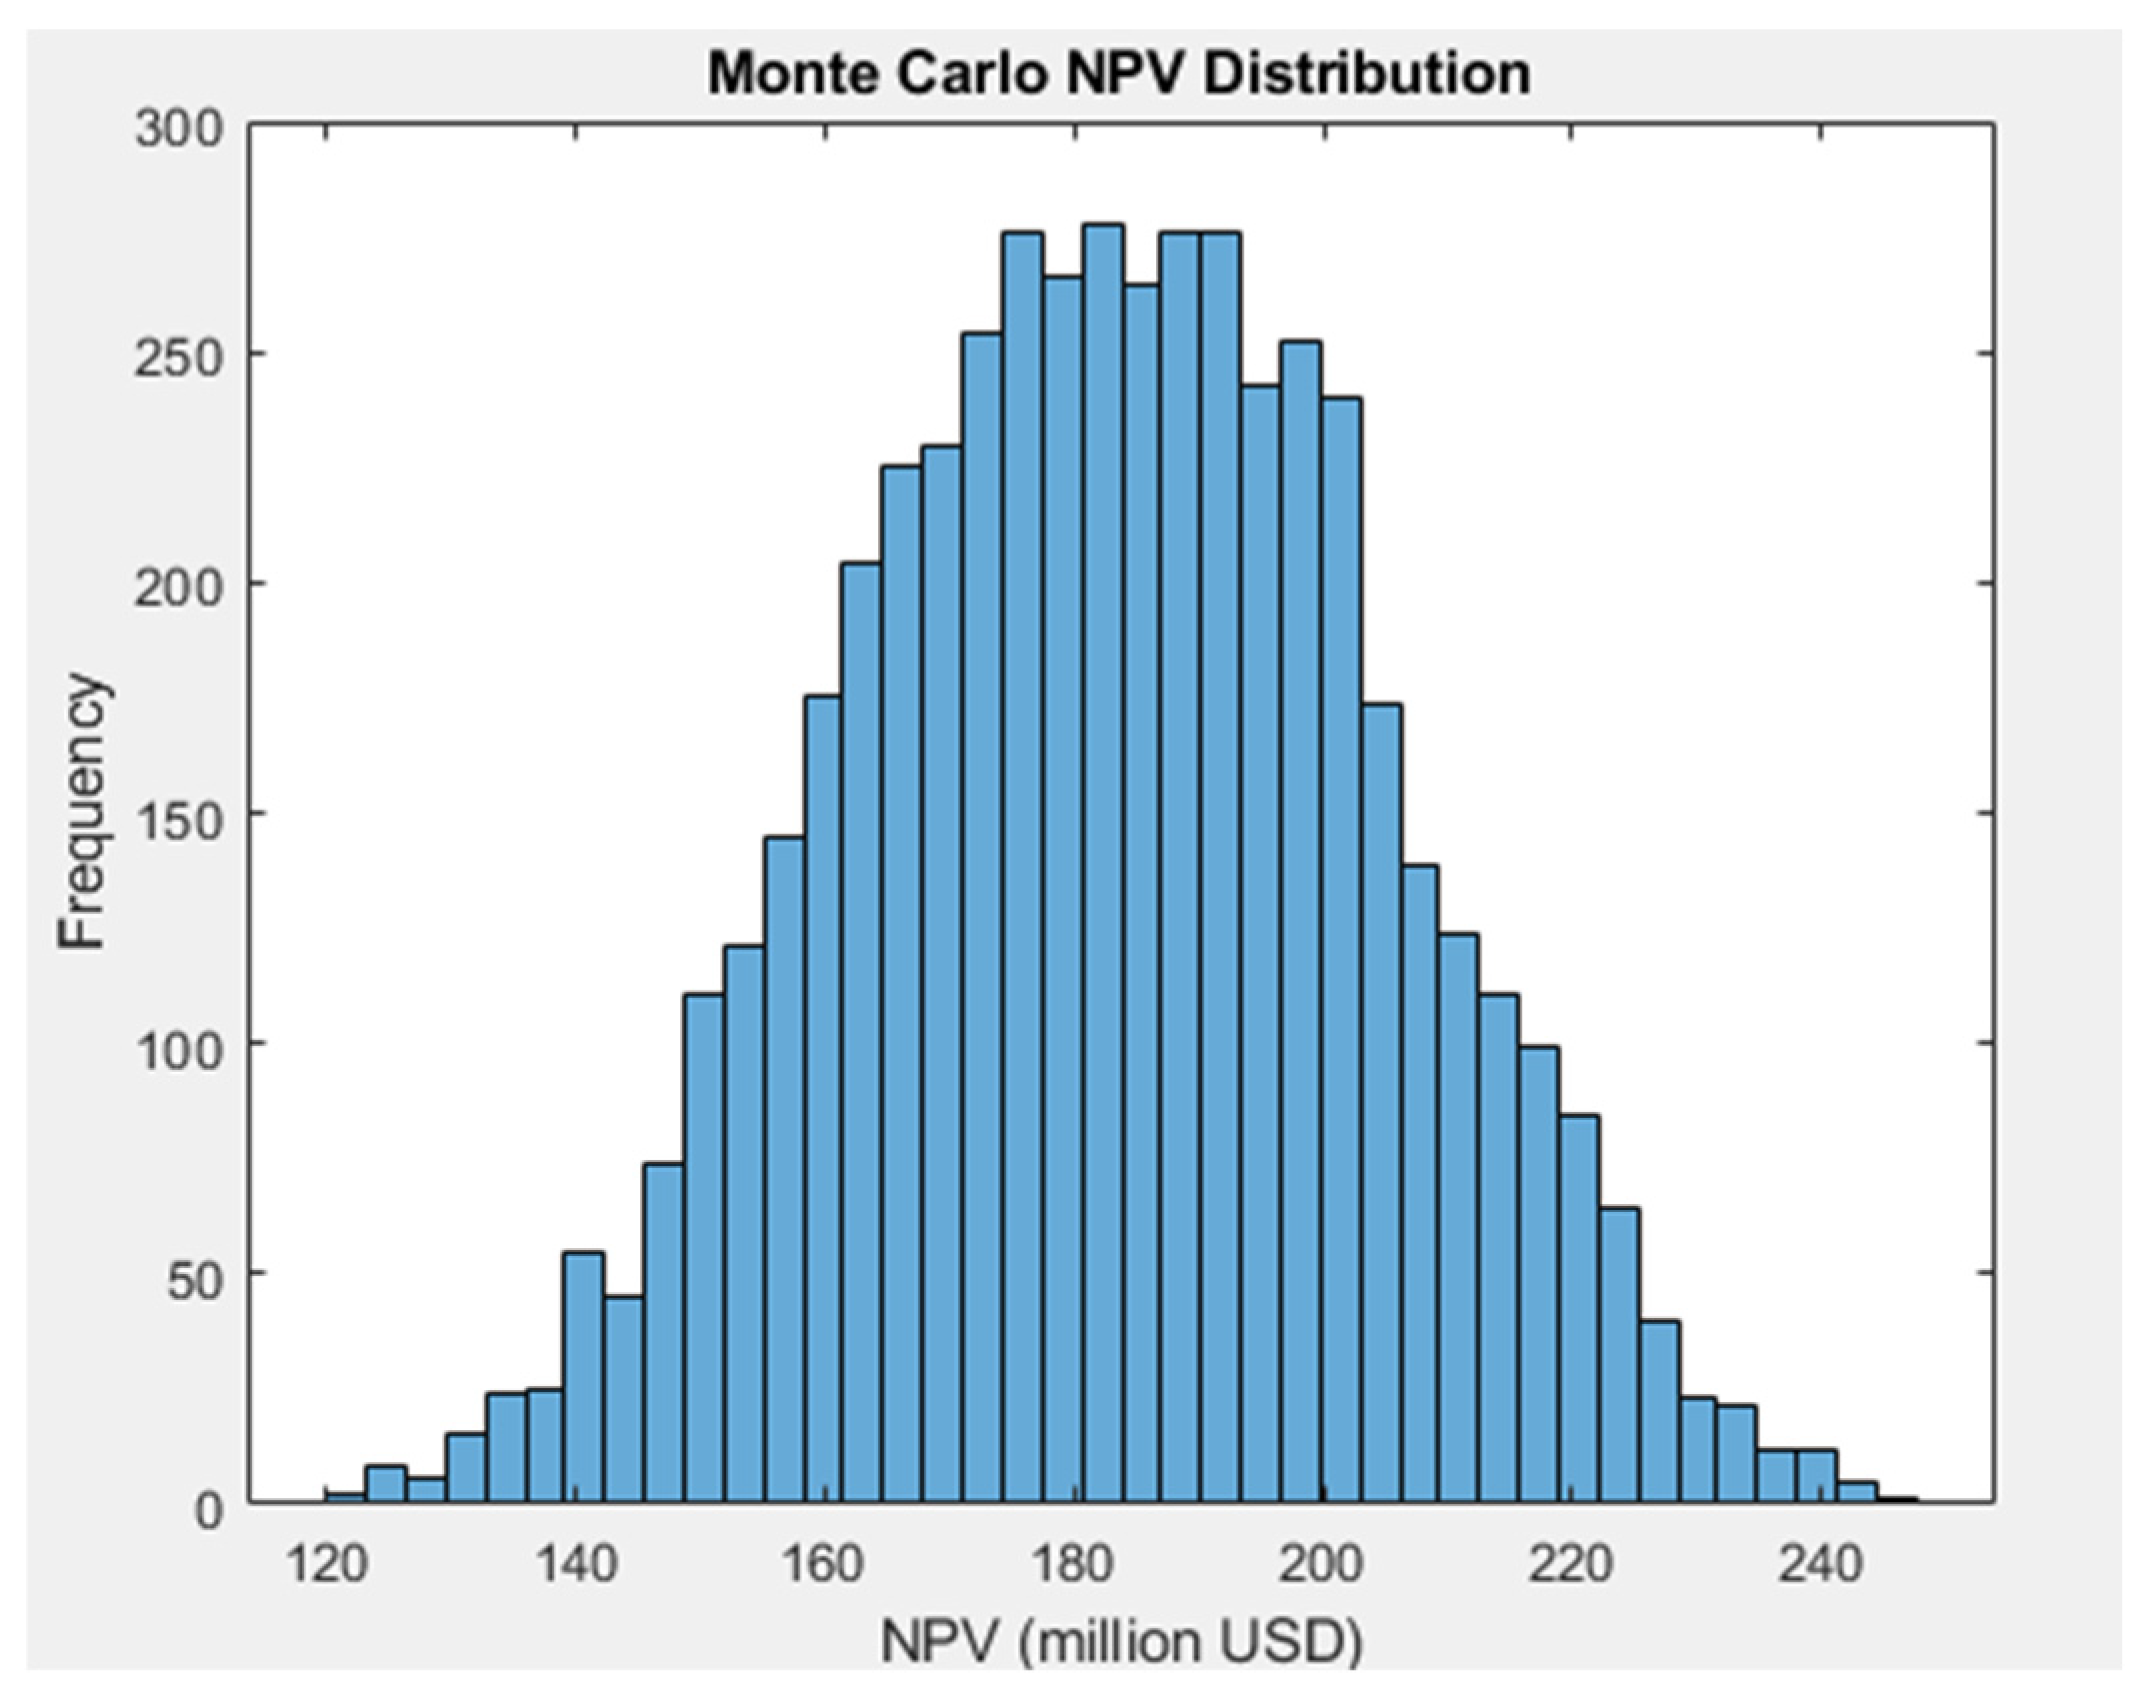
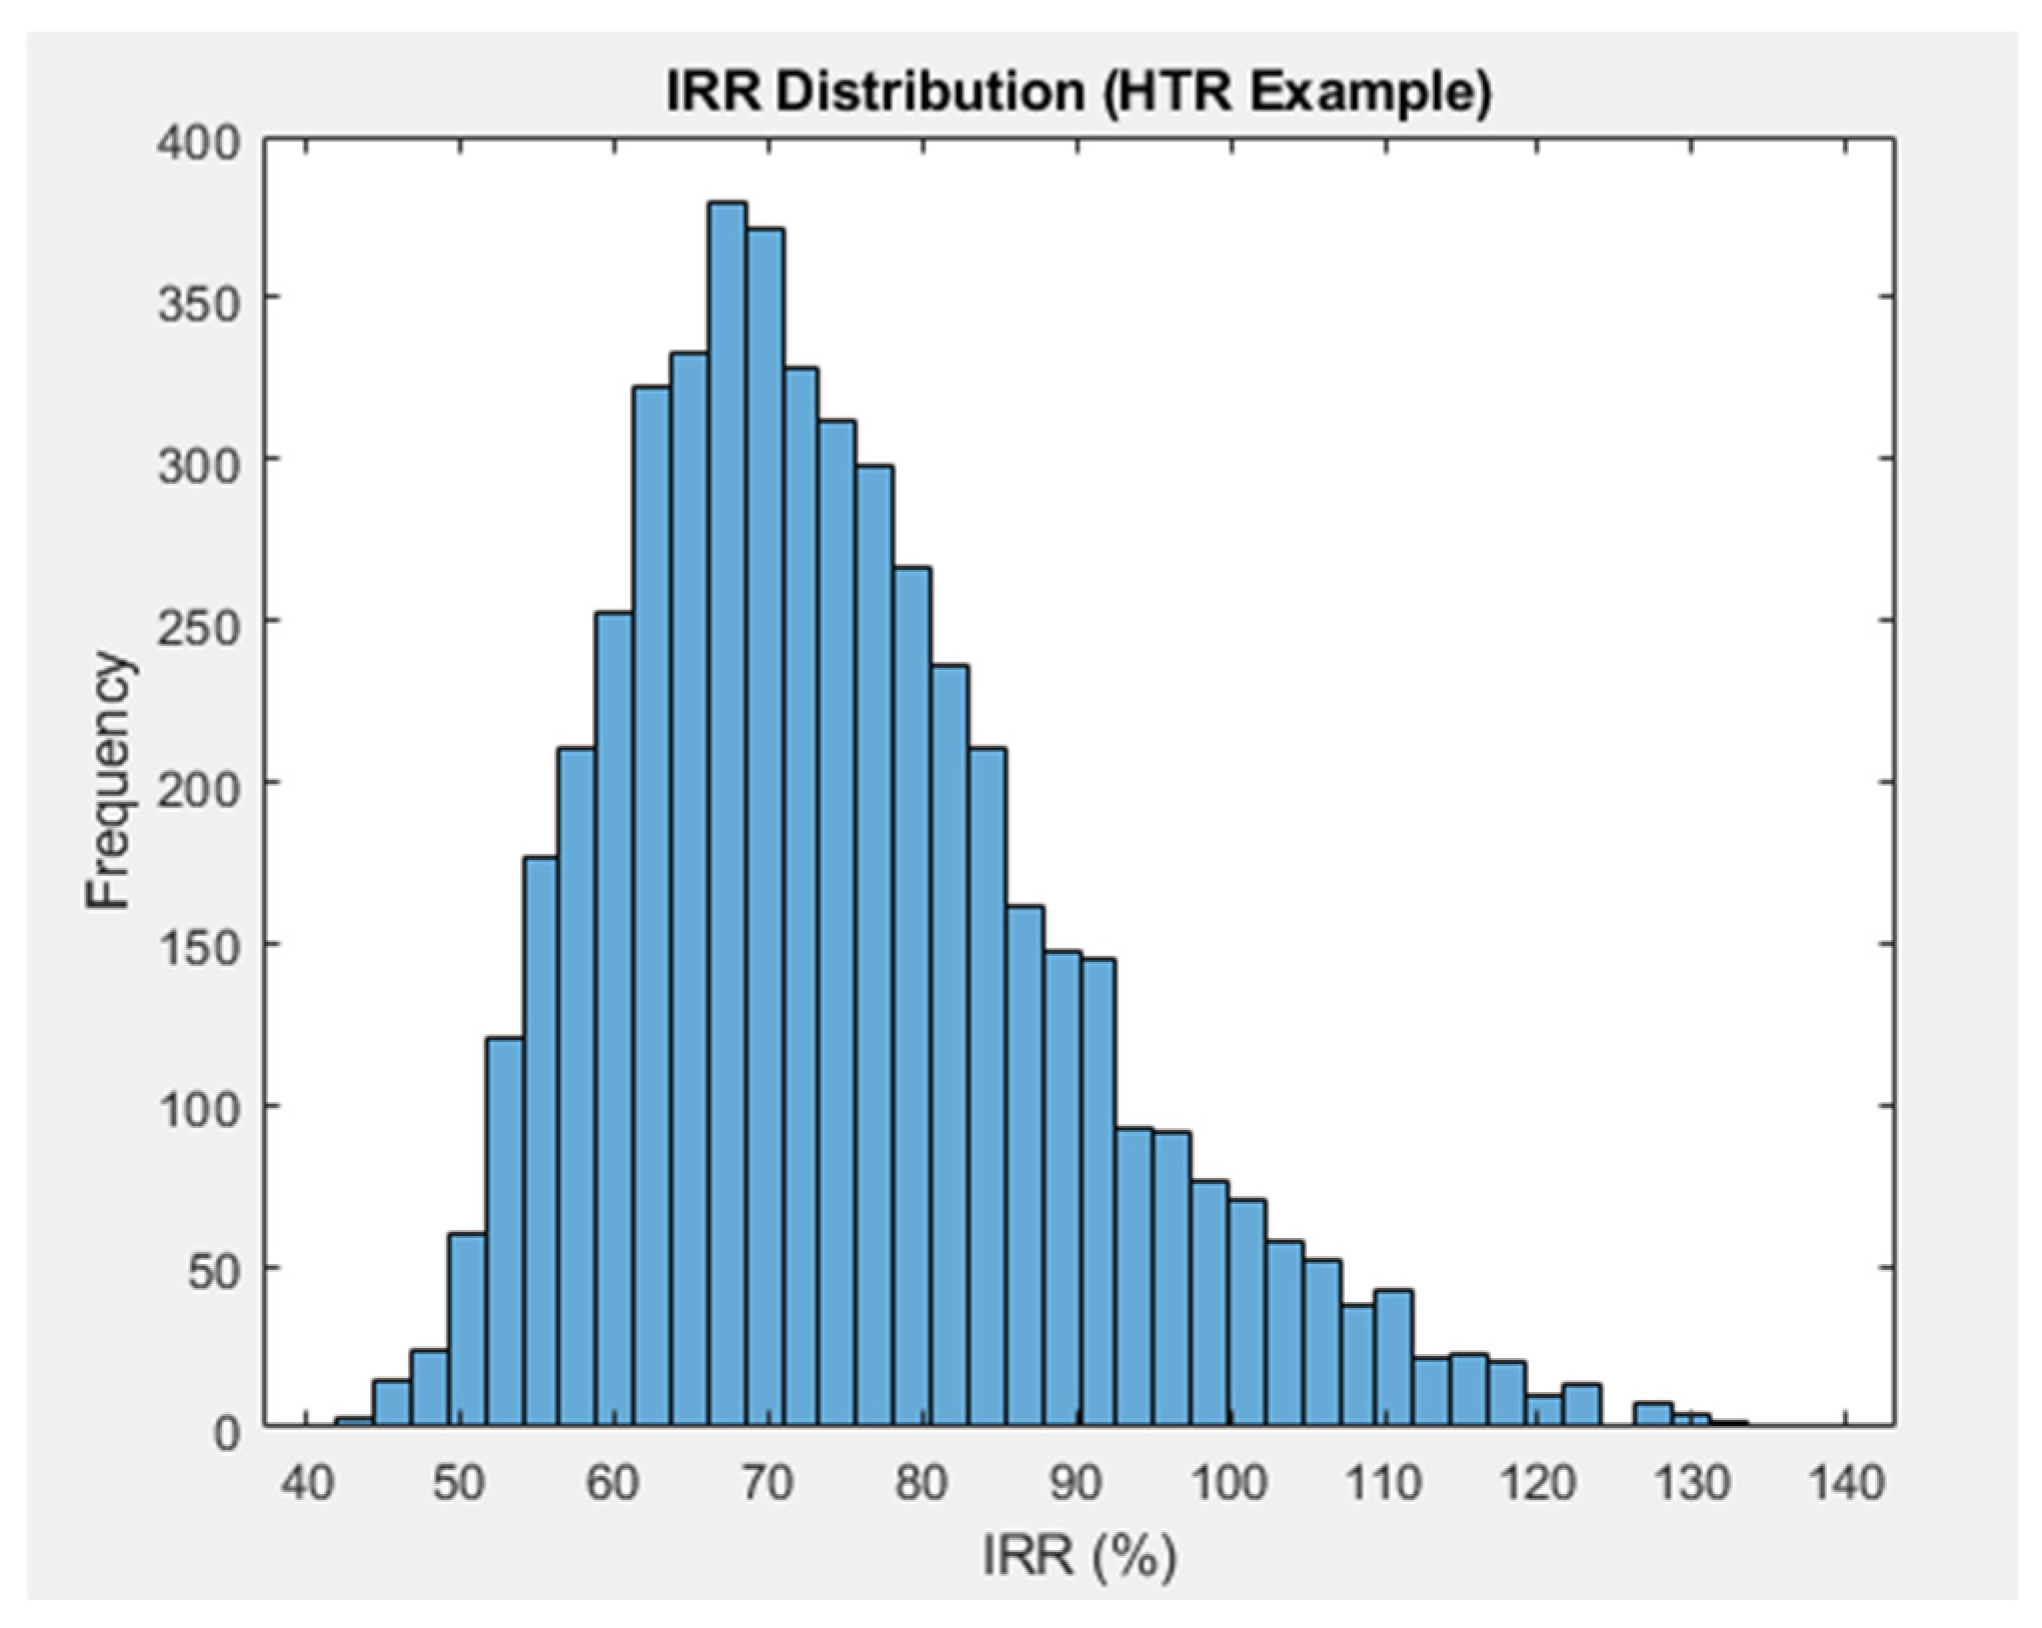

Disclaimer/Publisher’s Note: The statements, opinions and data contained in all publications are solely those of the individual author(s) and contributor(s) and not of MDPI and/or the editor(s). MDPI and/or the editor(s) disclaim responsibility for any injury to people or property resulting from any ideas, methods, instructions or products referred to in the content. |
© 2025 by the authors. Licensee MDPI, Basel, Switzerland. This article is an open access article distributed under the terms and conditions of the Creative Commons Attribution (CC BY) license (https://creativecommons.org/licenses/by/4.0/).