Article

Geochemical Characterization of Groundwater in a Volcanic System

by
Carmelo Bellia
1,†,
Adrian H. Gallardo
2,*,†,
Masaya Yasuhara
1,† and
Kohei Kazahaya
1,†
1
National Institute of Advanced Industrial Science and Technology (AIST), Geological Survey of Japan, 1-1-1 Higashi, Tsukuba, Ibaraki 305-8561, Japan
2
Argentina National Scientific and Technical Research Council (CONICET), FCFMyN, Department of Geology, San Luis National University, Ejercito de los Andes 950, San Luis 5700, Argentina
*
Author to whom correspondence should be addressed.
These authors contributed equally to this work.
Resources 2015, 4(2), 358-377; https://doi.org/10.3390/resources4020358
Submission received: 14 March 2015 / Revised: 29 May 2015 / Accepted: 2 June 2015 / Published: 12 June 2015
(This article belongs to the Special Issue Groundwater Quantity and Quality)

Abstract

:
A geochemical investigation was undertaken at Mt. Etna Volcano to better define groundwater characteristics of its aquifers. Results indicate that the Na–Mg ± Ca–HCO3 ± (SO42− or Cl) type accounts for more than 80% of the groundwater composition in the volcano. The remaining 20% is characterized by elevated Ca2+. Waters along coastal areas are enriched in SO42− or Cl, mainly due to mixing with seawater and anthropogenic effects. The majority of the samples showed values between −4‰ to −9‰ for δ18O and −19‰ to −53‰ for δ2H, suggesting that precipitation is the predominant source of recharge to the aquifers, especially in the west of the study area. The analysis of δ13C and pCO2 shows values 1 to 3 times higher than those expected for waters in equilibrium with the atmosphere, suggesting a partial gas contribution from deep sources. The diffusion of gasses is likely to be controlled by tectonic structures in the volcano. The ascent of deep brines is also reflected in the CO2 enrichment (up to 2.2 bars) and enriched δ2H/δ18O compositions observed in the salt mounts of Paternò.

1. Introduction

Mt. Etna is located on the east coast of Sicily (Italy). It is the tallest active volcano in Europe and one of the most active volcanoes in the world [1]. The volcanic deposits are the most important groundwater reservoir for the entire Sicily, as it is the only drinking water resource for over one million people who live at distances of more than 100 km [2]. The volcano rises over an important regional tectonic system, which causes the crust to break up into an intricate system of fractures and faults that together with geology, paleotopography and geometry of the sedimentary basement are the major factors governing the groundwater flow in the area.
Furthermore, seismic events and volcanic eruptions frequently reshape the morphology of the terrain, potentially altering flow conditions and modifying the groundwater composition. Agriculture and the development of urban and industrial centers such as Catania are largely dependent on the neighboring volcano. In this context, population growth and new economic activities continue to mount pressure on the environment and hence call for a more sustainable use of the region’s groundwater resources. Geochemistry and isotope investigations have been used commonly on Etnean aquifers to study the hydrological processes. For instance [3] determined that groundwater concentrations of minor and trace elements stood out with respect to other Italian aquifers due to the major contribution of volcanic gases and hydrothermal fluids. Later, [4] determined the origin and effects of fluid-rock interaction within Mt Etna by analyzing B, O, H, and Sr concentrations. Oxygen and Cl isotopes were used by [5] to determine groundwater recharge and flow paths along the flanks of Mt. Etna. Findings showed that groundwaters beneath intensely cultivated areas were enriched in 18O probably as a result of the evaporation of irrigation waters during summer. Finally, [6] investigated the isotopic signature of Etnean waters, and [7] used tritium activities to trace the age and movement of groundwater in the volcano in recent times.
The hydrology of Mt. Etna has been studied over a long period. This work further expands the current understanding by providing an updated snapshot in time of the geochemical and isotopic composition of Mt. Etna’s groundwater.

2. Study Area

2.1. Geological Background

Mt. Etna is located on the eastern coast of Sicily, Italy. The morphology of the volcano is shaped by four summit craters, a caldera of about 18 km perimeter and maximum depth of 1000 m called “Valle del Bove”, and numerous side cones scattered along its flanks (Figure 1). Slopes are gentle (7°–8°) up to an elevation of 1800–2000 m above sea level (A.S.L.), increasing to 20°–25° at higher elevations. The volcanic edifice consists of a lower shield unit overlain by a stratovolcano. The shield rests discordantly on Miocene flysch deposits to the NW, and argillaceous Pleistocene sediments to the SE [8,9] and consists of plateau terraces of submarine lavas derived from fissural emissions generated at an early stage, approximately 500 ka. The basal unit was followed by pyroclastic material and sub-aerial tholeiitic lavas outcropping rather discontinuously in the southern sectors of the volcano approximately 300 ka [10]. Products changed in composition about 200 ka to transitional and later Na-alkaline tholeiites [11].
Figure 1. Outline of the investigation area and hydrogeological basins within Mt. Etna.
Resources 04 00358 g001
Currently, Mt. Etna releases about 11.66 kTons/day of CO2 from the summit and as diffuse soil emanations from the upper flanks [12]. This quantity is much larger than other active volcanoes and corresponds to about 10%–15% of the CO2 produced by all the volcanoes on the planet [13].
The climate of the region follows the pattern of the Mediterranean region, with higher precipitations in autumn and winter. Most rainfall occurs to the east, reaching up to 1200 mm/year. To the south, the average precipitation decreases to about 440 mm/year, with a wide range of intermediate conditions in between. At heights above 2000 m precipitation tends to occur as snow.

2.2. Hydrogeological Setting

Mt. Etna hydrogeological settings are similar to other basaltic volcanoes: fissured and highly permeable lavas are interbedded with discontinuous layers of low permeability pyroclastics. According to [9,14], typical Etnean aquifers can be described as unconfined and hosted by highly permeable volcanites. On the basis of structural, geological and geophysical data, three main hydrogeological basins were defined (Figure 1): (1) the eastern basin, with flow towards the Ionian Sea; (2) the southern and western basins flowing towards the Simeto River; and (3) the northern basin with flow to the Alcantara River [14,15]. Groundwater recharge preferentially occurs at high elevations where rainfall infiltrates through the unsaturated sediments and then follows a radial pattern towards the peripheral sedimentary terrains. Groundwater flow originating at lower heights, where the volcanic cover is much thinner, is mainly controlled by the shape of the impermeable substrate. According to [16], Etna’s volcanites generally have a high intrinsic permeability (2.5 × 10⁻⁷ to 2.9 × 10⁻⁶ cm2). In contrast, the permeability of the basement sediments would average 10−10 cm2 [17].
The absence of a developed hydrographic system on the surface suggests an important circulation of groundwater, highlighted by the presence of hundreds of springs and wells of significant flow rates. Yields over 80 L/s have been described by several authors since the 70s [16,18].
Recent hydrogeochemical studies (e.g., [19,20]) indicated that groundwater in Mt. Etna has a general composition of bicarbonate type, with a few samples of chloride-sulphate type. The relative abundance of major elements in solution is generally (Na, Mg) > Ca > K for cations, whilst HCO3 always prevails over other anions [20].
Findings from [21,22] using δ18O and δ2H data suggested that Etnean groundwaters are meteoric in origin. Nevertheless, more recent work from [5] showed that the isotopic imprint of groundwater in Mt. Etna might reflect several sources such as evaporation from the Mediterranean Sea to the east, moisture from the Atlantic Ocean on the lower northern flanks, and volcanic vapor affecting precipitation on the upper regions of the cone.

3. Sampling and Analytical Methods

An extensive sampling campaign was undertaken in early 2014 at Mt. Etna to determine the chemical characteristics of groundwaters in the volcano. Samples were collected during three stages from 46 boreholes, 14 springs, 2 surface water points, and 6 locations within the so-called “mud volcanoes” (Figure 2). The bores are all being used for water supply or are connected to storage tanks. As a first measure, piped water-supply and taps were disinfected with a 10% hypochlorite solution and water run for a few minutes before sampling commenced. Samples were then directly collected from the source, field-filtered at 0.45 µm, and stored in 500 mL plastic containers for the analysis of dissolved inorganic elements. Bottles were cooled to 4° and dispatched for analysis within 48 h. A number of field blanks and duplicates were also sent to the laboratory for quality control. Standard parameters (pH, EC, temperature) were measured in situ using a Hydrolab Qanta probe, while a colorimetric titration kit was employed to calculate the alkalinity (HCO3) content in waters. Chemical concentrations were determined at the laboratories of the Geological Survey of Japan in Tsukuba. Major cations were analyzed by an inductively coupled argon plasma atomic spectrophometer (ICP-AES), and anion determinations were carried out by ion-chromatography. Additional samples were collected for the analysis of carbon-13 (δ13C), and treated in the field with HgCl2 to prevent biological fractionation. These samples were stored in glass bottles and analyzed by a mass spectrometer. Results were reported as ‰ deviations (per mil) from the PeeDee Belemnite standard. Oxygen and hydrogen isotopes were also measured by an isotope ratio mass spectrometer. Measurements were referenced to the VSMOW international standard, and reported in the conventional delta notation.
Figure 2. Location of the sampling sites in Mt. Etna.
Resources 04 00358 g002

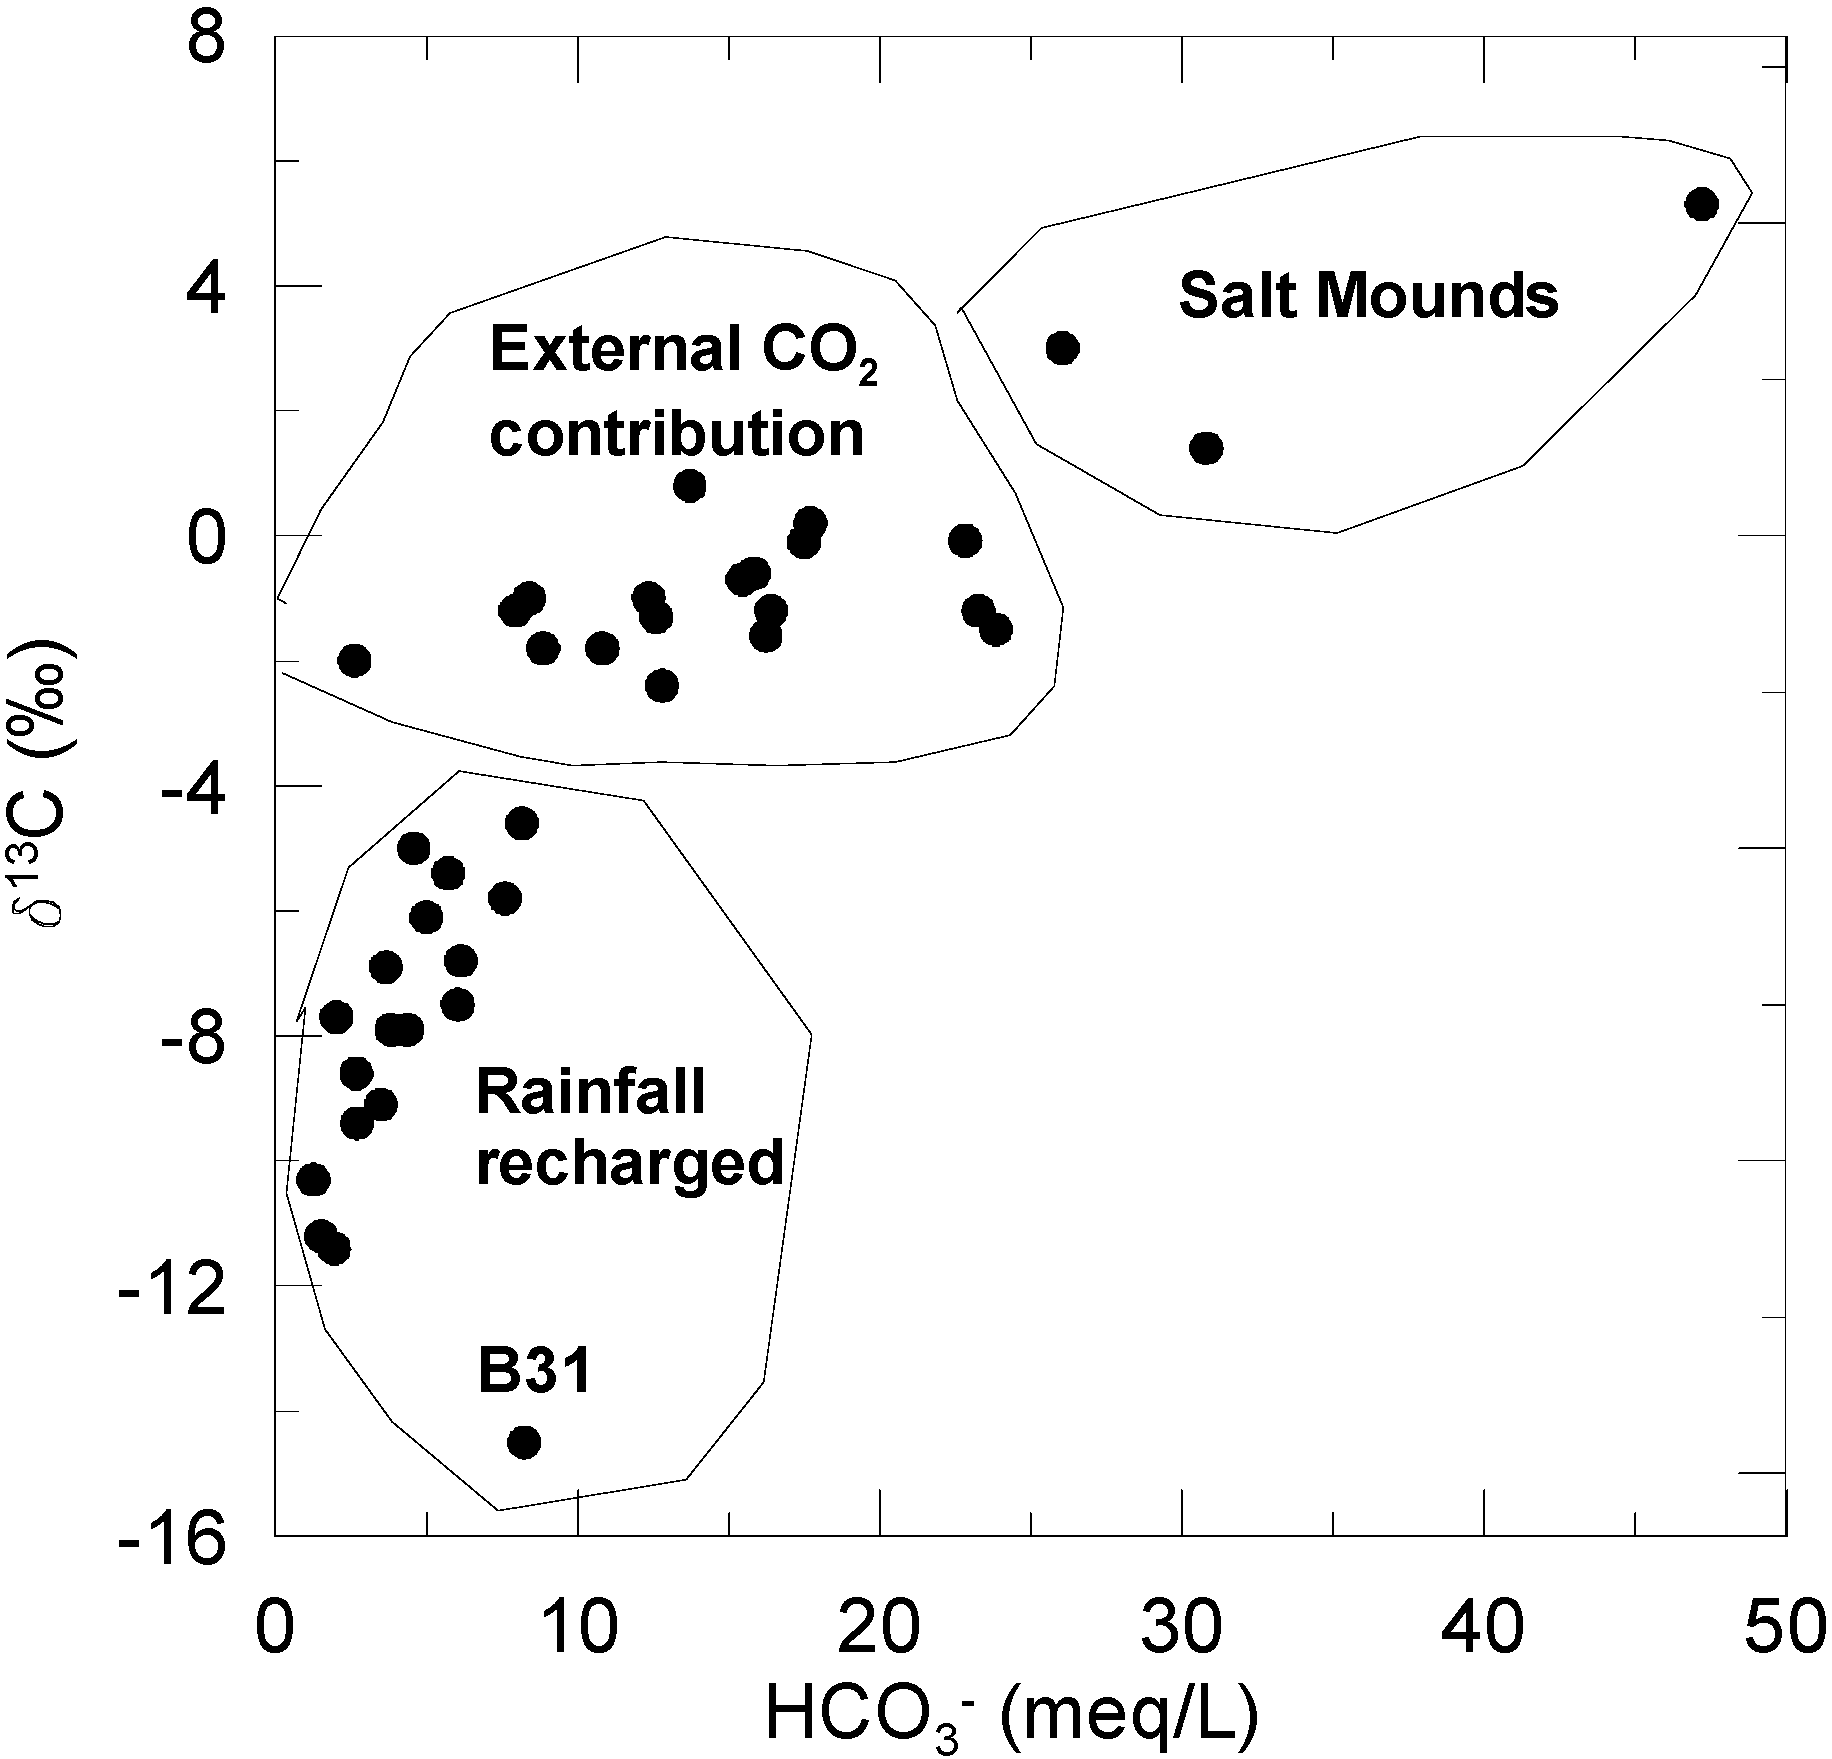
4. Results and Discussion

4.1. Groundwater Composition

Table 1 summarizes the groundwater composition of Mt. Etna groundwaters found in this study.
With the exception of SO42−, ion concentrations increase towards the west, where values are usually two to three times higher than neighboring regions (Figure 3).
There is a general inverse relationship between water mineralization and elevation. The lowest groundwater contents were recorded on the north, and towards the cone summit in the eastern basin. In contrast, maximum concentrations were measured on the southernmost flank of the volcano (western basin). Results also indicate that Etnean waters have low temperatures, with an average of 17 °C. The highest water temperatures were recorded in intense tectonically fractured areas such as Paternò, Biancavilla, and Adrano in the West, and between Pozzillo and Zafferana in the East. This is consistent with [23], who argued that in an active volcanic system such as Mt. Etna, the transfer of deep gases (and the associated heat) toward the surface occurs principally along zones of high permeability in the crust.
Table 1. Average major and trace elements composition of waters sampled in the Mt. Etna.
SampleBasinTemp.ECpHHCO3FClNO3PO4SO4NaKCaMgTDSHardnessPCO2 at 20°
°CµS/cmmeq/Lmeq/Lmeq/Lmeq/Lmeq/Lmeq/Lmeq/Lmeq/Lmeq/Lmeq/Lmg/L°fHbars
B11E9.12197.352.620.020.290.020.020.301.350.210.691.3814910.30.007
B12E1811387.778.160.043.280.92-1.706.070.653.504.57736.640.30.009
B13E11.42897.921.260.011.490.30-0.571.330.250.641.87252.312.60.001
B14E14.711238.293.840.036.151.48-2.997.730.521.915.95997.939.20.001
B15E10.62828.372.020.010.960.090.020.792.210.240.571.13191.18.50.001
B16E-3000.033.00--1.432.75-0.340.331.1----
B17E15.813296.858.860.034.250.73-3.768.690.773.735.53912.946.20.079
B18E5.64247.824.580.030.960.01-1.683.790.351.601.46307.515.30.004
B20E14.12988.392.700.010.510.240.050.521.120.331.920.61203.712.60.001
B21E16.49677.328.240.062.470.46-1.915.070.642.157.67723.449.00.025
B22E13.93737.873.660.020.700.08-0.652.460.281.201.30224.712.50.003
B24E17.45447.83.900.031.370.31-0.692.990.260.701.75268.2-0.004
B25E1610566.587.080.021.720.61-2.354.150.572.424.60574.1-0.118
B26E17.515706.5710.670.032.740.280.023.867.070.853.456.75838.6-0.181
B27E177186.585.030.021.030.85-1.422.620.401.783.10410.7-0.084
B28E168866.46.440.021.350.21-1.623.470.542.093.87458.8-0.162
B29E269447.338.520.011.140.16-0.955.150.461.883.59449.4-0.025
B30E18.85887.83.330.031.630.50-0.793.080.250.761.90303.1-0.003
B31E29.8152778.890.052.860.41-4.155.430.763.666.80827-0.056
B32E17.89967.256.930.032.390.19-1.574.820.471.454.64522.7-0.025
B33E21.311806.88.540.031.770.610.022.524.350.522.785.71647.5-0.085
S6E17.623007.954.370.0017.30.77-3.5918.620.823.744.651693.541.90.003
S7E16.8-7.641.520.032.971.77-2.783.250.811.445.03638.132.30.002
S8E14.93308.151.950.020.770.18-1.142.140.230.731.34210.810.40.001
S9E15.59818.446.140.042.881.250.052.525.490.502.685.29729.939.80.001
S10E15.36767.745.000.042.460.41-0.753.770.412.232.39441.723.10.006
S11E14.34437.793.500.020.860.33-0.962.610.301.311.85283.615.80.004
S12E19.716707.513.100.042.841.01-3.257.510.662.798.90935.2-0.026
R1River E11.24908.735.720.030.780.10-1.032.110.191.844.61395.232.20.001
B1W712687.9817.510.063.560.100.051.1010.040.666.752.84869.347.90.012
B2W15.913356.4616.340.023.070.02-0.188.810.693.859.48939.266.60.355
B3W15.110046.812.800.032.560.09-1.495.100.772.726.46679.745.90.128
B4W8.88326.212.180.030.910.08-0.874.120.480.646.82486.937.30.502
B5W15.414416.7117.710.042.170.21-0.566.820.786.096.07852.260.80.218
B6W1511537.1112.360.042.860.29-0.935.650.575.094.83746.749.50.061
B7W16.710137.497.940.032.900.75-1.464.890.543.283.58624.334.30.016
B8W18.19896.488.400.032.500.070.021.464.660.663.443.53574.234.80.176
B9W13.93848.242.680.040.660.08-0.682.260.230.810.94182.38.80.001
B10W16.419516.8423.850.064.650.170.020.726.830.591.2118.04119296.20.217
B19W17.11093.67.717.600.019.682.200.026.6313.190.827.843.841488.458.30.009
B23W12.19247.4213.720.030.900.03-0.564.870.544.703.78571.243.30.033
B34W18.715826.5117.490.051.870.01-0.456.500.522.6210.68827.3-0.341
B35W14.911826.0612.430.041.270.09-0.944.540.542.417.68638.3-0.683
B36W2320517.117.870.033.631.51-2.0910.240.952.4010.941114.8-0.090
B37W16.318007.4113.330.044.400.93-3.099.940.562.028.87995.6-0.033
B38W14.511946.5111.840.031.440.190.031.154.400.532.417.62648.3-0.231
B39W17.617666.9814.720.043.160.97-2.628.300.682.559.65976.8-0.097
B40W1925607.321.900.095.324.80-4.4211.720.915.8314.721784.3-0.069
B41W1818257.0713.640.043.341.36-4.198.430.682.959.801060.1-0.073
B42W2018606.814.570.043.510.97-3.158.640.613.179.421020.3-0.146
B43W16.412286.0814.700.041.480.02-0.535.290.502.658.78708.4-0.772
B44W2013156.1814.770.041.470.00-0.535.320.512.648.83708.9-0.616
B45W16.212126.2812.020.031.380.250.021.034.510.532.357.57645.4-0.398
B46W14.612505.9313.720.041.22--0.634.730.552.518.33662.3-1.017
S1W14.212648.4810.820.043.050.610.062.708.460.665.133.50822.843.10.002
S2W1511696.8515.470.031.750.07-0.337.240.621.829.8277858.20.138
S2-1W13.712157.0816.730.052.23--0.208.640.673.2410.22902.567.30.086
S2-2W151240715.850.042.060.02-0.256.810.535.304.64717.449.70.100
S3W19.817346.9622.340.051.980.06-1.097.830.370.8612.64866.867.50.158
S4W19.218516.1522.560.032.150.04-0.698.490.490.4813.91917.471.91.039
S5W1615058.3315.610.043.850.32-1.749.190.665.224.5388148.70.005
SM1Salinella10.267,6006.147.21.031343.4---1266.216.614.151.781,393.9328.92.2
SM2Salinella36.5110,6006.126.0-1234.71.3-14.01158.119.017.096.175,158.2565.51.3
SM2aSalinella12.671,7006.128.42.031286.1---1186.919.616.388.977,382.8525.61.4
SM2bSalinella11.871,6006.335.42.361317.9--8.11215.719.517.688.580,007.4530.41.2
SM2cSalinella16.472,1006.328.21.391289.1--11.61186.416.519.376.777,444.8479.60.9
SM3Salinella18.860,1006.230.80.911138.8--10.21037.316.933.354.568,910.1438.51.3
RRiver W9.510988.546.040.012.910.30-6.768.260.535.494.901198.851.90.001
M1Seawater10.039,8007.83.31.07626--58.654612.969.845.740,3085770.003
Figure 3. Stiff diagrams displaying average ion concentrations in the sampled waters.
Resources 04 00358 g003
Furthermore, high-temperature volatiles released from the magma could interact with descending meteoric waters causing a general increase of the temperature in the rest of the aquifer. This is in line with [24], who suggested a main magmatic signature linked to degassing of an enriched mantle beneath Mt. Etna. [25] characterized Etna’s magma as CO2-rich while [26], hypothesized that the asthenosphere beneath the volcano rises to a depth that permits the continuous escape of CO2 from the mantle. Present findings of CO2 partial pressure °pCO2), also suggest that Etnean waters might interact with CO2 of deep origin, arguably magmatic. Measured pCO2 varies between 5 × 10⁻⁴ and 2.2 bars and more than 90% of the samples exhibit values 1 to 3 orders of magnitude higher than those expected for waters in equilibrium with the atmosphere (pCO2 = 10−3.6 bar). These positive emission anomalies could be attributed to the release of CO2 by fresh magma that intruded into the volcano plumbing system [27,28]. In contrast, the anomalous high pCO2 values (1.04 bars) in sample S4 could be ascribed to local waters rapidly charged with CO2 and dissolved elements from the surrounding soil matrix. This would also explain the high conductance values among the sampled springs. Maximum pCO2 values (up to 2.15 bars) were recorded at the “Salinella” mounts near Paternò, on the southern fringes of Etna. In here, the source of the fluids would be associated with a hydrothermal system enriched in CO2 with temperatures between 100 °C to 150 °C that extends between Paternò and the central part of the Etna [29].
Direct inputs of deep CO2 are a key factor in determining the chemistry of Etnean waters. In effect, the interaction between CO2 and infiltrating rain water lowers the pH to values below 4 [30]. These low-pH waters become highly reactive resulting in chemical weathering of the host basaltic rocks. As a result of this process, HCO3 (along with H2CO3 and CO32−) is gradually generated, whilst Mg, Ca, K, and Na are released into solution. The general positive relationship between HCO3 and these cations (especially Na+ and Mg2+) supports the idea that dissolution from acidic waters is as a major mechanism for the mineralization of Etnean aquifers (Figure 4). Bicarbonate concentrations are normally higher in the western basin, with values up to 23.8 meq/L around the towns of Paternò, S.P. Clarenza, and Biancavilla. In contrast, groundwater in the eastern basin shows a more limited enrichment in HCO3, with concentration values approximately 1/3 (~5 meq/L) of those observed in the west. This is in line with [31], who argued that chemical weathering in Etna is not spatially uniform since the presence of CO2 in soils is more abundant in particular areas of the volcano, such as the south-western flank.
Figure 4. HCO3 against major cations in groundwater.
Resources 04 00358 g004
Furthermore, HCO3 concentrations appear to be influenced by the ground surface elevation. There is a negative trend between HCO3 and elevation, with the lowest concentrations towards the volcano’s summit. As discussed, more restricted hydrological circuits mean that CO2-enriched waters near the top of the edifice have fewer opportunities to react with the host basaltic rocks. Lower dissolution rates translate into lower HCO3 concentrations and a general decrease in the total dissolved solids content (TDS) of the waters.
Electrical conductivity (EC) from 1000 to 2000 µS/cm, and TDS values between 700 mg/L and 1400 mg/L were found to be representative for groundwater in the southernmost flank of Mt. Etna. Exceptional salinities detected at S6 near Catania (EC = 2300 µS/cm; TDS = 1694 mg/L) are attributed to partial mixing with seawater in proximities to the Ionian coast. Longer residence times favoring basalt leaching would be an additional factor explaining the higher salinity in the SW sector of Etna [32]. Conversely, the eastern flank is characterized by EC values between 500 and 1000 µS/cm, and TDS from 300 to 1100 mg/L. This lower TDS might be ascribed to water circulation in more transmissive sediments that facilitate the flow of meteoric recharge and reduce the transit time underground. Elevation would be another factor controlling the TDS distribution in groundwater. Dissolved solids in samples above 600m A.S.L. are usually below 500 mg/L, which can be attributed to the limited water-rock interaction at high elevations. As expected, groundwater at higher elevations receives direct recharge from precipitation, which is unable to interact with the host rocks for long enough to produce major changes in its chemical composition.
Major cations (Ca2+, Mg2+, Na+, K+) show a similar distribution to TDS. Calcium concentrations average 2.7 meq/L. Higher values were recorded south of Adrano (7–7.8 meq/L), and between Belpasso and Camporotondo (5–7 meq/L) towards the western margin of the volcano. The lowest concentrations were measured south of Paternò and north of Ragalna, on the southwest (<1.5 meq/L). Again, groundwater in the western basin reflects more extensive water-rock interaction due to longer transit and residence times. This may be explained by the rainfall distribution, as maximum precipitation (i.e., groundwater recharge) occurs on the eastern flank of the volcano, contrary to the western flank that receives lower rainfall and consequently shows prolonged interactions between groundwater and the host rock [33].
In particular, Ca2+ and K+ have a similar distribution, with sharp concentration variations around the region of Paternò. These changes occur over short distances and reflect different aquifers. Higher salinities can be related to contact with alkaline brines discharged by the Paternò mud volcanoes (Salinelle), although groundwater mineralization through permeable faults can still exert some influence.
Magnesium reaches maximum concentrations in the western basin at S.P Clarenza, and over a vast area up to Catania. There exists a close relationship between Mg2+ and HCO3. This suggests that dissolution caused by CO2-enriched waters on the host rocks is common to both species. In particular, the source of Mg2+ can be explained by the leaching of olivines and pyroxenes from the basaltic rocks in the substrate.
Chloride concentrations range from 0.3 to 17 meq/L. In principle, the abundance of Cl might be attributed to alteration of the volcanic rocks and to the interaction of groundwater with volcanic gases [3]. As in the case of Na+, maximum Cl contents (~17.3 meq/L) were measured at S6, near Catania, likely due to mixing with seawater. Figure 5 shows that waters near the coast exhibit a Na/Cl ratio closer to the 1:1 line, unlike samples from the western basin that are partially depleted of Cl. Seawater intrusion and mixing between shallow groundwater and deep brines could be the reason for these patterns. This is also coincident with [9], who considered both mixing and water-rock interaction to be responsible for the increased salinity of groundwater in Mt. Etna. It is worthy to note that although evaporates do not crop out in the area, their presence beneath the volcanic cover has been hypothesized both from geological and hydrochemical data [21]. These deposits could thus be another contributing factor for Cl in groundwater.
Maximum concentrations of NO3 and SO42− were observed in the valleys that exist at low elevations in the volcano (e.g., south of Adrano). High concentrations are also visible within the stretch of land south of Giarre to Fiumefreddo, suggesting the leakage of fertilizers into the aquifers. The availability of water resources and the quality of the soils in the lower flanks of the volcano have favored the agricultural exploitation of the region since ancient times. Under conditions of high oxygen, part of the ammonium—sulphate fertilizers applied on the ground would be rapidly converted to NO3, which is not sorbed by the negatively charged soil colloids and moves readily to the water table [34]. At higher elevations (e.g., Valle del Bove), the SO42− inputs into groundwater could be controlled by the ascent of volatiles from vapor-dominated systems such as fumaroles rather than anthropogenic effects.
Figure 5. Relation of samples against the Na:Cl ratio.
Resources 04 00358 g005
In summary, groundwater in the area of study can be grouped into four main types: (1) Mg–Na ± Ca–HCO3 (with rare Cl or SO42−) (54%); (2) Na–Mg ± Ca–HCO3 ± (SO42− or Cl) (28%); (3) Na–Ca–Mg–HCO3 (12%); and (4) Na–Mg ± Ca–Cl (with HCO3 or SO42−) (6%). The differences between the first and second group are minor and mainly associated with variations in the Na–Mg and SO42−–Cl content (with relative concentrations normally higher for the second type). This implies that types “(1)” and “(2)” explain 82% of the waters in the region. Waters of the third group are associated with elevated Ca2+ concentrations, while the last type is characterized by high salinity. Samples enriched in Cl could be the result of mixing with seawater or solute diffusion from marine clay aquitards.
Additionally, carbonate waters are generally predominant in the western basin, probably due to the interaction with hydrothermal CO2. In contrast, the Cl–SO42− type is mainly found along the coast of the eastern basin due to saline influxes. Furthermore, the eastern coast is the area most densely inhabited and some anthropogenic effects are already reflected in the more elevated NO3 contents, likely derived from agricultural and urban wastewater (e.g., samples B14, S7, S9, S1).

4.2. Isotopic Signature

The isotopic signature of the sampled waters was also used to determine the recharge areas and circulation pathways in Mt. Etna (Table 2). Values for groundwater and spring samples fall between −4‰ to −9‰ for δ18O and −19‰ to −53‰ for δ2H. This is in close correlation with the Global Meteoric line (δ2H = 8 × δ18O +10‰, [35]) and the eastern Mediterranean local meteoric water line (EMMWL) defined by [36]: δ2H = 8 × δ18O + 22‰, suggesting a predominant meteoric origin for the collected samples (Figure 6). Similar trends had been reported by [4], who postulated that most waters in Mt. Etna originated as local precipitation infiltrated at an elevation between 1100 and 1900 m. Minor variations in the δ18O of the samples also suggest limited effects of rock interaction on the original water composition.
Table 2. Typical isotopic composition of Etnean waters.
Sample No.Sample TypeBasinDIC δ13C (PDB ‰)δ18O (‰ VSMOW)δ2H (‰ VSMOW)
B1BoreW−0.1−9.1−51.1
B2BoreW−1.6−8.6−45.3
B3BoreW−2.4−8.6−47.0
B4BoreW−1.3−7.8−41.2
B5BoreW−1.6−8.6−45.3
B6BoreW−2.4−8.6−47.0
B7BoreW−1.3−7.8−41.2
B8BoreW+0.2−7.4−38.8
B9BoreW−1.0−6.6−38.9
B10BoreW−1.2−6.7−28.6
B19BoreW−10.3−6.8−36.7
B23BoreW−7.9−6.1−29.0
S1SpringW−1.8−8.6−50.2
S2SpringW−1.8−8.6−50.2
S2-1SpringW−1.2−8.7−46.3
S2-2SpringW−0.6−8.7−46.6
S3SpringW−0.1−7.4−40.1
S4SpringW−0.7−8.6−46.6
S5SpringW−0.1−7.3−40.1
RRiverW−7.5−8.2−44.4
B11BoreE−1.0−7.5−37.4
B12BoreE−4.6−6.7−39.3
B13BoreE−8.6−7.2−38.9
B14BoreE−1.5−7.1−38.6
B15BoreE−2.0−7.4−37.5
B16BoreE-−6.3−33.0
B17BoreE−1.8−7.0−39.1
B18BoreE−4.6−6.7−37.7
B20BoreE−9.4−4.2−19.2
B21BoreE−14.5−6.0−34.3
B22BoreE−6.9−7.3−46.7
B24BoreE−7.7−7.1−31.5
B27BoreE−1.8−6.9−39.1
B28BoreE−5.0−7.8−42.2
B29BoreE−5.8−7.5−41.2
B30BoreE−9.4−4.1−19.2
B31BoreE−14.5−5.9−34.3
B32BoreE−6.9−7.3−46.7
B33BoreE+0.8−9.1−53.3
S6SpringE−11.2−6.2−33.7
S7SpringE−11.2−6.2−33.7
S8SpringE−11.8−6.7−37.9
S9SpringE−11.4−6.7−38.1
S10SpringE−6.1−6.9−36.5
S11SpringE−9.1−7.1−35.6
S12SpringE−1.2--
R1RiverE−5.4−8.0−44.9
SM1Salt mountPaternò-+8.8−14.5
SM2Salt mountPaternò-+10.4−12.0
SM3Salt mountPaternò-+7.5−13.6
Sm2aSalt mountPaternò+5.3+9.78 −18.2
Sm2bSalt mountPaternò+3.0+10.2 −21.5
Sm2cSalt mountPaternò+1.4+10.1 −19.8
M1Seawater--+1.1+1.3
A different trend is observed for waters collected in the salt mount brines. The “positive” isotopic ratio of the samples (i.e., δ18O up to about +10‰, and δ2H ranging from −21.5‰ to a maximum of −12‰) suggests that these waters could be mixed with hydrothermal fluids of deep origin following a more prolonged interaction with the host rocks.
Figure 6 also evidences the contrast between the mainly meteoric groundwater against Cl-enriched fluids from the salt mounts. As postulated by [4], the anomalous enrichment of Cl might be related to the proximity of the sampled bodies to areas of intense magmatic outgassing, where Cl-rich gases are likely to interact with shallow aquifers. Considering that the ratio Cl/δ18O in the salt mounts is higher than seawater (sample M1), the direct mixing between these two fluids would be improbable.
Figure 6. Relation between oxygen and hydrogen isotopic composition in Etnean groundwater.
Resources 04 00358 g006
Additional information may be inferred by assessing the geographical distribution of the stable isotope ratios in the volcano. Waters from the southern flanks of Mt. Etna are relatively homogeneous and generally fit with the EMMWL. In contrast, waters in the eastern sector deviate from the meteoric line suggesting that more complex processes could take place there. These processes might be associated to heterogeneous recharge and irregular circulation patterns, especially on the alluvial lowlands of the eastern basin, where surface runoff and upward flows could also affect the chemical signature of the waters. These observations are consistent with [4,15]), who described considerably more diversity for waters in the eastern flanks of the volcano.
The isotopic composition of the waters might also be influenced by the terrain elevation, although the relationship is generally limited and not always distinguished (Figure 7). In effect, samples with a lighter isotope composition often coincide with higher elevations towards the cone summit, but the groundwater character still varies considerably, likely in response to additional underlying factors. As clouds rise up the volcano, the heavy isotopes are depleted and the residual precipitation gets isotopically lighter [37]. The most depleted samples would locate in the southern basin where the δ2H composition approaches −55‰. These differences between the isotopic compositions in the south and other regions of the volcano could be another indication of variations in meteoric inputs and the heterogeneity of the hydrological circuits within Etna. A second trend suggests that waters become lighter from East to West, which is coincident with the main wind direction and the geographical distribution of precipitations. In effect, rainfall amounts peak on the eastern flanks of the Etna, mainly in relation to cooling sea breezes and clouds from the neighbor Mediterranean Sea [8]. The water vapor from the sea and the subsequent clouds and precipitation, are characterized by a high 2H excess which in turn, is reflected in the composition of the waters [38]. In its migration across the volcano, falling precipitation undergoes fractionation and becomes increasingly lighter.
Figure 7. Stable isotopes in groundwater against elevation in the volcano.
Resources 04 00358 g007
Values for δ13C vary from as low as −14‰ in proximities to the town of Giarre (B31), up to about 5‰ in waters nearby the mud volcanoes of Paternò. Measured values plot above the line of pCO2 in the atmosphere and largely outside the typical range of groundwater suggesting a contribution of external CO2 (Figure 8). Given that groundwater in Etna does not come in contact with outcrops or superficial carbonate rocks [14], the prevailing pCO2 source would be at depth.
Figure 8. Partial pressure of CO2 vs. δ13C showing the possible contribution of magmatic gasses. Typical groundwater composition within the dashed area.
Resources 04 00358 g008
Under low HCO3 concentrations, δ13C values range broadly from −2‰ to −15‰ (Figure 9). An increase in HCO3 (>10 meq/L) is coincident with δ13C in the range of −2.4‰ and +2.3‰, with most samples clustering around −1.5‰. In such conditions, the equilibrium between HCO3 and CO2 causes the isotopic composition of the latter species to become more positive. Therefore, the Etnean magmatic CO2 becomes isotopically heavier [39]. This pattern suggests some additional inputs of CO2, possibly related to hydrothermal fluids that stripped the gasses from a magmatic reservoir and transported them into the shallow aquifers. In such conditions, the rise of CO2 would lower the pH of the circulating waters and result in higher concentration of dissolved HCO3 after weathering the host rocks. Thus, many waters in the studied area might be partially influenced by this secondary CO2 despite their overall meteoric origin.
Figure 9. Change in groundwater composition in relation to the HCO3 and δ13C concentrations.
Resources 04 00358 g009
In short, two major groundwater groups can be discriminated on the basis of δ13C: (1) waters with compositions below −4.6‰, mainly recharged by direct percolation of rainfall; (2) waters with δ13C > −2.4‰ in a stretch of land between Adrano and Misterbianco in the south, and around Pozillo to the east, that include a component of external dissolved gas. This trend suggests that the diffusion of CO2 gasses in Mt. Etna is unevenly distributed, and essentially controlled by the main tectonic structures of the volcano. During their ascent to the surface, these gases interact in different ways with shallow water-bearing strata changing their concentrations as they cross the aquifers [23].
It is worthy to note that a more particular isotopic signature was recorded at the “Salinelle di Paternò”. In these mud volcanoes, the δ13C compositions ranged from 1.4‰ to 5.3‰ while the pCO2 values varied from 1.3 to 2.2 bars. The enrichment in CO2 and the high “positives” stable isotopic ratio observed (δ2H ~ −12‰ and δ18O ~ 10.4‰) seem to indicate a very deep origin of these fluids.

5. Summary and Conclusions

A new survey dataset of major ion concentrations and isotope ratios was used to update the knowledge of geochemical characteristics of groundwaters and to better understand the flow system around Mt. Etna. The Etnean groundwaters possess a marked bicarbonate-alkaline chemistry, which is consistent with an abundance of dissolved CO2 gas and the composition of the volcanic host rocks. Chloride-sulphate and nitrate dominated waters can locally prevail along the Ionian Sea coast, largely due to urban contamination and the leakage of agricultural fertilizers. Other distinctive characteristics of the sampled waters include low temperatures, high conductance, and elevated hardness. The salinity of the waters decreases with elevation due to the proximity to recharge areas and shorter travel paths. Oxygen-deuterium isotopes showed that waters are essentially recharged by infiltrating rainfall. Especially to the south, most of the samples display a good correlation with the eastern Mediterranean meteoric water line. To the east, collected samples deviate from the meteoric line, suggesting more heterogeneous circulation paths, and variable degrees of interaction between meteoric waters and the aquifer rocks.
Furthermore, the isotope composition is influenced by the provenance of wet air masses from the Mediterranean Sea. In this regard, waters become isotopically lighter to the west, following the distribution of precipitation on the volcano. Similarly, the liquid-vapor fractionation of waters results in lighter waters along with an increase in elevation or in proximity to the cone summit.
The analysis of δ13C indicates that at least a proportion of the waters, mainly in the southern region of the volcano, would be affected by external CO2 contributions, possibly of hydrothermal origin. This is also supported by pCO2 values 1 to 3 orders of magnitude higher than those expected for waters in equilibrium with the atmosphere. Furthermore, a high enrichment in CO2 along with high positive values for δ2H/δ18O suggest that waters in the salt mounts around Paternò would be influenced by brines originating at depth within the system.

Acknowledgments

The authors are deeply grateful to Gaetano Punzi, current Director of the Regional Geological Office for Land Reclamation, Sicily, for his help throughout the field work. This paper would never have been achieved without him. Many thanks also to Glenn Harrington, Adjunct Supervisor in the National Centre for Groundwater Research and Training, Flinders University, and Principal Hydrogeologist at Innovative Groundwater Solutions Pty Ltd, Australia, for his comments and assistance to improve the manuscript. The authors also wish to thank John Luczaj, and two anonymous reviewers for their suggestions and useful discussions. Special thanks to the AIST, Geological Survey of Japan for allowing us to use its facilities and equipment for the chemical analyses.

Author Contributions

Carmelo Bellia focused on the field work, laboratory analyses and interpretation of results. Adrian Gallardo collaborated with the interpretation of results and the manuscript preparation. Masaya Yasuhara and Kohei Kazahaya supervised the technical aspects of the program and worked on the data analysis and interpretation.

Conflicts of Interest

The authors declare no conflict of interest.

References

  1. Gerlach, T.M. Etna’s greenhouse pump. Nature 1991, 315, 352–353. [Google Scholar] [CrossRef]
  2. D’Alessandro, W.; Bellomo, S.; Bonfanti, P.; Brusca, L.; Longo, M. Salinity variations in the water resources fed by the Etnean volcanic aquifers (Sicily, Italy): Natural vs. anthropogenic causes. Environ. Monit. Assess. 2011, 173, 431–446. [Google Scholar] [CrossRef] [PubMed]
  3. Giammanco, S.; Ottaviani, M.; Valenza, M.; Veschetti, E.; Principio, E.; Giammanco, G.; Pignato, S. Major and trace elements geochemistry in the ground waters of a volcanic area: Mount Etna (Sicily, Italy). Water Res. 1998, 32, 19–30. [Google Scholar] [CrossRef]
  4. Pennisi, M.; Leeman, W.P.; Tonarini, S.; Pennisi, A.; Nabelek, P. Boron, Sr, O, and H isotope geochemistry of groundwaters from Mt. Etna (Sicily)—Hydrologic implications. GCA 2000, 64, 961–974. [Google Scholar] [CrossRef]
  5. D’Alessandro, W.D.; Federico, C.; Longo, M.; Parello, F. Oxygen isotope composition of natural waters in the Mt Etna area. J. Hydrol. 2004, 296, 282–299. [Google Scholar] [CrossRef]
  6. Liotta, M.; Grassa, F.; D’Alessandro, W.; Favara, R.; Gagliano Candela, E.; Pisciotta, A.; Scaletta, C. Isotopic composition of precipitation and groundwater in Sicily, Italy. Appl. Geochem. 2013, 34, 199–206. [Google Scholar] [CrossRef]
  7. Catalano, R.; Imme, G.; Mangano, G.; Morelli, D.; Giammanco, S. Natural tritium determination in groundwater on Mt Etna (Sicily, Italy). J. Radioanal. Nucl. Chem. 2014, 299, 861–866. [Google Scholar] [CrossRef]
  8. Chester, D.K.; Duncan, A.M.; Guest, J.E.; Kilbum, C.R.J. Mount Etna: The Anatomy of a Volcano; Stanford University Press: Stanford, CA, USA, 1985. [Google Scholar]
  9. Aiuppa, A.; Bellomo, S.; Brusca, L.; D’Alessandro, W.; Federico, C. Natural and anthropogenic factors affecting groundwater quality of an active volcano (Mt. Etna, Italy). Appl. Geochem. 2003, 18, 863–882. [Google Scholar] [CrossRef]
  10. Clocchiatti, R.; Schiano, P.; Ottolini, L.; Bottazzi, P. Earlier alkaline and transitional magmatic pulsation of Mt. Etna volcano. Earth Planet. Sci. Lett. 1998, 132, 25–41. [Google Scholar] [CrossRef]
  11. Tanguy, J.C.; Condomines, M.; Kieffer, G. Evolution of Mount Etna magma: Constraints on the present feeding system and eruptive mechanism. J. Volcanol. Geotherm. Res. 1997, 75, 221–250. [Google Scholar] [CrossRef]
  12. Pering, T.D.; Tamburello, G.; Aiuppa, A.; McGonigle, A.J.S. The First Record of a High Time Resolution Carbon Dioxide Flux for the North-East Crater of Mount Etna. In Proceedings of the IAVCEI 2013 Scientific Assembly, Kagoshima, Japan, 20–24 July 2013.
  13. McGee, K.A.; Delgado, H.; Cardenas Gonzales, L.; Venegas Mendoza, J.J.; Gerlach, T.M. High CO2 emission rates at Popocatepetl volcano, Mexico. In Proceedings of the Abstracts AGU Fall Meeting, Baltimore, MD, USA, 29 May–2 June 1995.
  14. Ogniben, L. Lineamenti idrogeologici dell’Etna. Riv. Min. Sicil. 1966, 100–102, 151–174. (In Italian) [Google Scholar]
  15. Ferrara, V. Valutazione della vulnerabilità degli acquiferi. In Carta della vulnerabilità all’inquinamento dell’acquifero vulcanico dell’Etna; Civita, M., Ed.; SELCA: Firenze, Italy, 1990. (In Italian) [Google Scholar]
  16. Aureli, A. Idrogeologia del fianco occidentale etneo. In Proceedings of the 2nd International Congress on Underground Waters, Palermo, Italy, 28 April–1 May 1973; pp. 425–487. (In Italian)
  17. Schilirò, F. Proposta metodologica per una zonazione geologicotecnica del centro abitato di Maletto. Geol. Tec. 1988, 3, 32–53. (In Italian) [Google Scholar]
  18. Ferrara, V. Idrogeologia del versante orientale dell’Etna. In Proceedings of the 3rd international symptom on groundwaters, Palermo, Italy, 1–5 November 1975; pp. 91–134. (In Italian)
  19. Aiuppa, A.; Allard, P.; D’Alessandro, W.; Giammanco, S.; Parello, F.; Valenza, M. Review of magmatic gas leakage at Mount Etna (Sicily, Italy): Relationships with the volcano-tectonic structures, the hydrological pattern and the eruptive activity. In Etna Volcano Laboratory; Calvary, S., Bonaccorso, A., Coltelli, M., Del Negro, C., Falsaperla, S., Eds.; Geophysical Monography Series AGU: Washington, DC, USA, 2004; Volume 143. [Google Scholar]
  20. Kozlowska, B.; Morelli, D.; Walencik, A.; Dorda, J.; Altamore, I.; Chieffalo, V.; Giammanco, S.; Imme, G.; Zipper, W. Radioactivity in waters of Mt. Etna (Italy). Radiat. Meas. 2009, 44, 384–389. [Google Scholar] [CrossRef]
  21. Anza, S.; Dongarra, G.; Giammanco, S.; Gottini, V.; Hauser, S.; Valenza, M. Geochimica dei fluidi delI’Etna. Miner. Petrogr. Acta 1989, 32, 231–251. (In Italian) [Google Scholar]
  22. Allard, P. Endogenous magma degassing and storage at Mount Etna. Geophys. Res. Lett. 1997, 24, 2219–2222. [Google Scholar] [CrossRef]
  23. D’Alessandro, W.D.; de Gregorio, S.; Dongarra, G.; Gurrieri, S.; Parello, F.; Parisi, B. Chemical and isotopic characterization of the gases of Mount Etna (Italy). J. Volcanol. Geotherm. Res. 1997, 78, 65–76. [Google Scholar] [CrossRef]
  24. Nakai, S.; Wakita, H.; Nuccio, P.M.; Italiano, F. MORB-type neon in an enriched mantle beneath Etna, Sicily. Earth Planet. Sci. Lett. 1997, 153, 57–66. [Google Scholar] [CrossRef]
  25. Spilliaert, N.; Allard, P.; Métrich, N.; Sobolev, A.V. Melt inclusion record of the conditions of ascent, degassing, and extrusion of volatile-rich alkali basalt during the powerful 2002 flank eruption of Mount Etna (Italy). J. Geophys. Res. 2006, 111. [Google Scholar] [CrossRef]
  26. Hirn, A.; Nicolich, R.; Gallart, J.; Laigle, M.; Cernobori, L. ETNASEIS Scientific Group Roots of Etna volcano in faults of great earthquakes. Earth Planet. Sci. Lett. 1997, 148, 171–191. [Google Scholar] [CrossRef]
  27. Giammanco, S.; Bonfanti, P. Cluster analysis of soil CO2 data from Mt. Etna (Italy) reveals volcanic influences on temporal and spatial patterns of degassing. Bull. Volcanol. 2009, 71, 201–218. [Google Scholar] [CrossRef]
  28. Camarda, M.; de Gregorio, S.; Gurrieri, S. Magma-ascent processes during 2005–2009 at Mt. Etna inferred by soil CO2 emissions in peripheral areas of the volcano. Chem. Geol. 2012, 330–331, 218–227. [Google Scholar] [CrossRef]
  29. Giammanco, S.; Neri, M. Rapporto sull’attività parossistica della Salinella dello Stadio di Paternò. In UF Vulcanologia e Geochimica; INGV Sezione de Catania: Sicily, Italy, 2005. (In Italian) [Google Scholar]
  30. Anza, S.; Badalamenti, B.; Giammanco, S.; Gurrieri, S.; Nuccio, P.M.; Valenza, M. Preliminary study on emanation of CO2 from soils in some areas of Mount Etna (Sicily). Acta Vulcanol. 1993, 3, 189–193. [Google Scholar]
  31. Giammanco, S.; Gurrieri, S.; Valenza, M. Soil CO2 degassing on Mt. Etna (Sicily) during the period 1989–1993: Discrimination between climatic and volcanic influences. Bull. Volcanol. 1995, 57, 52–60. [Google Scholar] [CrossRef]
  32. Brusca, L.; Aiuppa, A.; D’Alessandro, W.; Parello, F.; Allard, P.; Michel, A. Geochemical mapping of magmatic gas-water-rock interactions in the aquifer of Mount Etna volcano. J. Volcanol. Geotherm. Res. 2001, 108, 199–218. [Google Scholar] [CrossRef]
  33. D’Alessandro, W.; Federico, C.; Aiuppa, A.; Longo, M.; Parello, F.; Allard, P.; Jean-Baptiste, P. Groundwater circulation at Mt Etna: Evidenses from 18O, 2H and 3H contents. In Proceedings of the 10th International Symposium on Water-Rock Interaction, Villasimius, Italy, 10–15 June 2001.
  34. Follet, R.F. Fate and Transport of Nutrients: Nitrogen. In Agricultural Research Service, Soil-Plant-Nutrient Research Unit; Working Paper No. 7; United States Department of Agriculture: Fort Collins, CO, USA, 1995; p. 33. [Google Scholar]
  35. Craig, H. Isotopic variations in meteoric waters. Science 1961, 133, 1702–1703. [Google Scholar] [CrossRef] [PubMed]
  36. Gat, J.R.; Carmi, H. Evolution of the isotopic composition of atmospheric waters in the Mediterranean Sea area. J. Geophys. Res. 1970, 75, 3039–3040. [Google Scholar] [CrossRef]
  37. Mazor, M. Chemical and Isotopic Groundwater Hydrology; Marcel Dekker Publisher: New York, NY, USA, 1991. [Google Scholar]
  38. Gat, J.R.; Klein, B.; Kushnir, Y.; Roether, W.; Wernli, H.; Yam, R.; Shemesh, A. Isotope composition of air moisture over the Mediterranean sea: An index of the air—Sea interaction pattern. Tellus. Ser. 2003, B55, 953–965. [Google Scholar] [CrossRef]
  39. Caracausi, A.; Italiano, F.; Paonita, A.; Rizzo, A.; Nuccio, P.M. Evidence of deep magma degassing and ascent by geochemistry of peripheral gas emissions at Mount Etna (Italy): Assessment of the magmatic reservoir pressure. J. Geophys. Res. 2003, 108. [Google Scholar] [CrossRef]

