Abstract
This paper presents a market-price-based method to value sub-soil resources in environmental Cost-Benefit Analysis and Life Cycle Assessment. The market price incorporates the privileged information of the market agents, explicitly or implicitly anticipating future applications of the resource, future backstop technologies, recycling potentials, the evolution of reserves and extraction costs. The market price is therefore considered as the best available integrated information reflecting the actual values of these parameters. Our method is based on the Hotelling rule and the fact that private agents discount future costs and benefits at a higher rate than society as a whole. In practice, the price of the last resource unit sold is calculated with the Hotelling rule using a market discount rate. Then, the price at depletion is retropolated with a social discount rate smaller than the market discount rate. The resulting corrected “socially optimal” price is higher than the market price. The method allows to calculate the social cost of resource exhaustion, which is applicable in Cost-Benefit Analysis and Life Cycle Assessment. The method is applied to mineral and fossil resources and the results are compared with other recent methods that seek to place a monetary value on resource depletion.
1. Introduction
Sub-soil resources, i.e., mineral and petrochemical resources, are exhaustible deposits, and the potential depletion of these deposits is therefore of social concern. This concern has been addressed from two different perspectives, an economic and a physical.
The economic perspective has pointed out—typically with reference to Hicks (1946) [1]—that the economic rent (the revenue, net of marginal extraction costs) from an exhaustible resource should not be regarded as income and, therefore, should not be included as value added in the Gross Domestic Product (El Serafy, 1981 [2]), but rather must be re-invested in renewable resources so that aggregate capital is maintained, i.e., so that a constant revenue can be sustained infinitely. Since sub-soil assets are seldom traded on an open market, establishing the rental value can be challenging, and this has given rise to the “Hotelling Valuation Principle” (Miller & Upton, 1985 [3]), which is derived from the theoretical finding of Hotelling (1931) [4], who states that in a non-monopolistic market, the optimal exhaustion rate must be one where the inflation-corrected price of the resource, net of marginal extraction costs, grows over time at a rate equal to the discount rate. Thus, the net present value of a resource is equal to the extractable volume multiplied by its current price, net of marginal extraction costs. Since sub-soil assets are seldom traded on an open market, the empirical testing of this simple principle has been limited mainly to observed market prices for oil- and gas-producing properties, generally finding values around 0.5 (range 0.2–0.8) for the theoretical value, which Davis & Cairns (1999) [5] explain by incorporating uncertainty and capacity constraints in the model. Once having determined the correct rental value, the economic perspective generally regards the Hotelling exhaustion rate as being optimal from both a private and social perspective. As an example, the Shadow Price Handbook published by CE Delft (de Bruyn et al., 2010 [6]) assigns a zero-shadow price for abiotic resource depletion, implying the assumption that all social costs have already been internalised.
The physical perspective has mainly been represented by impact assessment methods developed in the context of environmental product life cycle assessment. A large number of methods have been developed and were recently reviewed by Sonderegger et al. (2017) [7] and Alvarenga et al. (2016) [8]. These methods can be classified into three groups depending on the procedures they use to obtain a single measure across different resources: by mass or energy (“resource accounting methods”), by consumption amounts relative to available stocks (“scarcity methods”), or by consequences for future extraction (“future efforts methods”). Due to the implicit normalisation across different resources, the resource accounting methods suggest that it is optimal to trade-off the use of resources in proportion to their content of the selected mass or energy property, while the scarcity methods imply a maximum social benefit when all resources reach the same level of scarcity. Only the future efforts methods have sustainable well-being as an optimisation target, and thus come closest to the economic perspective. However, the physical perspective implies that the impact on future well-being is modelled via future technology scenarios, in practice resorting to different proxies such as forecasted ore grades, energy requirements for extraction, or estimated extraction costs. Besides the inherent uncertainty in any kind of forecasting, Northey et al. (2017) [9] described the specific issues for resource assessment that make such forecasting difficult and highly uncertain, such as the limited availability and inter-comparability of data on ore grades and other resource quality aspects, the high variability of local conditions that determine resource availability, and the difficulty of predicting the effects of disruptive technology changes. It nevertheless appears that resource-specific forecasting models, such as those of Mohr (2010) [10], can be used to narrow down the uncertainty on earlier supply forecasts.
In this article, we present a method that seeks to unite the economic and physical perspectives, based on the finding that the Hotelling rule will not ensure that all social costs are internalised if the market interest rate is higher than the social discount rate. That this may well be the case has previously been pointed out by Solow (1974) [11] and has also—in the context of Cost-Benefit Analysis—been hinted to by Bickel & Friedrich (2005) [12] (p. 15). The concept behind the method presented here has previously been the topic of a conference presentation (De Caevel et al., 2011 [13]).
This article exclusively addresses the social cost of depletion of sub-soil resources and does not address the (additional) social externalities associated with the activities of mining, transport, transformation and the use of the resources.
2. Materials and Methods
2.1. Hotelling’s Model and the Determinants of the Market Price
2.1.1. Time Path of the Resource Price According to Hotelling’s Model
Hotelling (1931) [4] describes how the economic rent of an exhaustible resource, i.e., its price net of extraction costs, will increase at the same rate as the market interest rate, thereby ensuring optimal resource allocation under the assumption of a non-monopolistic market. The rationale is as follows: The resource owners can choose either to sell the resource at market price and to buy some assets in the financial market with the money, or to keep the resource and to sell it later at an anticipated price. If the market price is lower than the discounted future price, then the rational owners will keep the resource. If the market price is higher than the discounted future price, then the owners will sell the resource, buy financial assets on the market and eventually maximize benefits. At the equilibrium, the net price equals the discounted anticipated price of the last unit of resource sold in the future.
2.1.2. Causes of Market Price Differing from Socially Optimal Price
The market agents, both resource consumers and resource owners and processors, have privileged access to information and explicitly or implicitly anticipate and integrate all the information they have access to regarding the future applications of the resource, the future backstop technologies, recycling potentials, and the evolution of reserves, extraction costs, interest/discount rates and other determinants, before deciding to buy or sell the resource, so that all these aspects will be taken into account in the market price. The market anticipations of these parameters are therefore considered as the best available approximations of the actual values of these parameters.
The market inevitably miscalculates the future market parameters, but the resulting bias may be both downward or upward, with one important exception: the interest or discount rate.
In his paper of 1931, Hotelling asked “The market rate of interest must be used by an entrepreneur in his calculations, but should it be used in determinations of social value and optimum public policy?”. While Hotelling played down the importance of this question, Solow (1974) [11] (p. 8) suggested that “a modern economist would take that possibility more seriously”, going on to mention two examples of reasons to think social discount rates are lower than market discount rates. One reasoning relates to the pure time preference that is included in the market discount rate, reflecting the risks taken by a private investor, while this risk is not included for society due to its longer time perspective and its risk-pooling and risk-spreading (i.e., many projects and many individuals over longer time). Another reasoning relates to taxes on capital income that may affect the private discount rate, while the social discount rate should be indifferent to such transfers. In the subsequent considerable literature contributing to define a social discount rate, it is generally agreed that the social discount rate is lower than the market discount rate (Zhuang et al., 2007 [14]). Based on this difference, we propose, in the next section, a method to estimate the social optimal price based on market price.
2.2. Correcting the Market Price
In the previous sections, we saw that the economic rent of an exhaustible resource, i.e., its price net of extraction costs, can be used as an estimate for the social cost of consuming a unit of resource, provided that we adjust for the difference between the market discount rate and the social discount rate necessary for optimal resource allocation.
In order to tackle complexity gradually, we develop this adjustment in three steps. Model 1 shows the principles of the method, assuming zero extraction cost, like in Hotelling’s model, and that price correction has no impact on depletion time. Model 2 integrates extraction costs and is used for our base estimate. Model 3 includes the impact of price correction on consumption and therefore on time before depletion.
2.2.1. Model 1: Principle of the Method
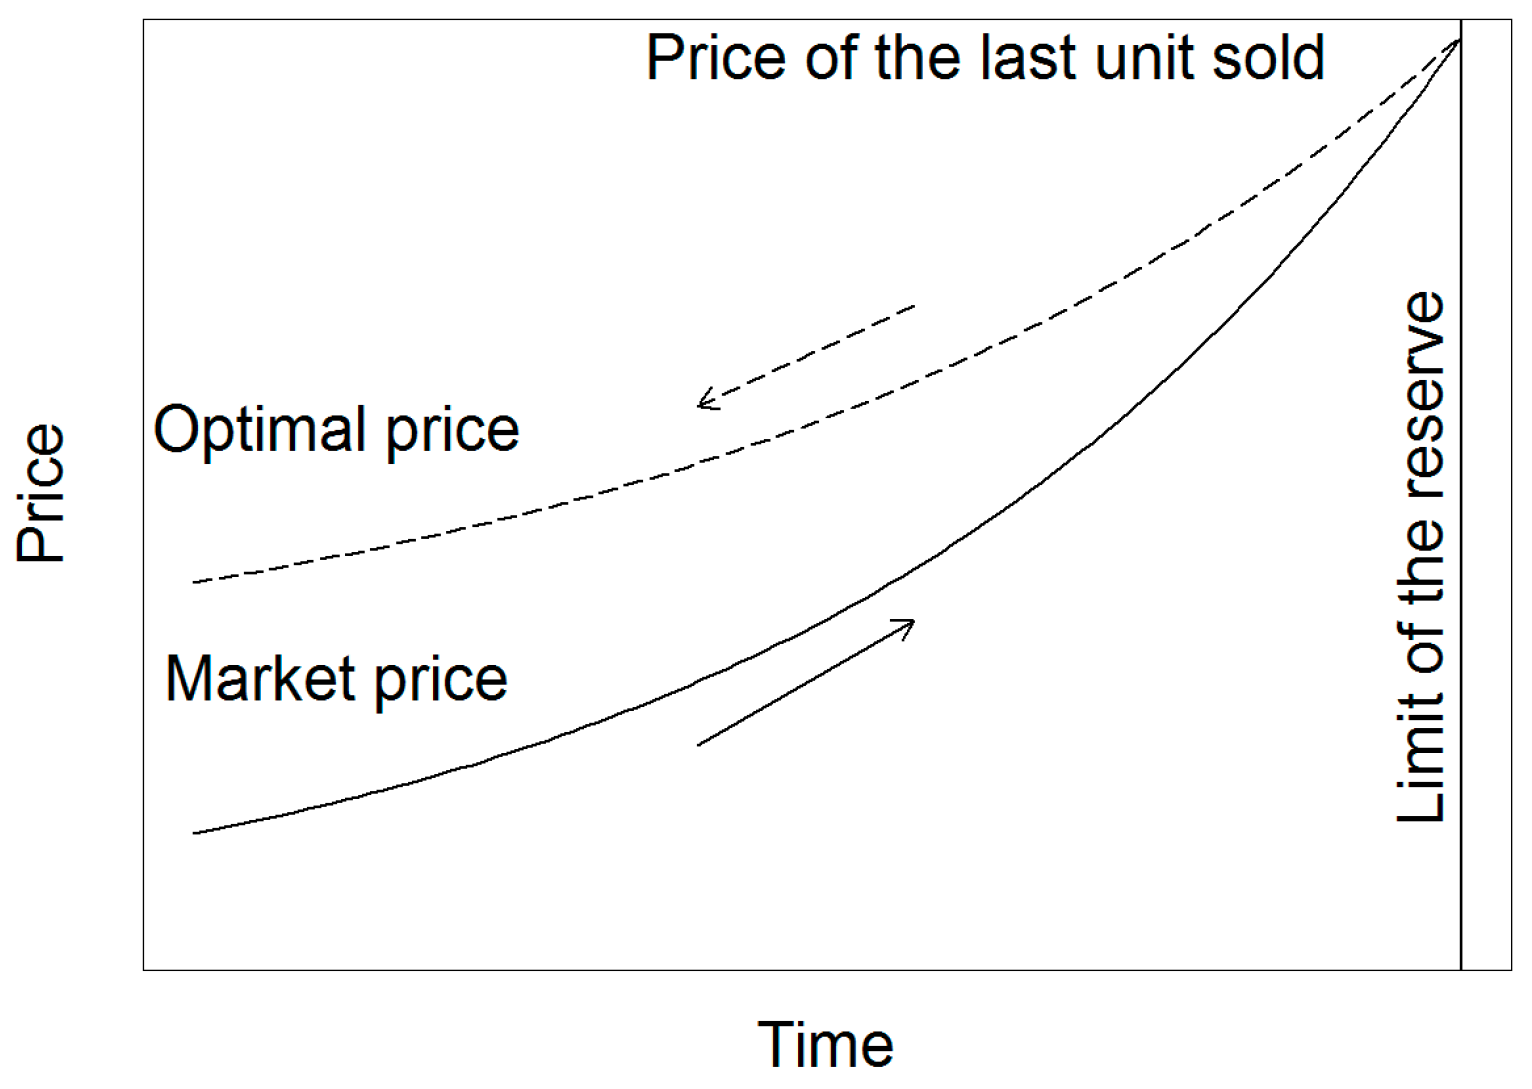
In Model 1, we assume there is no extraction cost and the demand is inelastic. The models presented in the following sections integrate extraction cost (model 2) and elastic demand (model 3). First, we calculate the price of the last unit sold at depletion following the Hotelling rule: The resource price rises exponentially with time at the market interest rate. Then, starting from the estimated price of the last unit sold, we retropolate the socially optimal price using the social discount rate, as shown in Figure 1. Since the social discount rate is lower than the market interest rate, the socially optimal price path is flatter than the market price path. Hence, the estimated socially optimal price is higher than the market price. The use of a socially optimal prices will transfer more welfare to the future generation under the condition of optimal taxation and constant reinvestment rates (cf. El Serafy, 1981 [2]).
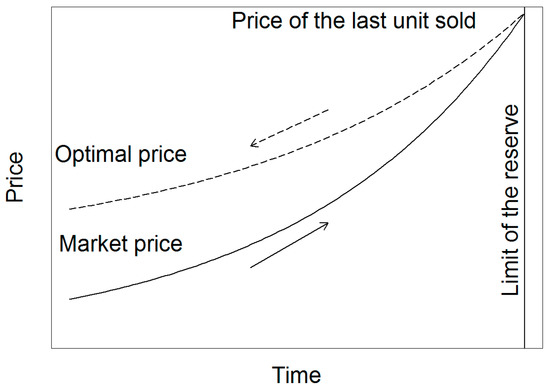
Figure 1.
Model 1: principle of the method.
2.2.2. Model 2: Integrating Extraction Cost
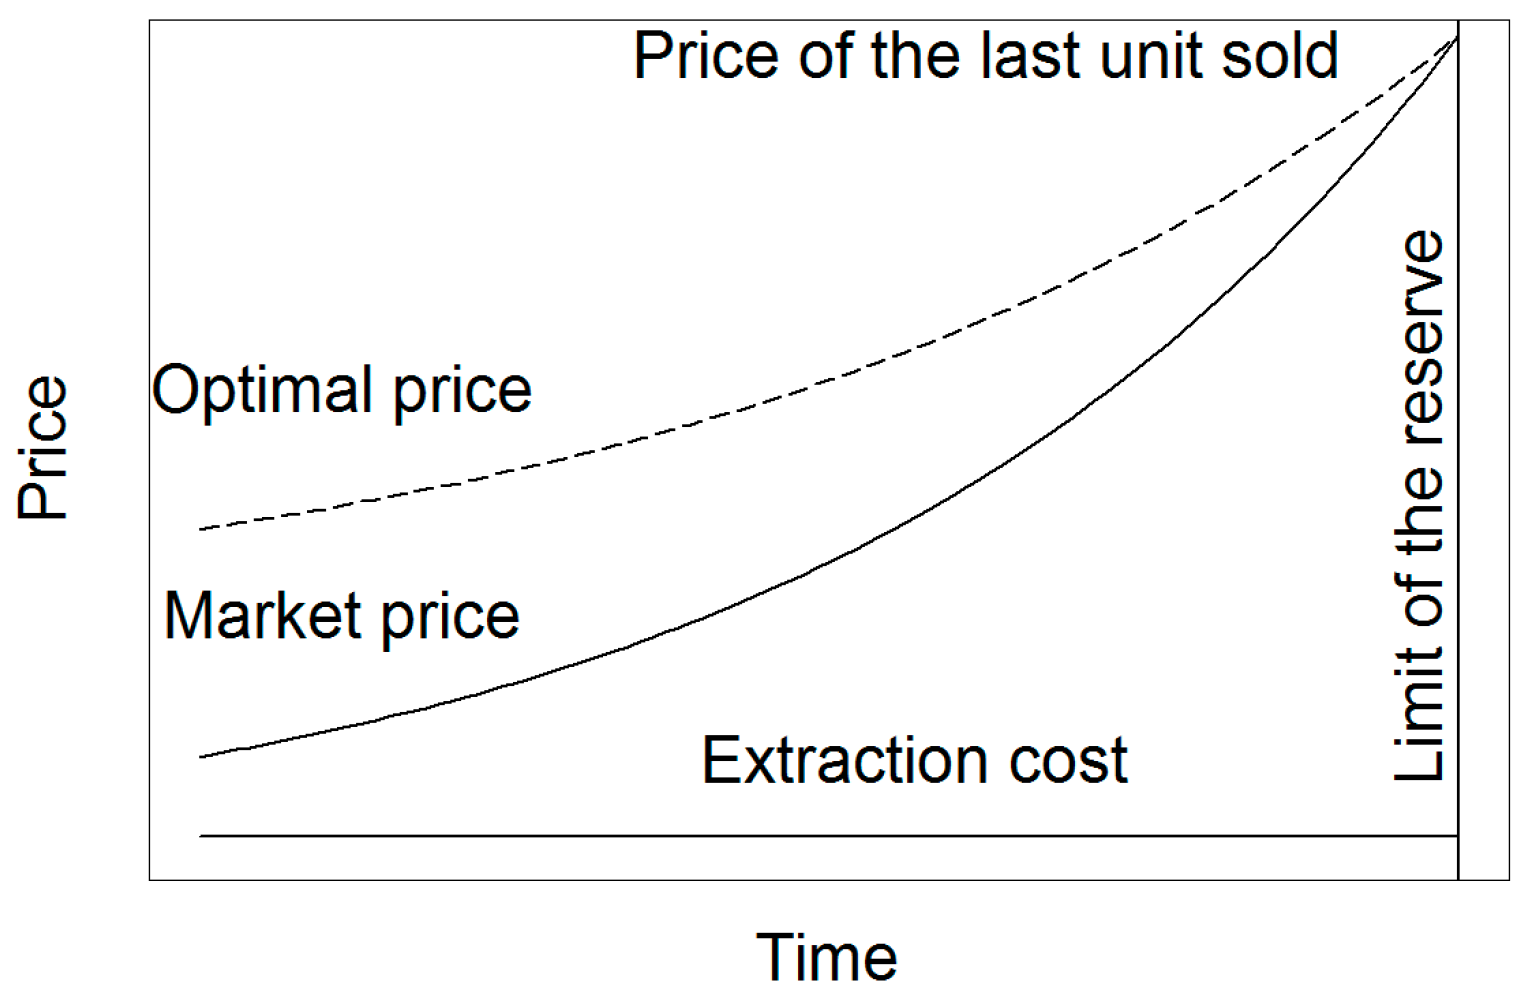
The Hotelling rule of exponentially increasing the price with time applies only to the scarcity rent component of the resource price (i.e., the net price, difference between the price and the extraction cost) and only with zero or constant extraction cost and a finite stock of a resource. In this case, the correction of the market price follows the same method as mentioned above, but based on the net price. The optimal net price is equal to the optimal price minus the extraction cost. Figure 2 shows the price correction with constant positive extraction costs.
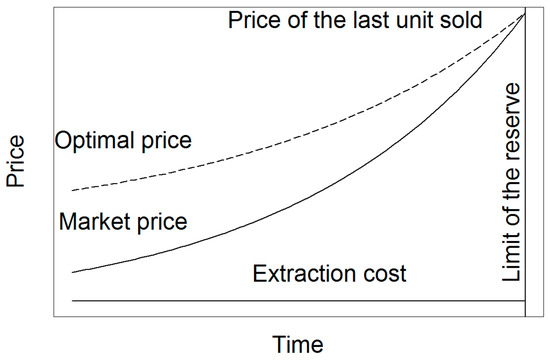
Figure 2.
Model 2: constant extraction cost.
2.2.3. Model 3: Integrating Elastic Demand
Under the common assumption of decreasing intratemporal marginal utility of consumption [15], the demand curve for the resource is elastic, so that a rise in price lowers the demanded quantities. The agents facing or expecting the optimal “corrected” price will consume less of a resource annually than if they were facing a lower, non-corrected price. So, the correction lowers the demand and extends the time before depletion. As the price of the last unit sold is equal to the maximum opportunity cost of the resource, the optimal price of the resource will not rise higher than this level. At the equilibrium, this situation will be anticipated and the prices will drop at each period of time. Eventually, the optimal “corrected” present price will stabilize at a level somewhere between the present market price and the optimal price under inelastic demand (see Figure 3). The higher the demand elasticity, the lower the socially optimal price.

Figure 3.
Model 3: price correction when correction affects consumption.
The computed social cost of exhaustion is considered as an upper bound as the formula relies on the rough assumption of inelastic demand (i.e., with elastic demand, the social cost of exhaustion would be lower). The value of the social cost of exhaustion lies in the interval between the market price and the upper bound social cost of exhaustion.
2.2.4. Applied Method in Practice
The price correction factor, cp, is calculated as the ratio between the integrals of the discount factors over the time to depletion, calculated with the social and the market discount rates, respectively:
where rm is the annual market discount rate, rs is the annual social discount rate, and t is the time before depletion in years.
To obtain the upper bound cost of depletion in absolute currency units, the price correction factor should be multiplied on the market price of the resource net of extraction cost:
The data needed to apply the method is thus the market price of the resource net of extraction cost, the time before depletion and the market and social discount rates.
3. Data and Assumptions
3.1. Market Price Including Extraction Costs
To limit the influence of short-term market volatility, we applied trend prices by taking the linear trend for each resource for the previous 5 years based on prices available from the following sources: US Geological Survey, World Bank, IMF, FRED and LPPM. Time lags in information movements affecting the decision making of commercial firms as well as geopolitical issues affecting resources prices is generally around 5 years (Kitchin cycle).
3.2. Extraction Cost
The extraction cost of a specific resource is often heterogeneous depending on the used technology, the ore quality and the size of the field (i.e., the economies of scale). Unless resource-specific marginal extraction cost data is available, we have calculated the extraction cost as the difference between the revenue and the gross operating surplus from Eurostat. The extraction cost represents between 49% and 94% of the revenue, corresponding to a net resource price (scarcity rent) between 51% and 6%, the former for crude petroleum and the latter for resources with no immediate depletion horizon. We apply this range as an uncertainty bound for the extraction cost for a resource without available information, with 75% as the mean estimate.
3.3. Time before Depletion
For the time before depletion, t, we apply different values for the base estimate and two sensitivity analyses:
- (1)
- t = time of convergence of the market and the social discount rates (our base case)
- (2)
- t = resource-specific estimate of time before depletion (sensitivity analysis)
- (3)
- t = resource-specific estimate of time before depletion, but not >50 years (sensitivity analysis)
Note that the time before depletion is estimated under the assumption of inelastic demand.
The first value, which is used for our base estimate, completely avoids the need to estimate the time before depletion by instead applying the long-term convergence of the discount factors of the market and social discounting methods. This is at the same time an upper bound estimate. Despite the difference between the market and social discount rates, both tend to zero over a long time horizon (300 years). For long-term horizons this implies that the integrals of the market and social discount factors will converge to provide a fixed ratio; see Section 3.4.3. The difference between the sizes of the integrals can then be applied as a multiplier on the net resource prices.
The second value, which is applied as a sensitivity analysis, is based on a resource-specific time before depletion estimated with the approach of Kesler (2007) [16], by dividing the reserves in 2015 by the mine production of 2015, using data from the U.S. Geological Survey (2015) [17] and the U.S. Energy Information Administration. The data refers to the known economically extractable reserves and an estimation of the undiscovered resources. The approach considers that the depletion occurs when the resource is not used anymore because its cost is greater than its opportunity cost. There is a significant uncertainty about the consumption scenarios and the future willingness to pay for the resources. This is therefore a rough estimation that might overestimate the time to depletion because the global demand for most resources will probably increase or might underestimate the time to depletion by not accounting for the addition of new reserves over time; which of the two effects that dominates is uncertain. For resources without data, we applied a default value of 100 years.
The third value, which is also applied as a sensitivity analysis, is similar to the second, but with an upper limit of 50 years. This upper limit is based on the idea that resources with longer time before depletion cannot meaningfully carry a scarcity rent.
3.4. Social and Market Discount Rates
To estimate the optimal price, we are interested in the difference between the market and social discount rate across time because the higher the discount rate difference, the higher the optimal price. To the knowledge of the authors, there is no literature that links precisely, in a quantitative way, the market and the social discount rates, although there is plenty of literature on both topics.
3.4.1. The Social Discount Rate
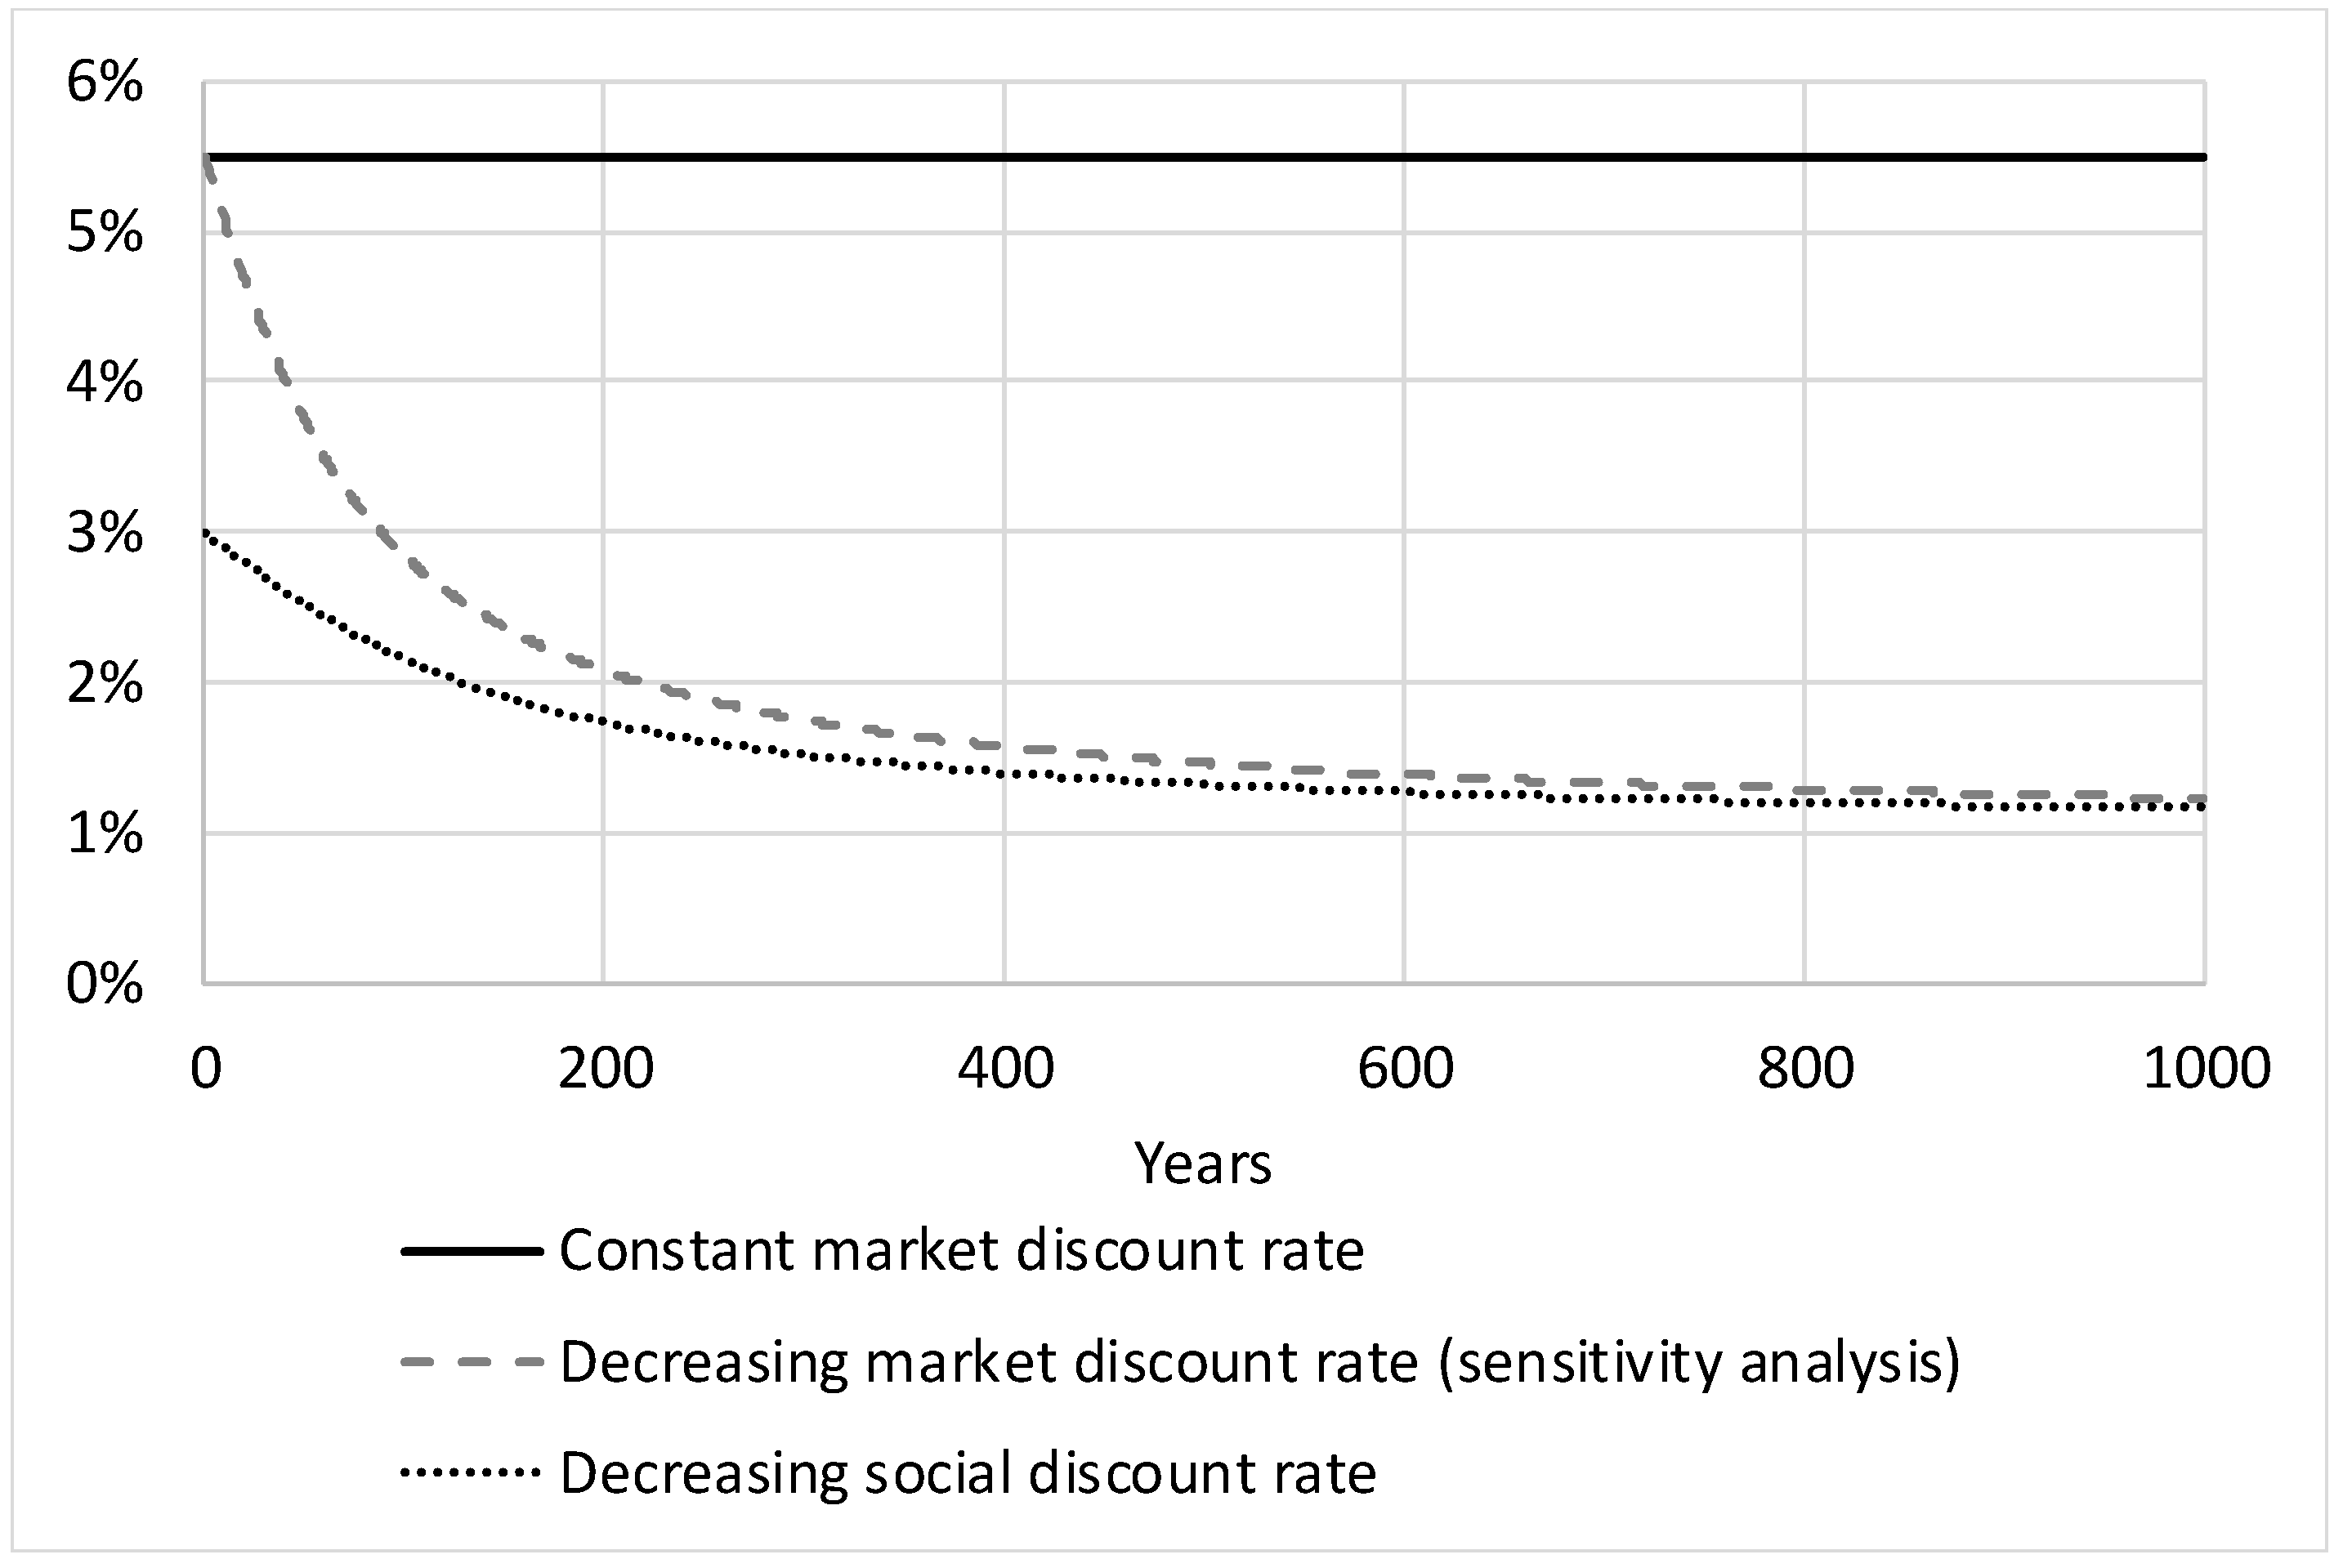
Given that the future growth rate is uncertain, the certainty-equivalent social discount rate will decrease over time. There is general agreement (Arrow et al., 2012, 2013 [18,19]) that “uncertainty about future discount rates provides a strong generic rationale for using certainty-equivalent discount rates that decline over time” (Weitzman, 1998 [20]). Accordingly, we apply a hyperbolic declining social discount rate over time. We apply social discount rates based on the starting value of 3% of the Green Book (2008) [21] rates used in the UK, with the equiprobable interest rate scenarios of Weitzman’s declining certainty-equivalent discount rate model varying from 1% to 5%.
3.4.2. The Market Discount Rate
For the base case, we apply a constant market discount rate of 5.5% based on the average long-term real return on the stock market.
In a sensitivity analysis, we apply the declining certainty-equivalent discount rate method of Weitzman (1998) [20] also for the market discount rate, with a starting point of 5.5% and an equiprobable interest rates from 1% to 10%. A declining market discount rate in the long run was found empirically by Giglio et al. (2014) [22], comparing the price difference between comparable freeholds and very long run leaseholds properties on the housing market in the UK and Singapore using hedonic regressions. They derive downward sloping market discount rates for private agents. They found that discount rates below 2.6% are used to value 100-year leasehold properties compared to similar freeholds ones, which is close to the value derived from our application of the Weitzman method for the market discount rate.
3.4.3. Evolution of the Discount Factors and Derivation of the Socially Optimal Price
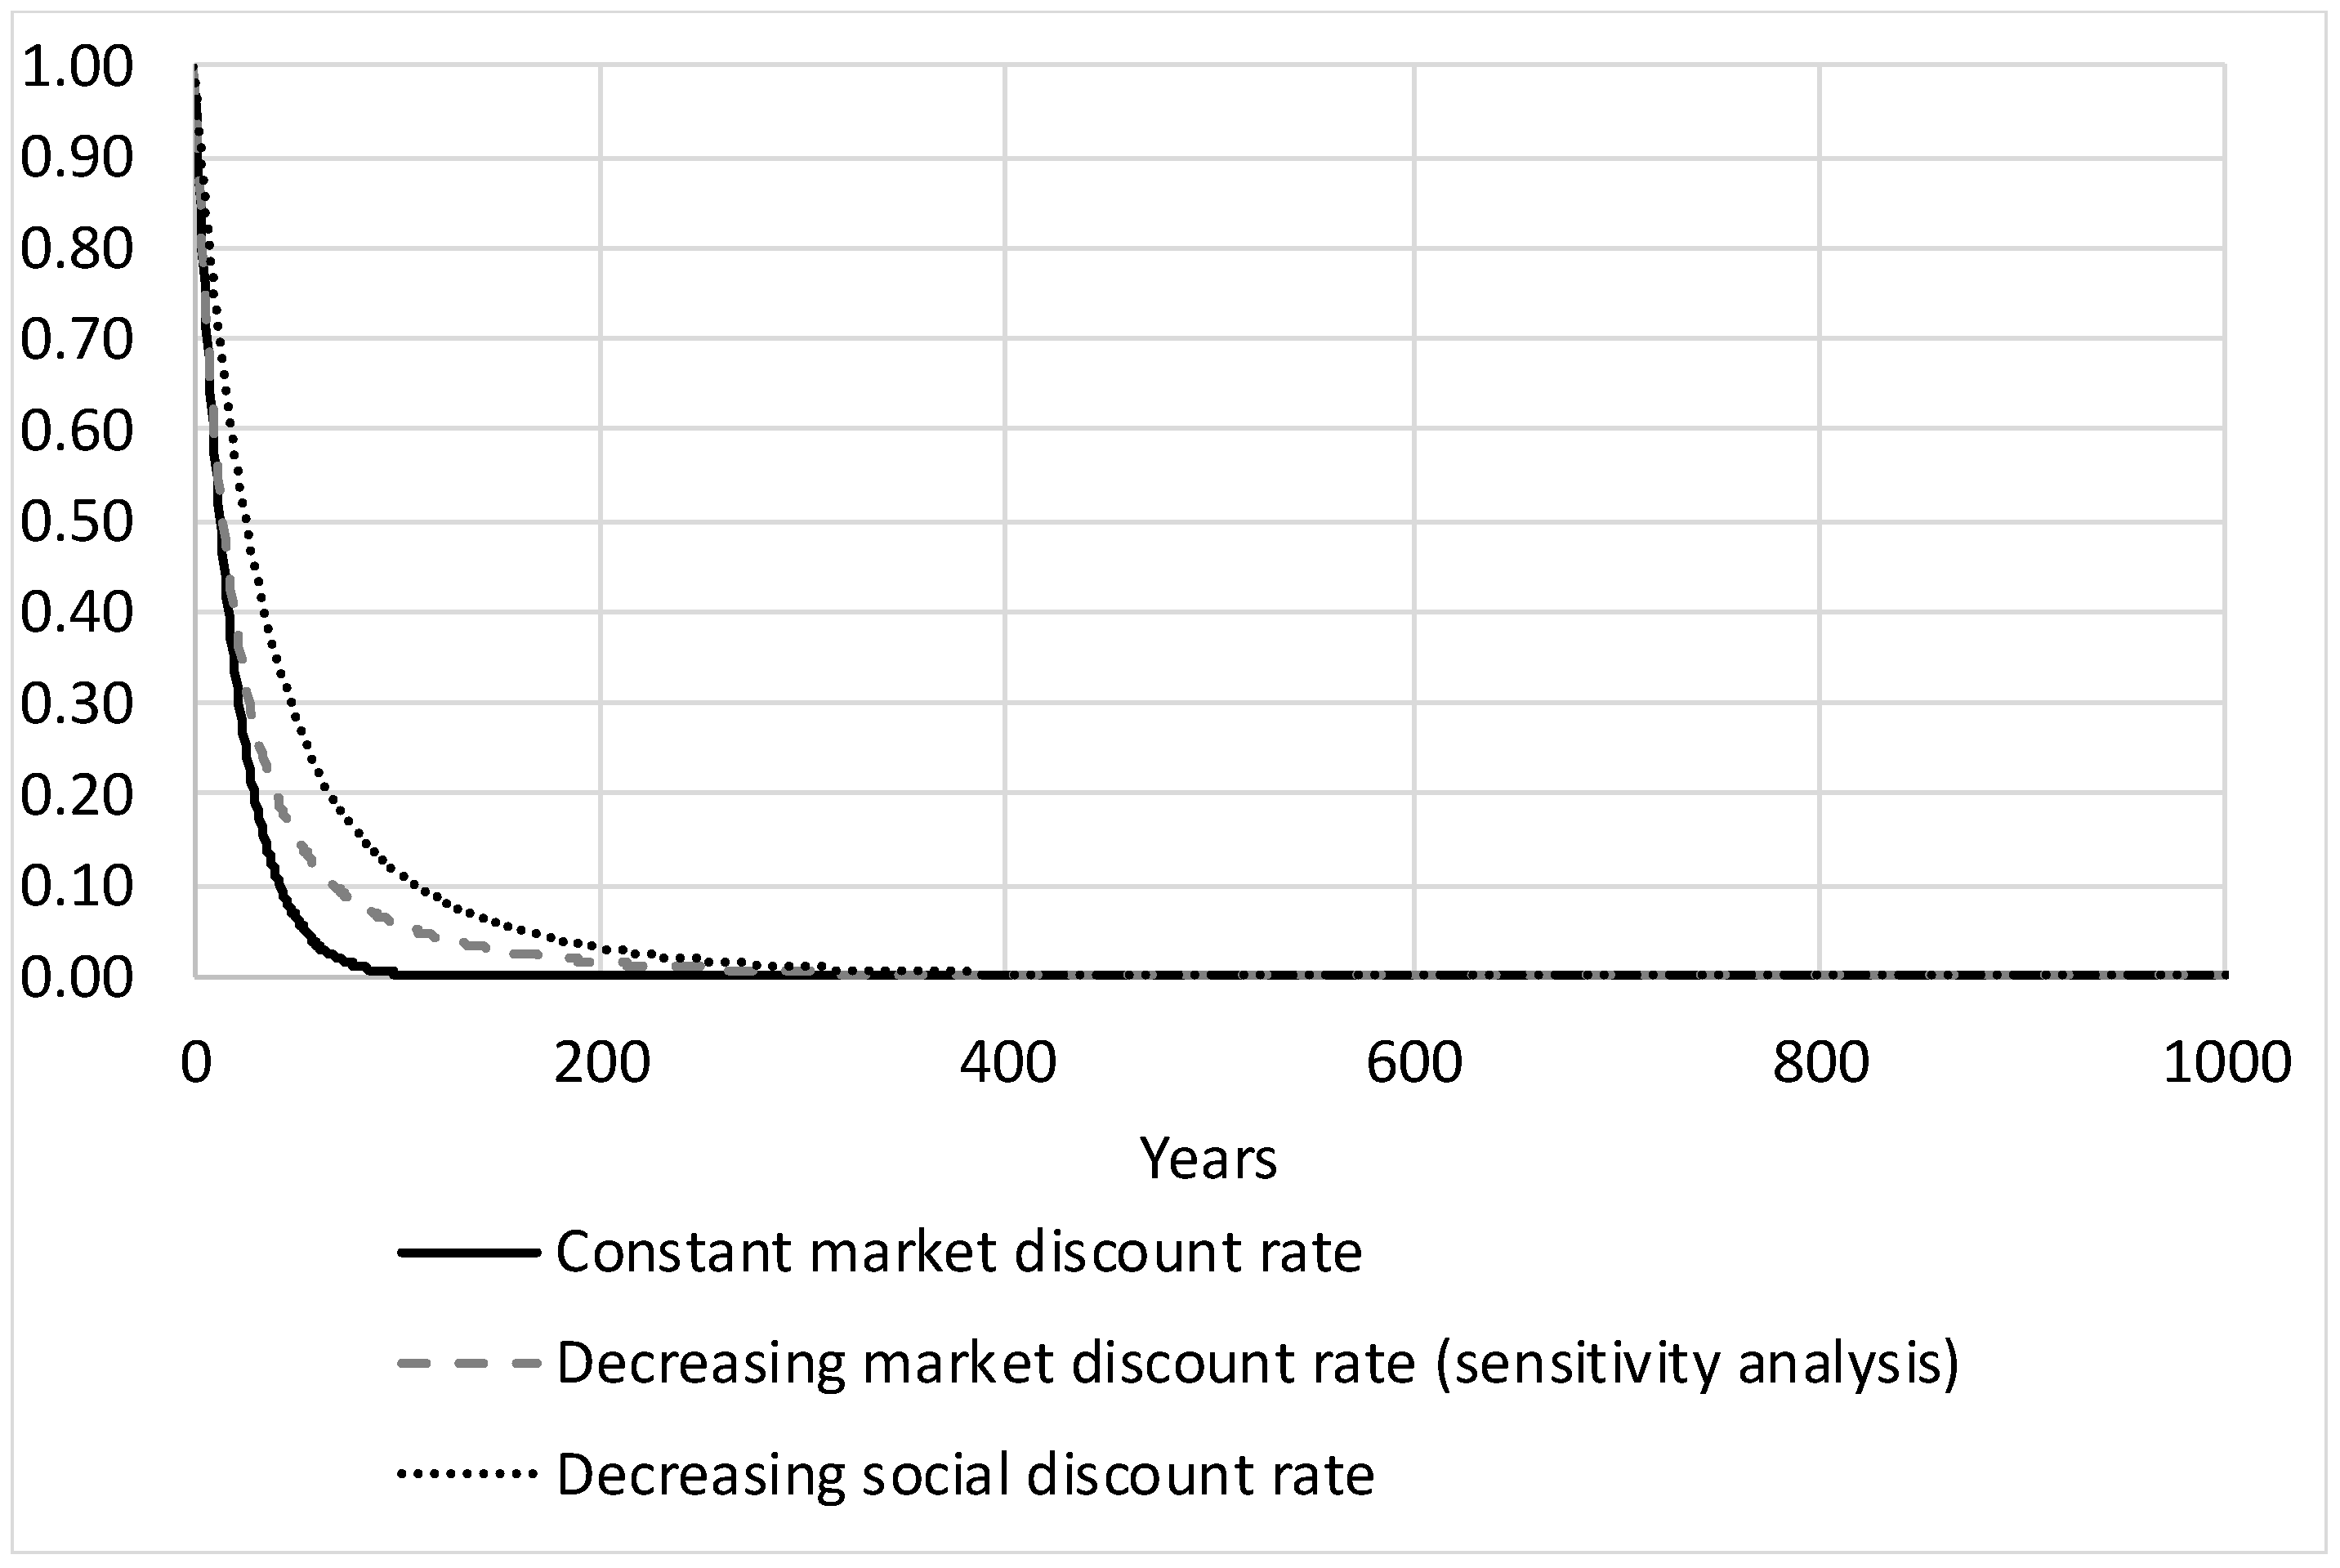
The evolution of the applied discount rates and discount factors over time evolutions are shown in Figure 4 and Figure 5.
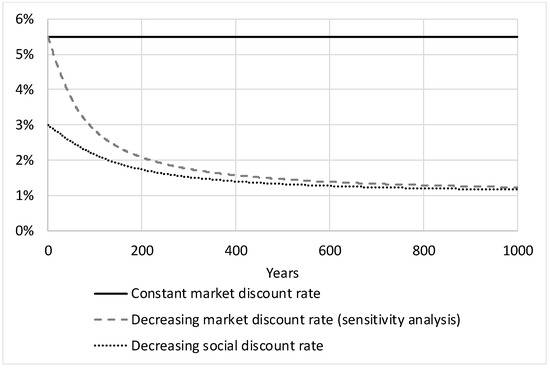
Figure 4.
Applied discount rates.
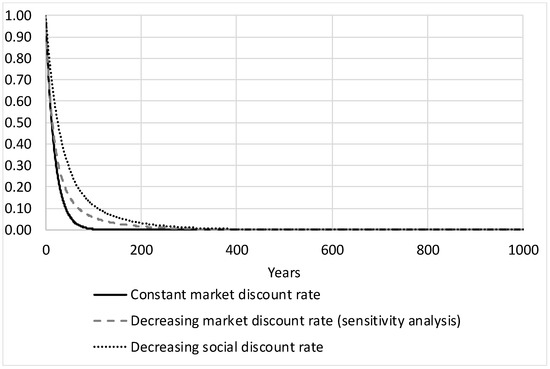
Figure 5.
Applied discount factors.
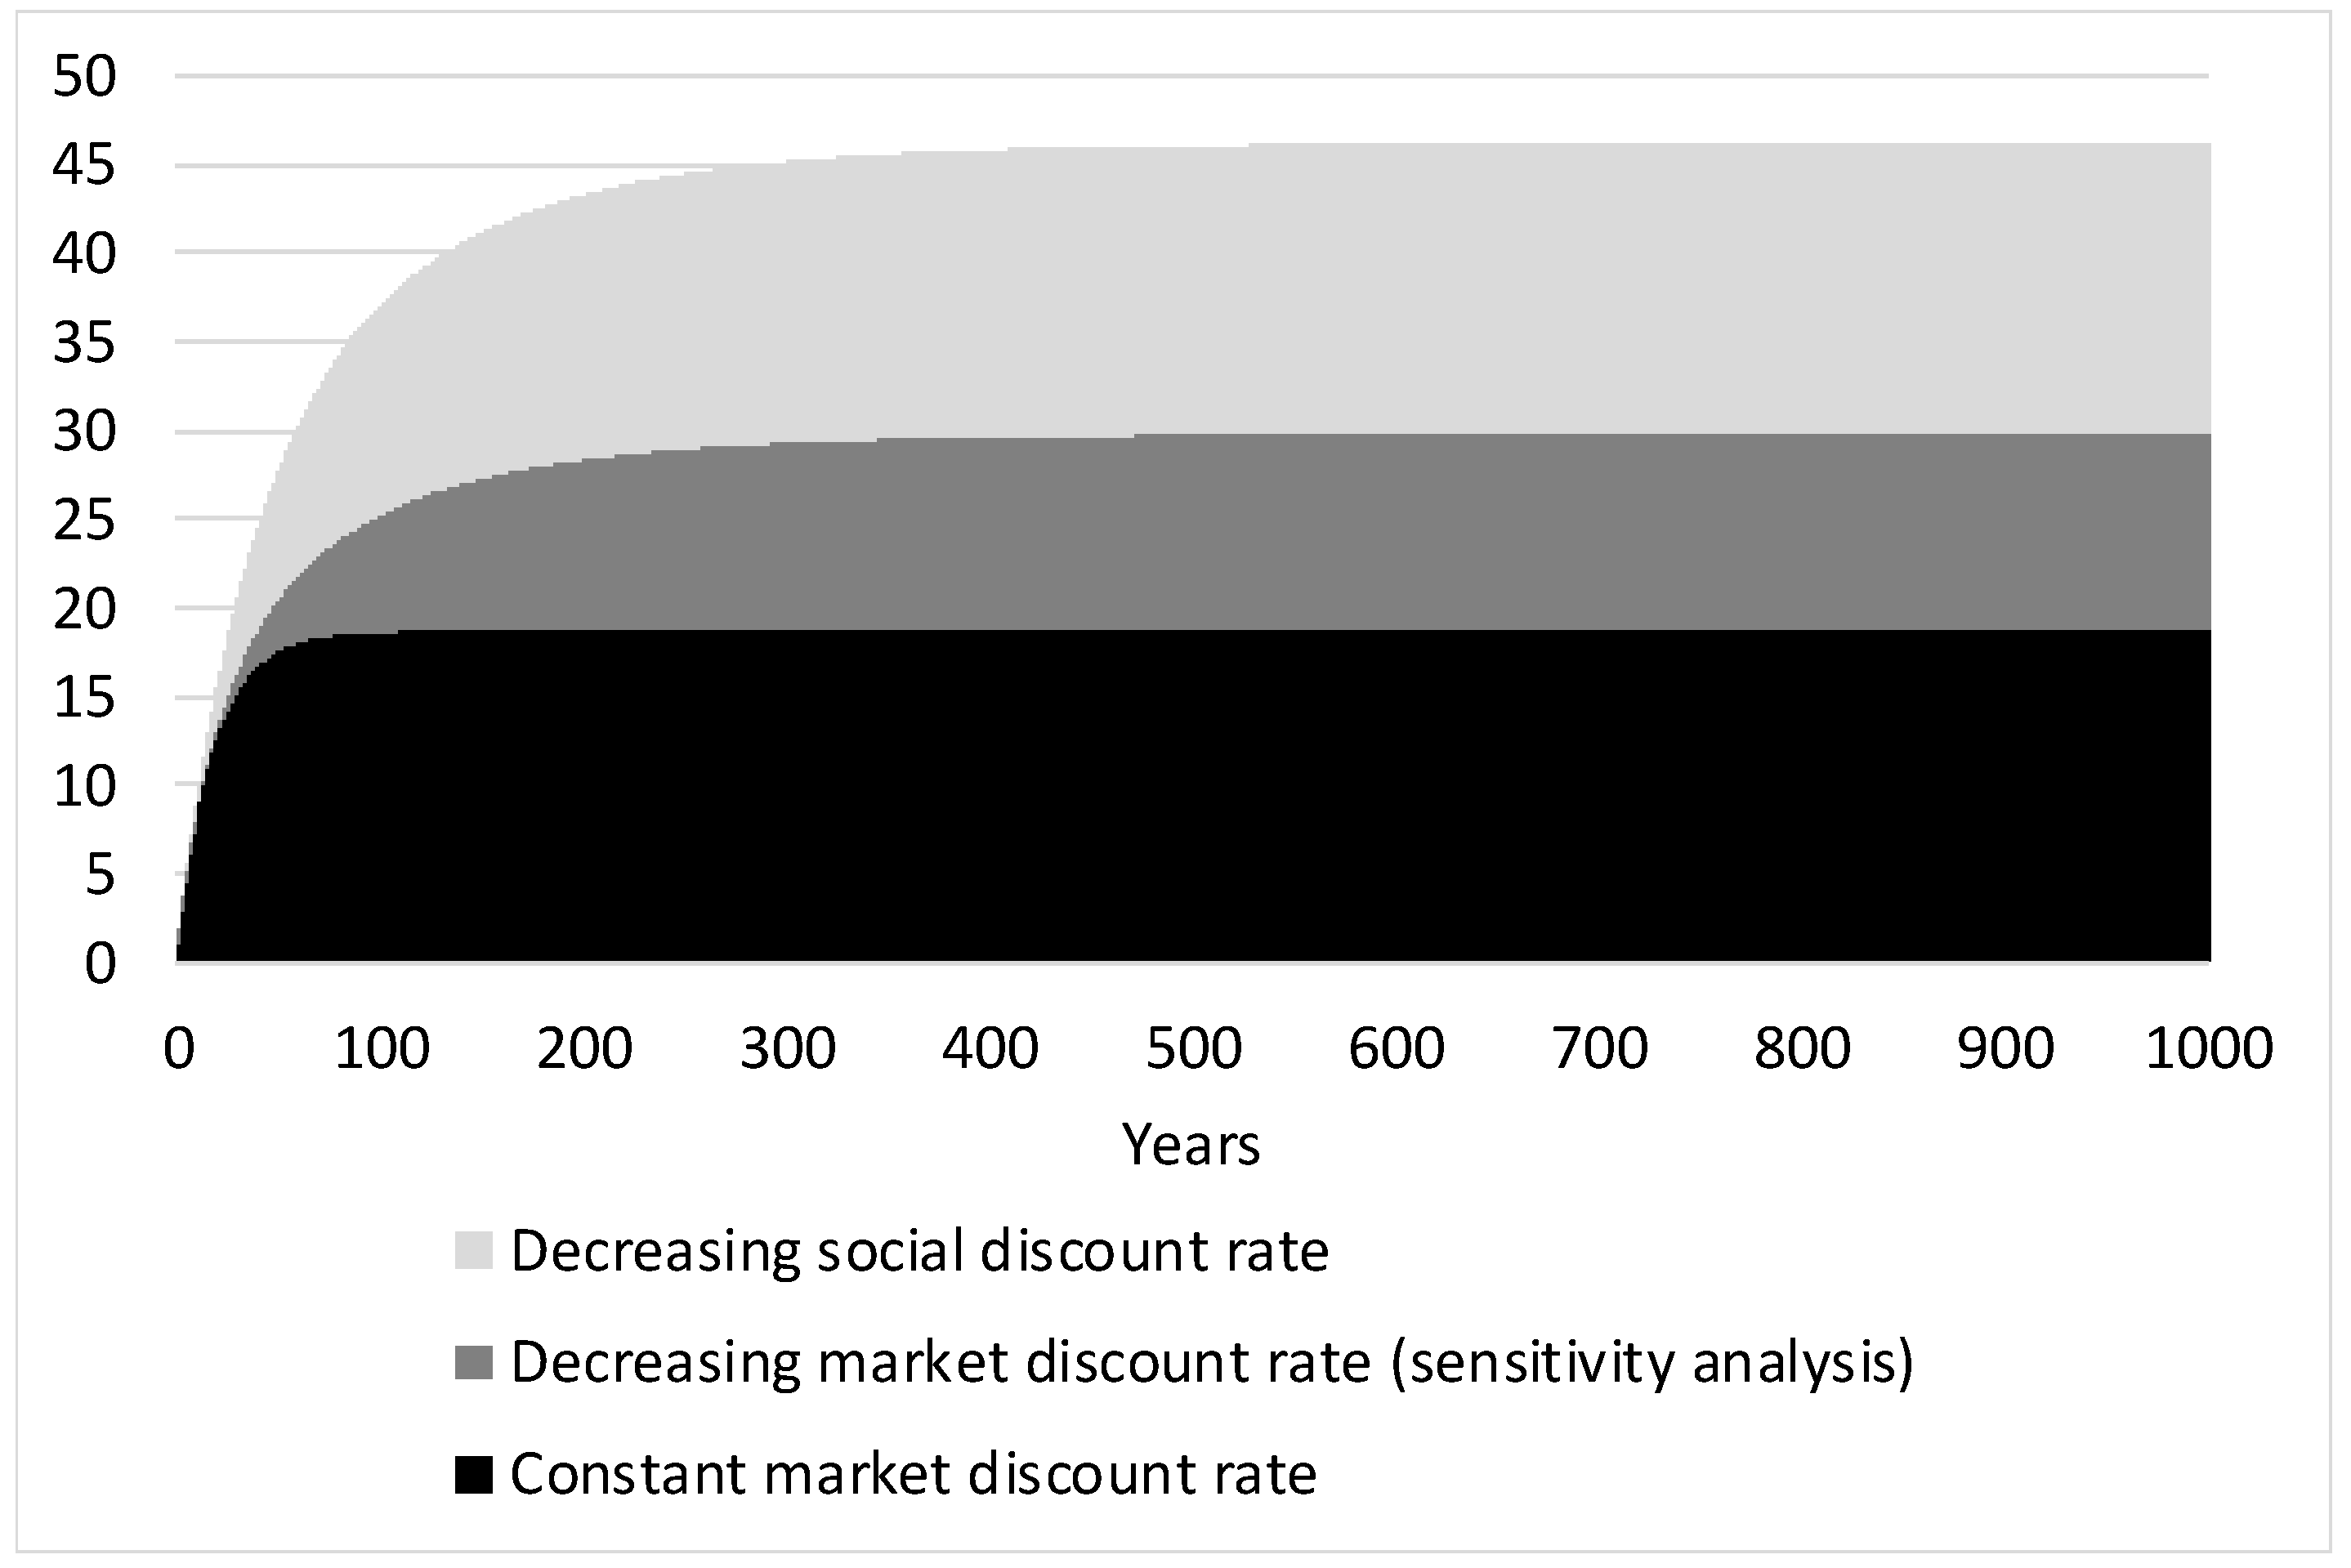
Figure 6 shows how the integrals of the social discount factors and the market discount factors develop over time and how the difference between the integrals converge towards a constant value (see figure below). This difference is applied for computing the socially optimal resource prices. The optimal resource prices will be higher with the constant market discount rates (base case) than when assuming decreasing market discount rates (sensitivity analysis).
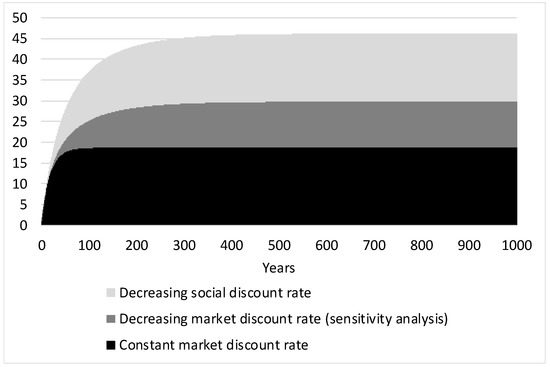
Figure 6.
Integrals of the discount factors.
4. Results
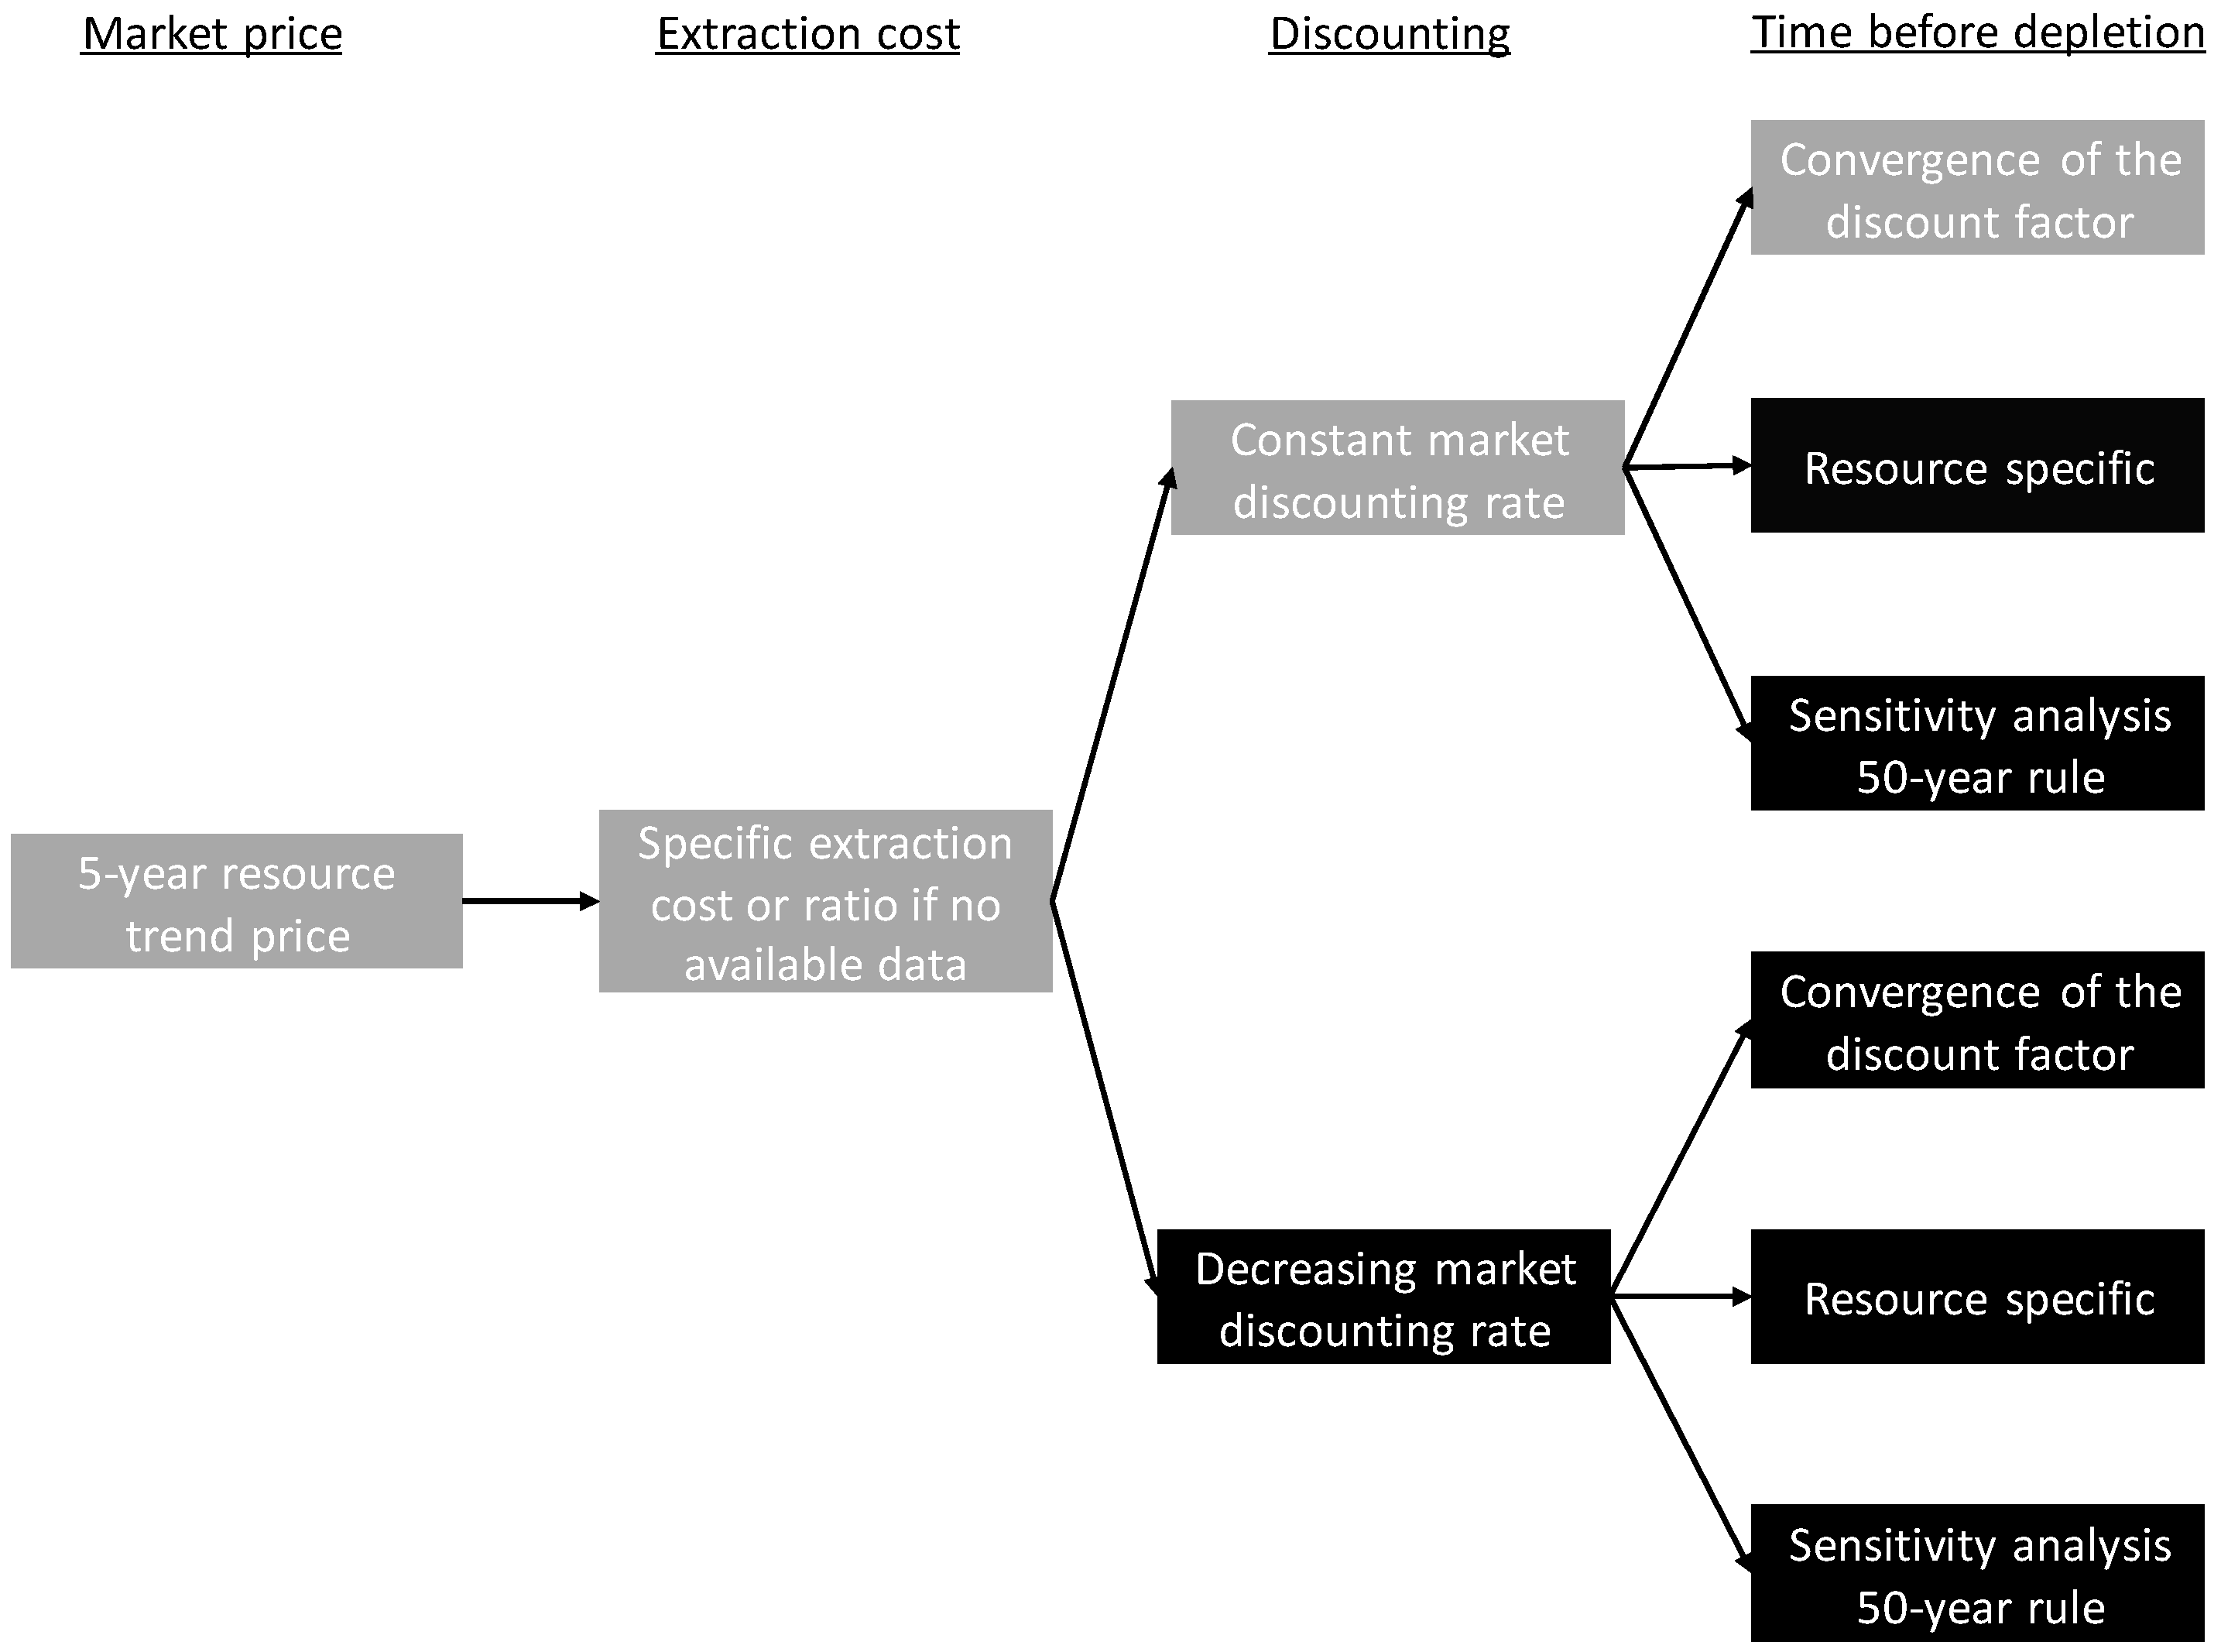
Results are presented for the recommended base case and for five sensitivity analyses for different assumptions on discounting and the time before depletion. The base case (shown in grey in Figure 7) applies the constant market discount rate and the “convergence of the discount factors” approach from Figure 6. Figure 7 illustrates the different data that go into the model and thus also the model uncertainties and assumptions. For the market price and the extraction costs, uncertainties are dominated by data uncertainty that can be expressed as stochastic uncertainties around the base case mean value, while the uncertainties on discounting and the time before depletion are dominated by model uncertainty and are taken into account through sensitivity analyses with the different modelling assumptions.
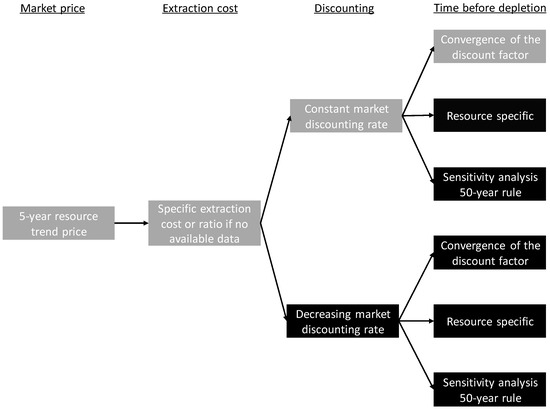
Figure 7.
The data and assumptions for the base case (grey) and the five sensitivity analyses.
4.1. Externality Cost of Depletion of Sub-Soil Resources
Table 1 shows the price correction factors for the net resource prices for the base case (constant market discount rate at 5.5%, and t = 300) with sensitivity analyses for t = 50 and declining market discount rates, respectively. It can be seen that the applied base case is also a worst case, providing an upper bound for the values compared to those of the sensitivity analyses. This is readily understandable, since the difference between the social and market discount rates increase over time, and the difference is smaller for the market declining market rate than for the constant market rate (see Figure 6).

Table 1.
Price correction factors for the base case and two sensitivity analyses.
Table 2 shows, for a selection of resources, the resulting externality cost of depletion that should be added to the market prices of the resources in order to obtain the socially optimal prices. Table A1 in the Appendix provides values for a more complete list of resources. The values are expressed relative to the market price. For t = 300, the only differences between resources occur as a result of differences in extraction costs—and thereby in economic rent—relative to the market prices including extraction costs. The other two scenarios are obviously additionally influenced by the estimated time before depletion.

Table 2.
Upper bound externality cost of depletion for different resources, expressed relative to the resource prices (absolute correction divided by the resource price).
All results are considered as upper bounds as they have been calculated under the assumption of inelastic demand (see Section 2.2.3). Introducing elastic demand would result in values for the external cost of depletion between the market price and the values presented in Table 1.
4.2. Limitations
Modelling assumptions and data quality are the main aspects limiting the robustness of the proposed factors.
4.2.1. Modelling Assumptions Limits
Resources are often characterized by growing extraction cost because man has to dig deeper or because the resource purity decreases. Nevertheless, extraction costs may also decrease, e.g., due to technological progress. We simplified the extraction cost evolution by assuming that the extraction cost is constant. This simplification mostly harms the robustness of the estimated optimal prices for resources combining the high extraction cost component in the price and significant anticipated evolution of the extraction costs. If the extraction cost is increasing instead of being constant, the proposed price correction is too large and vice-versa.
The starting point of the method is the market price. The current price reflects sometimes only a short-term situation (e.g., a bubble, geopolitics). To obtain price estimates that can be used in the medium term, we recommend taking a 5-year linear trend price. We take the prices as they are and do not correct it for market conditions like lack of competition, geopolitical issues, etc. It is uncertain whether the bias is upwards or downwards for a resource.
Other modelling assumptions have been included as sensitivity analyses, showing that our base estimates can be seen as representing the upper bound required for price corrections.
4.2.2. Data Limitations
Extraction costs of resources are heterogeneous depending on the technology, the ore quality and the size of the fields. Only low-quality, average extraction costs data are accessible. The extraction costs are derived from data on revenues and gross operating surplus. For resource without such information, we take as a default value that the extraction cost is equal to 75% of the market price (based on the average of resources listed in Eurostat [23]). Empirical extraction cost data from the industry could improve the reliability of the extraction cost data.
The base case does not use an assumption on the time before depletion because it is based on the convergence of the market and social discount rates. Nevertheless, the second and third methods (used as sensitivity analysis) assume a specific time before depletion. There is a significant uncertainty on the time to economic depletion, depending on the consumption scenarios and the future willingness to pay for the resource. We estimated the time before depletion with the known economically extractable reserves and the estimation of the undiscovered resources divided by the mine production of 2014 from U.S. Geological Survey (2015) [17]. Future unexpected mine production increases/decreases are not taken into account. The time before depletion can be longer or shorter depending on the uncertain resources discoveries and the actual consumption.
5. Comparison to Other Methods
In this section, we compare the results of our method with two recent methods that also seek to place a monetary value on the contribution to resource depletion (Table 3).

Table 3.
Comparison of our results with those of other recent methods.
The EPS method (Steen, 2015 [24,25]) explicitly applies a restoration cost approach, assuming that no substitution will be made before mining has to be done from the average concentration of the Earth’s crust, using only biomass energy sources and currently existing technologies. Extraction costs under these conditions are calculated without any discounting. Not surprisingly, the values obtained are an order of magnitude higher than ours, or higher, although titanium is a notable exception. The relatively high economic rent for crude petroleum is also reflected in the relatively high externality costs in our results and, therefore, there is a relatively smaller difference to the EPS results.
The Surplus Cost Potential method (Vieira et al., 2016 [26]) calculates the cost of future extraction by extrapolating a cumulative cost-tonnage curve and fitting to production cost data from 2000 to 2013. The results are not systematically higher or lower than our results, but there are significant deviations for several minerals.
6. Conclusions
Sub-soil resource depletion is of great concern in environmental assessment and is also used as an argument for a more circular economy. The issue is to assess the real value of one unit of resource, i.e., the burden for society of not having it in the future, or in a less usable form, due to its present consumption. It is particularly significant when making decision about renewable energy, waste recycling, and the use of new technologies that use sub-soil resources.
The valuation methods used in Life Cycle Assessment (LCA) are found to be unsatisfying by the recent reviews, while Cost Benefit Analyses (CBA) typically values sub-soil resources assuming that there is no issue of too fast depletion (real value = market price). In this paper, we have provided and demonstrated the applicability of a method to value sub-soil resources in LCA and in environmental CBA, based on information given by the market.
We calculate a price correction based on the Hotelling rule and the fact that private agents discount future costs and benefits at a higher rate than society as a whole. The price of the last resource unit sold is calculated with the Hotelling rule and a market discount rate. We assumed constant extraction costs. Then, the socially optimal price is calculated by retropolating the price at depletion the Hotelling rule and the social discount rate.
Our method provides recommended social cost factors for sub-soil resources to be used in CBA and as market-based characterization factors in LCA. The specific advantage of our method, compared to previous methods, is that it is based exclusively on information provided in the market, thereby avoiding the need for more or less speculative assumptions
Uncertainties relate to the choice of the social and market discount rates, the price elasticity of the future demand for resources and the quality of the data (market prices, extraction costs and time before depletion). However, even under high uncertainty, the use of market data provides more reliable social cost information than methods based on expert opinion on future scenarios.
Further research should improve the quality of the input data and try to determine the price elasticity of the future demand for resources. The biggest challenge to improve the method is the estimation of the extraction cost because currently default extraction cost values are used for most of the resources.
Author Contributions
S.S. and B.D.C. initiated the paper; T.H., B.P.W. and S.S. developed the methodology with the support of B.D.C. and E.v.O.; T.H. carried out the data collection and the modelling with the support of B.P.W. and S.S.
Funding
This research received no external funding.
Acknowledgments
We thank Marc Baudry and Christian Gollier for their inputs to improve the methodology.
Conflicts of Interest
The authors declare no conflict of interest.
Appendix A

Table A1.
Upper bound externality cost of depletion for different resources, expressed relative to the resource prices (absolute correction divided by the resource price).
Table A1.
Upper bound externality cost of depletion for different resources, expressed relative to the resource prices (absolute correction divided by the resource price).
| Resources | 5-Year | Extraction | Estimated Time | Upper Bound Externality Cost of Depletion Relative to the Resource Prices | |||||
|---|---|---|---|---|---|---|---|---|---|
| Trend Price (€ 2017/kg) | Cost/Price | Before Depletion (Years) | Using Constant Market Discount Rate | Using Declining Market Discount Rate | |||||
| t = 300 (Base Case) | t = specific | t = specific; max. 50 | t = 300 | t = specific | t = specific; max. 50 | ||||
| Abrasives (natural) | 0.15 | 75% | 100 | 0.60 | 0.50 | 0.40 | 0.39 | 0.37 | 0.34 |
| Aluminium | 1.39 | 75% | 100 | 0.60 | 0.50 | 0.40 | 0.39 | 0.37 | 0.34 |
| Antimony | 6.29 | 75% | 13 | 0.60 | 0.29 | 0.29 | 0.39 | 0.28 | 0.28 |
| Arsenic | 0.77 | 75% | 100 | 0.60 | 0.50 | 0.40 | 0.39 | 0.37 | 0.34 |
| Asbestos | 1.66 | 75% | 100 | 0.60 | 0.50 | 0.40 | 0.39 | 0.37 | 0.34 |
| Barite | 0.12 | 75% | 51 | 0.60 | 0.40 | 0.40 | 0.39 | 0.34 | 0.34 |
| Bauxite | 0.02 | 75% | 71 | 0.60 | 0.45 | 0.40 | 0.39 | 0.36 | 0.34 |
| Beryllium | 419 | 75% | 100 | 0.60 | 0.50 | 0.40 | 0.39 | 0.37 | 0.34 |
| Bismuth | 16.2 | 75% | 27 | 0.60 | 0.33 | 0.33 | 0.39 | 0.31 | 0.31 |
| Boron | 0.43 | 75% | 64 | 0.60 | 0.43 | 0.40 | 0.39 | 0.35 | 0.34 |
| Bromine | 1.13 | 75% | 100 | 0.60 | 0.50 | 0.40 | 0.39 | 0.37 | 0.34 |
| Cadmium | 1.29 | 75% | 100 | 0.60 | 0.50 | 0.40 | 0.39 | 0.37 | 0.34 |
| Cement | 0.09 | 75% | 100 | 0.60 | 0.50 | 0.40 | 0.39 | 0.37 | 0.34 |
| Caesium | 66,000 | 75% | 100 | 0.60 | 0.50 | 0.40 | 0.39 | 0.37 | 0.34 |
| Chromium | 1.95 | 75% | 18 | 0.60 | 0.30 | 0.30 | 0.39 | 0.29 | 0.29 |
| Clay | 0.05 | 85% | 100 | 0.36 | 0.30 | 0.24 | 0.23 | 0.22 | 0.20 |
| Coal | 0.05 | 82% | 113 | 0.43 | 0.37 | 0.29 | 0.28 | 0.27 | 0.25 |
| Cobalt | 24.4 | 75% | 57 | 0.60 | 0.42 | 0.40 | 0.39 | 0.35 | 0.34 |
| Copper | 3.92 | 54% | 39 | 1.11 | 0.67 | 0.67 | 0.71 | 0.60 | 0.60 |
| Crude petroleum | 0.22 | 57% | 49 | 1.04 | 0.68 | 0.68 | 0.66 | 0.58 | 0.58 |
| Diamond (industrial) | 959 | 75% | 13 | 0.60 | 0.29 | 0.29 | 0.39 | 0.28 | 0.28 |
| Diatomite | 0.26 | 75% | 100 | 0.60 | 0.50 | 0.40 | 0.39 | 0.37 | 0.34 |
| Feldspar | 0.09 | 75% | 100 | 0.60 | 0.50 | 0.40 | 0.39 | 0.37 | 0.34 |
| Fluorspar | 0.21 | 75% | 40 | 0.60 | 0.37 | 0.37 | 0.39 | 0.33 | 0.33 |
| Gallium | 259 | 75% | 100 | 0.60 | 0.50 | 0.40 | 0.39 | 0.37 | 0.34 |
| Garnet (industrial) | 0.25 | 75% | 100 | 0.60 | 0.50 | 0.40 | 0.39 | 0.37 | 0.34 |
| Gemstones | 35,900 | 75% | 100 | 0.60 | 0.50 | 0.40 | 0.39 | 0.37 | 0.34 |
| Germanium | 1390 | 75% | 100 | 0.60 | 0.50 | 0.40 | 0.39 | 0.37 | 0.34 |
| Gold | 30,000 | 75% | 19 | 0.60 | 0.31 | 0.31 | 0.39 | 0.30 | 0.30 |
| Graphite (natural) | 1.01 | 75% | 193 | 0.60 | 0.58 | 0.40 | 0.39 | 0.38 | 0.34 |
| Gypsum | 0.01 | 75% | 100 | 0.60 | 0.50 | 0.40 | 0.39 | 0.37 | 0.34 |
| Hafnium | 516 | 75% | 100 | 0.60 | 0.50 | 0.40 | 0.39 | 0.37 | 0.34 |
| Helium | 18.9 | 75% | 100 | 0.60 | 0.50 | 0.40 | 0.39 | 0.37 | 0.34 |
| Indium | 495 | 75% | 100 | 0.60 | 0.50 | 0.40 | 0.39 | 0.37 | 0.34 |
| Iodine | 28 | 75% | 248 | 0.60 | 0.59 | 0.40 | 0.39 | 0.38 | 0.34 |
| Iron ore | 0.04 | 70% | 26 | 0.72 | 0.39 | 0.39 | 0.46 | 0.37 | 0.37 |
| Iron oxide pigments | 1.09 | 75% | 100 | 0.60 | 0.50 | 0.40 | 0.39 | 0.37 | 0.34 |
| Kyanite | 0.31 | 75% | 100 | 0.60 | 0.50 | 0.40 | 0.39 | 0.37 | 0.34 |
| Lead | 1.61 | 75% | 19 | 0.60 | 0.31 | 0.31 | 0.39 | 0.30 | 0.30 |
| Lime | 0.11 | 75% | 100 | 0.60 | 0.50 | 0.40 | 0.39 | 0.37 | 0.34 |
| Lithium | 4.02 | 75% | 431 | 0.60 | 0.61 | 0.40 | 0.39 | 0.39 | 0.34 |
| Magnesium metal | 4.11 | 75% | 100 | 0.60 | 0.50 | 0.40 | 0.39 | 0.37 | 0.34 |
| Manganese | 1.13 | 75% | 34 | 0.60 | 0.35 | 0.35 | 0.39 | 0.32 | 0.32 |
| Mercury | 46.6 | 75% | 100 | 0.60 | 0.50 | 0.40 | 0.39 | 0.37 | 0.34 |
| Mica (scrap and flake) | 2.82 | 75% | 100 | 0.60 | 0.50 | 0.40 | 0.39 | 0.37 | 0.34 |
| Molybdenum | 14.5 | 75% | 41 | 0.60 | 0.37 | 0.37 | 0.39 | 0.33 | 0.33 |
| Natural gas, LNG | 5.02 | 85% | 57 | 0.36 | 0.25 | 0.24 | 0.23 | 0.21 | 0.20 |
| Natural gas, US | 2.16 | 85% | 57 | 0.36 | 0.25 | 0.24 | 0.23 | 0.21 | 0.20 |
| Natural gas, Europe | 3.24 | 85% | 57 | 0.36 | 0.25 | 0.24 | 0.23 | 0.21 | 0.20 |
| Nickel | 7.44 | 75% | 31 | 0.60 | 0.35 | 0.35 | 0.39 | 0.32 | 0.32 |
| Nitrogen | 0.48 | 75% | 100 | 0.60 | 0.50 | 0.40 | 0.39 | 0.37 | 0.34 |
| Palladium | 20,800 | 75% | 171 | 0.60 | 0.56 | 0.40 | 0.39 | 0.38 | 0.34 |
| Peat | 0.02 | 84% | 435 | 0.39 | 0.39 | 0.26 | 0.25 | 0.25 | 0.22 |
| Perlite | 0.05 | 75% | 100 | 0.60 | 0.50 | 0.40 | 0.39 | 0.37 | 0.34 |
| Phosphate | 0.07 | 75% | 100 | 0.60 | 0.50 | 0.40 | 0.39 | 0.37 | 0.34 |
| Phosphate rocks | 0.07 | 75% | 309 | 0.60 | 0.61 | 0.40 | 0.39 | 0.39 | 0.34 |
| Platinum | 22,100 | 75% | 171 | 0.60 | 0.56 | 0.40 | 0.39 | 0.38 | 0.34 |
| Potash | 0.48 | 75% | 95 | 0.60 | 0.49 | 0.40 | 0.39 | 0.37 | 0.34 |
| Potassium chloride | 0.17 | 75% | 100 | 0.60 | 0.50 | 0.40 | 0.39 | 0.37 | 0.34 |
| Propane | 0.10 | 75% | 100 | 0.60 | 0.50 | 0.40 | 0.39 | 0.37 | 0.34 |
| Pumice | 0.03 | 75% | 100 | 0.60 | 0.50 | 0.40 | 0.39 | 0.37 | 0.34 |
| Rare earth | 5.43 | 75% | 1048 | 0.60 | 0.62 | 0.40 | 0.39 | 0.39 | 0.34 |
| Rhenium | 2180 | 75% | 54 | 0.60 | 0.41 | 0.40 | 0.39 | 0.34 | 0.34 |
| Salt | 0.04 | 83% | 100 | 0.41 | 0.34 | 0.27 | 0.26 | 0.25 | 0.23 |
| Sand/gravel (industrial) | 0.05 | 85% | 100 | 0.36 | 0.30 | 0.24 | 0.23 | 0.22 | 0.20 |
| Selenium | 34.3 | 75% | 100 | 0.60 | 0.50 | 0.40 | 0.39 | 0.37 | 0.34 |
| Silicon | 2.14 | 75% | 100 | 0.60 | 0.50 | 0.40 | 0.39 | 0.37 | 0.34 |
| Silver | 360 | 75% | 21 | 0.60 | 0.31 | 0.31 | 0.39 | 0.30 | 0.30 |
| Sodium carbonate | 0.13 | 75% | 100 | 0.60 | 0.50 | 0.40 | 0.39 | 0.37 | 0.34 |
| Sodium sulfate | 0.14 | 75% | 100 | 0.60 | 0.50 | 0.40 | 0.39 | 0.37 | 0.34 |
| Stone (crushed) | 0.01 | 85% | 100 | 0.36 | 0.30 | 0.24 | 0.23 | 0.22 | 0.20 |
| Stone (dimension) | 0.15 | 85% | 100 | 0.36 | 0.30 | 0.24 | 0.23 | 0.22 | 0.20 |
| Strontium | 0.32 | 75% | 21 | 0.60 | 0.32 | 0.32 | 0.39 | 0.30 | 0.30 |
| Sulfur | 0.06 | 75% | 100 | 0.60 | 0.50 | 0.40 | 0.39 | 0.37 | 0.34 |
| Talc and Pyrophyllite | 0.19 | 75% | 100 | 0.60 | 0.50 | 0.40 | 0.39 | 0.37 | 0.34 |
| Tantalum | 213 | 75% | 83 | 0.60 | 0.47 | 0.40 | 0.39 | 0.36 | 0.34 |
| Tellurium | 40.2 | 75% | 100 | 0.60 | 0.50 | 0.40 | 0.39 | 0.37 | 0.34 |
| Thallium | 6520 | 75% | 100 | 0.60 | 0.50 | 0.40 | 0.39 | 0.37 | 0.34 |
| Thorium | 249 | 75% | 100 | 0.60 | 0.50 | 0.40 | 0.39 | 0.37 | 0.34 |
| Tin | 14.6 | 75% | 16 | 0.60 | 0.3 | 0.30 | 0.39 | 0.29 | 0.29 |
| Titanium dioxide | 2.1 | 75% | 42 | 0.60 | 0.38 | 0.38 | 0.39 | 0.33 | 0.33 |
| Titanium metal | 9.12 | 75% | 130 | 0.60 | 0.53 | 0.40 | 0.39 | 0.37 | 0.34 |
| Tungsten | 35.3 | 75% | 38 | 0.60 | 0.36 | 0.36 | 0.39 | 0.34 | 0.33 |
| Uranium | 43 | 75% | 100 | 0.60 | 0.50 | 0.40 | 0.39 | 0.37 | 0.34 |
| Vanadium | 15.7 | 75% | 189 | 0.60 | 0.57 | 0.40 | 0.39 | 0.34 | 0.34 |
| Wollastonite | 0.19 | 75% | 164 | 0.60 | 0.56 | 0.40 | 0.39 | 0.34 | 0.34 |
| Zinc | 1.96 | 75% | 15 | 0.60 | 0.29 | 0.29 | 0.39 | 0.34 | 0.29 |
| Zirconium | 0.59 | 75% | 55 | 0.60 | 0.41 | 0.40 | 0.39 | 0.34 | 0.34 |
References
- Hicks, J.R. Value and Capital, 2nd ed.; Oxford University Press: Oxford, UK, 1946. [Google Scholar]
- El Serafy, S. The proper calculation of income from depleting natural resources. J. Energy Dev. 1981, 7, 73–88. [Google Scholar]
- Miller, M.H.; Upton, C.W. A Test of the Hotelling Valuation Principle. J. Polit. Econ. 1985, 93, 1–25. [Google Scholar] [CrossRef]
- Hotelling, H. The Economics of Exhaustible Resources. J. Polit. Econ. 1931, 39, 137–175. [Google Scholar] [CrossRef]
- Davis, G.A.; Cairns, R.D. Valuing petroleum reserves using current net price. Econ. Inq. 1999, 37, 295–311. [Google Scholar] [CrossRef]
- de Bruyn, S.; Korteland, M.; Markowska, A.; Davidson, M.; de Jong, F.; Bles, M.; Sevenster, M. Shadow Prices Handbook: Valuation and Weighting of Emissions and Environmental Impacts; CE Delft: Delft, The Netherlands, 2010. [Google Scholar]
- Sonderegger, T.; Dewulf, J.; Fantke, P.; de Souza, D.M.; Pfister, S.; Stoessel, F.; Verones, F.; Vieira, M.; Weidema, B.P.; Hellweg, S. Towards harmonizing natural resources as an area of protection in life cycle impact assessment. Int. J. Life Cycle Assess. 2017, 22, 1912–1927. [Google Scholar] [CrossRef]
- Alvarenga, R.A.F.; de Oliveira Lins, I.; de Almeida Neto, J.A. Evaluation of Abiotic Resource LCIA Methods. Resources 2013, 5, 13. [Google Scholar] [CrossRef]
- Northey, S.A.; Mudd, G.M.; Werne, T.T. Unresolved Complexity in Assessments of Mineral Resource Depletion and Availability. Nat. Resour. Res. 2018, 27, 241–255. [Google Scholar] [CrossRef]
- Mohr, S. Projection of World Fossil Fuel Production with Supply and Demand Interactions. Ph.D. Thesis, University of Newcastle, Newcastle, Australia, 2010. [Google Scholar]
- Solow, R.M. The Economics of Resources or the Resources of Economics; Palgrave Macmillan: London, UK, 1974. [Google Scholar]
- Bickel, P.; Friedrich, R. Externe. Externalities of Energy. Methodology 2005 Update; Directorate-General for Research Sustainable Energy Systems (EUR 21951); European Commission: Brussels, Belgium, 2005. [Google Scholar]
- De Caevel, B.; Standaert, S.; van Overbeke, E.; Alexandre, C. Market-based allocation of recycling benefits. Presented at the SETAC-Europe Annual Meeting, Berlin, Germany, 28 February–2 March 2011. [Google Scholar]
- Zhuang, J.; Liang, Z.; Lin, T.; De Guzman, F. Theory and Practice in the Choice of Social Discount Rate for Cost-Benefit Analysis: A Survey; ERD working paper series 94; Asian Development Bank: Mandaluyong, Philippines, 2007. [Google Scholar]
- Marshall, A. Principles of Economics: Unabridged, 8th ed.; Cosimo, Inc.: New York, NY, USA, 2009. [Google Scholar]
- Kesler, S.E. Mineral Supply and Demand into the 21st Century. In US Geological Survey Circular 1294, Proceedings for a Workshop on Deposit Modeling, Mineral Resource Assessment, and Their Role in Sustainable Development; US Geological Survey: Reston, VA, USA, 2007; pp. 55–62. [Google Scholar]
- U.S. Geological Survey. Mineral Commodity Summaries 2015: U.S. Geological Survey; U.S. Geological Survey: Reston, VA, USA, 2015.
- Arrow, K.J.; Cropper, M.L.; Gollier, C.; Groom, B.; Heal, G.M.; Newell, R.G.; Nordhaus, W.D.; Pindyck, R.S.; Pizer, W.A.; Portney, P.R.; et al. How Should Benefits and Costs Be Discounted in an Intergenerational Context? The Views of an Expert Panel; Resources for the Future: Washington, DC, USA, 2012. [Google Scholar]
- Arrow, K.; Cropper, M.; Gollier, C.; Groom, B.; Heal, G.; Newell, R.; Nordhaus, W.; Pindyck, R.; Pizer, W.; Portney, P.; et al. Determining Benefits and Costs for Future Generations. Science 2013, 341, 349–350. [Google Scholar] [CrossRef] [PubMed]
- Weitzman, M.L. Why the far-distant future should be discounted at its lowest possible rate. J. Environ. Econ. Manag. 1998, 36, 201–208. [Google Scholar] [CrossRef]
- Lowe, J. Intergenerational Wealth Transfers and Social Discounting: Supplementary Green Book Guidance; UK HM Treasury: London, UK, 2008. [Google Scholar]
- Giglio, S.; Maggiori, M.; Stroebel, J. Very Long-Run Discount Rates (No. w20133); National Bureau of Economic Research: Cambridge, MA, USA, 2014. [Google Scholar]
- Eurostat. Annual Detailed Enterprise Statistics for Industry (NACE Rev. 2, B-E). 2018. Available online: https://ec.europa.eu/eurostat/web/products-datasets/-/sbs_na_ind_r2 (accessed on 13 March 2018).
- Steen, B. A New Impact Assessment Version for the EPS System—EPS 2015dx—Excluding Climate Impacts from Secondary Particles; Swedish Life Cycle Center Report; Chalmers University of Technology: Göteborg, Sweden, 2015. [Google Scholar]
- Steen, B. The EPS 2015d Impact Assessment Method—An Overview; Swedish Life Cycle Centre report; Chalmers University of Technology: Göteborg, Sweden, 2015. [Google Scholar]
- Vieira, M.D.M.; Ponsioen, T.C.; Goedkoop, M.; Huijbregts, M.A.J. Surplus cost potential as a life cycle impact indicator for metal extraction. Resources 2016, 5, 2. [Google Scholar] [CrossRef]
© 2019 by the authors. Licensee MDPI, Basel, Switzerland. This article is an open access article distributed under the terms and conditions of the Creative Commons Attribution (CC BY) license (http://creativecommons.org/licenses/by/4.0/).

