Article

Development of an Industrial Environmental Index to Assess the Sustainability of Industrial Solvent-Based Processes

1
Elmir Brewing Company, Jdeideh El Metn 900073, Lebanon
2
Department of Architecture, American University in Cairo, New Cairo 11835, Egypt
*
Author to whom correspondence should be addressed.
Resources 2019, 8(2), 115; https://doi.org/10.3390/resources8020115
Submission received: 13 May 2019 / Revised: 13 June 2019 / Accepted: 18 June 2019 / Published: 19 June 2019

Abstract

:
In light of the constant increase in global temperatures, increasing risks associated with climate change, and stricter environmental policies, societies are at a crossroad where sound environmental decisions need to be taken. This is particularly applicable to the chemical industry where the sustainability of processes is all the more relevant to decision-making. This article supports the development of a holistic industrial environmental index (IEI) to assess the sustainability of industrial solvent-based processes. Several metrics are reviewed to individually assess particular aspects of the process in terms of materials, equipment, energy, environmental health and safety (EHS) considerations, and the product’s entire life cycle. The metrics are later used to support the development of an aggregate and holistic IEI using a composite indicator method. The developed methodology and framework can pave the way for environmentally sound decision-making in industries and spark the development of dedicated assessment indices similar to IEI that can be applied to a wide array of other industries.

1. Introduction

Two of the many problems facing the scientific community today are climate change and global warming. CO2 emissions have never been as high as 400 ppm since 1960 [1], and the climate trends continue to show a steady increase in average temperatures, despite the global efforts to curb it. Without international policy agreements (such as the Paris Agreement in 2015), limiting global warming to an increase of 2 °C by 2050 would be all the more impossible [1]. Amidst regulations and policies, scientists and, especially, chemists and chemical/process engineers have a responsibility for defining sustainable industrial processes in order to understand whether those used are environmentally viable. They can also provide insightful data and analyses to increase the awareness of government officials [2,3], policy-makers, as well as the scientific community and the chemical industry. The chemical industry, as an important player in the implementation of industrial processes and manufacturing, is required to advance its environmental, economic, and social performance to comply with the global sustainability agenda and the Sustainable Development Goals (SDGs) [Goal 9: Industry, Innovation and Infrastructure] in particular [4].
By definition, green chemistry aims at reducing waste, energy and materials usage, risks and hazards, the emission of volatile organic compounds (VOCs), the cost and, in general, the environmental impact of a process [5].
Sustainability, which is defined as “meeting the needs of the present without compromising the ability of future generations to meet their own needs” [5] has to be understood as a relative attribute—at least, much more than it is absolute. In other words, the green metrics of a process should be assessed relatively to those of another one [6]. However, because of the rather broad definition of sustainability, it is still conceptually unusual to try and quantify the sustainability of a process, be it in general or relatively to another [7]. Some questions, therefore, arise when trying to use green metrics to quantify how green or sustainable a process is: Should the entire process be considered? Can quantitative green metrics solely determine sustainability? How can a simple method give a result with reasonable objectivity? Is one unified metric or index more practical?
Although quantitative assessments are the major drive towards the improvement of a synthetic process, a proper green metrics analysis should help determine whether a chemical process meets set criteria quantitatively and qualitatively [8]. Furthermore, a holistic approach to the assessment of a process [9], i.e., from the transportation of raw materials to the disposal of the end product (cradle-to-grave) or its recycling/upcycling (cradle-to-cradle) [10], renders the metrics and results more relevant.
Metrics should ideally be converted into key performance indicators (KPIs) that will assist in decision-making in view of maximizing material and energy efficiencies while minimizing cost, solvent usage, waste production, and toxicity of materials [6], either by identifying key aspects of a synthetic process to be optimized or by investigating a greener alternative. A process is “generally a closely linked set of unit operations carried out across a finite time and discrete space” [11]; a change in one unit will most likely affect other unit operations. It is thus important to have metrics that consider the relationship between different units. In addition, measuring chemical efficiency is not the same as measuring process efficiency. The latter encompasses chemical, chemical engineering, and plant operation efficiencies and results in a more comprehensive analysis of the sustainability of a process [11,12].
In light of what has been detailed above, the scope and aims of this article are to: (i) cover the quantitative, semi-quantitative, and qualitative credentials and metrics that can be used to assess the sustainability of solvent-based processes and (ii) conceptually aggregate the covered metrics and resulting KPIs into a composite indicator to be used as an aggregated industrial environmental index (IEI) for strategic and operational developments in relevant industries.

2. Materials and Methods

This article reviews process metrics and criteria and environmental health and safety (EHS) credentials applicable for large-scale chemical plants and elaborates on life cycle analysis (LCA) to support their aggregation into an IEI for the assessments of solvent-based processes. Following a thorough review of a wide-enough array of metrics and their aggregation into a composite index, this article sets the base towards developing quick and easy-to-use measurements in sustainability assessments of chemical processes. The theoretical work in this article paves the way for future applications of the IEI for sustainability assessments in various chemical and manufacturing industries [13,14]. This final and single index would allow for more insightful and relevant relative assessments of different processes or process pathways without having to detail each and every component of the assessment.

3. Applied Metrics

The metrics discussed in this article were divided in three main categories in order to attempt aggregating a vast-enough array of credentials in the development of the proposed IEI. The three categories are the following:
  • Process metrics and criteria: metrics and credentials that relate to the core of the process in terms of inputs (materials, energy), outputs (materials, energy), and equipment.
  • Environmental, health and safety metrics: metrics and credentials that deal with the impact of the process on the environment, the process staff, and the process itself.
  • LCA, which is briefly covered in this article to conceptually widen the assessment of a process and the aggregation of metrics into an IEI.
Figure 1 breaks down the different categories of metrics that will be discussed in this article.

3.1. Process Metrics and Criteria

Process metrics can further be divided into the three components of a process [9]: materials (physical inputs and outputs in the process), equipment (electro-mechanical components of the process), and measured energy (both in terms of input and output) in order to provide a full assessment that encompasses all its components.

3.1.1. Materials

The choice of materials will eventually affect the product quality and yield, sometimes compromising the whole process. This leads to large quantities of waste (including discarded product) and adverse effects on the environment because of the increased energy requirements for disposal and/or recycling of the materials [11]. The physical form and properties of the materials also influence the choice of reactor and the mixing, separation, and recovery steps, in addition to the fact that they impact on the energy demand (heating and/or cooling), cleaning, and waste [15]. Therefore, it is necessary to be able to quantify the materials used. This is generally done through mass-based process metrics. Mass productivity or efficiency (ME) measures how much input materials are incorporated in the final product, i.e., how much input is saleable [11,16]:
ME = 1 Process   Mass   Intensity   ( kg ) × 100
ME is more adapted for industries than for laboratory-scale processes, since it eventually determines how much of the input will generate profit, unlike laboratory-scale metrics that are centered on the chemical outcome of a reaction (e.g., yield). Process mass intensity (PMI) is described in Equation (5) below.
Moreover, when scaling up a laboratory experiment to a pilot scale or a real plant scale, the use of solvents becomes more cumbersome, especially in the pharmaceuticals and fine chemical industries [17,18]. In the past, this issue was overshadowed by the cheapness of solvents: even though they constitute 80–90% of the mass intensity, they do not count towards 80–90% of the cost of a process [19]. Also, by choosing the proper solvent, the increase in yield used to be more important and beneficial for industries than other considerations. Today, the situation has changed, and solvent usage in batch chemical plants (i.e., pharmaceuticals and fine chemicals) has to be accounted for and assessed because of the large environmental impact of solvents [20]. To do so, the solvent intensity (SI) of a process, expressed as a percentage or a ratio, can be calculated [8,11]:
SI = total   solvent   input   ( kg ) total   mass   input   ( kg )
Because SI excludes water from the calculations [19], the water intensity (WI) of a process should be calculated separately [9,11]:
WI = total   water   input   ( kg ) total   mass   input   ( kg )
Similarly, the waste intensity can also be determined [9,11]:
Waste   Intensity = total   waste   produced   ( kg ) total   mass   input   ( kg )
SI, WI, and waste intensity are useful metrics for processes, since they can give an idea of the breakdown of the more general PMI [21]:
PMI = material   inputs   ( kg ) mass   of   product   ( kg )
Another aspect related to the materials used for a synthesis reaction regards their recyclability and the renewability of the feedstock. In order to account for the renewability of the materials the renewables intensity (RI) of a process can be calculated [9,22]:
RI = mass   of   renewably   derived   materials   ( kg ) mass   of   product   ( kg )
A major pitfall of RI is that it does not account for the energy available from renewable sources. Therefore, an alternative metric, known as the renewables intensity index, can be useful in an environmental assessment [9]:
Renewables   Intensity   Index        = C   from   renewable   materials   ( kg ) total   cradle   mass   of   C   ( kg )        + C   from   renewable   energy   ( kg ) total   energy   mass   of   C   ( kg )
The left-hand term in equation 7 corresponds to the proportion of carbon from renewable materials, while the right-hand term corresponds to the proportion of carbon from renewable energy directly fed in the process [9,11,22]. Following the calculation of the renewability index, it is then scored from 1 to 10 for the materials being compared (10 corresponding to the highest renewability) [9]. However, it is crucial to keep in mind that it is difficult to compare a well-established and optimized process (generally based on non-renewable sources) to one that has yet to be fully optimized and that is under development (based on renewable sources) [9].
The recyclability of a material is also an important factor to consider. It can be measured by attributing recyclability scores, weighted by mass, to the chemicals under study, which can then be ranked accordingly [22]. In this approach, it is important to consider the fundamental chemistry of the entire process, as well as the life cycle impacts it can have [9].

3.1.2. Equipment

The development and correct application of green metrics in this category is highly dependent on a constant process optimization and a thorough understanding of its underlying chemistry [11]. This can be achieved if a real-time analysis of the process is done via distributed control systems (DCSs) [9]. DCSs enable the monitoring of process parameters, examples of which include temperatures throughout the process, pump settings, flow settings, etc. [9]. They allow the modelling and trend design of the various parameters involved in the process and, if coupled with chemical analysis, can provide a better understanding of the optimal conditions and the limits/boundaries of a process [5,9]. Additionally, DCSs enable a real-time and easier detection of the source of a defect or problem [5] in order to avoid process excursions and the production of waste with negative environmental impacts.

Scalability

Process scalability is the extent to which a process performs well when changing the production size as the process develops [11]. To measure scalability, one needs to have a comprehensive understanding of the chemistry and the kinetics of the synthesis reaction under study as well as a tight control over its conditions [11]. This will help avoid losses in product yield and quality, as well as an increase in energy demand and waste production [9]. Understanding the fundamentals and the dynamics of the chemical reactions in a process allows the identification of the critical quality attributes of a process and their limits when scaling it up or down [9,11]. Consequently, it should lead to determining the optimal processing window within which a product of acceptable quality and yield is produced [9].

Controllability

The controllability of a process is crucial in reducing waste, material usage, energy per unit of product, and throughput of a process [9,11]. Indeed, if a process is not tightly controlled, variations in reaction conditions may adversely affect the course of the reaction by producing more waste and requiring more energy. Indirect metrics to measure controllability might be the amount of waste produced per kilogram of product or the energy consumed per kilogram of product for excursions outside a pre-defined control zone [9]. Alternatively, it can be measured by determining the process capability, Cp [11]:
C p =   USL LSL 6 σ
Cp is a metric that compares the output of an ‘in-control process’ to the specification limits [14]. In Equation (8), USL and LSL refer to upper and lower specification limit, respectively, and σ corresponds to the standard deviation of the process. In other words, the spread of specification is compared to that of the process values. If Cp > 1, the specifications of a process cover practically all the process measurements [11]; the process would therefore be in-control.

Robustness, Throughput, and Cycle Time

The robustness of a process is the extent to which the process ‘resists’ to variations in the reaction conditions [9]. A robust process is one in which variations in reaction conditions will not have large or significant effects on product yield and quality. Robustness can be measured with proxy metrics or measures such as the amount of impurities (resulting from side reactions), the physical and chemical stability of the reactions, or the time and complexity of the separation steps [11].
While the throughput of a process is a measure of the average saleable production output per given time unit, cycle time is the rate at which the products are manufactured [9,11]. Since the throughput is a measure of the final output of a process, it is affected by any variation in the reaction conditions, equipment, or chemical plant layout. It can be expressed as the volume or the mass of product per unit time [11]. From a survey conducted by AstraZeneca, a model for calculating the manufacturing time (Tm) was developed [11]:
T m =   N B P + misc
Tm is a measure of the cycle time and is a function of the number of batches (NB), the productivity (P), and the time needed for auxiliary procedures such as cleaning, transportation, or maintenance (misc) [9]. The last term is particularly important for batch processes where more time is allocated for cleaning and maintenance of the multi-purpose unit operations.

3.1.3. Measuring Energy

Energy metrics can be computed and broken down as follows [11]:
Energy   Intensity =   total   process   energy   ( MJ ) mass   of   product   ( kg )
Life   Cycle   Energy =   life   cycle   energy   requirements   ( MJ ) mass   of   product   ( kg )
Waste   Treatment   Energy =   waste   treatment   energy   requirements   ( MJ ) mass   of   product   ( kg )
Solvent   Recovery   Energy =   solvent   recovery   energy   requirements   ( MJ ) mass   of   product   ( kg )
Equations (12) and (13) can be further rearranged to be expressed as a fraction of the total energy input [7]:
Waste   Energy   Ratio =   total   waste   produced   ( kg ) total   energy   input   ( MJ )
Solvent   Energy   Ratio =   total   energy   for   solvent   use   and   recovery   ( MJ ) total   energy   input   ( MJ )
The most important challenge to overcome when measuring energy is to put in place the necessary equipment for measuring the energy consumption of individual unit operations [9]. Unit energy measurements allow the distinction between baseload energy (i.e., energy required to ‘fuel’ the chemical plant) and the energy required by the individual processes [11,23]. Furthermore, they can be used to underpin key material uses or different forms of energy delivered to the process (e.g., heating or cooling) [11]. Like the renewability index and recyclability that were discussed in Section 3.1, it is important to consider energy requirements on a life cycle basis in order to avoid false or simplistic results that exclusively take into account the energy fed into the synthesis [9,11]. Indeed, the energy required for processing and transporting the raw materials, recycling materials, and treating waste generally constitutes a significant fraction of the energy demand of a process [23].

3.2. EHS and Other Considerations

EHS metrics are of utmost importance in assessing the greenness of a process in accordance with the 12 principles of Green Chemistry [24]. Indeed, in a chemical process, it is better to avoid the use of toxic or hazardous substances rather than dispose of them—at an extra energetic and materials cost [24]. However, in order to accurately identify harmful substances and fully understand the EHS risks associated with them, one has to look at the entire EHS profile rather than focus on one portion of it and ending up making risky compromises [11]. The major problem facing EHS metrics is the lack of available data and comprehensive databases, even though legislations, such as REACH (Registration, Evaluation, Authorisation, and Restriction of Chemicals) in the European Union [5], are dealing with this issue. It is also important to understand the distinction between risk and hazard: sometimes using a relatively low-hazard material in large quantities poses a greater risk than using a more hazardous material in fewer quantities. Risk is a function of hazard (a measure that is inherent to the compound under consideration) and likelihood of exposure or occurrence.

3.2.1. Occupational Exposure Hazard

Similar to the approach proposed for ranking materials depending on their recyclability, substances can be ranked according to process safety, occupational exposure, or environmental hazard [11]. The weighted score (by mass) can be either a composite score including all the hazards or a specific score for the different hazards that substances can present [11,25]. Occupational exposure hazards can be determined through occupational exposure limits (also known as permissible exposure limits), which are a combination of inherent toxicity hazard and various safety factors such as the nature and severity of the effect of exposure [11]. Other ways of determining occupational exposure hazards imply the use of indices such as Dow’s chemical exposure index [26] or summing the masses of substances in a particular hazard band/category [11]. There are four hazard categories or bands, numbered from 1 to 4 [25]:
  • Skin and eye irritants;
  • Harmful on single exposure;
  • Severely irritating and corrosive;
  • Very toxic on single exposure, reproductive hazard.

3.2.2. Process Safety Hazards and Cost

Determining the process safety hazards and risks means to evaluate the potential for a process to exhibit sudden changes in temperature and/or pressure that lead to secondary events (fire, explosion, detonation, etc.) [11].
Well-established indices are the Dow’s fire and explosion index [27], the Stoessel criticality index (determines the thermal risk associated with a process) [28], and the inherent safety index [29,30]. However, the challenge resides in the difficulty of accurately predicting the behavior of a chemical system in a process. Moreover, the fact that unstable compounds (generally inherently hazardous) react more readily and favour the completion of a reaction (both thermodynamically and kinetically) [11] is also problematic, since these chemicals are more prone to be used than less reactive and less hazardous compounds.
Cost might be one of the most crucial metrics that help in the decision-making process. Indeed, businesses are more worried about cost than other factors, in addition to the fact that cost reduction prompts research into new classes of chemicals, particularly cheaper ones [11]. Nonetheless, simply stating the cost of materials and substances is not enough. It is important to set the cost metric in the context of a life-cycle approach in order to provide a realistic and comprehensive cost study [5]. An emerging field in which this can be done is environmental accounting [31]. Furthermore, one has to consider all costs incurred in the process, including indirect costs such as monitoring costs, lawsuit costs, or consumer loyalty costs.

3.2.3. Environmental Hazards and Risk

The three main factors to consider when assessing the environmental hazards and risks associated with a chemical process are:
  • Persistence: It is the resistance of chemicals to chemical or biological degradation [9]. Tests to determine the depletion mechanisms of chemicals are extensively covered in the Organization for Economic Co-operation and Development (OECD) Guidelines for the Testing of Chemicals [32].
  • Bioaccumulation: It is the tendency for a chemical to become increasingly concentrated (usually in fat) as it moves up the food chain [9]. It is estimated with the water/octanol partition coefficient (logKOW or DOW), corrected for pH and ionizability in water [9].
  • Toxicity: It is the most debated and debatable factor because of the various tests available to measure it and assess the risk associated with the use of a substance [33]. Nonetheless, and as mentioned in the introduction of this section, the REACH legislation is facilitating the gathering of toxicity data [5], in addition to the regulatory lists (developed by governments) [9] as well as the hazard data and solvent guides published by chemical companies [17,18,19]. Nowadays, lethal toxicity data are not enough, and eco-toxicity data are slowly being incorporated in the databases [9].
Establishing specific risk assessments for each process is vital, since the impact of a chemical will highly depend on the specifics of the process and on its physical and chemical effects [11].

3.3. Life Cycle Analysis

LCA is a holistic approach that predicts the environmental impact of a product over its entire life cycle [34,35]. LCA requires the evaluation of raw materials extraction, intermediates manufacture, product manufacture, use and disposal, or recycling and reuse. LCA studies also include the environmental impacts of the transportation of the materials at any stage of their life cycle [5,8]. Figure 2 provides a schematic overview of LCA stages and boundaries.
A full LCA is a lengthy, complex, and costly process but it can be better understood when broken down to its four stages [5]:
  • Goal and scope definition: It is the planning stage of the LCA process where the objectives and the system boundaries are clearly defined. The different system boundaries are detailed in Figure 2. At this stage, the strategy for data collection needs to be developed, and if any comparative studies are to be conducted, it is essential they be carried out on the same functional unit.
  • Inventory analysis: This stage mainly consists of data collection. This can be done by direct measurements, literature and database searches (with time, databases are growing and becoming more established), theoretical calculations, and interviews with experts. The data can be either aggregated according to the medium where releases occur (i.e., water, air, or soil), which is known as a midpoint method, or presented as a series of potential environmental impacts, which is known as an endpoint method.
  • Impact assessment: The potential environmental impacts discussed above should be put into numbers in order to properly assess the data. The eight most reported impacts are: abiotic depletion (accounting for the depletion of all non-renewable resources), acidification potential, aquatic toxicity, eutrophication potential (potential to cause over-fertilization of water and soil), global warming potential, human toxicity potential, ozone depletion potential, and photochemical oxidants creation potential (potential to generate smog).
  • Interpretation: The final stage of LCA consists of identifying both the parts of the life cycle that have the most impacts and the possibilities of improving the total environmental impact of the process.
LCA is crucial for determining the sustainability of a process, since it is an assessment that considers entire systems throughout their life cycle and sheds light on the relationship between the different parts of a system and the impact they have on one another [9]. However, the major drawbacks of LCA are [5]: (i) the large amount of data required, (ii) the lack of information on many emissions and products entering the environment, and (iii) the lack of objective ranking of the different criteria considered within an LCA. For example, renewably derived tetrahydrofuran (THF) has twice the PMI and more adverse environmental effects than synthetically produced THF [36]. Without considering the process of THF production as a whole and the life cycle impacts of the product, the conclusion would be different [36].

4. Index Development

Key performance indicators relate to an organization’s objectives; they are measurements and determinations that are useful for strategic and operational purposes. KPIs have led to the improvement of decision-making in organizations using these indicators. Environmental KPIs, such as greenhouse gas (GHG) emissions, induce savings and underpin the dependency of organizations on ecological systems and services [37]. Furthermore, they internally foster responsibility towards natural resources, and externally encourage socially responsible and environmentally conscious investing [37]. Green metrics can be converted to KPIs, specific to each chemical industry, depending on the following [38]:
  • The metrics should be indicative of the process as a whole;
  • The metrics should measure performance;
  • The metrics should be important in terms of the organization’s short-term and longer-term goals.
The resultant KPIs would also have to be regularly monitored through environmental management plans. KPIs also allow the understanding of the environmental cost trends of a chemical industry, in conjunction with its economic and social costs, in view of striking a balance between the three [39].

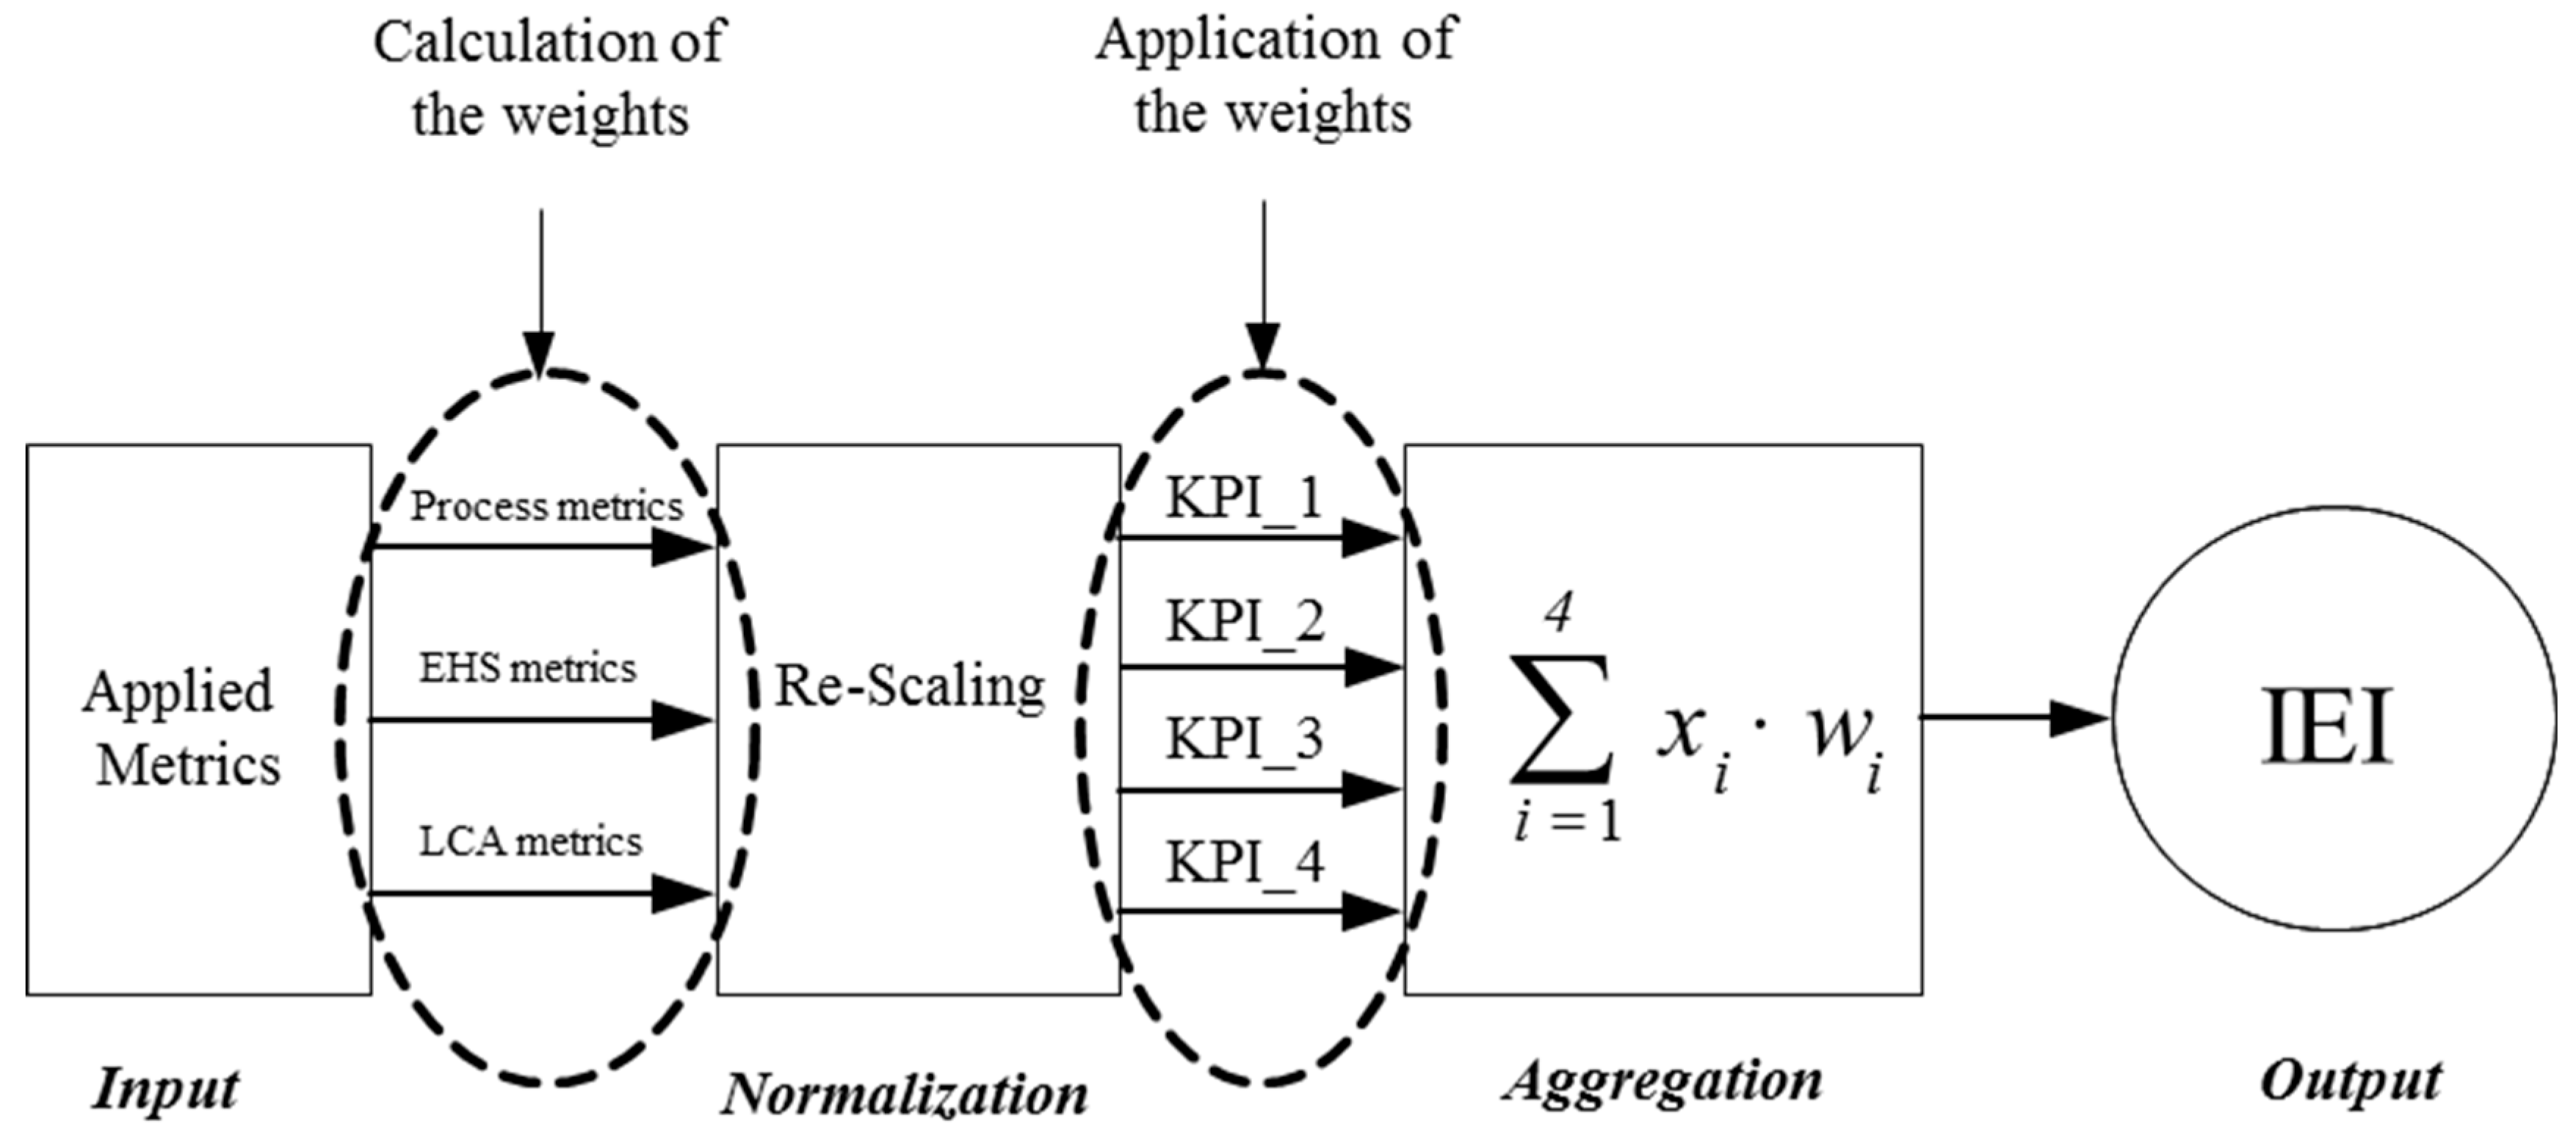
4.1. The Composite Indicator Method as a Means of Metrics Aggregation

A consolidated index may be more practical for decision-makers to use because it summarizes important information in one or a few numbers (i.e., score card). It can also offer a quick indication for a state of constraints that typically operate under different conditions. The general preference for aggregate indices is controversial and often argued as a long-standing methodological problem associated with the use of different indicators with different properties. Essentially, the debate centers on the amount of information that is lost in the simplification made possible by the aggregated index [40]. One of the visible methods related to this work is the application of the composite indicator approach by Saisana and Tarantola [41]. This emerging method was recently used to develop indices such the environmental sustainability index (ESI) by Yale and Columbia Universities and the ecological footprint by the World Wildlife Fund.

4.2. Step-by-Step Approach for the Development of the IEI Index

This section explains the step-by-step approach to develop the IEI index. Figure 3 explains the proposed framework and its components which are divided in four main parts; Input data, Normalization, Aggregation, and Output leading to the index development. First, a theoretical framework was constructed to combine individual indicators into a meaningful composite indicator and to provide a basis for the selection of components and weights. Second, the criteria for setting metrics, which were explained earlier in the paper, were established, focusing on data related to “Process, EHS, and LCA”. The criteria could rely on a number of factors such as policy relevance, simplicity, or availability of data. Third, the data normalization process was carried out. The normalization method took into account the data properties and the objectives of the composite indicator. The commonly used ways of data normalization include re-scaling, ranking, standardization, etc. For the purpose of our research, we utilized the re-scaling approach which uses the range rather than the standard deviation. All normalized indicators had identical range (0, 1). Fourth, weighting, which can be determined in several qualitative or quantitative ways, was performed. The qualitative ways can use public opinion “focus group” sessions, analytical hierarchy process (AHP), etc. The quantitative ways can use regression analysis, principal component analysis, and other techniques. Depending on the future application of this method, we thought the regression analysis would be suitable for our type of research, providing that the collected data were suitable to conduct such an exercise. Fifth, aggregation was conducted through an additive technique which is widely used for this type of data. In the aggregation, “x” stands for the four normalized KPIs (1–4), and “w” represents the weights which were applied to each KPI and then aggregated to form the overall composite IEI indicator “index”.

5. Discussion

A variety of metrics and criteria can be used to assess the sustainability of chemical processes. It is important to choose metrics that suit the process under study without making biased and subjective trade-offs. Figure 4 provides a schematic overview of the various metrics that were discussed in this article.
It is necessary to adopt a holistic approach towards a sustainability assessment, considering the entire life cycle of a product. Also, qualitative and quantitative metrics have to complement each other and be used in a multi-disciplinary approach to avoid overlooking important aspects of a process. The work presented in this article, both in terms of the review of the various metrics and in terms of the development of a conceptual composite indicator, can pave the way for the development of a systematic methodology that can be used to efficiently and rapidly compare several solvent-based processes in terms of their environmental impact. It will allow the collection and aggregation of large environmental datasets and permit an ongoing process of (re)evaluation of green metrics, since they are still conceptually new and under development. This work will, therefore, open the door to more thorough and in-depth research related to environmental impact assessments of industrial processes. Additionally, such a methodology and proposed framework will allow for expedited and environmentally informed decisions in terms of business development and process optimization or up-scaling.

Author Contributions

Methodology, C.F., K.T.; Writing—original draft preparation, C.F.; writing—review and editing C.F., K.T.; supervision, K.T.

Funding

This research received no external funding.

Conflicts of Interest

The authors declare no conflict of interest.

References

  1. Sanford, T.; Frumhoff, P.C.; Luers, A.; Gulledge, J. The climate policy narrative for a dangerously warming world. Nat. Clim. Chang. 2014, 4, 164–166. [Google Scholar] [CrossRef]
  2. Yang, W.; Li, L. Efficiency evaluation of industrial waste gas control in China: A study based on data envelopment analysis (DEA) model. J. Clean. Prod. 2018, 179, 1–11. [Google Scholar] [CrossRef]
  3. Yang, Y.; Yang, W. Does Whistleblowing Work for Air Pollution Control in China? A Study Based on Three-party Evolutionary Game Model under Incomplete Information. Sustainability 2019, 11, 324. [Google Scholar] [CrossRef]
  4. United Nations. The Sustainable Development Goals Report 2018; United Nations: New York, NY, USA, 2018. [Google Scholar]
  5. Lancaster, M. Green Chemistry, an Introductory Text, 2nd ed.; RSC Publishing: Cambridge, UK, 2012. [Google Scholar]
  6. Sheldon, R.A.; Sanders, J.P.M. Toward concise metrics for the production of chemicals from renewable biomass. Catal. Today 2015, 239, 3–6. [Google Scholar] [CrossRef]
  7. Lucato, W.; Santos, J.; Pacchini, A. Measuring the sustainability of a manufacturing process: A conceptual framework. Sustainability 2017, 10, 81. [Google Scholar] [CrossRef]
  8. Curzons, A.D.; Constable, D.C.; Cunningham, V.L. Solvent selection guide: A guide to the integration of environmental, health and safety criteria into the selection of solvents. Clean Prod. Process. 1999, 1, 82–90. [Google Scholar] [CrossRef]
  9. Jiménez-González, C.; Constable, D.J.C.; Ponder, C.S. Evaluating the “Greenness” of chemical processes and products in the pharmaceutical industry—A green metrics primer. Chem. Soc. Rev. 2012, 41, 1485–1498. [Google Scholar] [CrossRef] [PubMed]
  10. McDonough, W.; Braungart, M. Cradle to Cradle: Remaking the Way We Make Things; North Point Press: New York, NY, USA, 2010. [Google Scholar]
  11. Lapkin, A.; Constable, D.J.C. Green Chemistry Metrics: Measuring and Monitoring Sustainable Processes; Blackwell Publishing Ltd.: Hoboken, NJ, USA, 2009; pp. 1–337. [Google Scholar]
  12. Azapagic, A. Developing a framework for sustainable development indicators for the mining and minerals industry. J. Clean. Prod. 2004, 12, 639–662. [Google Scholar] [CrossRef]
  13. Creencia, E.C.; Nillama, J.A.P.; Librando, I.L. Microwave-Assisted Extraction and Physicochemical Evaluation of Oil from Hevea brasiliensis Seeds. Resources 2018, 7, 28. [Google Scholar] [CrossRef]
  14. Gaglio, M.; Tamburini, E.; Lucchesi, F.; Aschonitis, V.; Atti, A.; Castaldelli, G.; Fano, E.A. Life Cycle Assessment of Maize-Germ Oil Production and the Use of Bioenergy to Mitigate Environmental Impacts: A Gate-To-Gate Case Study. Resources 2019, 8, 60. [Google Scholar] [CrossRef]
  15. Constable, D.J.C.; Curzons, A.D.; Freitas dos Santos, L.M.; Geen, G.R.; Kitteringham, J.; Smith, P.; Hannah, R.E.; McGuire, M.A.; Webb, R.L.; Yu, M.; et al. Green chemistry measures for process research and development. Green Chem. 2001, 3, 7–9. [Google Scholar] [CrossRef]
  16. Schmidt-Bleek, F. Material Flows from a Systematical Point of View. Fresenius Environ. Bull. 1993, 2, 413–418. [Google Scholar]
  17. Henderson, R.K.; Jiménez-González, C.; Constable, D.J.C.; Alston, S.R.; Inglis, G.G.A.; Fisher, G.; Sherwood, J.; Binks, S.P.; Curzons, A.D. Expanding GSK’s solvent selection guide—Embedding sustainability into solvent selection starting at medicinal chemistry. Green Chem. 2011, 13, 854–862. [Google Scholar] [CrossRef]
  18. Prat, D.; Pardigon, O.; Flemming, H.-W.; Letestu, S.; Ducandas, V.; Isnard, P.; Guntrum, E.; Senac, T.; Ruisseau, S.; Cruciani, P.; et al. Sanofi’s Solvent Selection Guide: A Step Toward More Sustainable Processes. Org. Process Res. Dev. 2013, 17, 1517–1525. [Google Scholar] [CrossRef]
  19. Jiménez-González, C.; Curzons, A.D.; Constable, D.J.C.; Cunningham, V.L. Expanding GSK’s Solvent Selection Guide—Application of life cycle assessment to enhance solvent selections. Clean Prod. Process. 2004, 7, 42–50. [Google Scholar]
  20. Alfonsi, K.; Colberg, J.; Dunn, P.J.; Fevig, T.; Jennings, S.; Johnson, T.A.; Kleine, H.P.; Knight, C.; Nagy, M.A.; Perry, D.A.; et al. Green chemistry tools to influence a medicinal chemistry and research chemistry based organisation. Green Chem. 2008, 10, 31–36. [Google Scholar] [CrossRef]
  21. Jiménez-González, C.; Ponder, C.S.; Broxterman, Q.; Manley, J. Using the Right Green Yardstick: Why Process Mass Intensity Is Used in the Pharmaceutical Industry to Drive More Sustainable Processes. Org. Process Res. Dev. 2011, 15, 912–917. [Google Scholar] [CrossRef]
  22. Velasco, M.I.; Kinen, C.O.; de Rossi, R.H.; Rossi, L.I. A green alternative to synthetize azo compounds. Dyes Pigment. 2011, 90, 259–264. [Google Scholar] [CrossRef]
  23. Jiménez-González, C.; Curzons, A.D.; Constable, D.J.C.; Overcash, M.R.; Cunningham, V.L. How do you select the “greenest” technology? Development of guidance for the pharmaceutical industry. Clean Prod. Process. 2001, 3, 35–41. [Google Scholar] [CrossRef]
  24. Anastas, P.T.; Warner, J.C. Green Chemistry: Theory and Practice; Oxford University Press: Oxford, UK, 1998. [Google Scholar]
  25. Hurme, M.; Rahman, M. Implementing inherent safety throughout process lifecycle. J. Loss Prev. Process Ind. 2005, 18, 238–244. [Google Scholar] [CrossRef]
  26. Marshall, J.T.; Mundt, A. Dow’s Chemical Exposure Index Guide. Process Saf. Prog. 1995, 14, 163–170. [Google Scholar] [CrossRef]
  27. AIChE. Dow’s Fire and Explosion Index Hazard Classification Guide; John Wiley & Sons Inc.: Hoboken, NJ, USA, 1994. [Google Scholar]
  28. Stoessel, F. What is Your Thermal Risk? Chem. Eng. Prog. 1993, 89, 68–75. [Google Scholar]
  29. Edwards, D.W.; Lawrence, D. Assessing the inherent safety of chemical process routes: Is there a relation between plant costs and inherent safety? Process Saf. Environ. Prot. 1993, 71, 252–258. [Google Scholar]
  30. Heikkila, A.-M.; Hurme, M.; Jarvelainen, M. Safety Considerations in Process Synthesis. Comput. Chem. Eng. 1996, 20, 115–120. [Google Scholar] [CrossRef]
  31. Schaltegger, S.; Burritt, R. Contemporary Environmental Accounting; Greenleaf Publishing: Austin, TX, USA, 2000; pp. 1–463. [Google Scholar]
  32. OECD. Guidance Document for the Development of OECD Guidelines for the Testing of Chemicals; Organisation for Economic Co-operation and Development: Paris, France, 2009; pp. 1–41. [Google Scholar]
  33. Cronin, M.T.D.; Livingstone, D.J. Predicting Chemical Toxicity and Fate; CRC Press: Washington, DC, USA, 2004; pp. 1–441. [Google Scholar]
  34. Herrchen, M.; Klein, W. Use of the life-cycle assessment (LCA) toolbox for an environmental evaluation of production processes. Pure Appl. Chem. 2000, 72, 1247–1252. [Google Scholar] [CrossRef]
  35. Tukker, A. Life Cycle Assessment and the Precautionary Principle. Environ. Sci. Technol. 2000, 36, 70A–75A. [Google Scholar] [CrossRef]
  36. Curzons, A.D.; Jiménez-González, C.; Duncan, A.L.; Constable, D.J.C.; Cunningham, V.L. Fast life cycle assessment of synthetic chemistry (FLASC™) tool. Int. J. Life Cycle. Assess. 2007, 12, 272–280. [Google Scholar] [CrossRef]
  37. Friedrichs, K. Energy Key Performance Indicators: A European Benchmark and Assessment of Meaningful Indicators for the Use of Energy in Large Corporations. Master’s Thesis, Norges Handelshøyskole (NHH), Bergen, Norway, 2013. [Google Scholar]
  38. Defra Environmental Key Performance Indicators: Reporting Guidelines for UK Business; Department for Environment, Food & Rural Affairs: London, UK, 2017; pp. 1–76.
  39. Gensan, E.; Paturi, R. Key Performance Indicators Framework—A Method to Track Business Objectives, Link Business Strategy to Processes and Detail Importance of Key Performance Indicators in Enterprise Business Architecture. In Proceedings of the 15th Americas Conference on Information Systems, San Francisco, CA, USA, 6–9 August 2009; pp. 1–11. [Google Scholar]
  40. Jollands, N.; Lermit, J.; Patterson, M. The Usefulness of Aggregate Indicators in Policy Making and Evaluation: A Discussion with Application to Eco-Efficiency Indicators in New Zealand; The Australian National University: Canberra, Australia, 2003. [Google Scholar]
  41. Saisana, M.; Tarantola, S. State-of-the-Art Report on Current Methodologies and Practices for Composite Indicator Development; European Commission-JRC: Ispra, Italy, 2002. [Google Scholar]
Figure 1. Breakdown of metrics included in the industrial environmental index (IEI).
Resources 08 00115 g001
Figure 2. Life cycle stages and boundaries.
Resources 08 00115 g002
Figure 3. The IEI framework.
Resources 08 00115 g003
Figure 4. Green metrics used to assess the sustainability of solvent-based processes.
Resources 08 00115 g004

