Alkalinity, and Not the Oxidation State of the Organic Substrate, Is the Key Factor in Domestic Wastewater Treatment by Mixed Cultures of Purple Phototrophic Bacteria


 ,
,  ,
,  ,
, 

Abstract
:1. Introduction
2. Materials and Methods
2.1. Source of Wastewater
2.2. Mixed Enrichment Culture of Purple Phototrophic Bacteria
2.3. Experimental Design
2.3.1. Preliminary Tests on the Effect of Alkalinity on Domestic Wastewater Treatment by Purple Phototrophic Bacteria
2.3.2. Effect of Additional Organics with Different Redox State on Domestic Wastewater Treatment by Purple Phototrophic Bacteria
2.4. Analytical Methods
Illumina NGS and DGGE
2.5. Data Handling and Statistical Procedures
3. Results and Discussion
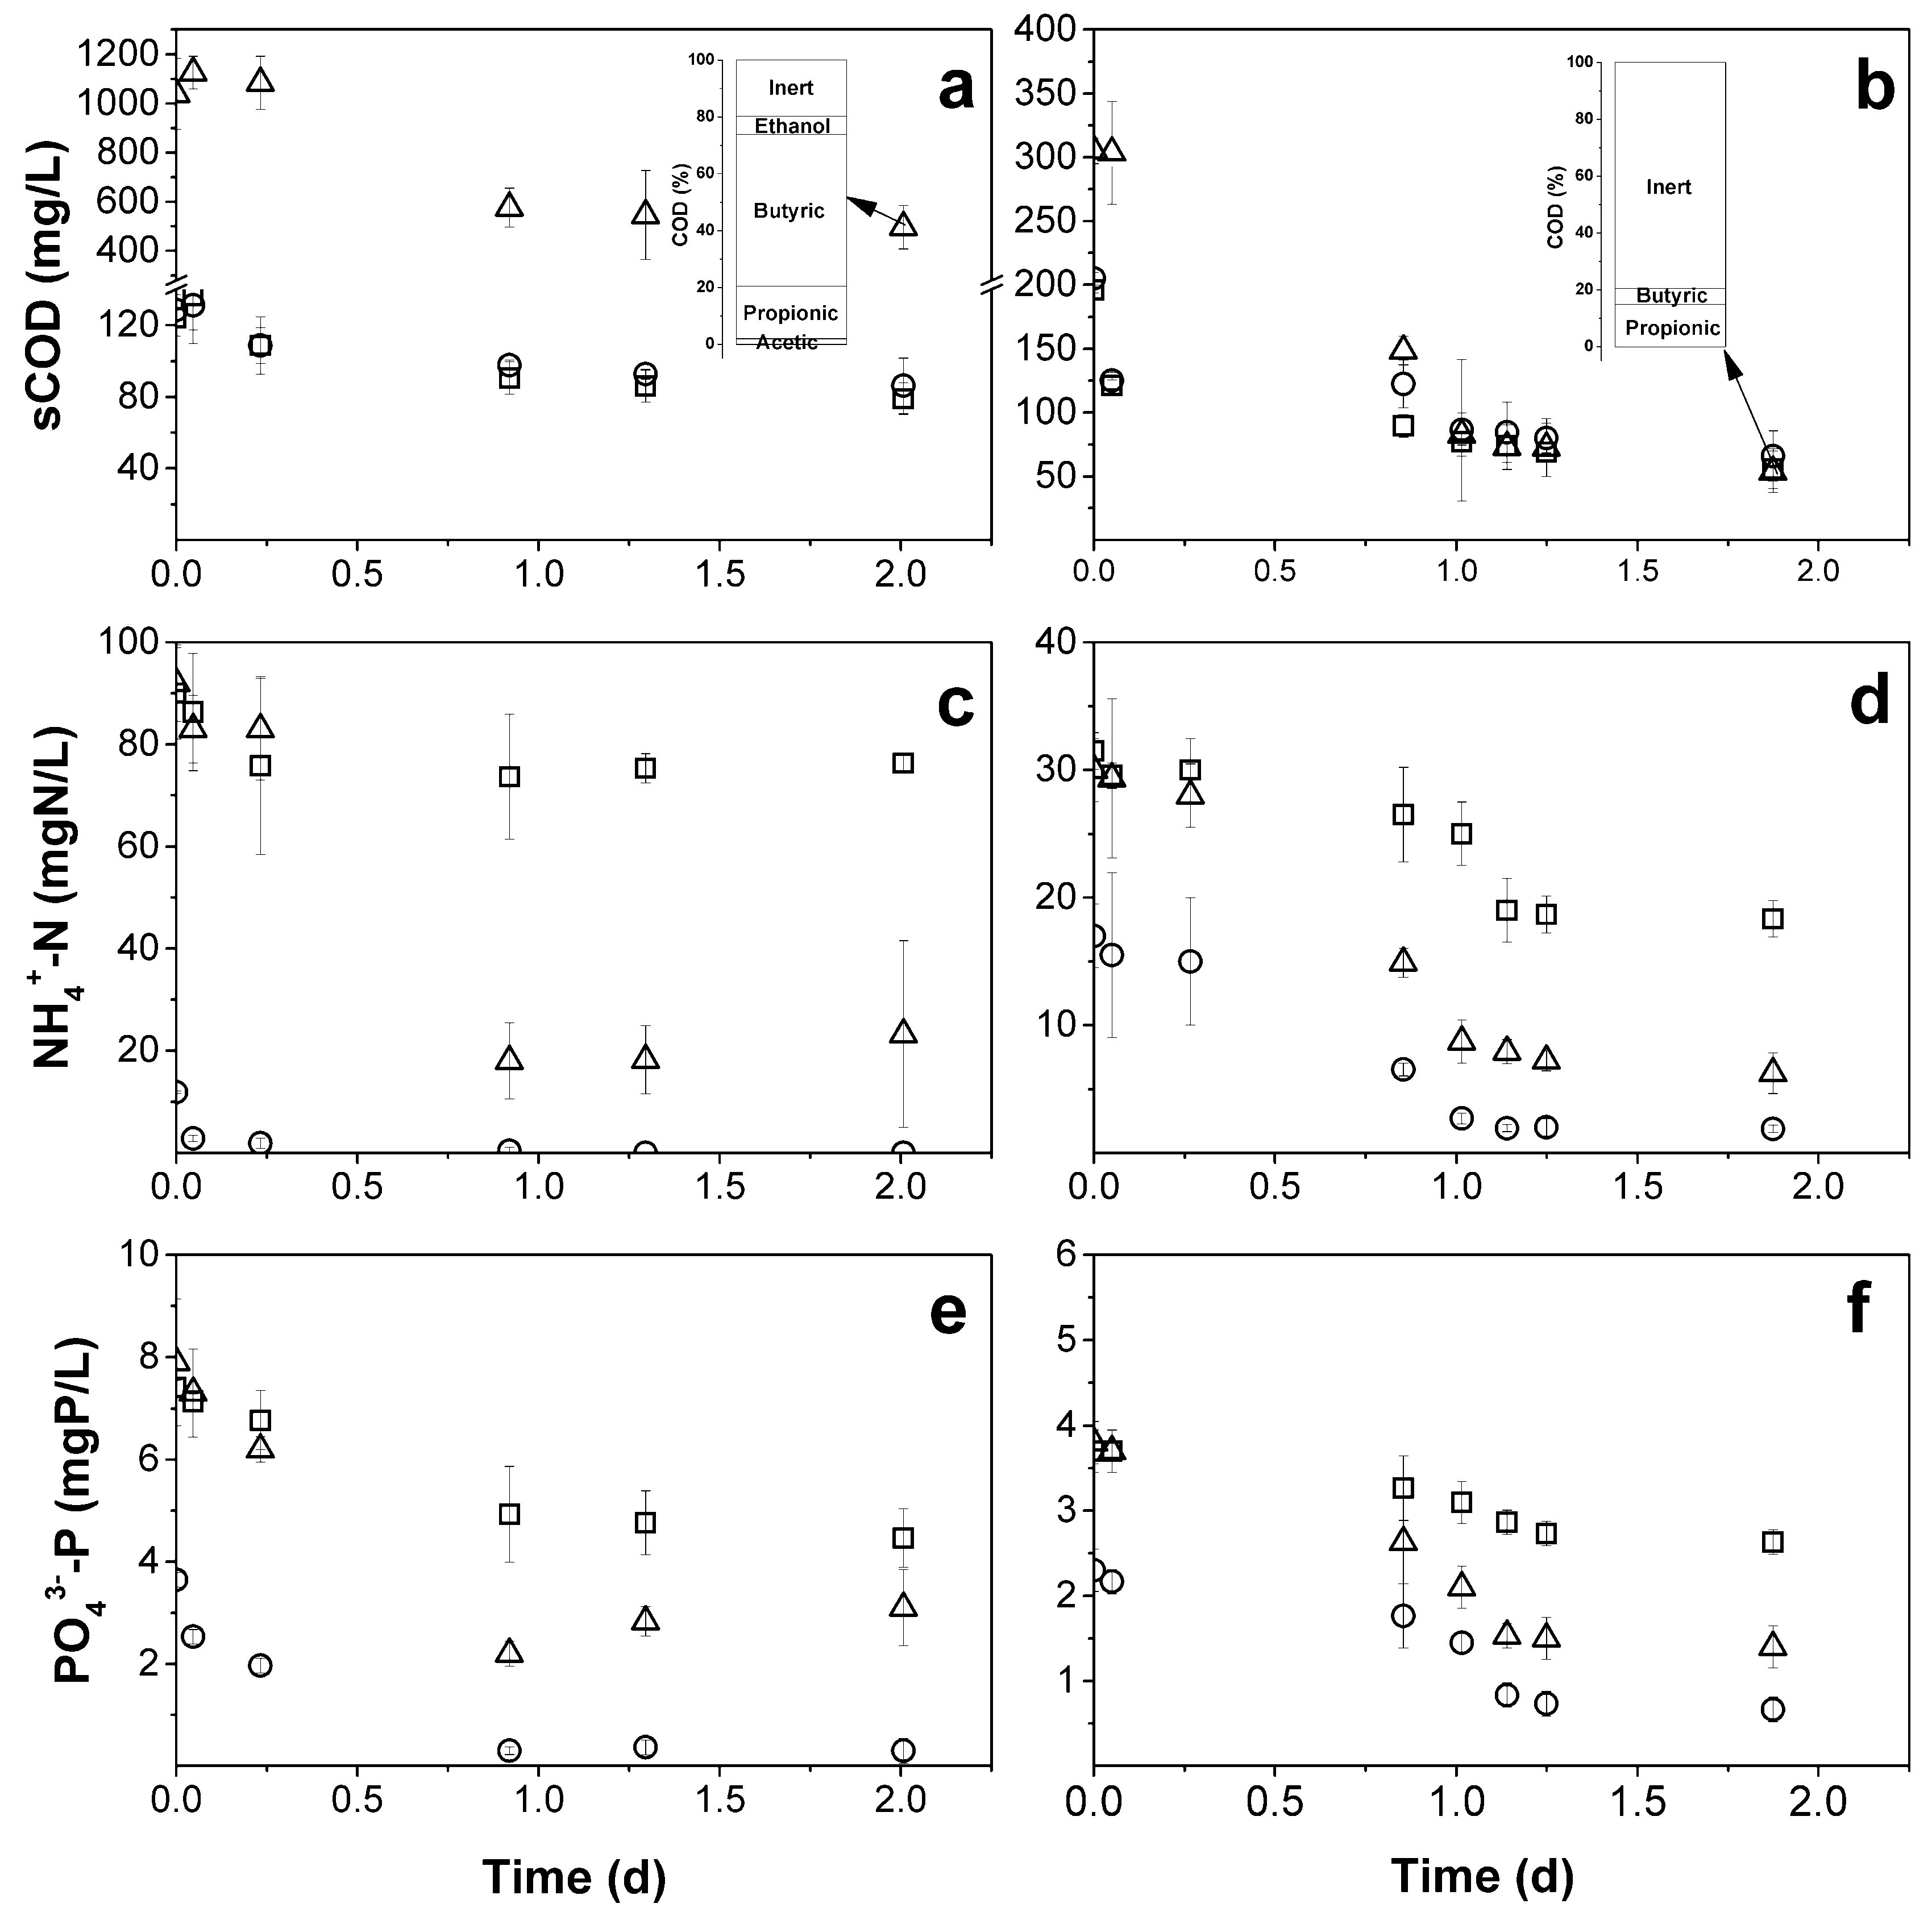
3.1. Preliminary Tests
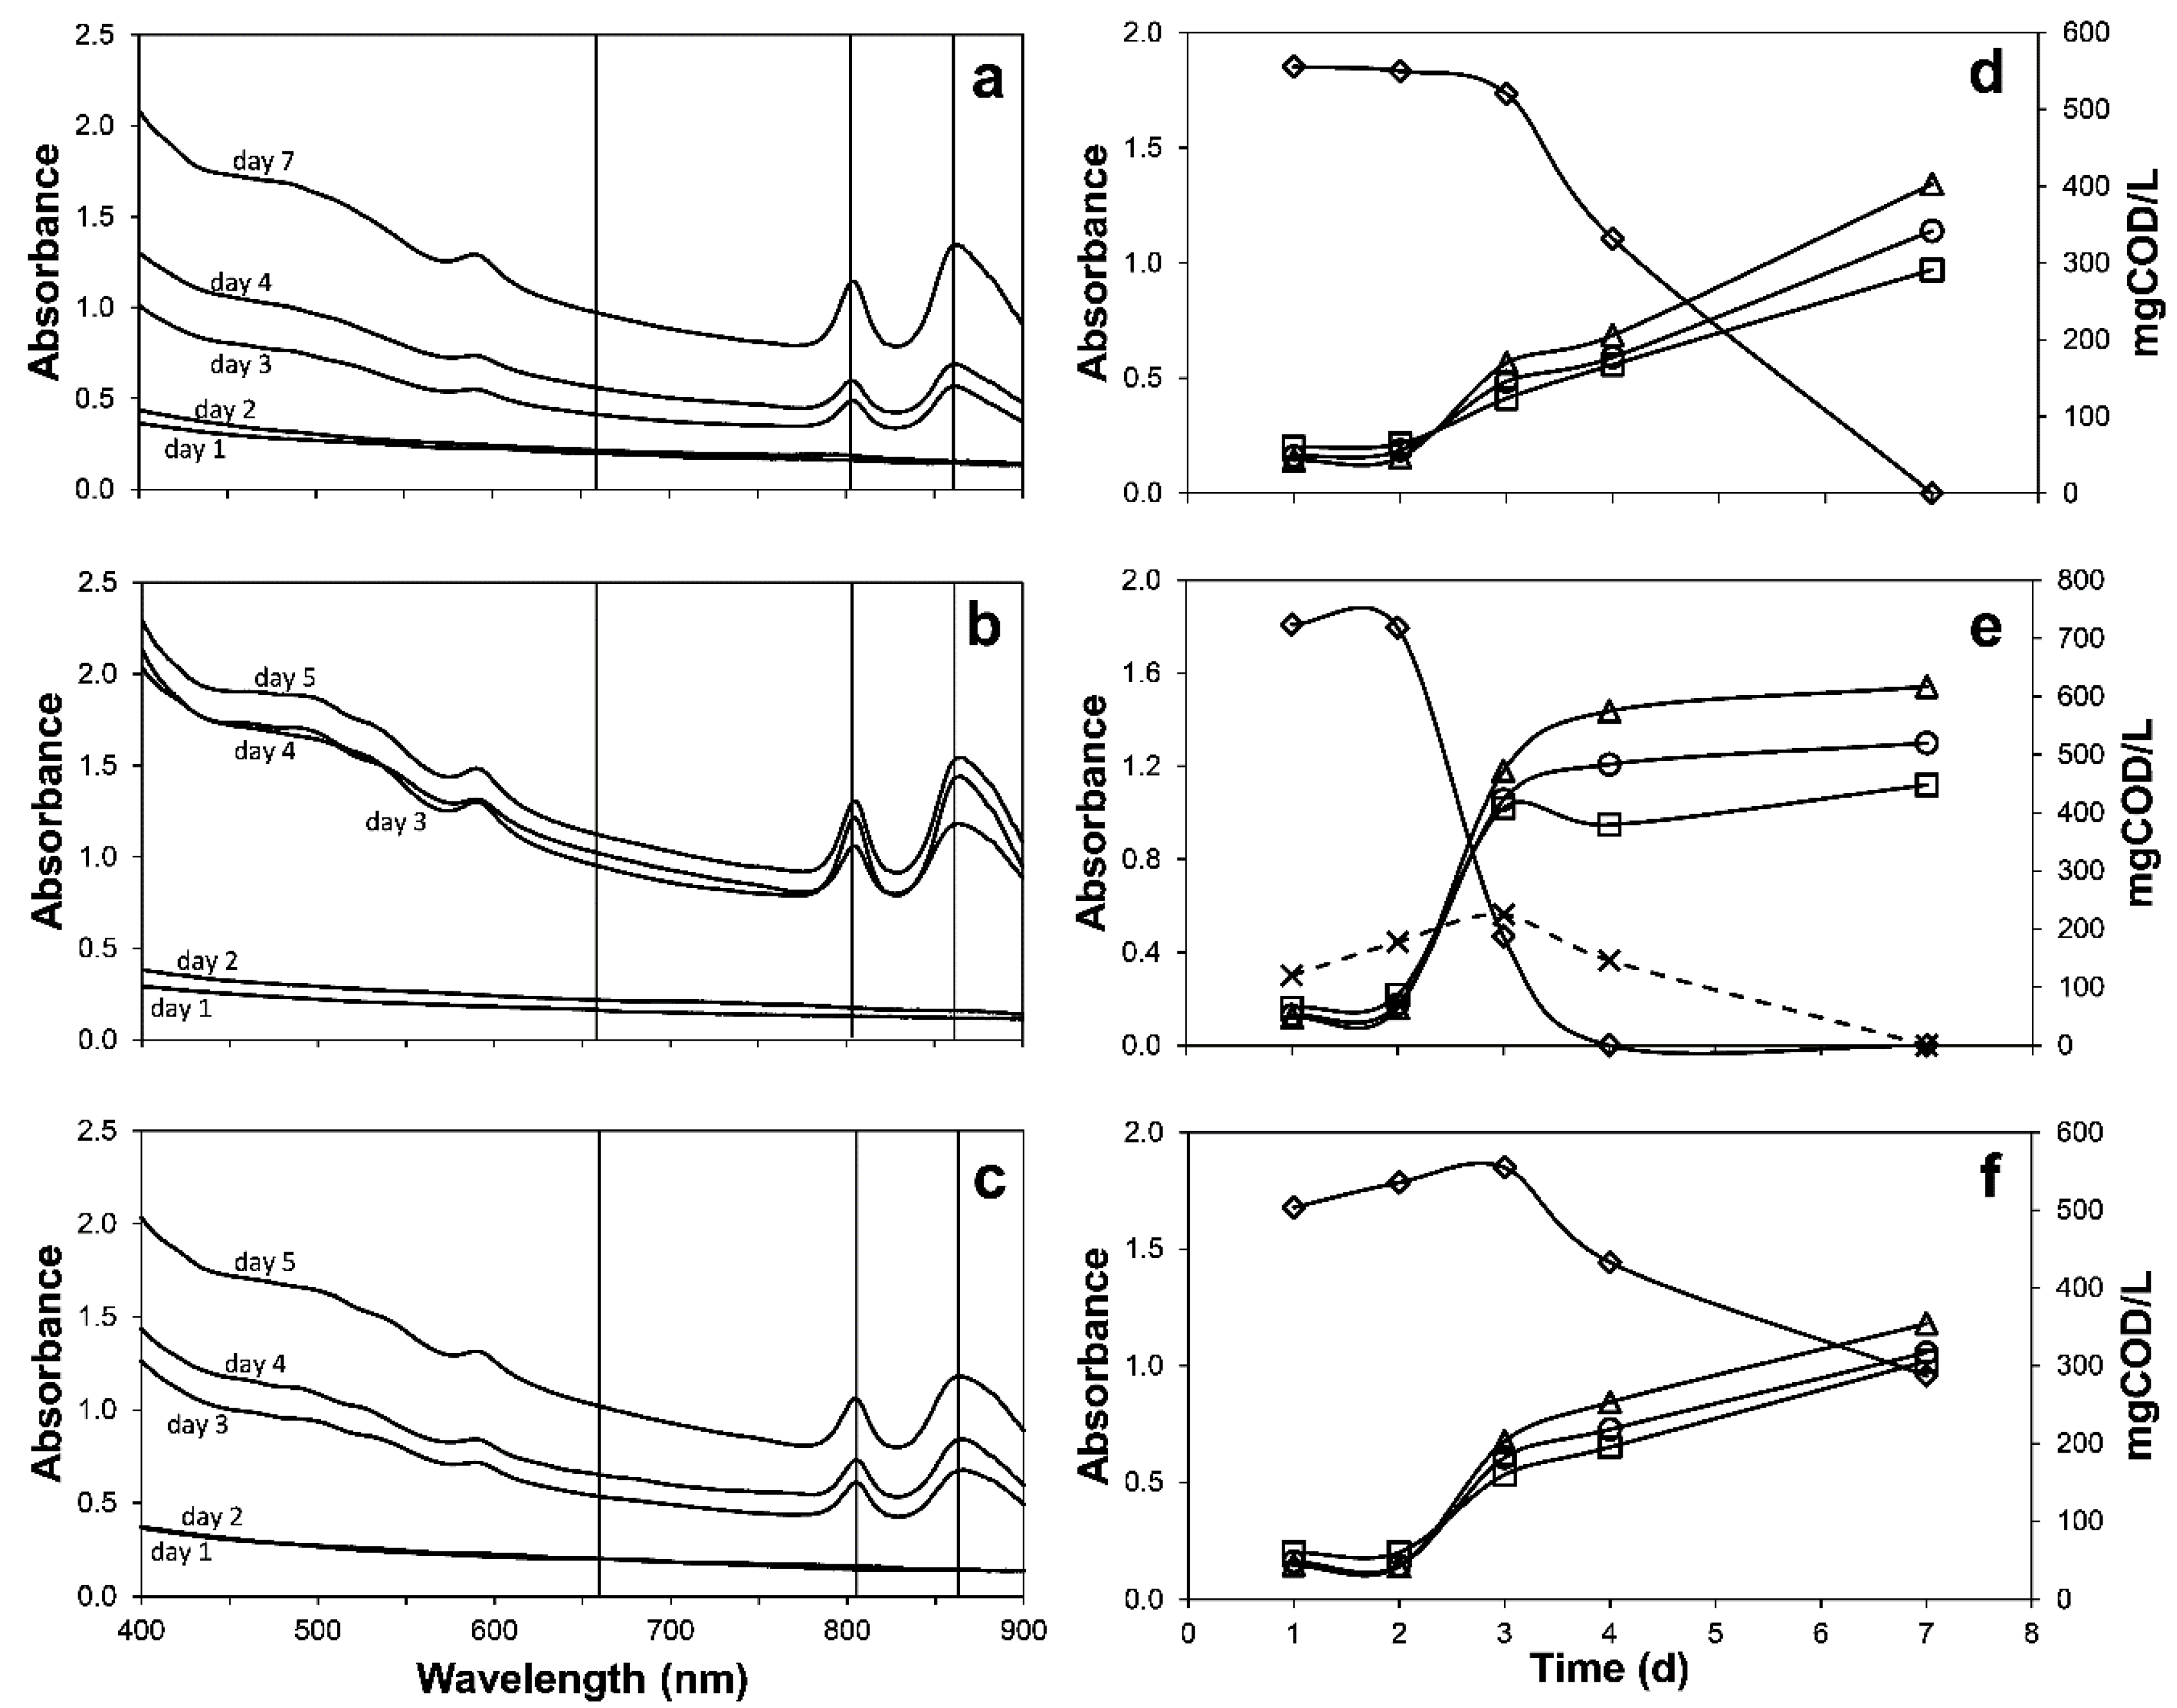
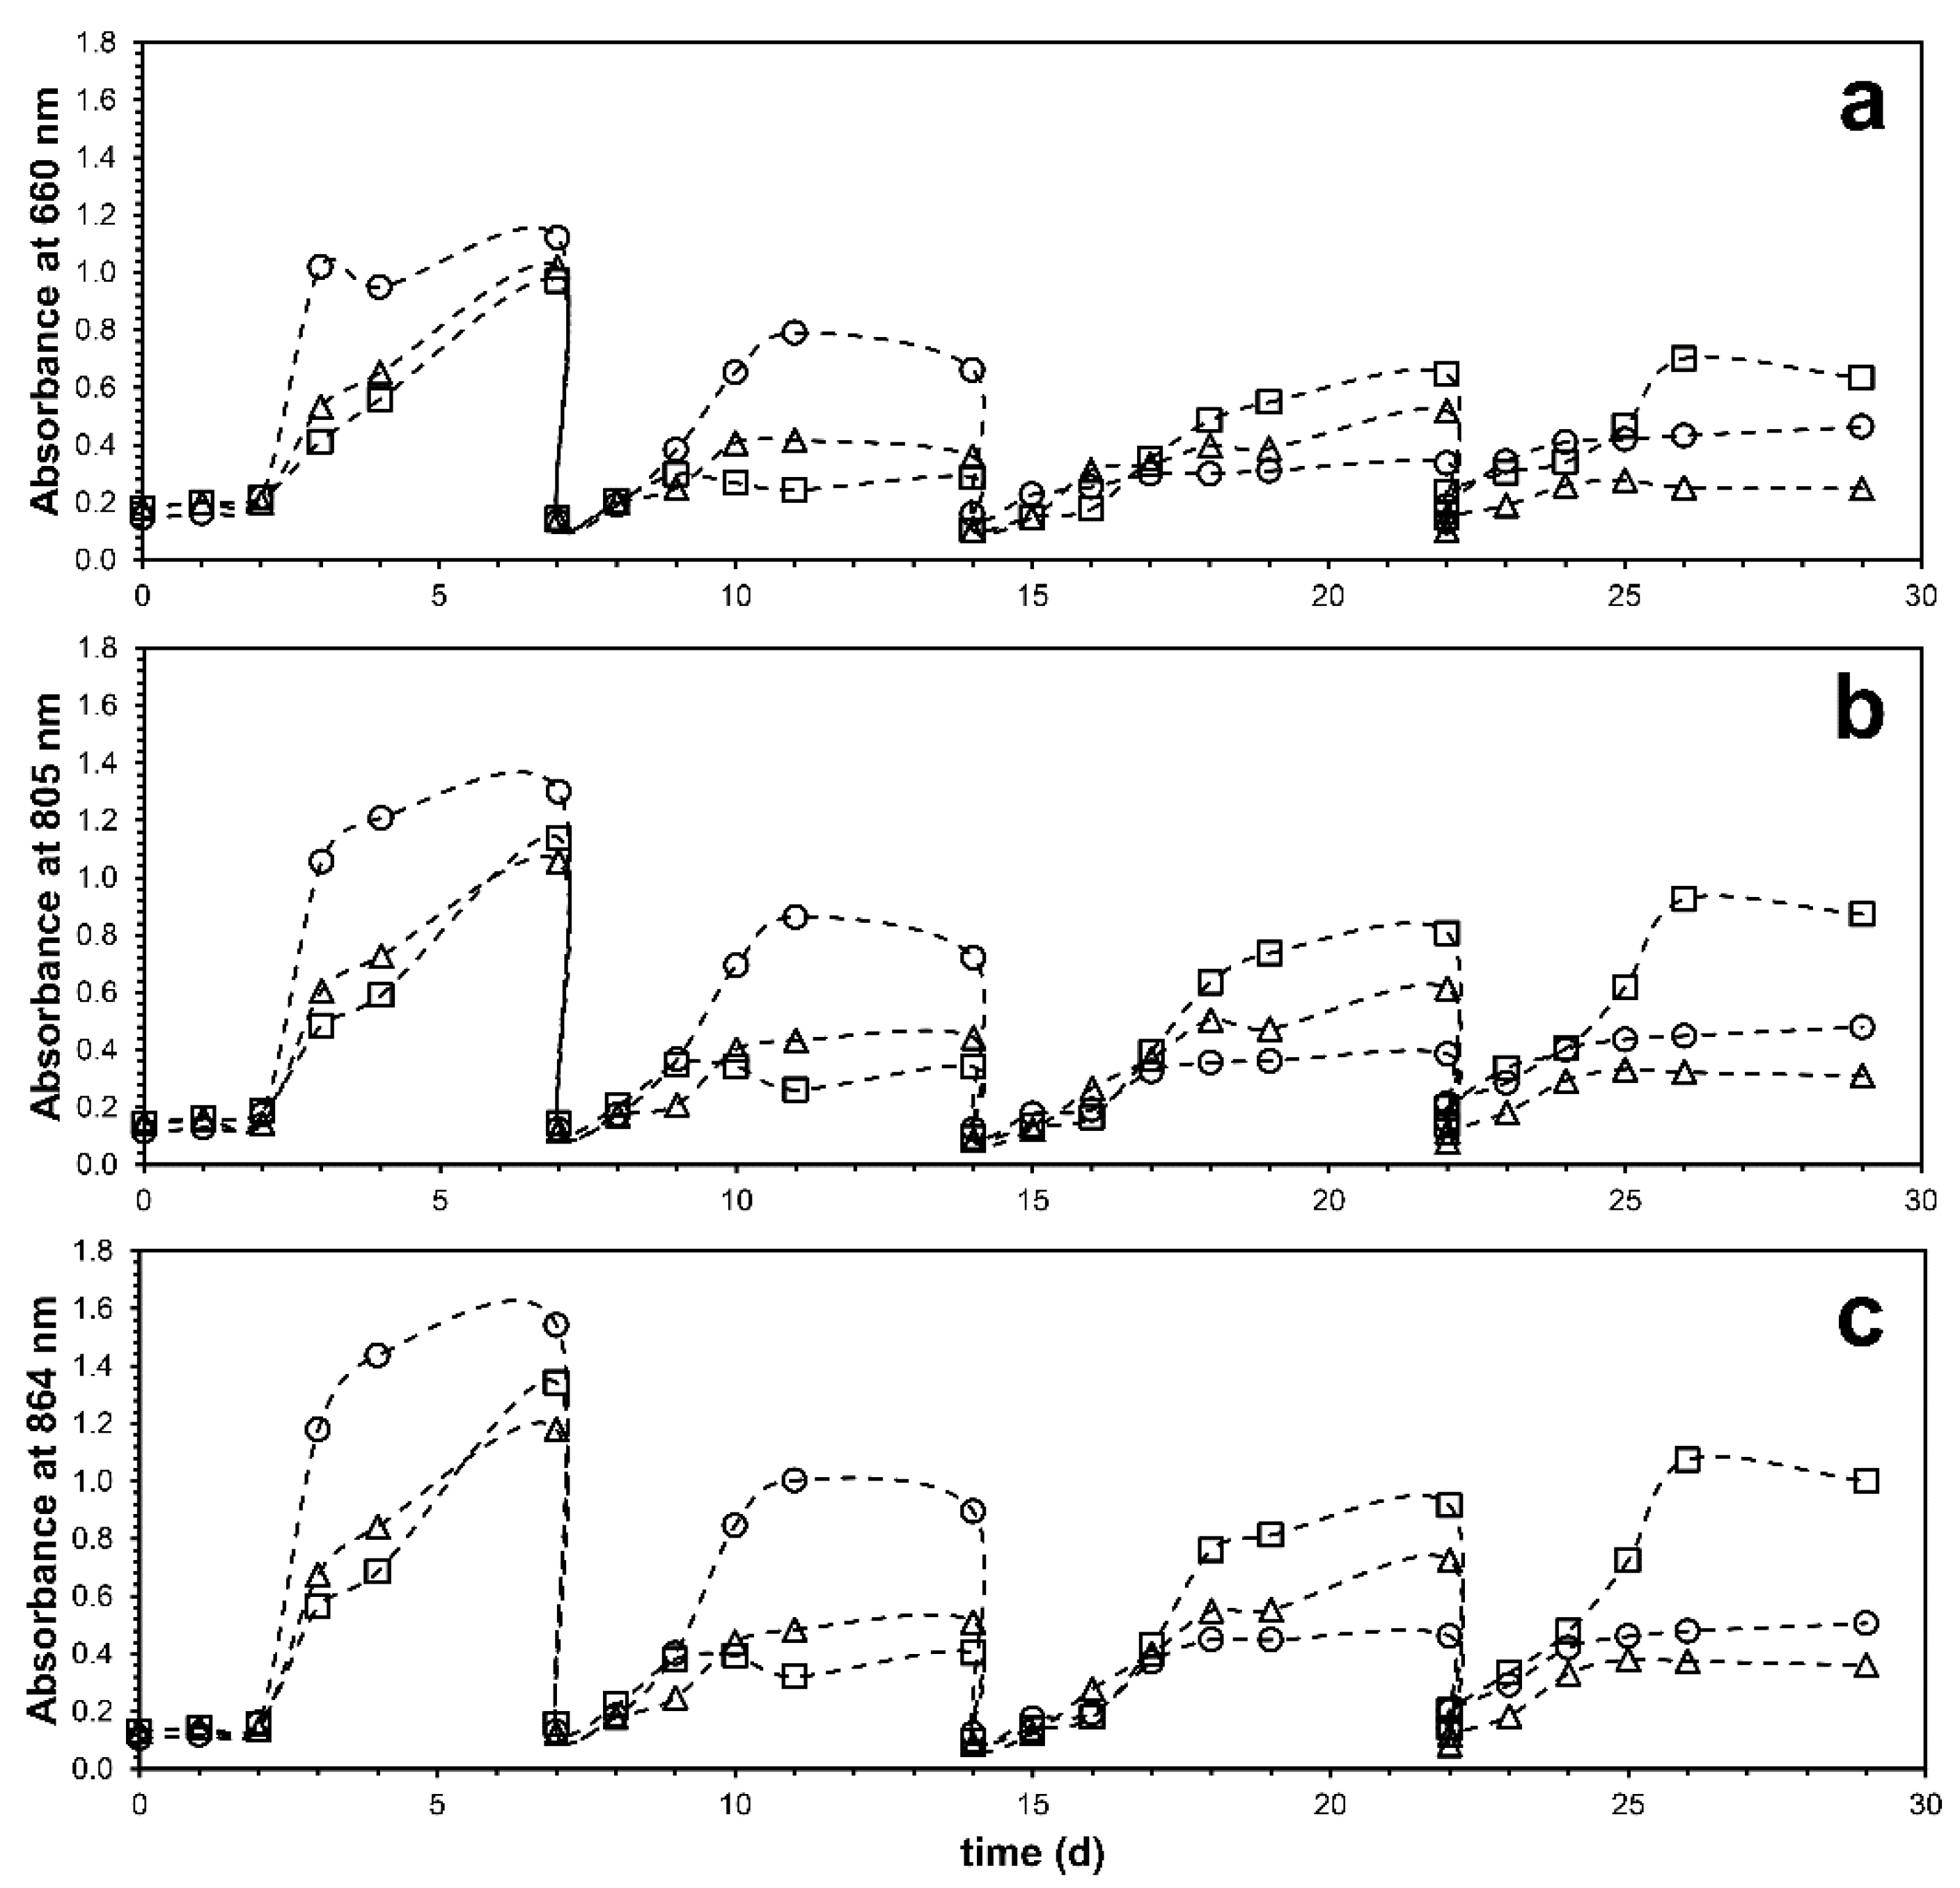
3.2. Process Performance Based on the Oxidation State of the Additional Organic Substrate
3.3. Effect of Organic Susbtrates on Microbial Community Development
4. Conclusions
- -
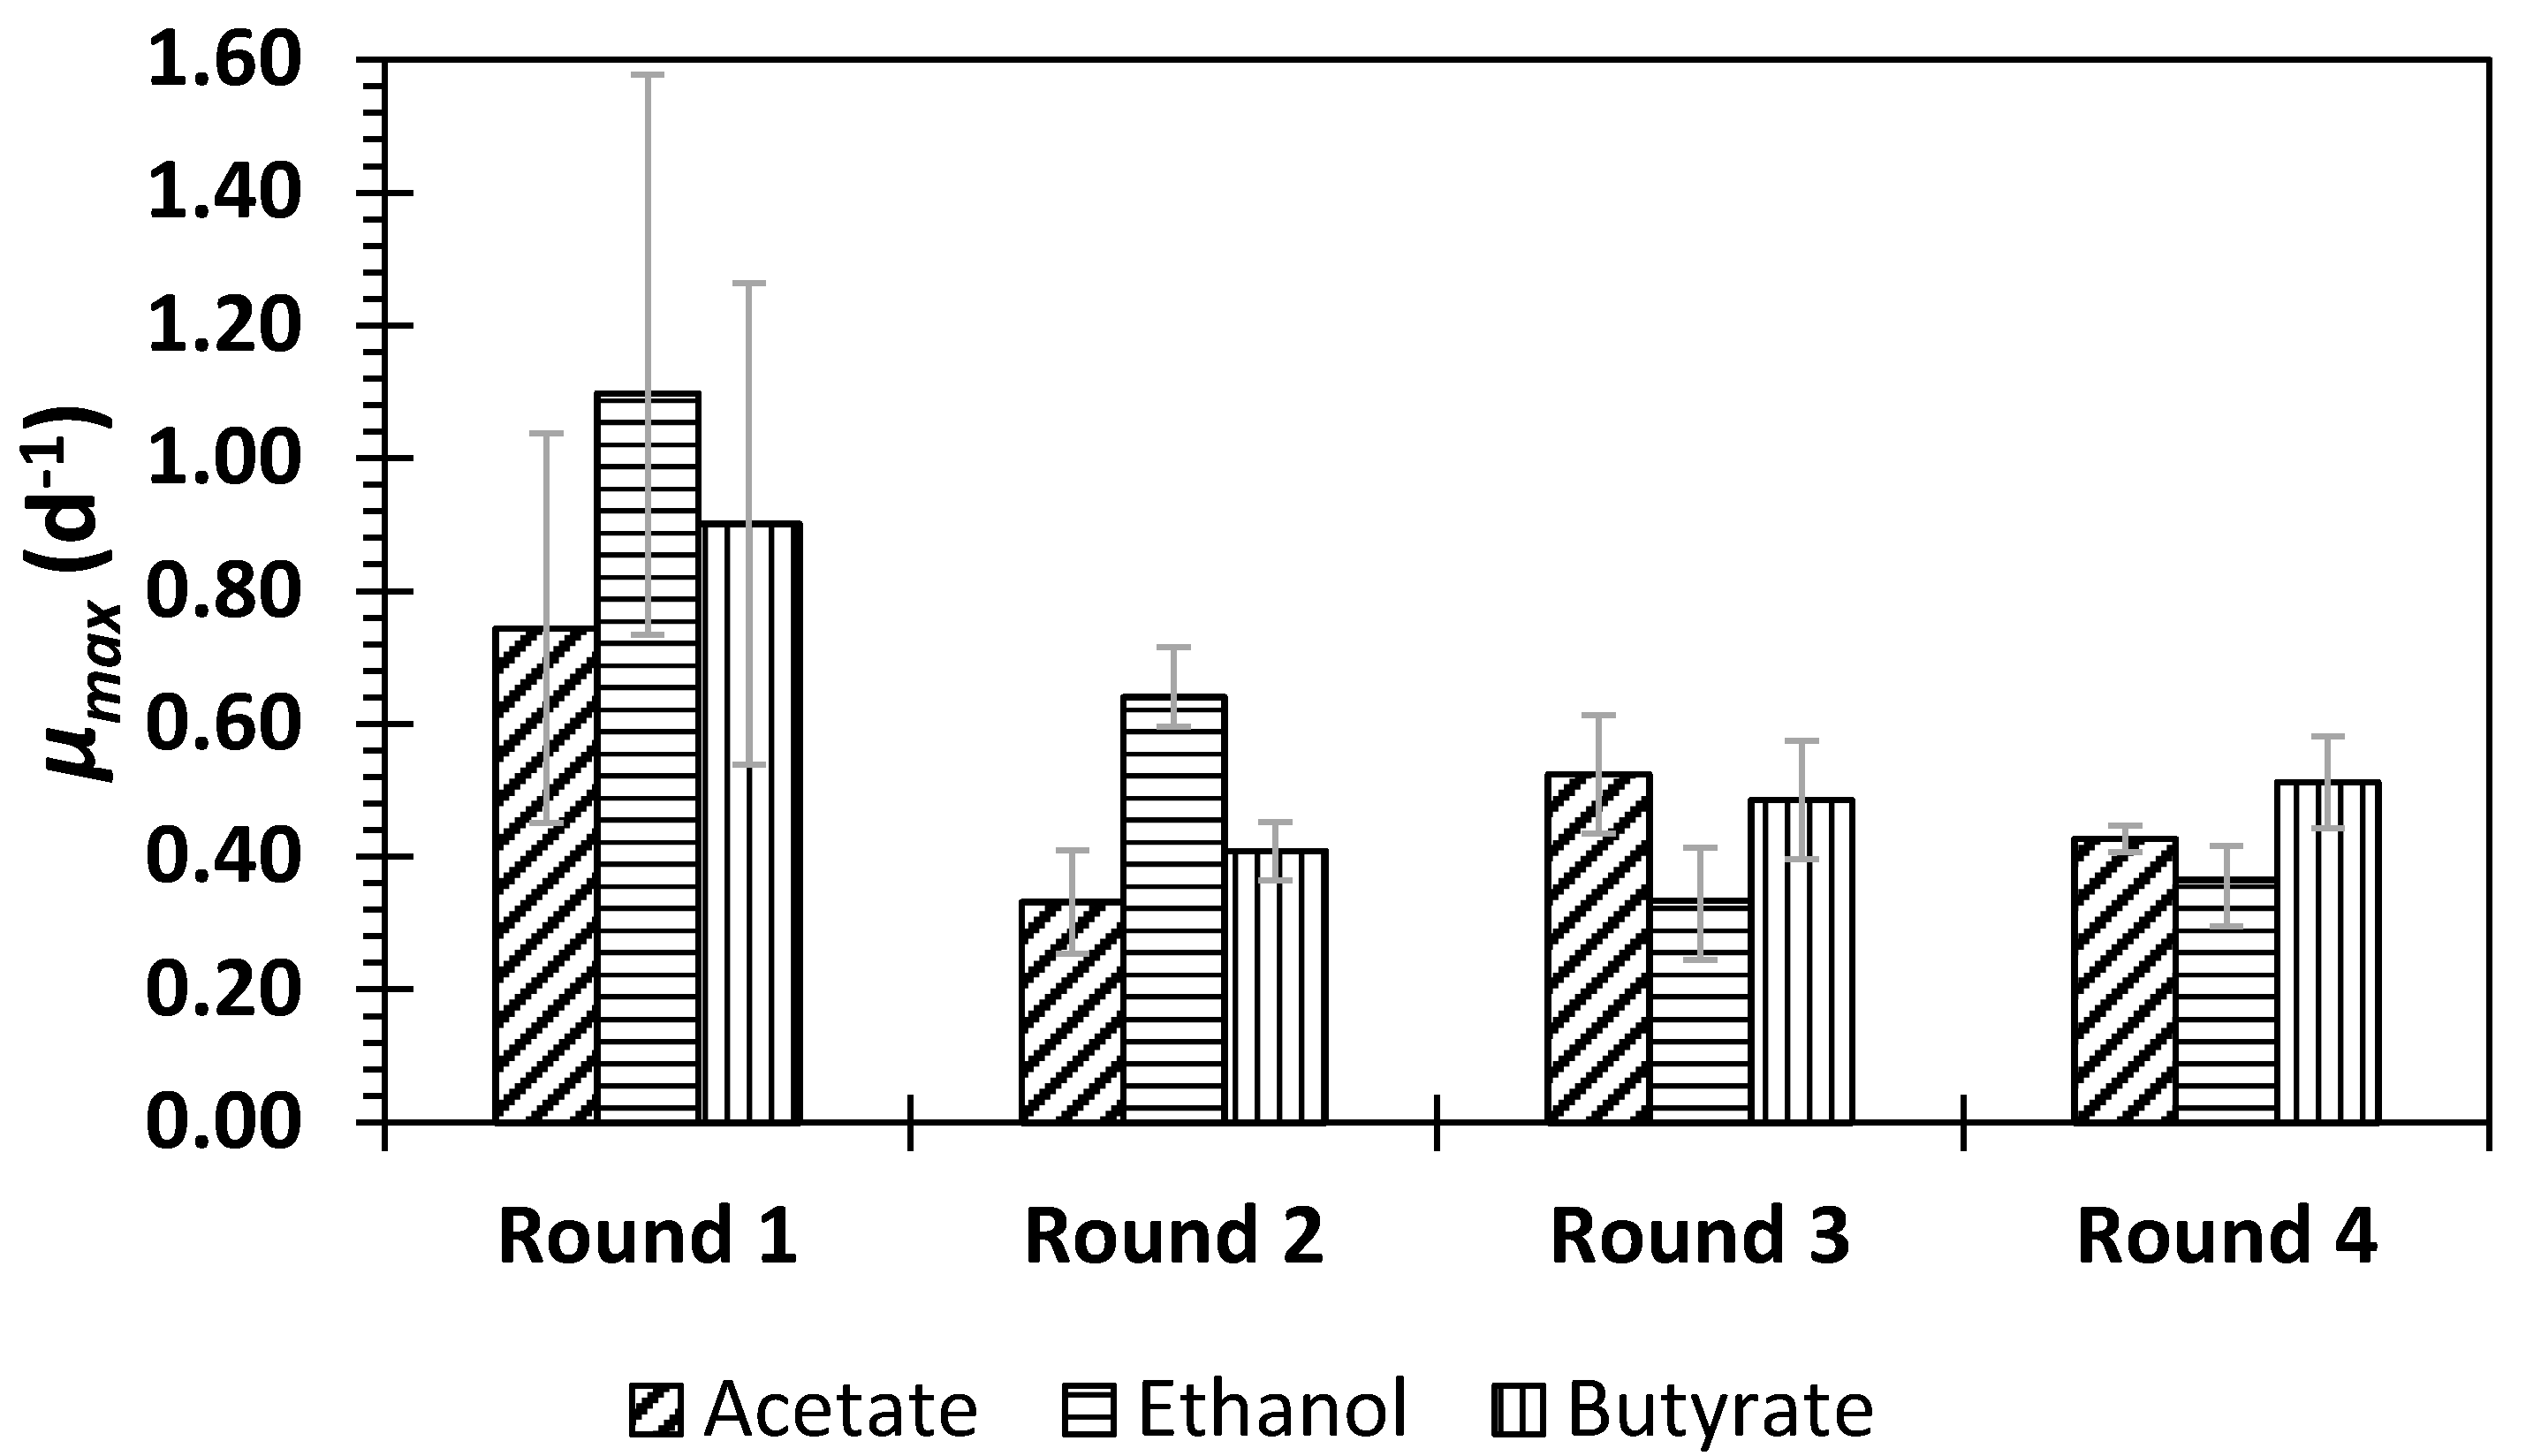
- The similarity of growth parameters (µmax and biomass yield), and the COD, N, and P removal efficiencies strongly suggest that the oxidation state of the external organic carbon source is not an impediment for the development of active PPB biomass in DWW treatment.
- -
- High alkalinity supports the electron dissipation in PPB systems, allowing PPB to grow on reduced organics as butyrate and ethanol. Therefore, alkalinity, and not the oxidation state of the organic substrate, is the key limiting factor for PPB systems in DWW treatment.
- -
- Rhodopseudomonas palustris prevails in reduced organics (butyrate and ethanol), whereas this species and Rhodobacter capsulatus co-dominate wastewater environments in oxidized organics (as acetate).
Author Contributions
Funding
Conflicts of Interest
References
- Batstone, D.; Hülsen, T.; Mehta, C.; Keller, J. Platforms for energy and nutrient recovery from domestic wastewater: A review. Chemosphere 2015, 140, 2–11. [Google Scholar] [CrossRef] [PubMed]
- Madigan, M.T.; Martinko, J.M.; Stahl, D.A.; Clark, D.P. Biology of Microorganisms, 3th ed.; Espinoza, D., Ed.; Pearson: London, UK, 2012; p. 1155. [Google Scholar]
- McKinlay, J.B.; Harwood, C.S. Carbon dioxide fixation as a central redox cofactor recycling mechanism in bacteria. Proc. Natl. Acad. Sci. USA 2010, 107, 11669–11675. [Google Scholar] [CrossRef] [PubMed] [Green Version]
- Adessi, A.; De Philippis, R.J. Photobioreactor design and illumination systems for H2 production with anoxygenic photosynthetic bacteria: A review. Int. J. Hydrogen Energy 2014, 39, 3127–3141. [Google Scholar] [CrossRef]
- Zumft, W.; Castillo, F. Regulatory properties of the nitrogenase fromRhodopseudomonas palustris. Arch. Microbiol. 1978, 117, 53–60. [Google Scholar] [CrossRef]
- Hülsen, T.; Barry, E.M.; Lu, Y.; Puyol, D.; Keller, J.; Batstone, D.J. Domestic wastewater treatment with purple phototrophic bacteria using a novel continuous photo anaerobic membrane bioreactor. Water Res. 2016, 100, 486–495. [Google Scholar] [CrossRef] [Green Version]
- Puyol, D.; Barry, E.; Hülsen, T.; Batstone, D. A mechanistic model for anaerobic phototrophs in domestic wastewater applications: Photo-anaerobic model (PAnM). Water Res. 2017, 116, 241–253. [Google Scholar] [CrossRef] [Green Version]
- Cordell, D.; Rosemarin, A.; Schröder, J.J.; Smit, A.J.C. Towards global phosphorus security: A systems framework for phosphorus recovery and reuse options. Chemosphere 2011, 84, 747–758. [Google Scholar] [CrossRef]
- Puyol, D.; Batstone, D.J.; Hülsen, T.; Astals, S.; Peces, M.; Krömer, J.O. Resource recovery from wastewater by biological technologies: Opportunities, challenges, and prospects. Front. Microbiol. 2017, 7, 2106. [Google Scholar] [CrossRef] [Green Version]
- Larsen, T.A.; Alder, A.C.; Eggen, R.I.L.; Maurer, M.; Lienert, J. Source Separation: Will We See a Paradigm Shift in Wastewater Handling? Environ. Sci. Technol. 2009, 43, 6121–6125. [Google Scholar] [CrossRef] [Green Version]
- Puyol, D.; Hülsen, T.; Padrino, B.; Batstone, D.J.; Martinez, F.; Melero, J.A. Exploring the inhibition boundaries of mixed cultures of purple phototrophic bacteria for wastewater treatment in anaerobic conditions. Water Res. 2020. [Google Scholar] [CrossRef] [PubMed]
- Molina, M.C.; Gonzalez, N.; Bautista, L.F.; Sanz, R.; Simarro, R.; Sanchez, I.; Sanz, J.L. Isolation and genetic identification of PAH degrading bacteria from a microbial consortium. Biodegradation 2009, 20, 789–800. [Google Scholar] [CrossRef]
- Okubo, Y.; Futamata, H.; Hiraishi, A. Characterization of phototrophic purple nonsulfur bacteria forming colored microbial mats in a swine wastewater ditch. Appl. Environ. Microbiol. 2006, 72, 6225–6233. [Google Scholar] [CrossRef] [Green Version]
- de Las Heras, I.; Molina, R.; Segura, Y.; Hülsen, T.; Molina, M.; Gonzalez-Benítez, N.; Melero, J.; Mohedano, A.; Martínez, F.; Puyol, D.J. Contamination of N-poor wastewater with emerging pollutants does not affect the performance of purple phototrophic bacteria and the subsequent resource recovery potential. J. Hazard. Mater. 2020, 385, 121617. [Google Scholar] [CrossRef]
- Oksanen, J. Design Decisions and Implementation Details in Vegan. In Vignette of the Package Vegan. R Package Version; 2016; pp. 2–4. Available online: https://cran.r-project.org/web/packages/vegan/vignettes/decision-vegan.pdf (accessed on 19 July 2020).
- McConville, J.R.; Kvarnström, E.; Jönsson, H.; Kärrman, E.; Johansson, M. Source separation: Challenges & opportunities for transition in the swedish wastewater sector. Resour. Conserv. Recycl. 2017, 120, 144–156. [Google Scholar] [CrossRef]
- Golomysova, A.; Gomelsky, M.; Ivanov, P.S. Flux balance analysis of photoheterotrophic growth of purple nonsulfur bacteria relevant to biohydrogen production. Int. J. Hydrogen Energy 2010, 35, 12751–12760. [Google Scholar] [CrossRef]
- Papagiannakis, E.; Kennis, J.T.M.; van Stokkum, I.H.M.; Cogdell, R.J.; van Grondelle, R. An alternative carotenoid-to-bacteriochlorophyll energy transfer pathway in photosynthetic light harvesting. Proc. Natl. Acad. Sci. USA 2002, 99, 6017–6022. [Google Scholar] [CrossRef] [PubMed] [Green Version]
- Liang, C.M.; Hung, C.H.; Hsu, S.C.; Yeh, I.C. Purple nonsulfur bacteria diversity in activated sludge and its potential phosphorus-accumulating ability under different cultivation conditions. Appl. Microbiol. Biotechnol. 2010, 86, 709–719. [Google Scholar] [CrossRef] [PubMed]
- Hunter, C.N.; Daldal, F.; Thurnauer, M.C.; Beatty, J.T. The Purple Phototrophic Bacteria; Springer Science & Business Media: Berlin, Germany, 2008; Volume 28. [Google Scholar]
- Puyol, D.; Carvajal-Arroyo, J.; Garcia, B.; Sierra-Alvarez, R.; Field, J.A. Kinetic characterization of Brocadia spp.-dominated anammox cultures. Bioresour. Technol. 2013, 139, 94–100. [Google Scholar] [CrossRef] [PubMed]
- Hülsen, T.; Batstone, D.J.; Keller, J.J. Phototrophic bacteria for nutrient recovery from domestic wastewater. Water Res. 2014, 50, 18–26. [Google Scholar] [CrossRef] [PubMed]
- Capson-Tojo, G.; Batstone, D.J.; Grassino, M.; Vlaeminck, S.E.; Puyol, D.; Verstraete, W.; Kleerebezem, R.; Oehmen, A.; Ghimire, A.; Pikaar, I.J. Purple phototrophic bacteria for resource recovery: Challenges and opportunities. Biotechnol. Adv. 2020. [Google Scholar] [CrossRef] [PubMed]
- Alloul, A.; Wuyts, S.; Lebeer, S.; Vlaeminck, S.E. Volatile fatty acids impacting phototrophic growth kinetics of purple bacteria: Paving the way for protein production on fermented wastewater. Water Res. 2019, 152, 138–147. [Google Scholar] [CrossRef]
- Sepúlveda-Muñoz, C.A.; de Godos, I.; Puyol, D.; Muñoz, R. A systematic optimization of piggery wastewater treatment with purple phototrophic bacteria. Chemosphere 2020, 253, 126621. [Google Scholar] [CrossRef]
- González-Benítez, N.; Molina, M.; Arrayás, M.J. Empirical evidence and mathematical modelling of carbamazepine degradative kinetics by a wood-rotting microbial consortium. Waste Biomass Valori. 2020. [Google Scholar] [CrossRef]
- Chae, K.-J.; Choi, M.-J.; Lee, J.-W.; Kim, K.-Y.; Kim, I.S. Effect of different substrates on the performance, bacterial diversity, and bacterial viability in microbial fuel cells. Bioresour. Technol. 2009, 100, 3518–3525. [Google Scholar] [CrossRef]
- Liu, Y.; Hallenbeck, P.C. A kinetic study of hydrogen production by a Calvin-Benson-Bassham cycle mutant, PRK (phosphoribulose kinase), of the photosynthetic bacterium Rhodobacter capsulatus. Int. J. Hydrogen Energy 2016, 41, 11081–11089. [Google Scholar] [CrossRef]
- Laguna, R.; Tabita, F.R.; Alber, B.E. Acetate-dependent photoheterotrophic growth and the differential requirement for the Calvin–Benson–Bassham reductive pentose phosphate cycle in Rhodobacter sphaeroides and Rhodopseudomonas palustris. Arch. Microbiol. 2011, 193, 151–154. [Google Scholar] [CrossRef]


| TCOD * | SCOD | TSS * | VSS * | NH4+-N | PO43−-P | |
|---|---|---|---|---|---|---|
| DWW-1 | ||||||
| Control | 363 | 197 ± 2 | 250 | 245 | 32 ± 1 | 3.7 ± 0.2 |
| (1) Nutrients removed | 372 | 205 ± 5 | 240 | 200 | 17 ± 2 | 2.3 ± 0.2 |
| (2) Substrate added | 495 | 305 ± 10 | 260 | 230 | 30 ± 2 | 3.8 ± 0.2 |
| DWW-2 | ||||||
| Control | 472 | 124 ± 10 | 221 | 195 | 88 ± 9 | 7.4 ± 0.1 |
| (1) Nutrients removed | 410 | 128 ± 9 | 160 | 142 | 11.9 ± 0.2 | 3.7 ± 0.1 |
| (2) Substrate added | 1701 | 1039 ± 144 | 261 | 235 | 92 ± 8 | 7.9 ± 0.1 |
| Reactor/Round | COD/N/P Uptake Ratio | Observed Biomass Yield (mgVSS/mgSCOD) |
|---|---|---|
| R1—Acetate Feed | ||
| Round 1 | 100/6.49/0.57 | 0.61 |
| Round 2 | 100/8.07/1.28 | 0.34 |
| Round 3 | 100/9.78/0.64 | 0.61 |
| Round 4 | 100/6.63/0.61 | 0.97 |
| R2—Ethanol Feed | ||
| Round 1 | 100/4.60/0.43 | 0.88 |
| Round 2 | 100/8.57/1.59 | 0.78 |
| Round 3 | 100/8.07/0.68 | 0.39 |
| Round 4 | 100/6.69/0.84 | 0.53 |
| R3—Butyrate Feed | ||
| Round 1 | 100/5.73/0.46 | 0.81 |
| Round 2 | 100/10.56/2.19 | 0.75 |
| Round 3 | 100/7.33/0.87 | 0.61 |
| Round 4 | 100/9.45/1.01 | 0.74 |
| Source of Variance on µmax | SS * | df | MS | F | p-Value | F Crit |
|---|---|---|---|---|---|---|
| Substrate | 0.022 | 2 | 0.011 | 0.532 | 0.613 | 5.143 |
| Round # | 0.491 | 3 | 0.164 | 7.934 | 0.016 | 4.757 |
| Error | 0.124 | 6 | 0.021 | |||
| Total | 0.637 | 11 | ||||
| Source of Variance on COD/N | SS | df | MS | F | p-Value | F Crit |
| Substrate | 3.333 | 2 | 1.666 | 0.972 | 0.431 | 5.143 |
| Round # | 20.179 | 3 | 6.726 | 3.925 | 0.073 | 4.757 |
| Error | 10.283 | 6 | 1.714 | |||
| Total | 33.794 | 11 | ||||
| Source of variance on COD/P | SS | df | MS | F | p-Value | F Crit |
| Substrate | 0.267 | 2 | 0.134 | 2.841 | 0.136 | 5.143 |
| Round # | 2.469 | 3 | 0.823 | 17.499 | 0.002 | 4.757 |
| Error | 0.282 | 6 | 0.047 | |||
| Total | 3.018 | 11 | ||||
| Source of Variance on YX/S | SS | df | MS | F | p-Value | F Crit |
| Substrate | 0.059 | 2 | 0.030 | 0.252 | 0.785 | 5.143 |
| Round # | 0.276 | 3 | 0.092 | 0.778 | 0.548 | 4.757 |
| Error | 0.709 | 6 | 0.118 | |||
| Total | 1.045 | 11 |
| Sample Name | Shannon-Wiener | Simpson’s Diversity | Species Richness | Pielou Index (J’) |
|---|---|---|---|---|
| Initial | 3.83 | 28.84 | 188.00 | 0.51 |
| T1acetate | 3.99 | 11.22 | 219.00 | 0.51 |
| T1ethanol | 1.65 | 3.00 | 42.00 | 0.29 |
| T1butyrate | 1.27 | 2.42 | 33.00 | 0.25 |
| T4acetate | 1.44 | 2.74 | 41.00 | 0.27 |
| T4ethanol | 0.97 | 1.57 | 31.00 | 0.20 |
| T4butyrate | 1.65 | 2.20 | 58.00 | 0.28 |
© 2020 by the authors. Licensee MDPI, Basel, Switzerland. This article is an open access article distributed under the terms and conditions of the Creative Commons Attribution (CC BY) license (http://creativecommons.org/licenses/by/4.0/).
Share and Cite
Nairn, C.; Rodríguez, I.; Segura, Y.; Molina, R.; González-Benítez, N.; Molina, M.C.; Simarro, R.; Melero, J.A.; Martínez, F.; Puyol, D. Alkalinity, and Not the Oxidation State of the Organic Substrate, Is the Key Factor in Domestic Wastewater Treatment by Mixed Cultures of Purple Phototrophic Bacteria. Resources 2020, 9, 88. https://doi.org/10.3390/resources9070088
Nairn C, Rodríguez I, Segura Y, Molina R, González-Benítez N, Molina MC, Simarro R, Melero JA, Martínez F, Puyol D. Alkalinity, and Not the Oxidation State of the Organic Substrate, Is the Key Factor in Domestic Wastewater Treatment by Mixed Cultures of Purple Phototrophic Bacteria. Resources. 2020; 9(7):88. https://doi.org/10.3390/resources9070088
Chicago/Turabian StyleNairn, Carol, Iván Rodríguez, Yolanda Segura, Raúl Molina, Natalia González-Benítez, Mari Carmen Molina, Raquel Simarro, Juan Antonio Melero, Fernando Martínez, and Daniel Puyol. 2020. "Alkalinity, and Not the Oxidation State of the Organic Substrate, Is the Key Factor in Domestic Wastewater Treatment by Mixed Cultures of Purple Phototrophic Bacteria" Resources 9, no. 7: 88. https://doi.org/10.3390/resources9070088
APA StyleNairn, C., Rodríguez, I., Segura, Y., Molina, R., González-Benítez, N., Molina, M. C., Simarro, R., Melero, J. A., Martínez, F., & Puyol, D. (2020). Alkalinity, and Not the Oxidation State of the Organic Substrate, Is the Key Factor in Domestic Wastewater Treatment by Mixed Cultures of Purple Phototrophic Bacteria. Resources, 9(7), 88. https://doi.org/10.3390/resources9070088