

Diagnostic Biomarkers for Gestational Diabetes Mellitus Using Spectroscopy Techniques: A Systematic Review

Abstract
:1. Introduction
2. Materials and Methods
2.1. Focused Question
2.2. Selection Criteria
- Study design: Case–control and cohort studies from the journal articles were included.
- Participants: Including subjects with measures of GDM and/or controls. Studies included participants of age 18 years or above. Definition of GDM was based on WHO criteria or diagnosis by an obstetrician or endocrinologist based on IADPSG criteria.
- Language: Articles published only in English language.
2.3. Search Strategy
2.4. Screening Methods and Data Abstraction
2.5. Study Selection
2.6. Methodological Study Quality Assessment
3. Results
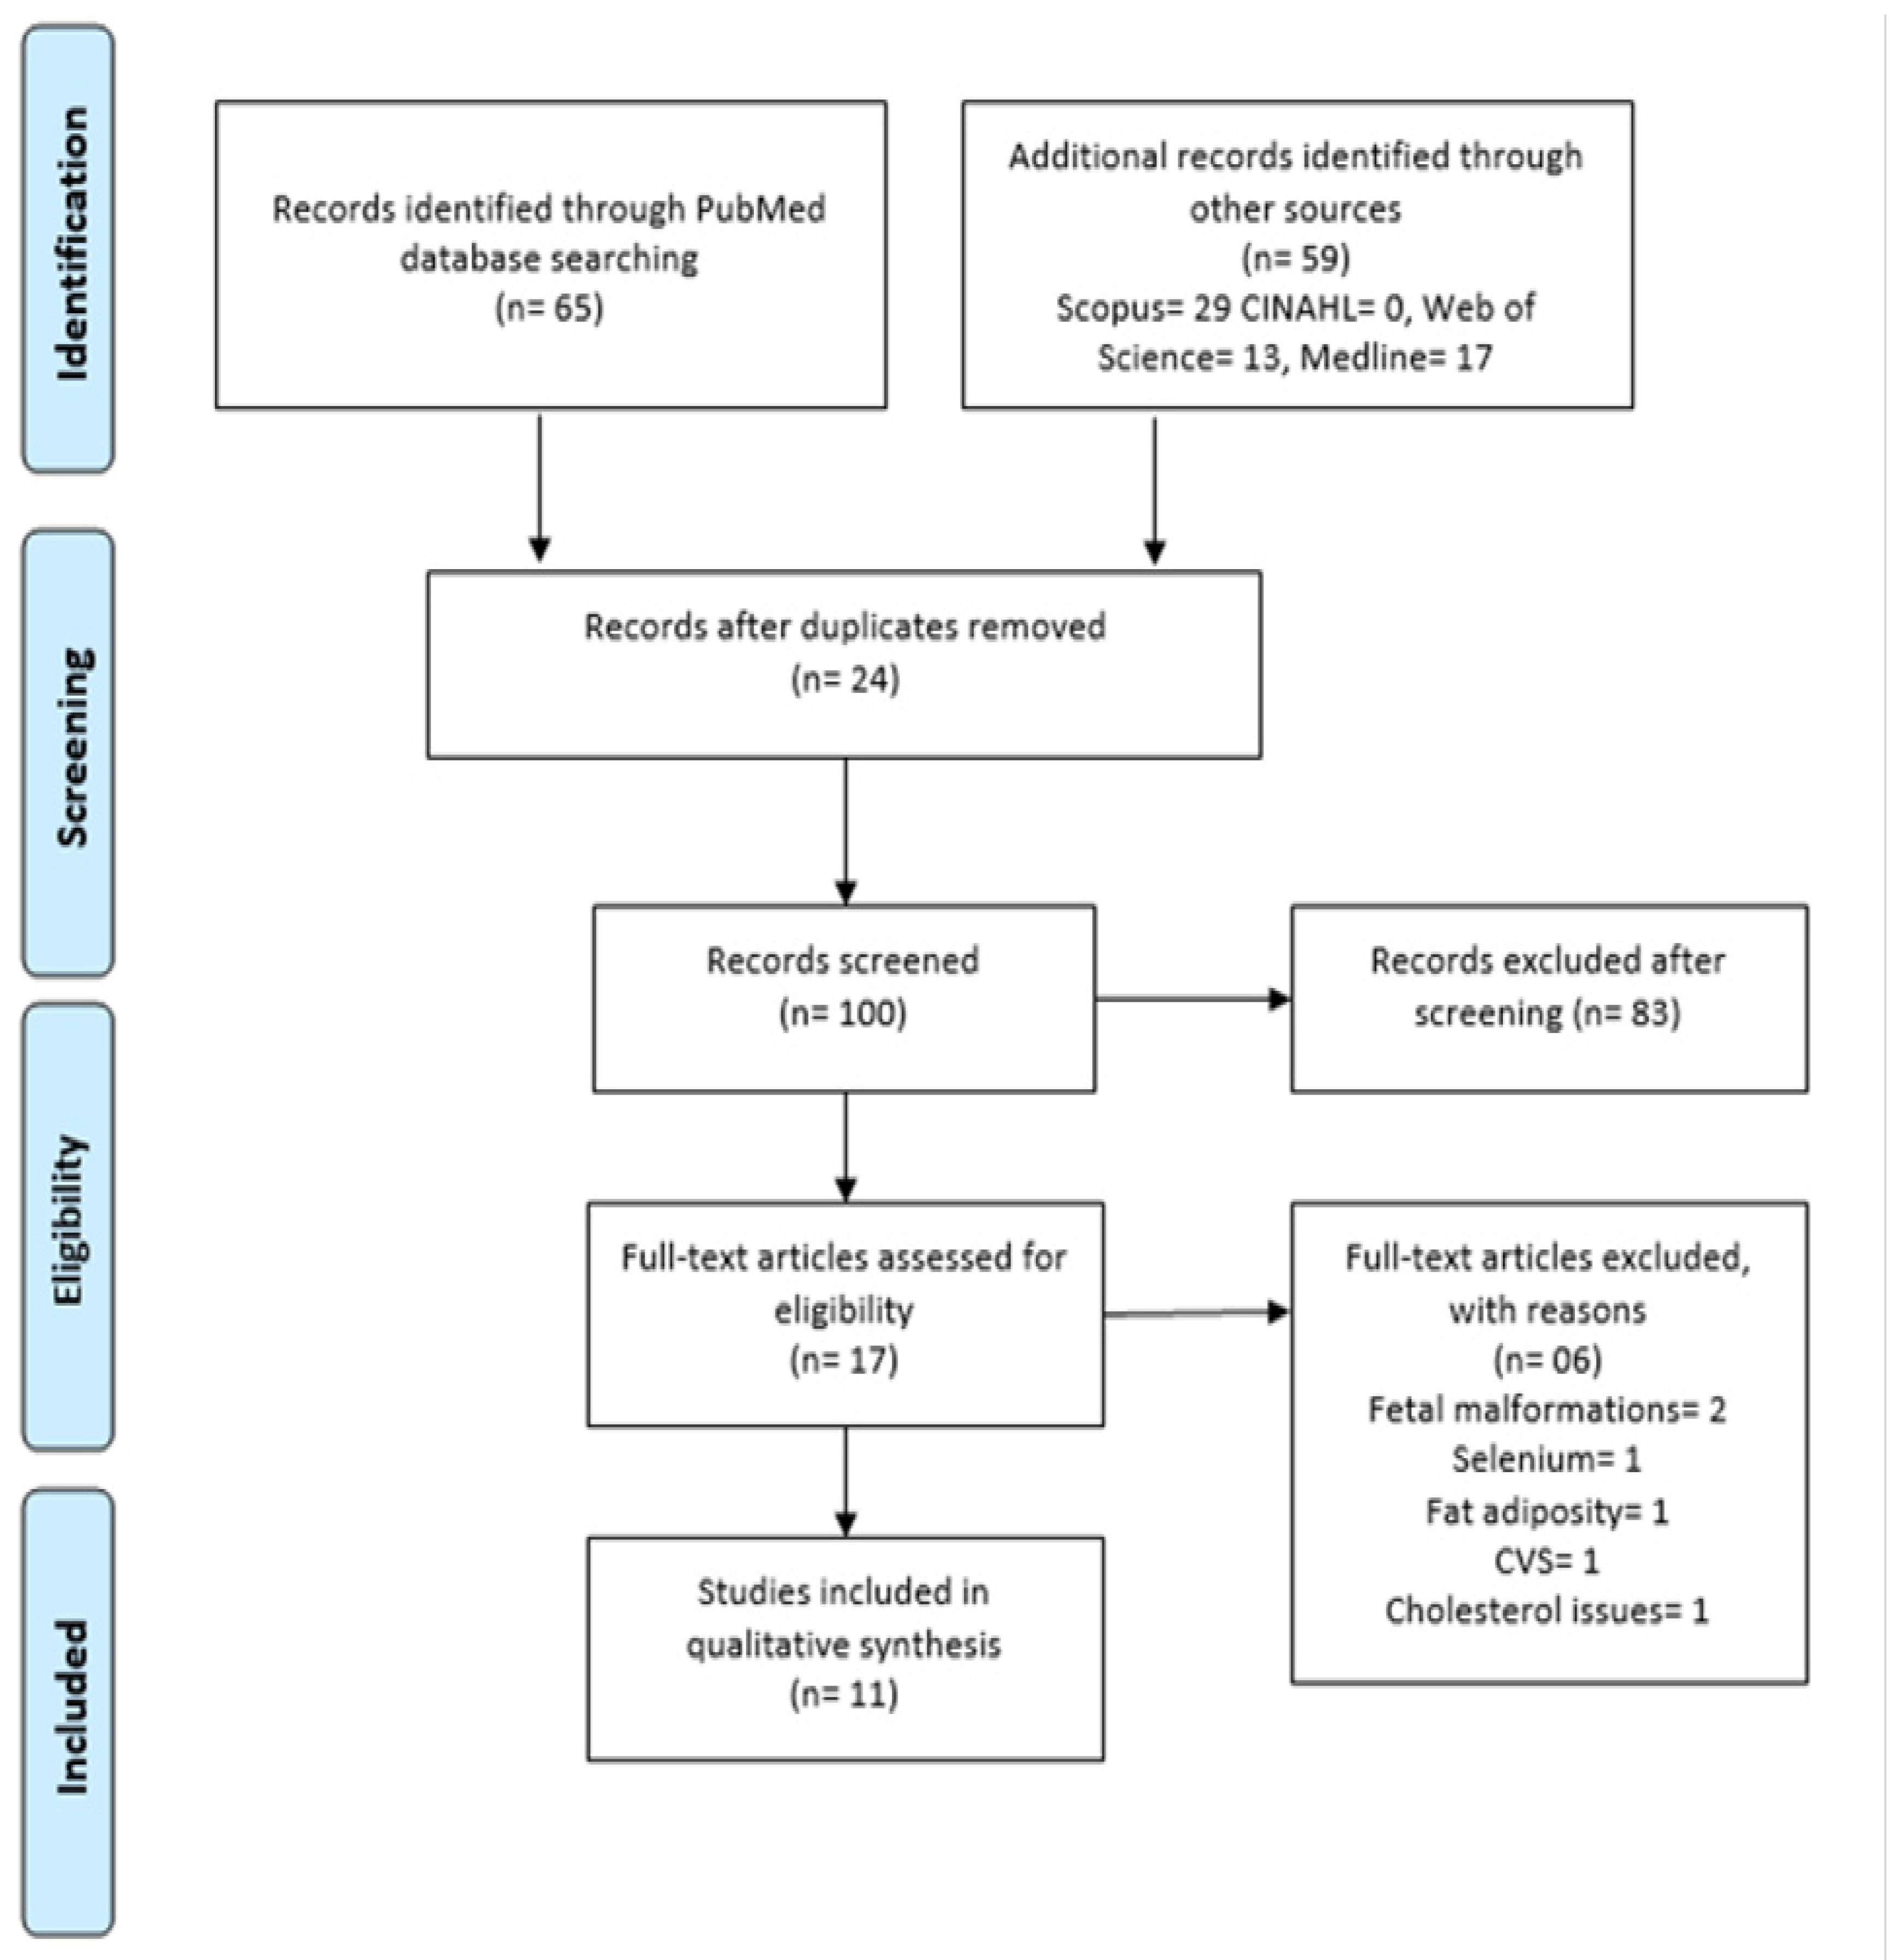
3.1. Study Selection
General Characteristics of Included Studies
4. Discussion
5. Conclusions and Outlook
Author Contributions
Funding
Informed Consent Statement
Conflicts of Interest
References
- World Health Organization. Diagnostic Criteria and Classification of Hyperglycaemia First Detected in Pregnancy; World Health Organization: Geneva, Switzerland, 2013; pp. 1–63. Available online: http://apps.who.int/iris/bitstream/10665/85975/1/WHO_NMH_MND_13.2_eng.pdf (accessed on 7 October 2022).
- Kim, C.; Newton, K.M.; Knopp, R.H. Gestational diabetes and the incidence of type 2 diabetes: A systematic review. Diabetes Care 2002, 25, 1862–1868. [Google Scholar] [CrossRef] [PubMed] [Green Version]
- Ferrara, A. Increasing prevalence of gestational diabetes mellitus: A public health perspective. Diabetes Care 2007, 30, S141–S146. [Google Scholar] [CrossRef] [PubMed] [Green Version]
- World Health Organization. Definition, Diagnosis and Classification of Diabetes Mellitus. Part 1: Diagnosis and Classification of Diabetes Mellitus; WHO: Geneva, Switzerland, 1999. [Google Scholar]
- Zhu, Y.; Zhang, C. Prevalence of Gestational Diabetes and Risk of Progression to Type 2 Diabetes: A Global Perspective. Curr. Diab. Rep. 2016, 16, 7. [Google Scholar] [CrossRef] [PubMed]
- Zheng, Y.; Ley, S.H.; Hu, F.B. Global aetiology and epidemiology of type 2 diabetes mellitus and its complications. Nat. Rev. Endocrinol. 2017, 14, 88–98. Available online: http://www.nature.com/doifinder/10.1038/nrendo.2017.151 (accessed on 9 January 2021). [CrossRef] [PubMed]
- World Health Organization. Global Report on Diabetes; World Helath Organisation Global Report on Diabetes; WHO: Geneva, Switzerland, 2016. [Google Scholar]
- Chan, M. Global Report on Diabetes; WHO: Geneva, Switzerland, 2014. [Google Scholar]
- Zimmet, P.Z.; Magliano, D.J.; Herman, W.H.; Shaw, J.E. Diabetes: A 21st century challenge. Lancet Diabetes Endocrinol. 2014, 2, 56–64. [Google Scholar] [CrossRef]
- O’Sullivan, J.B.; Mahan, C.M. Criteria for the oral glucose tolerance test in pregnancy. Diabetes 1964, 13, 278–285. [Google Scholar]
- Reddi Rani, P.; Begum, J. Screening and diagnosis of gestational diabetes mellitus, where do we stand. J. Clin. Diagn. Res. 2016, 10, QE01. [Google Scholar]
- Huynh, J.; Xiong, G.; Bentley-Lewis, R. A systematic review of metabolite profiling in gestational diabetes mellitus. Diabetologia 2014, 57, 2453–2464. [Google Scholar] [CrossRef] [Green Version]
- Rodrigo, N.; Glastras, S. The Emerging Role of Biomarkers in the Diagnosis of Gestational Diabetes Mellitus. J. Clin. Med. 2018, 7, 120. [Google Scholar] [CrossRef] [Green Version]
- Harris, A.T.; Rennie, A.; Waqar-Uddin, H.; Wheatley, S.R.; Ghosh, S.K.; Martin-Hirsch, D.P.; Fisher, S.; High, A.; Kirkham, J.; Upile, T. Raman spectroscopy in head and neck cancer. Head Neck Oncol. 2010, 2, 26. [Google Scholar] [CrossRef] [Green Version]
- Swinson, B.; Jerjes, W.; El-Maaytah, M.; Norris, P.; Hopper, C. Optical techniques in diagnosis of head and neck malignancy. Oral Oncol. 2006, 42, 221–228. [Google Scholar] [CrossRef]
- Chan, A.W.; Mercier, P.; Schiller, D.; Bailey, R.; Robbins, S.; Eurich, D.T.; Sawyer, M.B.; Broadhurst, D. 1H-NMR urinary metabolomic profiling for diagnosis of gastric cancer. Br. J. Cancer 2015, 114, 59–62. [Google Scholar] [CrossRef]
- Feng, X.; Fox, M.C.; Reichenberg, J.S.; Lopes, F.C.P.S.; Sebastian, K.R.; Markey, M.K.; Tunnell, J.W. Biophysical basis of skin cancer margin assessment using Raman spectroscopy. Biomed. Opt. Express 2018, 10, 104–118. [Google Scholar] [CrossRef]
- Khan, R.S.; Ahmed, M.R.; Khalid, B.; Mahmood, A.; Hassan, R. Biomarker Detection of Neurological Disorders through Spectroscopy Analysis. Int. Dent. Med. J. Adv. Res. 2018, 4, 1–9. [Google Scholar] [CrossRef]
- Talari, A.C.S.; Evans, C.A.; Holen, I.; Coleman, R.E.; Rehman, I.U. Raman spectroscopic analysis differentiates between breast cancer cell lines. J. Raman. Spectrosc. 2015, 46, 421–427. [Google Scholar] [CrossRef]
- Bigio, I.J.; Bown, S.G.; Briggs, G.M.; Kelley, C.; Lakhani, S.; Pickard, D.C.O.; Ripley, P.M.; Rose, I.; Saunders, C. Diagnosis of breast cancer using elastic-scattering spectroscopy: Preliminary clinical results. J. Biomed. Opt. 2002, 5, 221–228. [Google Scholar] [CrossRef] [PubMed] [Green Version]
- Pontes, J.G.M.; Brasil, A.J.M.; Cruz, G.C.F.; De Souza, R.N.; Tasic, L. NMR-based metabolomics strategies: Plants, animals and humans. Anal. Methods 2017, 9, 1078–1096. [Google Scholar] [CrossRef]
- Talari, A.C.S.; Martinez, M.A.G.; Movasaghi, Z.; Rehman, S.; Rehman, I.U. Advances in Fourier transform infrared (FTIR) spectroscopy of biological tissues. Appl. Spectrosc. Rev. 2017, 52, 456–506. [Google Scholar] [CrossRef]
- Kaznowska, E.; Depciuch, J.; Łach, K.; Kołodziej, M.; Koziorowska, A.; Vongsvivut, J.; Zawlik, I.; Cholewa, M.; Cebulski, J. The classification of lung cancers and their degree of malignancy by FTIR, PCA-LDA analysis, and a physics-based computational model. Talanta 2018, 186, 337–345. [Google Scholar] [CrossRef]
- Ying, Z.; Fearn, T.; Chicken, D.W.; Austwick, M.R.; Somasundaram, S.K.; Mosse, C.A.; Clark, B.; Bigio, I.J.; Keshtgar, M.R.S.; Bown, S.G. Elastic scattering spectroscopy for early detection of breast cancer: Partially supervised Bayesian image classification of scanned sentinel lymph nodes. J. Biomed. Opt. 2018, 23, 085004. [Google Scholar]
- Depciuch, J.; Stanek-Widera, A.; Lange, D.; Biskup-Frużyńska, M.; Stanek-Tarkowska, J.; Czarny, W.; Cebulski, J. Spectroscopic analysis of normal and neoplastic (WI-FTC) thyroid tissue. Spectrochim. Acta Part A Mol. Biomol. Spectrosc. 2018, 204, 18–24. [Google Scholar] [CrossRef] [PubMed]
- Sahu, A.; Gera, P.; Malik, A.; Nair, S.; Chaturvedi, P.; Murali Krishna, C. Raman exfoliative cytology for prognosis prediction in oral cancers: A proof of concept study. J. Biophotonics 2019, 12, e201800334. [Google Scholar] [CrossRef]
- Carden, A.; Morris, M.D. Application of vibrational spectroscopy to the study of mineralized tissues (review). J. Biomed. Opt. 2000, 5, 259–268. [Google Scholar] [CrossRef]
- Baker, M.J.; Hussain, S.R.; Lovergne, L.; Untereiner, V.; Hughes, C.; Lukaszewski, R.A.; Thiéfin, G.; Sockalingum, G.D. Developing and understanding biofluid vibrational spectroscopy: A critical review. Chem. Soc. Rev. 2016, 45, 1803–1818. Available online: http://xlink.rsc.org/?DOI=C5CS00585J (accessed on 8 November 2019). [CrossRef] [PubMed] [Green Version]
- Rehman, I.; Movasaghi, Z.; Rehman, S. Vibrational Spectroscopy for Tissue Analysis [Internet]; 2012; 356p, Available online: https://books.google.com/books?id=UXp0RuROT5MC&pgis=1 (accessed on 3 March 2019).
- Kendall, C.; Hutchings, J.; Barr, H.; Shepherd, N.; Stone, N. Exploiting the diagnostic potential of biomolecular fingerprinting with vibrational spectroscopy. Faraday Discuss 2011, 149, 279–290. [Google Scholar] [CrossRef]
- Liberati, A.; Altman, D.G.; Tetzlaff, J.; Mulrow, C.; Gøtzsche, P.C.; Ioannidis, J.P.; Clarke, M.; Devereaux, P.J.; Kleijnen, J.; Moher, D. The PRISMA statement for reporting systematic reviews and meta-analyses of studies that evaluate healthcare interventions: Explanation and elaboration. BMJ 2009, 339, b2700. [Google Scholar] [CrossRef] [Green Version]
- Moher, D.; Hopewell, S.; Schulz, K.F.; Montori, V.; Gøtzsche, P.C.; Devereaux, P.; Elbourne, D.; Egger, M. CONSORT 2010 explanation and elaboration: Updated guidelines for reporting parallel group randomised trials. Int. J. Surg. 2012, 10, 28–55. [Google Scholar] [CrossRef] [PubMed] [Green Version]
- Kautzky-Willer, A.; Krssak, M.; Winzer, C.; Pacini, G.; Tura, A.; Farhan, S.; Wagner, O.; Brabant, G.; Horn, R.; Stingl, H.; et al. Increased intramyocellular lipid concentration identifies impaired glucose metabolism in women with previous gestational diabetes. Diabetes 2003, 52, 244–251. [Google Scholar] [CrossRef] [Green Version]
- Prikoszovich, T.; Winzer, C.; Schmid, A.I.; Szendroedi, J.; Chmelik, M.; Pacini, G.; Krššák, M.; Moser, E.; Funahashi, T.; Waldhäusl, W.; et al. Body and liver fat mass rather than muscle mitochondrial function determine glucose metabolism in women with a history of gestational diabetes mellitus. Diabetes Care 2011, 34, 430–436. [Google Scholar] [CrossRef] [Green Version]
- Bozkurt, L.; Göbl, C.S.; Tura, A.; Chmelik, M.; Prikoszovich, T.; Kosi, L.; Wagner, O.; Roden, M.; Pacini, G.; Gastaldelli, A.; et al. Fatty liver index predicts further metabolic deteriorations in women with previous gestational diabetes. PLoS ONE 2012, 7, e32710. [Google Scholar] [CrossRef] [Green Version]
- Sachse, D.; Sletner, L.; Mørkrid, K.; Jenum, A.K.; Birkeland, K.I.; Rise, F.; Piehler, A.P.; Berg, J.P. Metabolic Changes in Urine during and after Pregnancy in a Large, Multiethnic Population-Based Cohort Study of Gestational Diabetes. PLoS ONE 2012, 7, e52399. [Google Scholar] [CrossRef] [PubMed] [Green Version]
- Graa, G.; Goodfellow, B.J.; Barros, A.S.; Diaz, S.; Duarte, I.F.; Spagou, K.; Veselkov, K.; Want, E.J.; Lindon, J.C.; Carreira, I.M.; et al. UPLC-MS metabolic profiling of second trimester amniotic fluid and maternal urine and comparison with NMR spectral profiling for the identification of pregnancy disorder biomarkers. Mol. Biosyst. 2012, 8, 1243–1254. [Google Scholar] [CrossRef] [PubMed]
- Diaz, S.O.; Barros, A.S.; Goodfellow, B.J.; Duarte, I.F.; Galhano, E.; Pita, C.; Almeida, M.C.; Carreira, I.M.; Gil, A.M. Second trimester maternal urine for the diagnosis of trisomy 21 and prediction of poor pregnancy outcomes. J. Proteome Res. 2013, 12, 2946–2957. [Google Scholar] [CrossRef]
- Pinto, J.; Almeida, L.M.; Martins, A.S.; Duarte, D.; Barros, A.S.; Galhano, E.; Pita, C.; Almeida, M.C.; Carreira, I.M.; Gil, A.M. Prediction of gestational diabetes through NMR metabolomics of maternal blood. J. Proteome Res. 2015, 14, 2696–2706. [Google Scholar] [CrossRef] [PubMed]
- Aydemir, B.; Baykara, O.; Cinemre, F.B.S.; Cinemre, H.; Tuten, A.; Kiziler, A.R.; Akdemir, N.; Oncul, M.; Kaya, B.; Sozer, V.; et al. LOX-1 gene variants and maternal levels of plasma oxidized LDL and malondialdehyde in patients with gestational diabetes mellitus. Arch. Gynecol. Obstet. 2016, 293, 517–527. [Google Scholar] [CrossRef] [PubMed]
- Rottenkolber, M.; Ferrari, U.; Holland, L.; Aertsen, S.; Kammer, N.N.; Hetterich, H.; Fugmann, M.; Banning, F.; Weise, M.; Sacco, V.; et al. The diabetes risk phenotype of young women with recent gestational diabetes. J. Clin. Endocrinol. Metab. 2015, 100, E910–E918. [Google Scholar] [CrossRef] [Green Version]
- Pinto, J.; Diaz, S.O.; Aguiar, E.; Duarte, D.; Barros, A.S.; Galhano, E.; Pita, C.; Almeida, M.C.; Carreira, I.M.; Spraul, M.; et al. Metabolic profiling of maternal urine can aid clinical management of gestational diabetes mellitus. Metabolomics 2016, 12, 105. [Google Scholar] [CrossRef]
- Jin, B.; Liu, L.; Zhang, S.; Cao, X.; Xu, Y.; Wang, J.; Sun, L. Nuclear Magnetic Resonance-Assisted Metabolic Analysis of Plasma for Mild Gestational Diabetes Mellitus Patients. Metab. Syndr. Relat. Disord. 2017, 15, 439–449. [Google Scholar] [CrossRef]
- Lees, T.; Nassif, N.; Simpson, A.; Shad-Kaneez, F.; Martiniello-Wilks, R.; Lin, Y.; Jones, A.; Qu, X.; Lal, S. Recent advances in molecular biomarkers for diabetes mellitus: A systematic review. Biomarkers 2017, 22, 604–613. [Google Scholar] [CrossRef]
- Morshed, M.G.; Lee, M.K.; Jorgensen, D.; Isaac-Renton, J.L. Molecular methods used in clinical laboratory: Prospects and pitfalls. FEMS Immunol. Med. Microbiol. 2007, 49, 184–191. [Google Scholar] [CrossRef] [Green Version]
- Karakash, S.D.; Einstein, F.H. Diabetes in pregnancy: Glycemia control guidelines and rationale. Curr. Opin. Endocrinol. Diabetes Obes. 2011, 18, 99. [Google Scholar] [CrossRef] [PubMed] [Green Version]
- Du, Y.F.; Ou, H.Y.; Beverly, E.A.; Chiu, C.J. Achieving glycemic control in elderly patients with type 2 diabetes: A critical comparison of current options. Clin. Interv. Aging 2014, 9, 1963. [Google Scholar]
- Hawdon, J.M. Babies born after diabetes in pregnancy: What are the short- and long-term risks and how can we minimise them? Best Pract. Res. Clin. Obstet. Gynaecol. 2011, 25, 91–104. [Google Scholar] [CrossRef] [PubMed]
- Derenne, A.; Vandersleyen, O.; Goormaghtigh, E. Lipid quantification method using FTIR spectroscopy applied on cancer cell extracts. Biochim. Biophys. Acta Mol. Cell. Biol. Lipids 2014, 1841, 1200–1209. [Google Scholar] [CrossRef] [PubMed]
- Bellamy, L.; Casas, J.P.; Hingorani, A.D.; Williams, D. Type 2 diabetes mellitus after gestational diabetes: A systematic review and meta-analysis. Lancet 2009, 373(9677), 1773–1779. [Google Scholar] [CrossRef] [PubMed]
- Movasaghi, Z.; Rehman, S.; Rehman, I.U. Fourier transform infrared (FTIR) spectroscopy of biological tissues. Appl. Spectrosc. Rev. 2008, 43, 134–179. [Google Scholar] [CrossRef]
- Scott, D.A.; Renaud, D.E.; Krishnasamy, S.; Meriç, P.; Buduneli, N.; Cetinkalp, S.; Liu, K.Z. Diabetes-related molecular signatures in infrared spectra of human saliva. Diabetol. Metab. Syndr. 2010, 2, 48. [Google Scholar] [CrossRef]


| Country (First Author, Year) | Quality Indicators | ||
|---|---|---|---|
| Selection | Comparability | Exposure | |
| Austria [33] | *** | * | ** |
| Austria [34] | ** | * | *** |
| Vienna [35] | *** | * | ** |
| Norway [36] | ** | * | *** |
| Portugal [37] | *** | * | ** |
| Portugal [38] | ** | * | *** |
| Portugal [39] | ** | * | ** |
| Turkey [40] | *** | * | ** |
| Germany [41] | *** | * | ** |
| Portugal [42] | ** | * | *** |
| China [43] | *** | * | ** |
| Investigators; Country | Study Design | Analytical Platform | Upregulated and Downregulated Biomarkers | Biological Samples | Gestational Time Point | Outcome of Study |
|---|---|---|---|---|---|---|
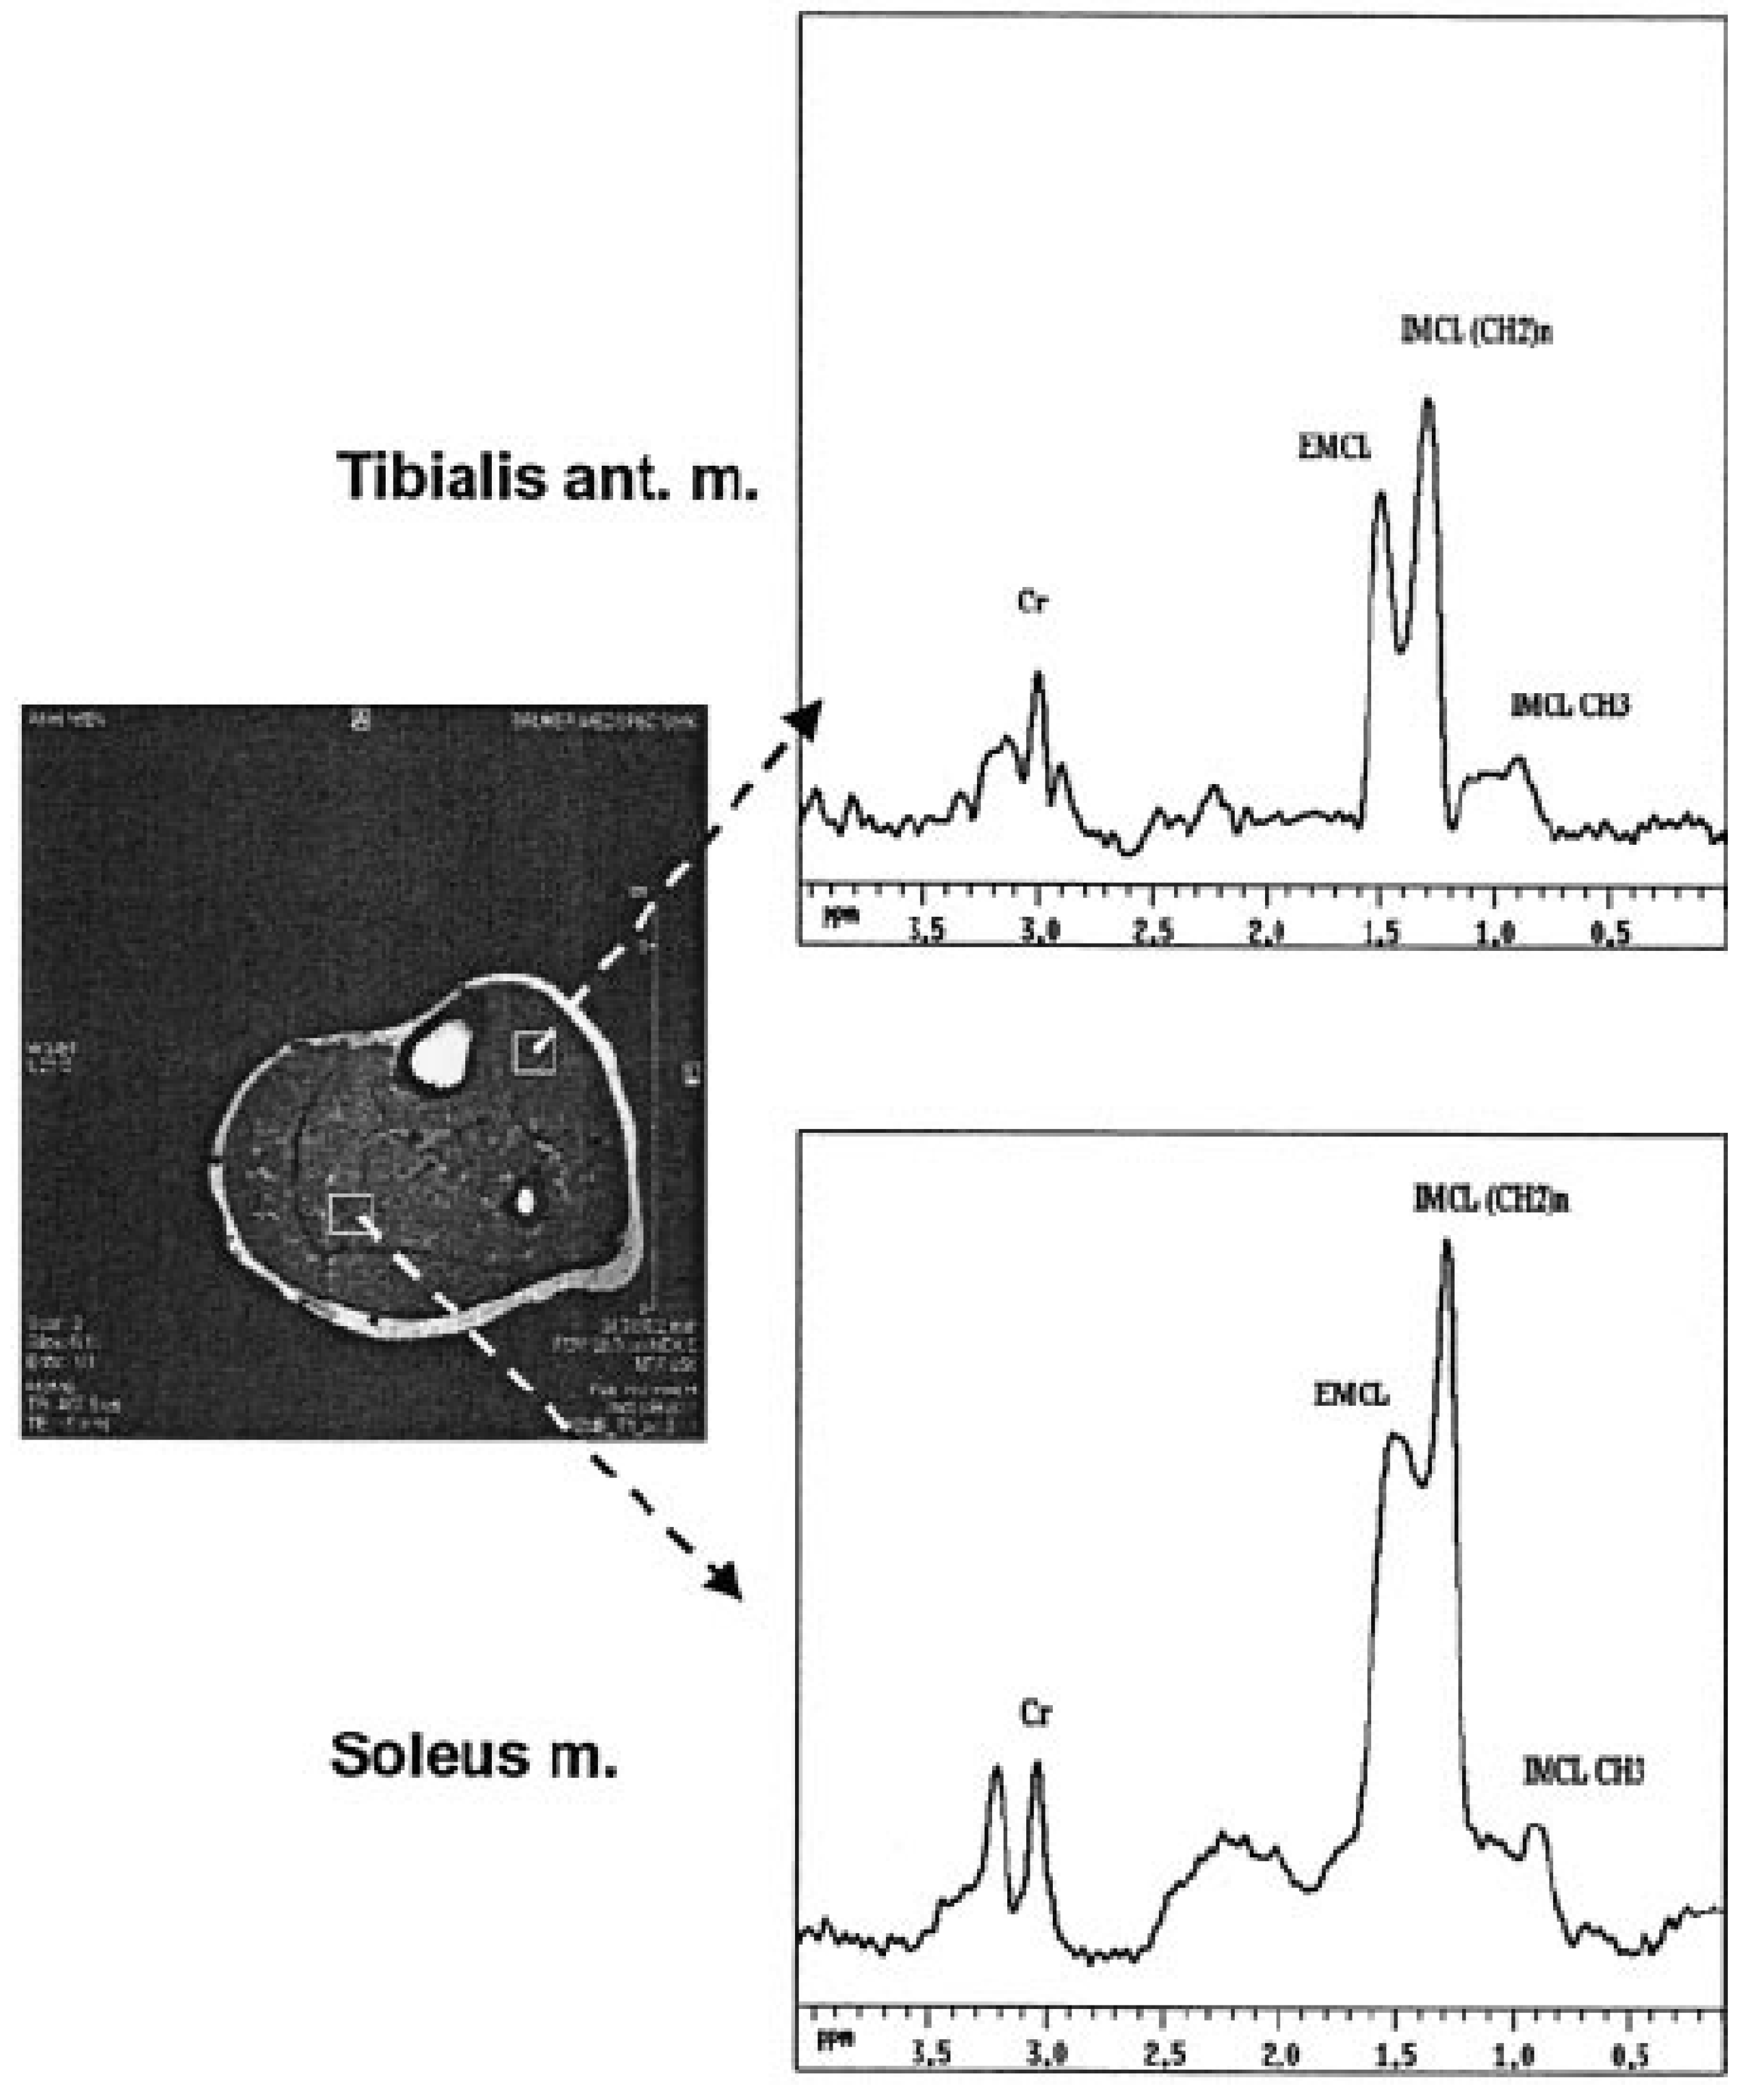
| Willer et al.; Austria [33] | Cohort | H NMRS | IMCL and raised plasma total leptin concentrations associated with insulin secretion, resistance, and BFM in pGDM | Blood, plasma | Pre-diagnosis GDM (2−21 gestational weeks prior to diagnosis) Post-diagnosis GDM (24−27) controls | The study showed that higher IMCL was related to risk factors for T2DM in the selected group of women and also in addition to metabolic syndrome, and it serves as a biomarker of risk for T2DM later in women with pGDM. |
| Prikoszovich et al.; Austria [34] | Cohort | Magnetic resonance spectroscopy | IMCL and HCL were high in pGDM | Plasma glucose | 23 pGDM and 8 women without any risk factors for T2DM served as controls (CON) | Glucose-tolerant pGDM showed increased liver fat, which suggested that variation in hepatic lipid storage indicates primary and dominant abnormality in this particular group. |
| Bozkurt et al.; Vienna [35] | Case–control | 1H-magnetic resonance spectroscopy | Fatty liver was seen to be increased in GDM | Plasma | 3–6 months after delivery over 10 years of observation | This study suggested the indication of excess fat in liver is linked with high risk of deterioration of insulin resistance and manifestation of T2DM and CVS disease. |
| Sachse et al.; Norway [36] | Case–control | H NMR | Citrate | Maternal urine | visit 1: 8–20 gestational weeks, visit 2: 28 ± 2 weeks, and visit 3: 10–16 weeks postpartum | Study concluded that NMR-based metabolomics can support the changes in monitoring of urinary excretion profile, but it may not be the practical choice for study of GDM. |
| Garca et al.; Portugal [37] | Case–control | NMR and UPLC-MS | Specific metabolites tested but not specified | Amniotic fluid, blood, and urine | 15–25 gestational weeks | The results of the study showed the usefulness of biofluids metabonomics and no significant changes found in between both the groups. Furthermore, follow-up study throughout the pregnancy would give complete metabolic picture. |
| Diaz et al.; Portugal [38] | Case–control | H NMRS | 4- hydroxyphenyl acetate and hippurate were downregulated and choline, glucose, N- methyl nicotinamide, and xylose were upregulated | Urine | 14–26 | This study demonstrated the maternal urine profile to diagnose prenatal and early prediction of poor outcomes of pregnancy. |
| Pinto et al.; Portugal [39] | Case–control | NMRS | Pre-diagnosis: valine, proline, urea, pyruvate, 1,5-anhydroglucitol, cholesterol, VLDL, HDL, and LDL Post-diagnosis: alanine, betaine, TMAO, methanol, creatinine, proline, glyceryl, and unsaturated fatty acids | Whole-blood plasma and plasma lipid extracts | 2nd and 3rd trimester | Post-diagnosis GDM was classified successfully using 26-resonance plasma biomarker. It also showed possible GDM prediction and diagnosis by the exploiting multivariate profile changes. |
| Aydemir et al.; Turkey [40] | Case–control | Spectrophotometric method | Downregulation of K167N and polymorphism LOX-1 | Blood and plasma | 1–18 gestational weeks | The results of the study suggested that in the Turkish group biomarker LOX-1 and K167N polymorphisms might not be involved in susceptibility to GDM and needs further evaluation to check their analysis effects at risk of GDM. |
| Rottenkolber et al.; Germany [41] | Monocentre cross-sectional analysis | Magnetic resonance spectroscopy | Upregulation of fetuin-A and downregulated insulin sensitivity index | Plasma | At the time of pregnancy and 3–16 months after pregnancy | The conclusion of the study was fetuin-A and leptin signalling were involved in pathogenesis of T2DM. |
| Pinto et al.; Portugal [42] | Case–control | NMR | 3-hydroisovaleric acid, hippurate, choline, creatinine, galactose, lysine, threonine, and phenylacetylglutamine | Urine | 2nd and 3rd trimester of pregnancy | 12 resonance metabolic signatures at the diagnosis of GDM were identified through this study, furthermore, evaluation of diet therapies and insulin impact enabled to look through metabolic pathways, and identification of side effects were determined. |
| Jin et al.; China [43] | Case–control | H NMR, biochemical assay, and mRNA extraction | High levels of fasting blood glucose, insulin, mRNA of CD86. Low levels of CX3CLI and CD86. | Blood | N/A | Both the approaches gave information regarding mild GDM, such as amino acid metabolism, fatty acid metabolism, disturbed glucose mechanism, and activated inflammatory response. All these results give insight into underlying mechanisms of mild GDM. |
| Group | Year/Controls | Biomarkers Analysed in Study | Cases | GDM Diagnostic Criteria | Maternal Age | BMI (kg/m²) |
|---|---|---|---|---|---|---|
| Willer et al.; Austria [33] | 2003 NGT: 23 | IMCL in soleus (IMCL-S) and tibialis anterior muscles (IMCL-T) and leptin system | pGDM: 39, GDM-R: 17 GDM-S: 22 | OGTT | GDM: 31.1 ± 0.81 GDM-R: 31.0 ± 1.4 GDM-S: 31.2 ± 0.8 NGT: 30.6 ± 0.9 | GDM: 26.4 ± 1.1 GDM-R: 29.8 ± 1.8 GDM-S: 24.9 ± 0.8 NGT: 24.3 ± 0.9 |
| Prikoszovich et al.; Austria [34] | 2011 CO: 35 | intramyocellular lipids (IMCL) and liver hepatocellular lipids (HCL) and impaired myocellular flux through ATP synthase (fATPase) | PGDM: 37 PGDM IR: 37 PGDM-IS: 39 | OGTT | PGDM: 37 ± 5 PGDM-IR: 37 ± 5.9 PGDM-IS: 39 ± 3 CO: 35 ± 4 | PGDM: 25.5 ± 3.6 PGDM-IR: 26.5 ± 3 PGDM-IS: 24.2 ± 4.1 CO: 25 ± 2.9 |
| Bozkurt et al.; Vienna [35] | 2012 NGT: 29 | Determinants of fatty liver and metabolic assessments (IR and free fatty acids) | PGDM-IS: 37 PGDM-IR: 25 | OGTT | PGDM-IS: 32.8 ± 4.2 PGDM-IR: 32.5 ± 5.7 NGT: 30.5 ± 5.2 | PGDM-IS: 25.4 ± 4.15 PGDM-IR: 30.4 ± 5.4 NGT: 25.4 ± 6.4 |
| Sachse et al.; Norway [36] | 2012 NGT:530 | leucine, valine, lysine, alanine, tyrosine, formate, histidine, creatine, creatinine N- phenylacetylglycine 3- aminoisobutyrate, 3- hydroxyisovalerate, N- acetylglutamine, dimethylamine, 2- hydroxyisobutyrate trimethylamine N- oxide, glycine, 1- methylnicotinamide, 1,6-anhydroglucose, and 4- hydroxyphenylacetate | GDM: 79 | WHO criteria and IADPSG criteria | 29.9 ± 4.8 | 24.6 ± 4.8 |
| Garca et al.; Portugal [37] | 2012 20 urine and 23 amniotic samples | Metabonomics | 20 urine and 23 amniotic samples | Unknown | >35 | N/A |
| Diaz et al.; Portugal [38] | 2013 NGT: 84 | Metabolites | GDM: 42 | Unknown | N/A | N/A |
| Pinto et al.; Portugal [39] | 2015 NGT:64 | Metabolites | Blood plasma: 44 Plasma lipid extracts: 26 | IADPSG | Blood: Pre-diag GDM: 30–44 Post-diag GDM: 18–41 Controls: 25–42 Plasma lipid extracts: Pre-diag GDM: 36–42 Post-diag GDM: 18–41 Controls: 28–42 | 22-26 |
| Aydemir et al.; Turkey [40] | 2015 NGT: 120 | LOX-1 and K167N | 116 pregnant women with GDM | OGTT | GDM: 34.40 ± 5.46 NGT: 35.03 ± 5.46 | GDM: 29.4 ± 3.66 NGT: 29.16 ± 1.82 |
| Rottenkolber et al.; Germany [41] | 2015 NGT: 51 | Fetuin-A, leptin, resistin, adiponectin, and NEFAs | GDM: 96 | IADPSG | GDM: 35.9 ± 4 NGT: 35.2 ± 3.9 | GDM: 26.3 ± 6.3 NGT: 23.6 ± 4 |
| Pinto et al.; Portugal [42] | 2016 Controls: 1 (n = 14) Controls: 2 (n = 30) | Metabolic profiles | NT: 18 DT: 28 IT: 8 | OGTT | N/A | N/A |
| Jin et al.; China [43] | 2017 NGT: 36 | Metabolic profiles | GDM: 36 | IADPSG | N/A | N/A |
Disclaimer/Publisher’s Note: The statements, opinions and data contained in all publications are solely those of the individual author(s) and contributor(s) and not of MDPI and/or the editor(s). MDPI and/or the editor(s) disclaim responsibility for any injury to people or property resulting from any ideas, methods, instructions or products referred to in the content. |
© 2023 by the authors. Licensee MDPI, Basel, Switzerland. This article is an open access article distributed under the terms and conditions of the Creative Commons Attribution (CC BY) license (https://creativecommons.org/licenses/by/4.0/).
Share and Cite
Khan, R.S.; Malik, H. Diagnostic Biomarkers for Gestational Diabetes Mellitus Using Spectroscopy Techniques: A Systematic Review. Diseases 2023, 11, 16. https://doi.org/10.3390/diseases11010016
Khan RS, Malik H. Diagnostic Biomarkers for Gestational Diabetes Mellitus Using Spectroscopy Techniques: A Systematic Review. Diseases. 2023; 11(1):16. https://doi.org/10.3390/diseases11010016
Chicago/Turabian StyleKhan, Rabia Sannam, and Haroon Malik. 2023. "Diagnostic Biomarkers for Gestational Diabetes Mellitus Using Spectroscopy Techniques: A Systematic Review" Diseases 11, no. 1: 16. https://doi.org/10.3390/diseases11010016