
The Contribution of Multiplexing Single Cell RNA Sequencing in Acute Myeloid Leukemia
 , ,
, ,  ,
,  ,
,
Abstract
:1. Background
2. Materials and Methods
2.1. Sample Preparation and Single Cell Preparation for Chromium Single Cell RNA Sequencing (scRNA-seq)
2.2. Single Cell RNA-seq Processing
2.2.1. Cell Labeling with Cell Hashing Antibodies
2.2.2. Single Cell Library Generation
2.2.3. Sequencing
2.3. Bioinformatic Analysis
2.3.1. Data Processing, Alignment, Gene Quantification and QA/QC
2.3.2. Normalization and Correlation of Gene Expression Levels
2.3.3. PCA and tSNE Analysis for Cell Clustering and Classification, and Data Visualization
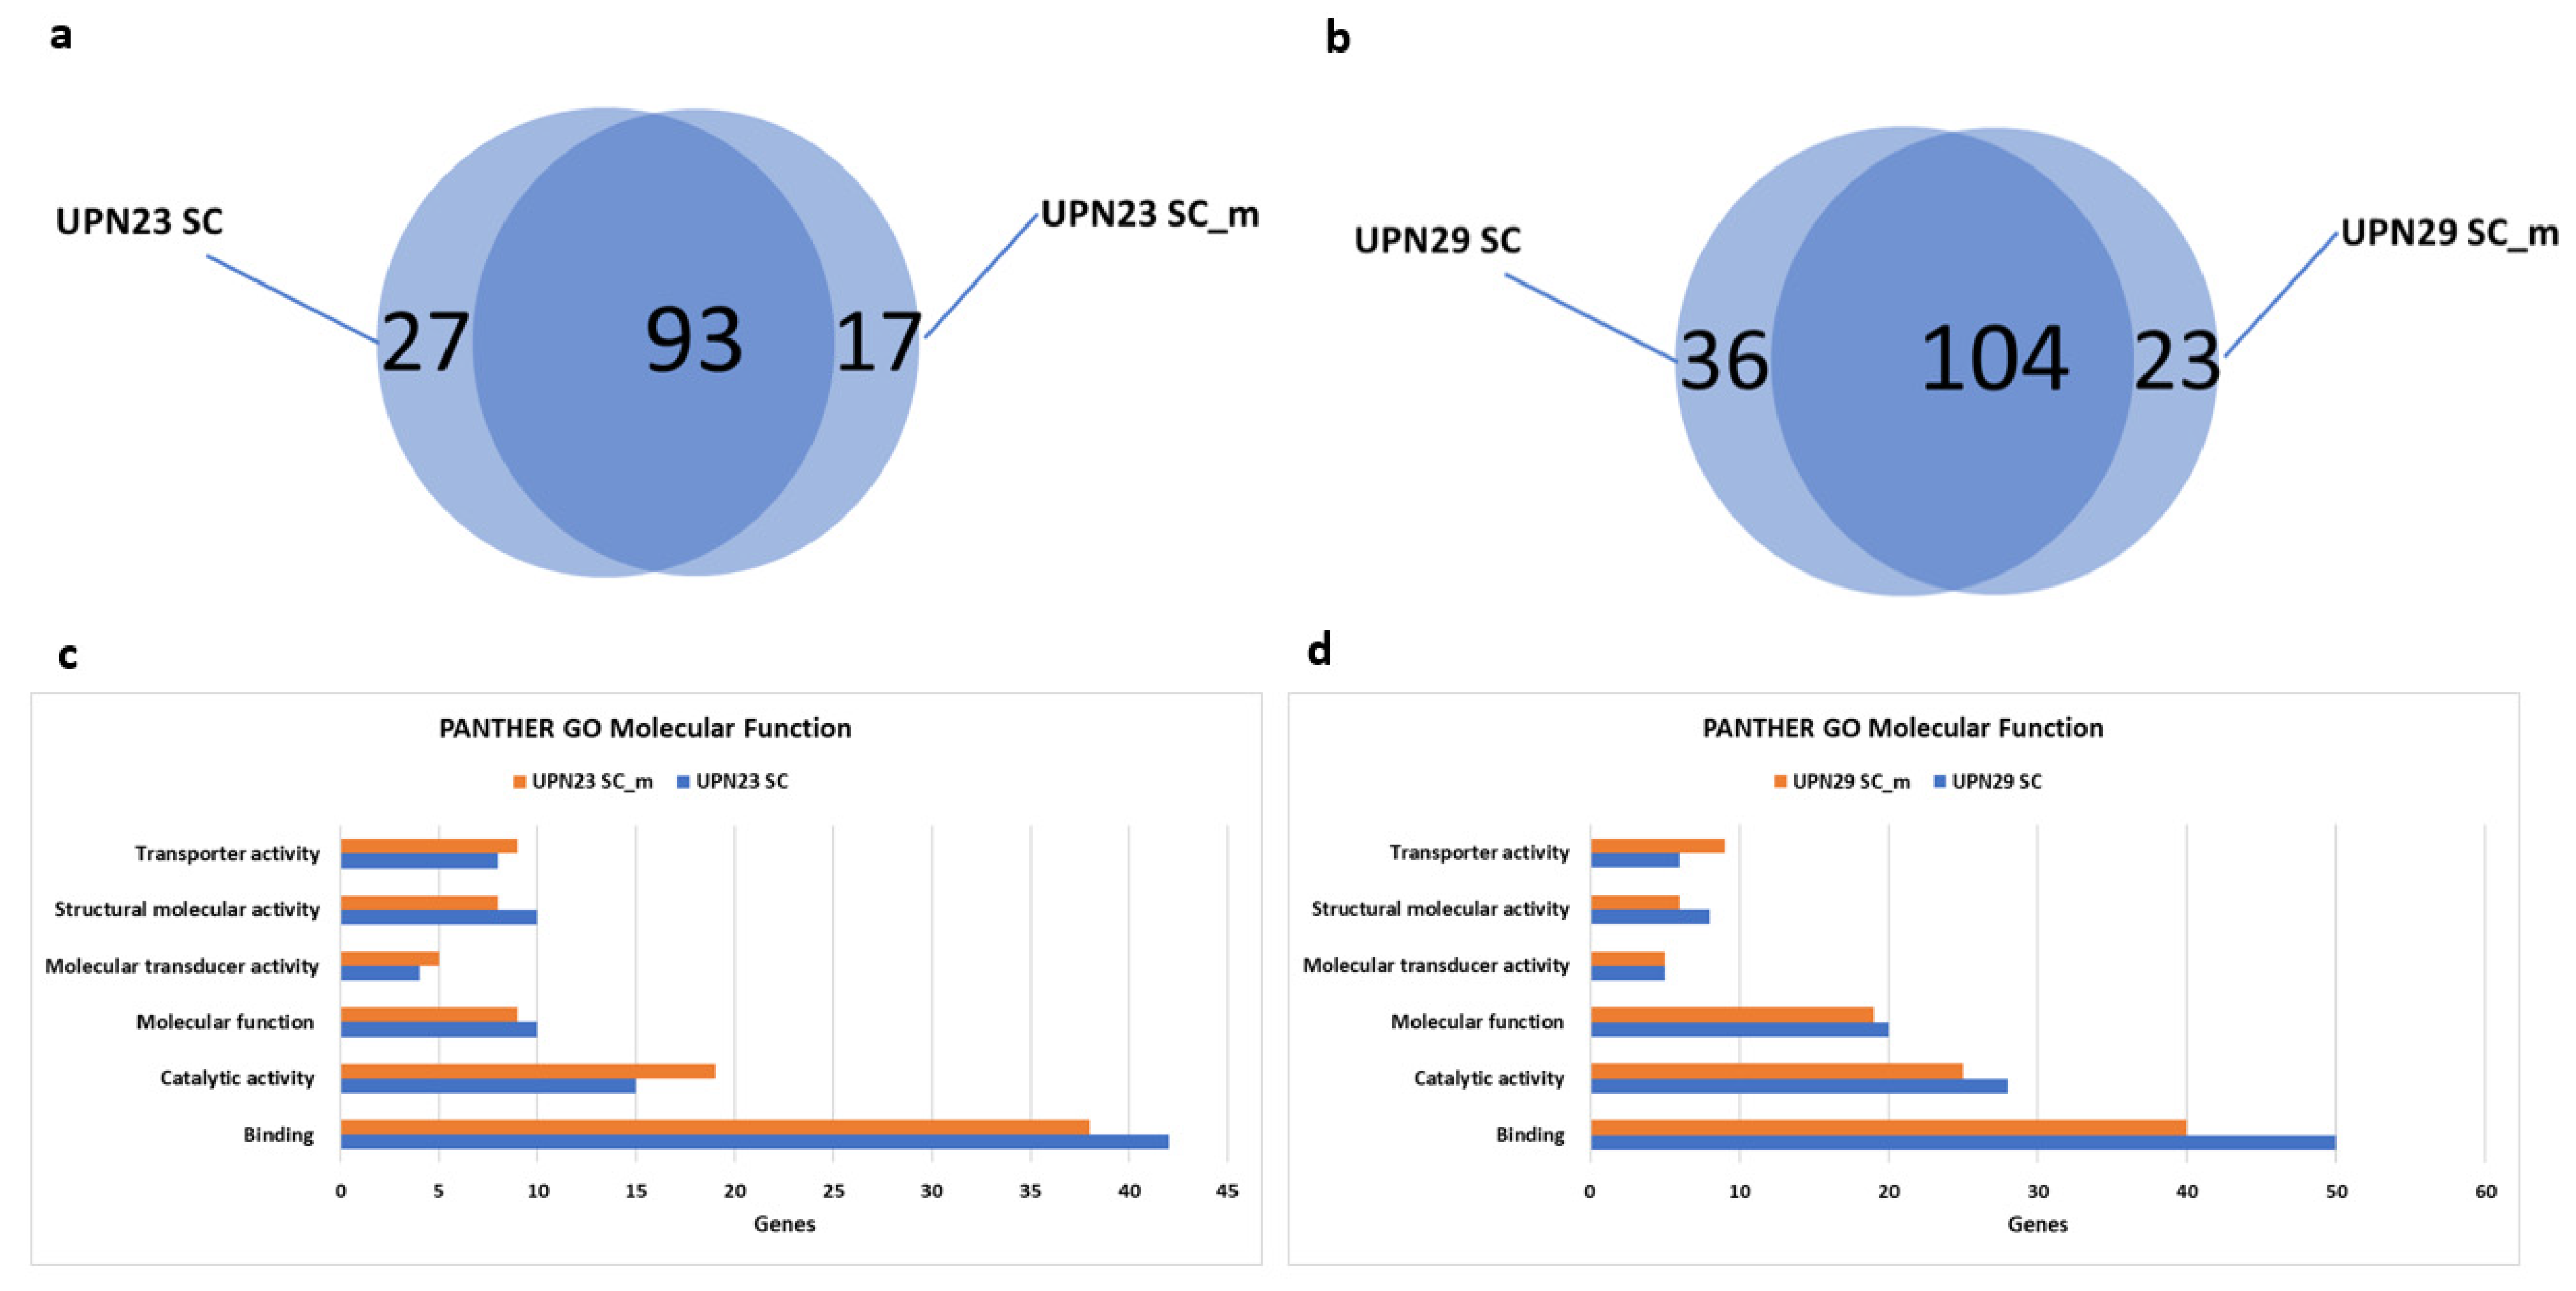
2.4. Gene Ontology Analysis for Molecular Function
2.5. Code Availability
3. Results and Discussion
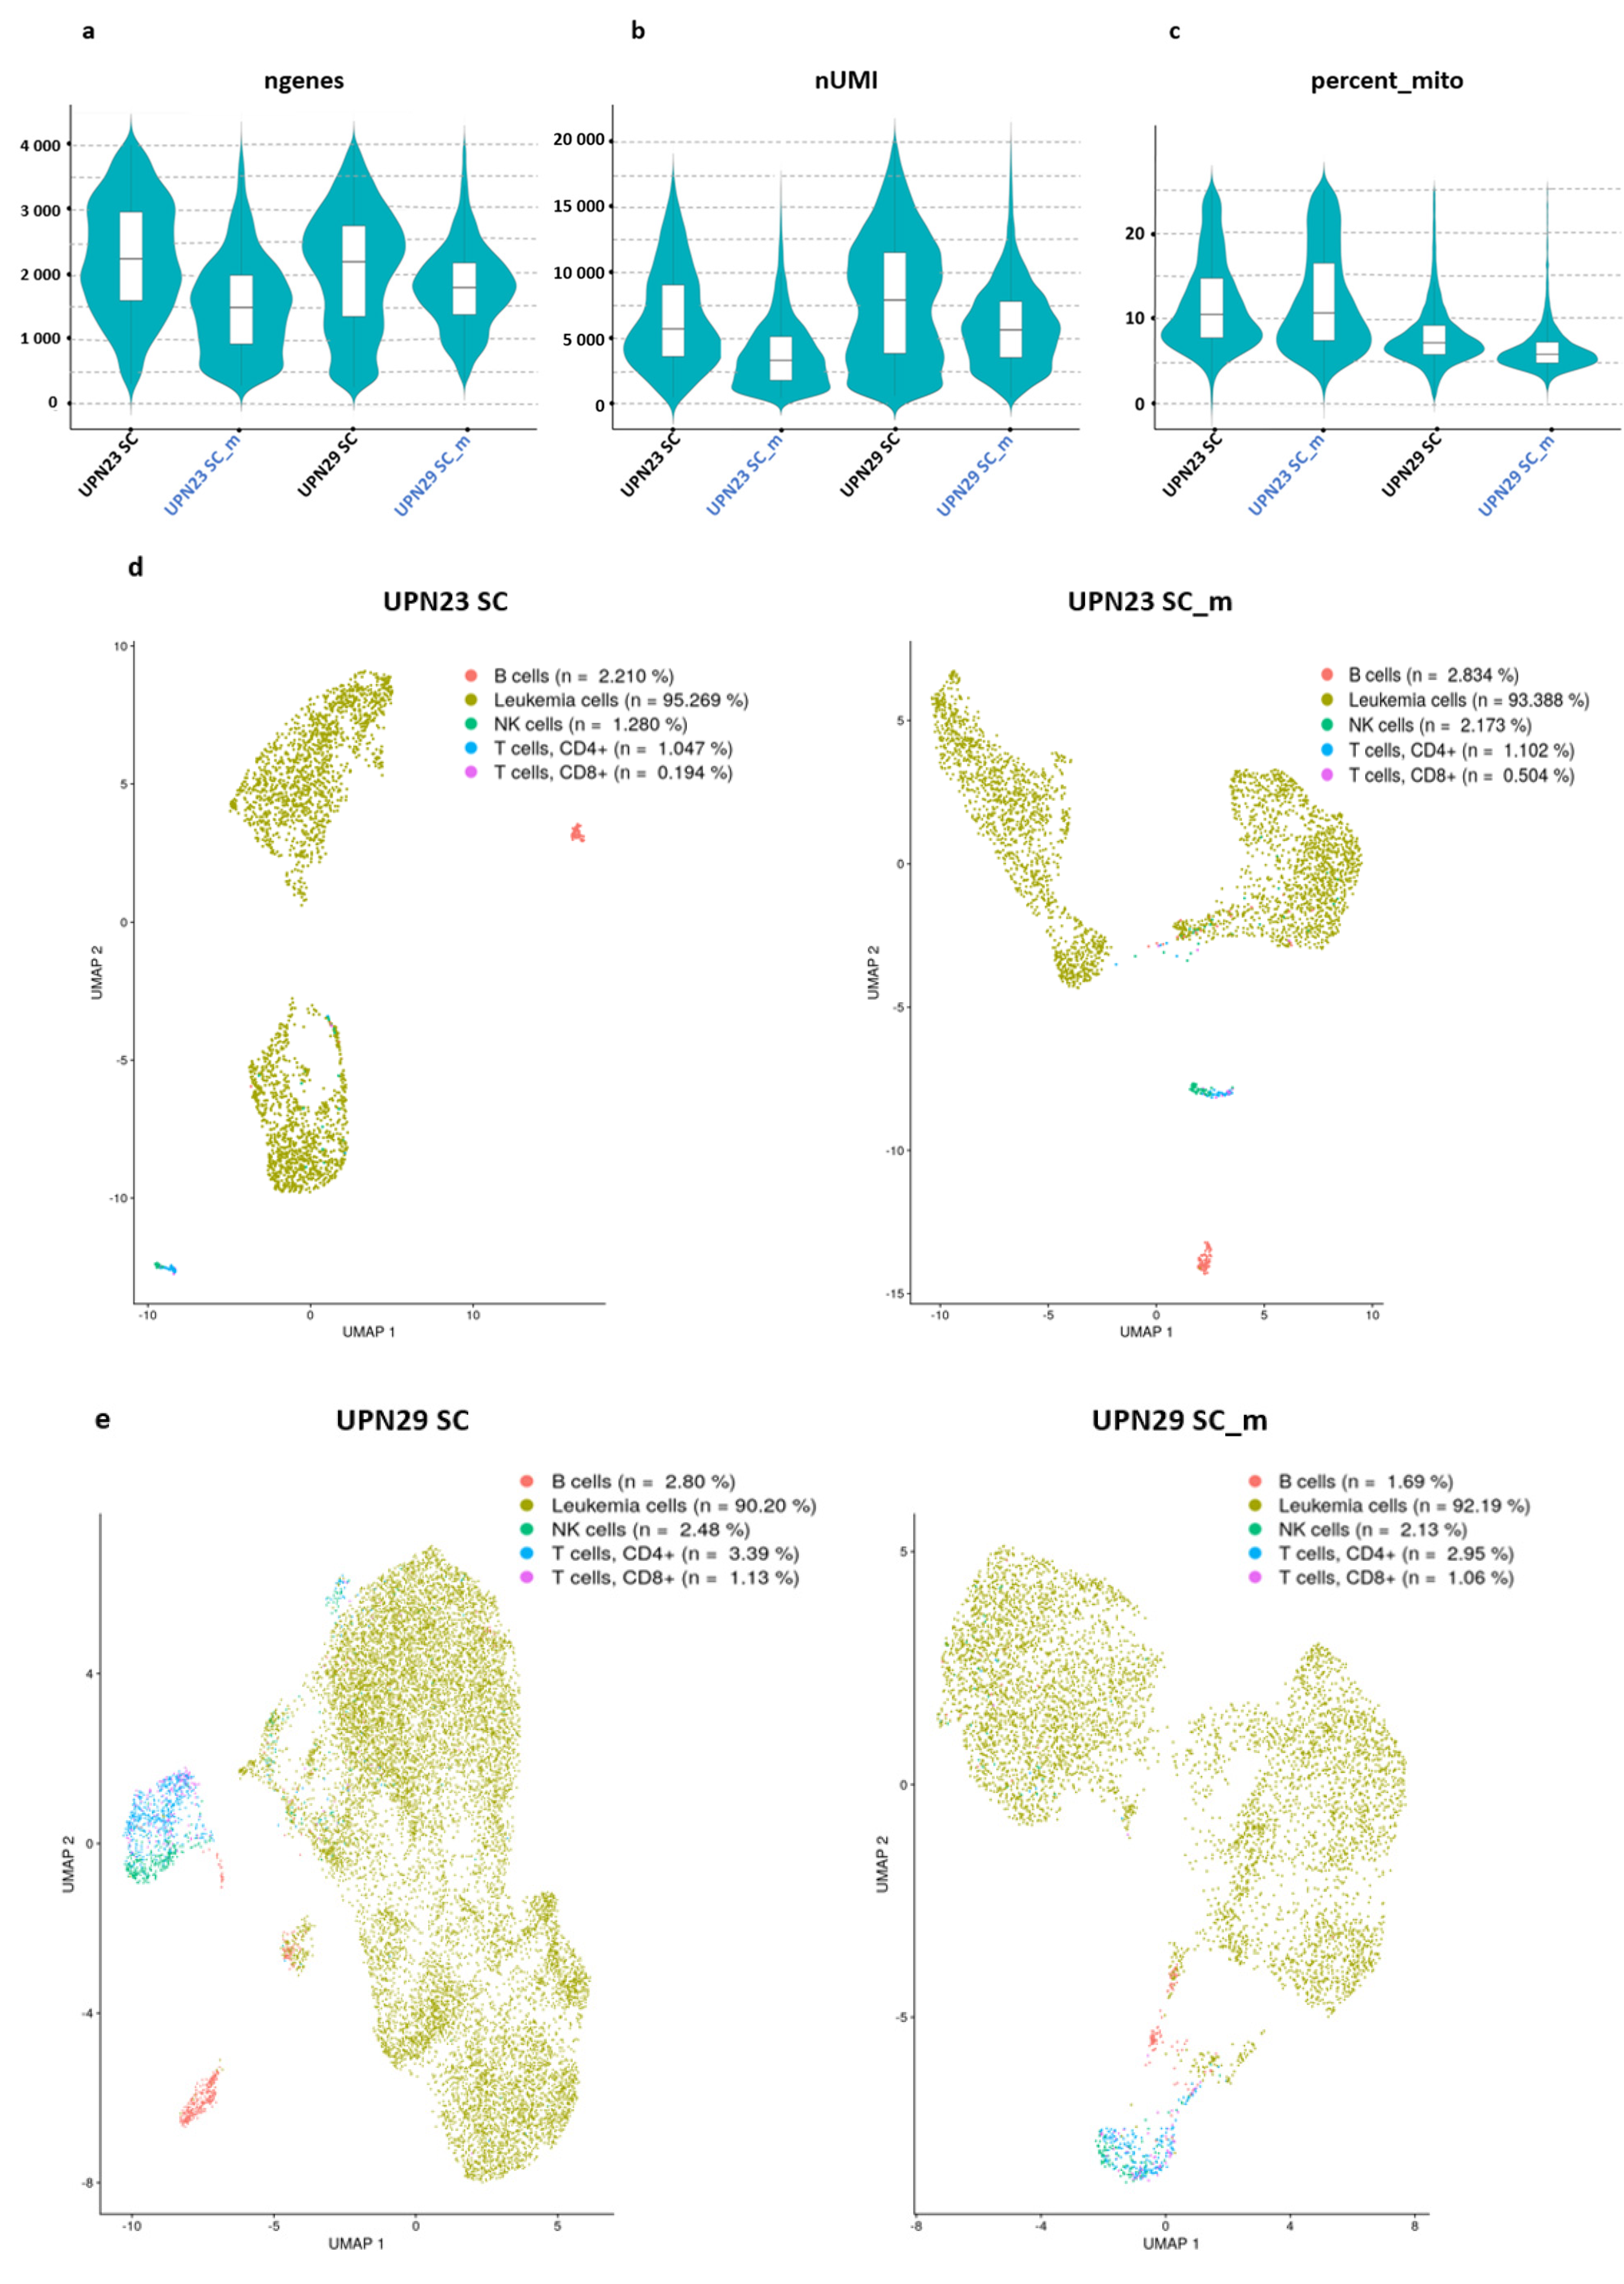
3.1. Transcript and Gene Numbers from Single Cell RNA-seq and Cell Hashing Are Similar
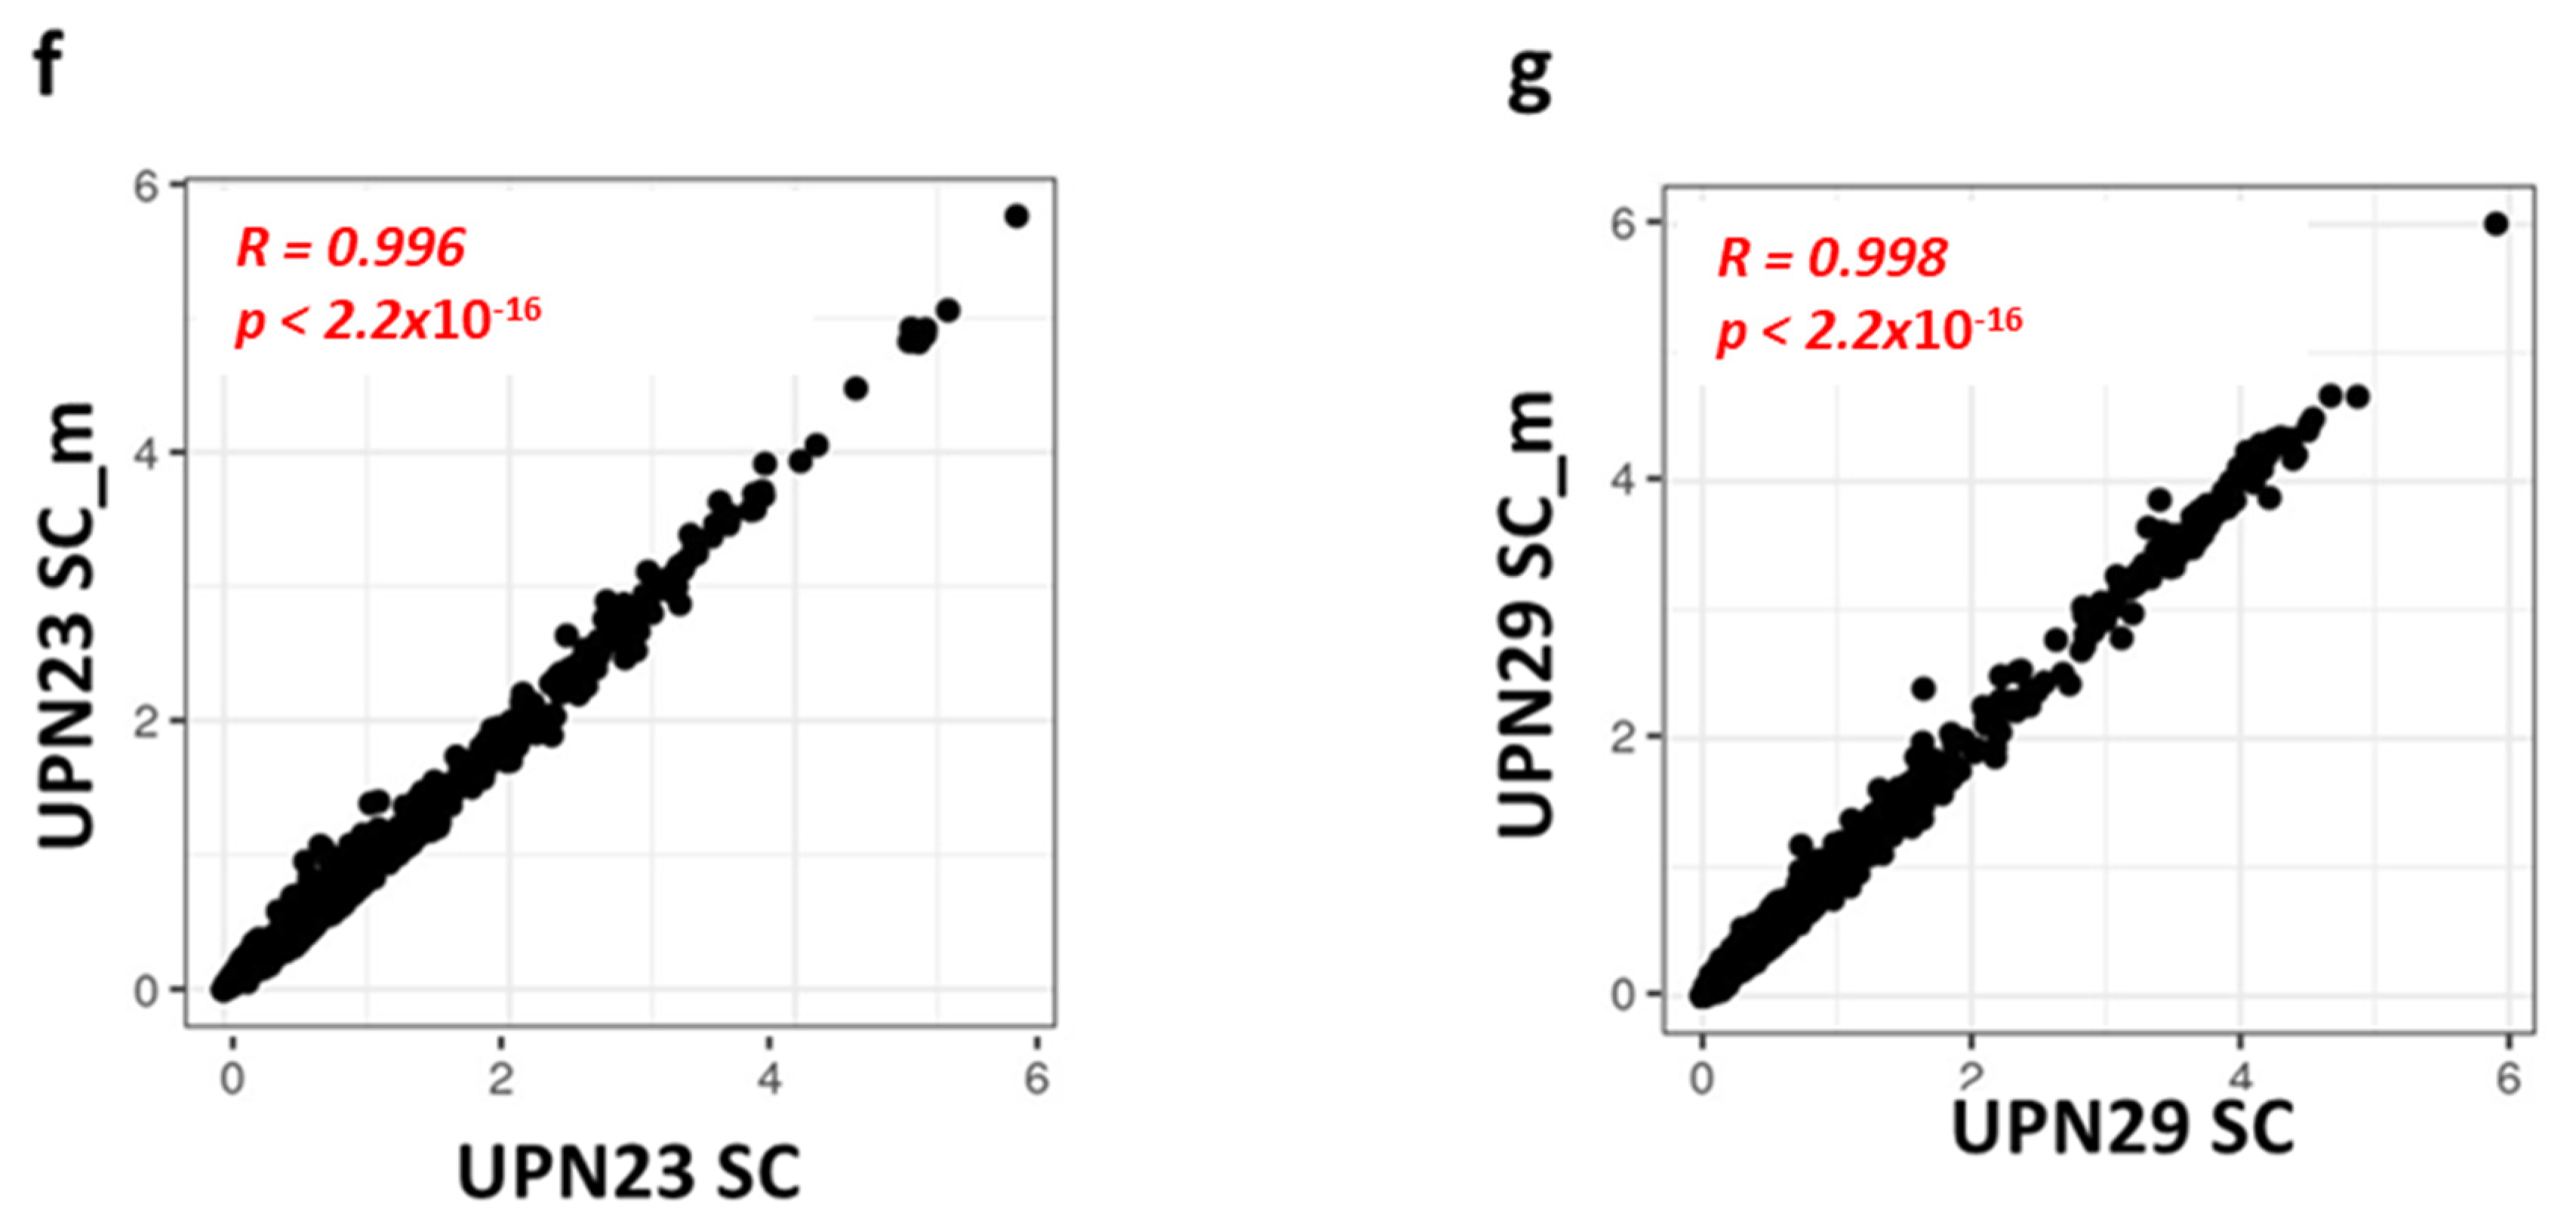
3.2. Gene Expression Levels Correlate between scRNA-seq and Cell Hashing
4. Conclusions
Supplementary Materials
Author Contributions
Funding
Institutional Review Board Statement
Informed Consent Statement
Data Availability Statement
Acknowledgments
Conflicts of Interest
Abbreviation
References
- Pimenta, D.B.; Varela, V.A.; Datoguia, T.S.; Caraciolo, V.B.; Lopes, G.H.; Pereira, W.O. The Bone Marrow Microenvironment Mechanisms in Acute Myeloid Leukemia. Front. Cell Dev. Biol. 2021, 9, 764698. [Google Scholar] [CrossRef]
- Vago, L.; Gojo, I. Immune escape and immunotherapy of acute myeloid leukemia. J. Clin. Investig. 2020, 130, 1552–1564. [Google Scholar] [CrossRef] [PubMed]
- Venton, G.; Pérez-Alea, M.; Baier, C.; Fournet, G.; Quash, G.; Labiad, Y.; Martin, G.; Sanderson, F.; Poullin, P.; Suchon, P.; et al. Aldehyde dehydrogenases inhibition eradicates leukemia stem cells while sparing normal progenitors. Blood Cancer J. 2016, 6, e469. [Google Scholar] [CrossRef] [PubMed]
- Bazinet, A.; Kadia, T.M. Changing paradigms in the treatment of acute myeloid leukemia in older patients. Clin. Adv. Hematol. Oncol. 2022, 20, 37–46. [Google Scholar] [PubMed]
- Madaci, L.; Colle, J.; Venton, G.; Farnault, L.; Loriod, B.; Costello, R. The contribution of single cell analysis of acute leukemia in the therapeutic strategy. Biomark. Res. 2021, 9, 50. [Google Scholar] [CrossRef] [PubMed]
- Arnone, M.; Konantz, M.; Hanns, P.; Paczulla Stanger, A.M.; Bertels, S.; Godavarthy, P.S.; Christopeit, M.; Lengerke, C. Acute Myeloid Leukemia Stem Cells: The Challenges of Phenotypic Heterogeneity. Cancers 2020, 12, E3742. [Google Scholar] [CrossRef]
- Noh, J.Y.; Seo, H.; Lee, J.; Jung, H. Immunotherapy in Hematologic Malignancies: Emerging Therapies and Novel Approaches. Int. J. Mol. Sci. 2020, 21, E8000. [Google Scholar] [CrossRef]
- Zhang, J.; Gu, Y.; Chen, B. Mechanisms of drug resistance in acute myeloid leukemia. OncoTargets Ther. 2019, 12, 1937–1945. [Google Scholar] [CrossRef] [Green Version]
- Teague, R.M.; Kline, J. Immune evasion in acute myeloid leukemia: Current concepts and future directions. J. Immunother. Cancer 2013, 1, 13. [Google Scholar] [CrossRef] [Green Version]
- van Luijn, M.M.; Chamuleau, M.E.D.; Ossenkoppele, G.J.; van de Loosdrecht, A.A.; Marieke van Ham, S. Tumor immune escape in acute myeloid leukemia: Class II-associated invariant chain peptide expression as result of deficient antigen presentation. Oncoimmunology 2012, 1, 211–213. [Google Scholar] [CrossRef] [Green Version]
- Farawela, H.M.; Khorshied, M.M.; Kassem, N.M.; Kassem, H.A.; Zawam, H.M. The clinical relevance and prognostic significance of adenosine triphosphate ATP-binding cassette (ABCB5) and multidrug resistance (MDR1) genes expression in acute leukemia: An Egyptian study. J. Cancer Res. Clin. Oncol. 2014, 140, 1323–1330. [Google Scholar] [CrossRef] [PubMed]
- Hatem, E.; El Banna, N.; Huang, M.-E. Multifaceted Roles of Glutathione and Glutathione-Based Systems in Carcinogenesis and Anticancer Drug Resistance. Antioxid. Redox Signal. 2017, 27, 1217–1234. [Google Scholar] [CrossRef]
- Schaich, M.; Soucek, S.; Thiede, C.; Ehninger, G.; Illmer, T.; SHG AML96 Study Group. MDR1 and MRP1 gene expression are independent predictors for treatment outcome in adult acute myeloid leukaemia. Br. J. Haematol. 2005, 128, 324–332. [Google Scholar] [CrossRef] [PubMed]
- Wei, A.H.; Roberts, A.W.; Spencer, A.; Rosenberg, A.S.; Siegel, D.; Walter, R.B.; Caenepeel, S.; Hughes, P.; McIver, Z.; Mezzi, K.; et al. Targeting MCL-1 in hematologic malignancies: Rationale and progress. Blood Rev. 2020, 44, 100672. [Google Scholar] [CrossRef] [PubMed]
- Craig, F.E.; Foon, K.A. Flow cytometric immunophenotyping for hematologic neoplasms. Blood 2008, 111, 3941–3967. [Google Scholar] [CrossRef] [Green Version]
- Bendall, S.C.; Nolan, G.P.; Roederer, M.; Chattopadhyay, P.K. A deep profiler’s guide to cytometry. Trends Immunol. 2012, 33, 323–332. [Google Scholar] [CrossRef] [PubMed] [Green Version]
- Haque, A.; Engel, J.; Teichmann, S.A.; Lönnberg, T. A practical guide to single cell RNA-sequencing for biomedical research and clinical applications. Genome Med. 2017, 9, 75. [Google Scholar] [CrossRef]
- Potter, S.S. Single cell RNA sequencing for the study of development, physiology and disease. Nat. Rev. Nephrol. 2018, 14, 479–492. [Google Scholar] [CrossRef]
- Hwang, B.; Lee, J.H.; Bang, D. Single cell RNA sequencing technologies and bioinformatics pipelines. Exp. Mol. Med. 2018, 50, 1–14. [Google Scholar] [CrossRef] [Green Version]
- Nayak, R.; Hasija, Y. A hitchhiker’s guide to single cell transcriptomics and data analysis pipelines. Genomics 2021, 113, 606–619. [Google Scholar] [CrossRef]
- Zhang, L.; Chen, D.; Song, D.; Liu, X.; Zhang, Y.; Xu, X.; Wang, X. Clinical and translational values of spatial transcriptomics. Signal Transduct. Target. Ther. 2022, 7, 111. [Google Scholar] [CrossRef]
- Zhang, Y.; Wang, D.; Peng, M.; Tang, L.; Ouyang, J.; Xiong, F.; Guo, C.; Tang, Y.; Zhou, Y.; Liao, Q.; et al. Single cell RNA sequencing in cancer research. J. Exp. Clin. Cancer Res. 2021, 40, 81. [Google Scholar] [CrossRef] [PubMed]
- Yu, X.; Zhang, L.; Chaudhry, A.; Rapaport, A.S.; Ouyang, W. Unravelling the heterogeneity and dynamic relationships of tumor-infiltrating T cells by single cell RNA sequencing analysis. J. Leukoc. Biol. 2020, 107, 917–932. [Google Scholar] [CrossRef] [PubMed] [Green Version]
- Papalexi, E.; Satija, R. Single cell RNA sequencing to explore immune cell heterogeneity. Nat. Rev. Immunol. 2018, 18, 35–45. [Google Scholar] [CrossRef] [PubMed]
- Stower, H. Single cell insights into neurology. Nat. Med. 2019, 25, 1799. [Google Scholar] [CrossRef] [PubMed]
- Stetson, L.C.; Balasubramanian, D.; Ribeiro, S.P.; Stefan, T.; Gupta, K.; Xu, X.; Fourati, S.; Roe, A.; Jackson, Z.; Schauner, R.; et al. Single cell RNA sequencing of AML initiating cells reveals RNA-based evolution during disease progression. Leukemia 2021, 35, 2799–2812. [Google Scholar] [CrossRef]
- Tikhonova, A.N.; Dolgalev, I.; Hu, H.; Sivaraj, K.K.; Hoxha, E.; Cuesta-Domínguez, Á.; Pinho, S.; Akhmetzyanova, I.; Gao, J.; Witkowski, M.; et al. The bone marrow microenvironment at single cell resolution. Nature 2019, 569, 222–228. [Google Scholar] [CrossRef]
- van Galen, P.; Hovestadt, V.; Wadsworth Ii, M.H.; Hughes, T.K.; Griffin, G.K.; Battaglia, S.; Verga, J.A.; Stephansky, J.; Pastika, T.J.; Lombardi Story, J.; et al. Single cell RNA-Seq Reveals AML Hierarchies Relevant to Disease Progression and Immunity. Cell 2019, 176, 1265–1281.e24. [Google Scholar] [CrossRef] [Green Version]
- Zhai, Y.; Singh, P.; Dolnik, A.; Brazda, P.; Atlasy, N.; Del Gaudio, N.; Döhner, K.; Döhner, H.; Minucci, S.; Martens, J.; et al. Longitudinal single cell transcriptomics reveals distinct patterns of recurrence in acute myeloid leukemia. Mol. Cancer 2022, 21, 166. [Google Scholar] [CrossRef]
- Wu, J.; Xiao, Y.; Sun, J.; Sun, H.; Chen, H.; Zhu, Y.; Fu, H.; Yu, C.; Weigao, E.; Lai, S.; et al. A single cell survey of cellular hierarchy in acute myeloid leukemia. J. Hematol. Oncol. 2020, 13, 128. [Google Scholar] [CrossRef]
- Petti, A.A.; Williams, S.R.; Miller, C.A.; Fiddes, I.T.; Srivatsan, S.N.; Chen, D.Y.; Fronick, C.C.; Fulton, R.S.; Church, D.M.; Ley, T.J. A general approach for detecting expressed mutations in AML cells using single cell RNA-sequencing. Nat. Commun. 2019, 10, 3660. [Google Scholar] [CrossRef] [Green Version]
- Stoeckius, M.; Zheng, S.; Houck-Loomis, B.; Hao, S.; Yeung, B.Z.; Mauck, W.M.; Smibert, P.; Satija, R. Cell Hashing with barcoded antibodies enables multiplexing and doublet detection for single cell genomics. Genome Biol. 2018, 19, 224. [Google Scholar] [CrossRef] [Green Version]
- Stoeckius, M.; Hafemeister, C.; Stephenson, W.; Houck-Loomis, B.; Chattopadhyay, P.K.; Swerdlow, H.; Satija, R.; Smibert, P. Simultaneous epitope and transcriptome measurement in single cells. Nat. Methods 2017, 14, 865–868. [Google Scholar] [CrossRef] [Green Version]
- Peterson, V.M.; Zhang, K.X.; Kumar, N.; Wong, J.; Li, L.; Wilson, D.C.; Moore, R.; McClanahan, T.K.; Sadekova, S.; Klappenbach, J.A. Multiplexed quantification of proteins and transcripts in single cells. Nat. Biotechnol. 2017, 35, 936–939. [Google Scholar] [CrossRef]
- Shahi, P.; Kim, S.C.; Haliburton, J.R.; Gartner, Z.J.; Abate, A.R. Abseq: Ultrahigh-throughput single cell protein profiling with droplet microfluidic barcoding. Sci. Rep. 2017, 14, 44447. [Google Scholar] [CrossRef] [Green Version]
- Milazzo, G.; Perini, G.; Giorgi, F.M. Single cell Sequencing Identifies Master Regulators Affected by Panobinostat in Neuroblastoma Cells. Genes 2022, 13, 2240. [Google Scholar] [CrossRef] [PubMed]
- Pankaew, S.; Grosjean, C.; Quessada, J.; Loosveld, M.; Potier, D.; Payet-Bornet, D.; Nozais, M. Multiplexed single cell RNA-sequencing of mouse thymic and splenic samples. STAR Protoc. 2021, 3, 101041. [Google Scholar] [CrossRef] [PubMed]
- English, D.; Andersen, B.R. Single-step separation of red blood cells. Granulocytes and mononuclear leukocytes on discontinuous density gradients of Ficoll-Hypaque. J. Immunol. Methods 1974, 5, 249–252. [Google Scholar] [CrossRef] [PubMed]
- Zheng, G.X.Y.; Terry, J.M.; Belgrader, P.; Ryvkin, P.; Bent, Z.W.; Wilson, R.; Ziraldo, S.B.; Wheeler, T.D.; McDermott, G.P.; Zhu, J.; et al. Massively parallel digital transcriptional profiling of single cells. Nat. Commun. 2017, 8, 14049. [Google Scholar] [CrossRef] [Green Version]
- McFarland, J.M.; Paolella, B.R.; Warren, A.; Geiger-Schuller, K.; Shibue, T.; Rothberg, M.; Kuksenko, O.; Colgan, W.N.; Jones, A.; Chambers, E.; et al. Multiplexed single cell transcriptional response profiling to define cancer vulnerabilities and therapeutic mechanism of action. Nat. Commun. 2020, 11, 4296. [Google Scholar] [CrossRef]
- Madaci, L.; Farnault, L.; Abbou, N.; Gabert, J.; Venton, G.; Costello, R. Impact of Next-Generation Sequencing in Diagnosis, Prognosis and Therapeutic Management of Acute Myeloid Leukemia/Myelodysplastic Neoplasms. Cancers 2023, 15, 3280. [Google Scholar] [CrossRef]


| Sample | UPN23 | UPN29 |
|---|---|---|
| Sex | F | M |
| Age | 62 | 47 |
| Nature of samples | Blood | Blood |
| % Blasts in blood | 92% | 83% |
| Cytology | AML4 | AML4 |
| Prognostic group | Adverse | Favorable |
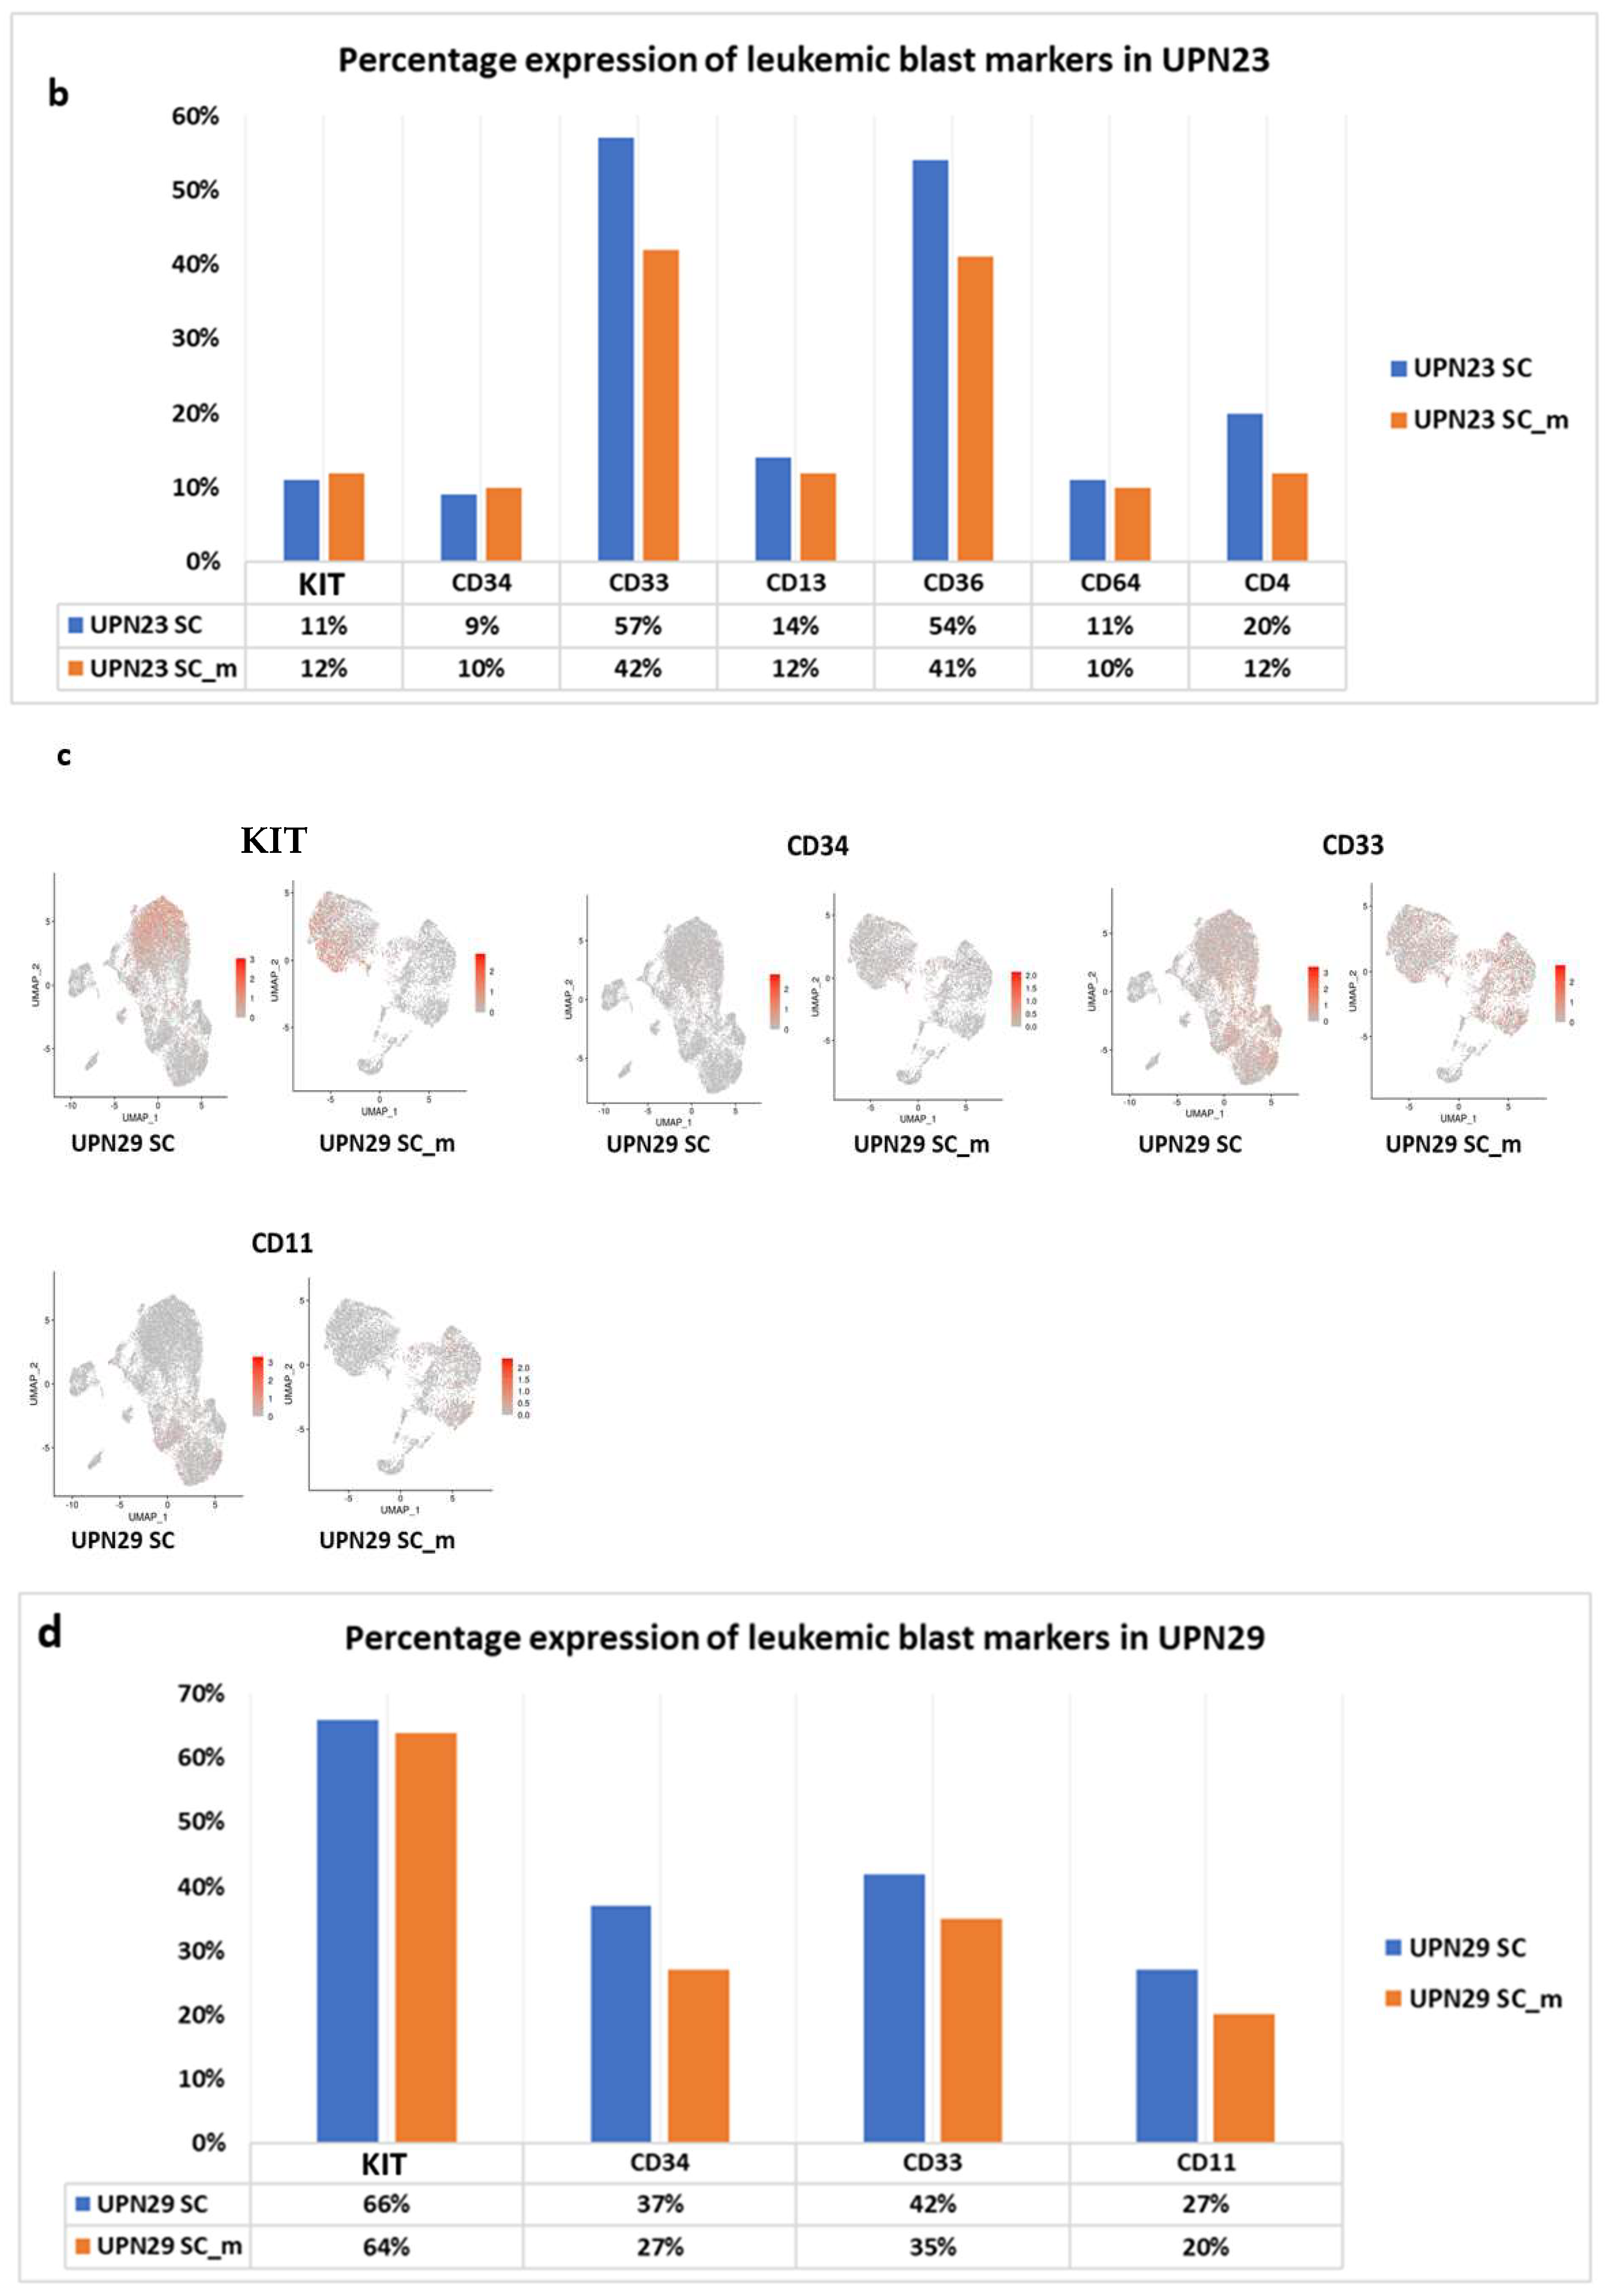
| Phenotype | CD117, CD13, CD33, CD34 (myeloid blasts) CD64, CD4low, CD33 fort, CD36 (monocytic blasts) | CD117, CD34, CD33, CD11. |
| Cytogenetic | 46XX, t(9;22)(p22;q23) | 46XY, inv(16) |
| Genetic abnormalities | FLT 3—ITD, EVI1 et WT1 | CBFβ |
| Sample | Estimated Number of Cells | Total Read Number | Mean Reads per Cell | Median Genes per Cell |
|---|---|---|---|---|
| UPN23 SC | 4390 | 171,943,491 | 39,167 | 1660 |
| UPN23 SC-m | 5601 | 207,650,556 | 37,100 | 978 |
| UPN29 SC | 16,645 | 711,710,869 | 42,758 | 2191 |
| UPN29 SC-m | 6480 | 341,065,053 | 52,633 | 1763 |
Disclaimer/Publisher’s Note: The statements, opinions and data contained in all publications are solely those of the individual author(s) and contributor(s) and not of MDPI and/or the editor(s). MDPI and/or the editor(s) disclaim responsibility for any injury to people or property resulting from any ideas, methods, instructions or products referred to in the content. |
© 2023 by the authors. Licensee MDPI, Basel, Switzerland. This article is an open access article distributed under the terms and conditions of the Creative Commons Attribution (CC BY) license (https://creativecommons.org/licenses/by/4.0/).
Share and Cite
Madaci, L.; Gard, C.; Nin, S.; Venton, G.; Rihet, P.; Puthier, D.; Loriod, B.; Costello, R. The Contribution of Multiplexing Single Cell RNA Sequencing in Acute Myeloid Leukemia. Diseases 2023, 11, 96. https://doi.org/10.3390/diseases11030096
Madaci L, Gard C, Nin S, Venton G, Rihet P, Puthier D, Loriod B, Costello R. The Contribution of Multiplexing Single Cell RNA Sequencing in Acute Myeloid Leukemia. Diseases. 2023; 11(3):96. https://doi.org/10.3390/diseases11030096
Chicago/Turabian StyleMadaci, Lamia, Charlyne Gard, Sébastien Nin, Geoffroy Venton, Pascal Rihet, Denis Puthier, Béatrice Loriod, and Régis Costello. 2023. "The Contribution of Multiplexing Single Cell RNA Sequencing in Acute Myeloid Leukemia" Diseases 11, no. 3: 96. https://doi.org/10.3390/diseases11030096