
Evaluation of Binding and Neutralizing Antibodies for Inactivated SARS-CoV-2 Vaccine Immunization

 , and
, and
Abstract
1. Introduction
2. Materials and Methods
2.1. Cell and Virus
2.2. Inactivated Vaccine Production and Immunization
2.3. Neutralizing Antibody Detection
2.4. ELISA Detection
2.5. Serum Dilution and Test
2.6. Statistics Analysis
3. Results
3.1. Comparing Positive Rates between S-IgG, N-IgG, and Nabs of Humans, Rhesus Macaques, and Hamsters
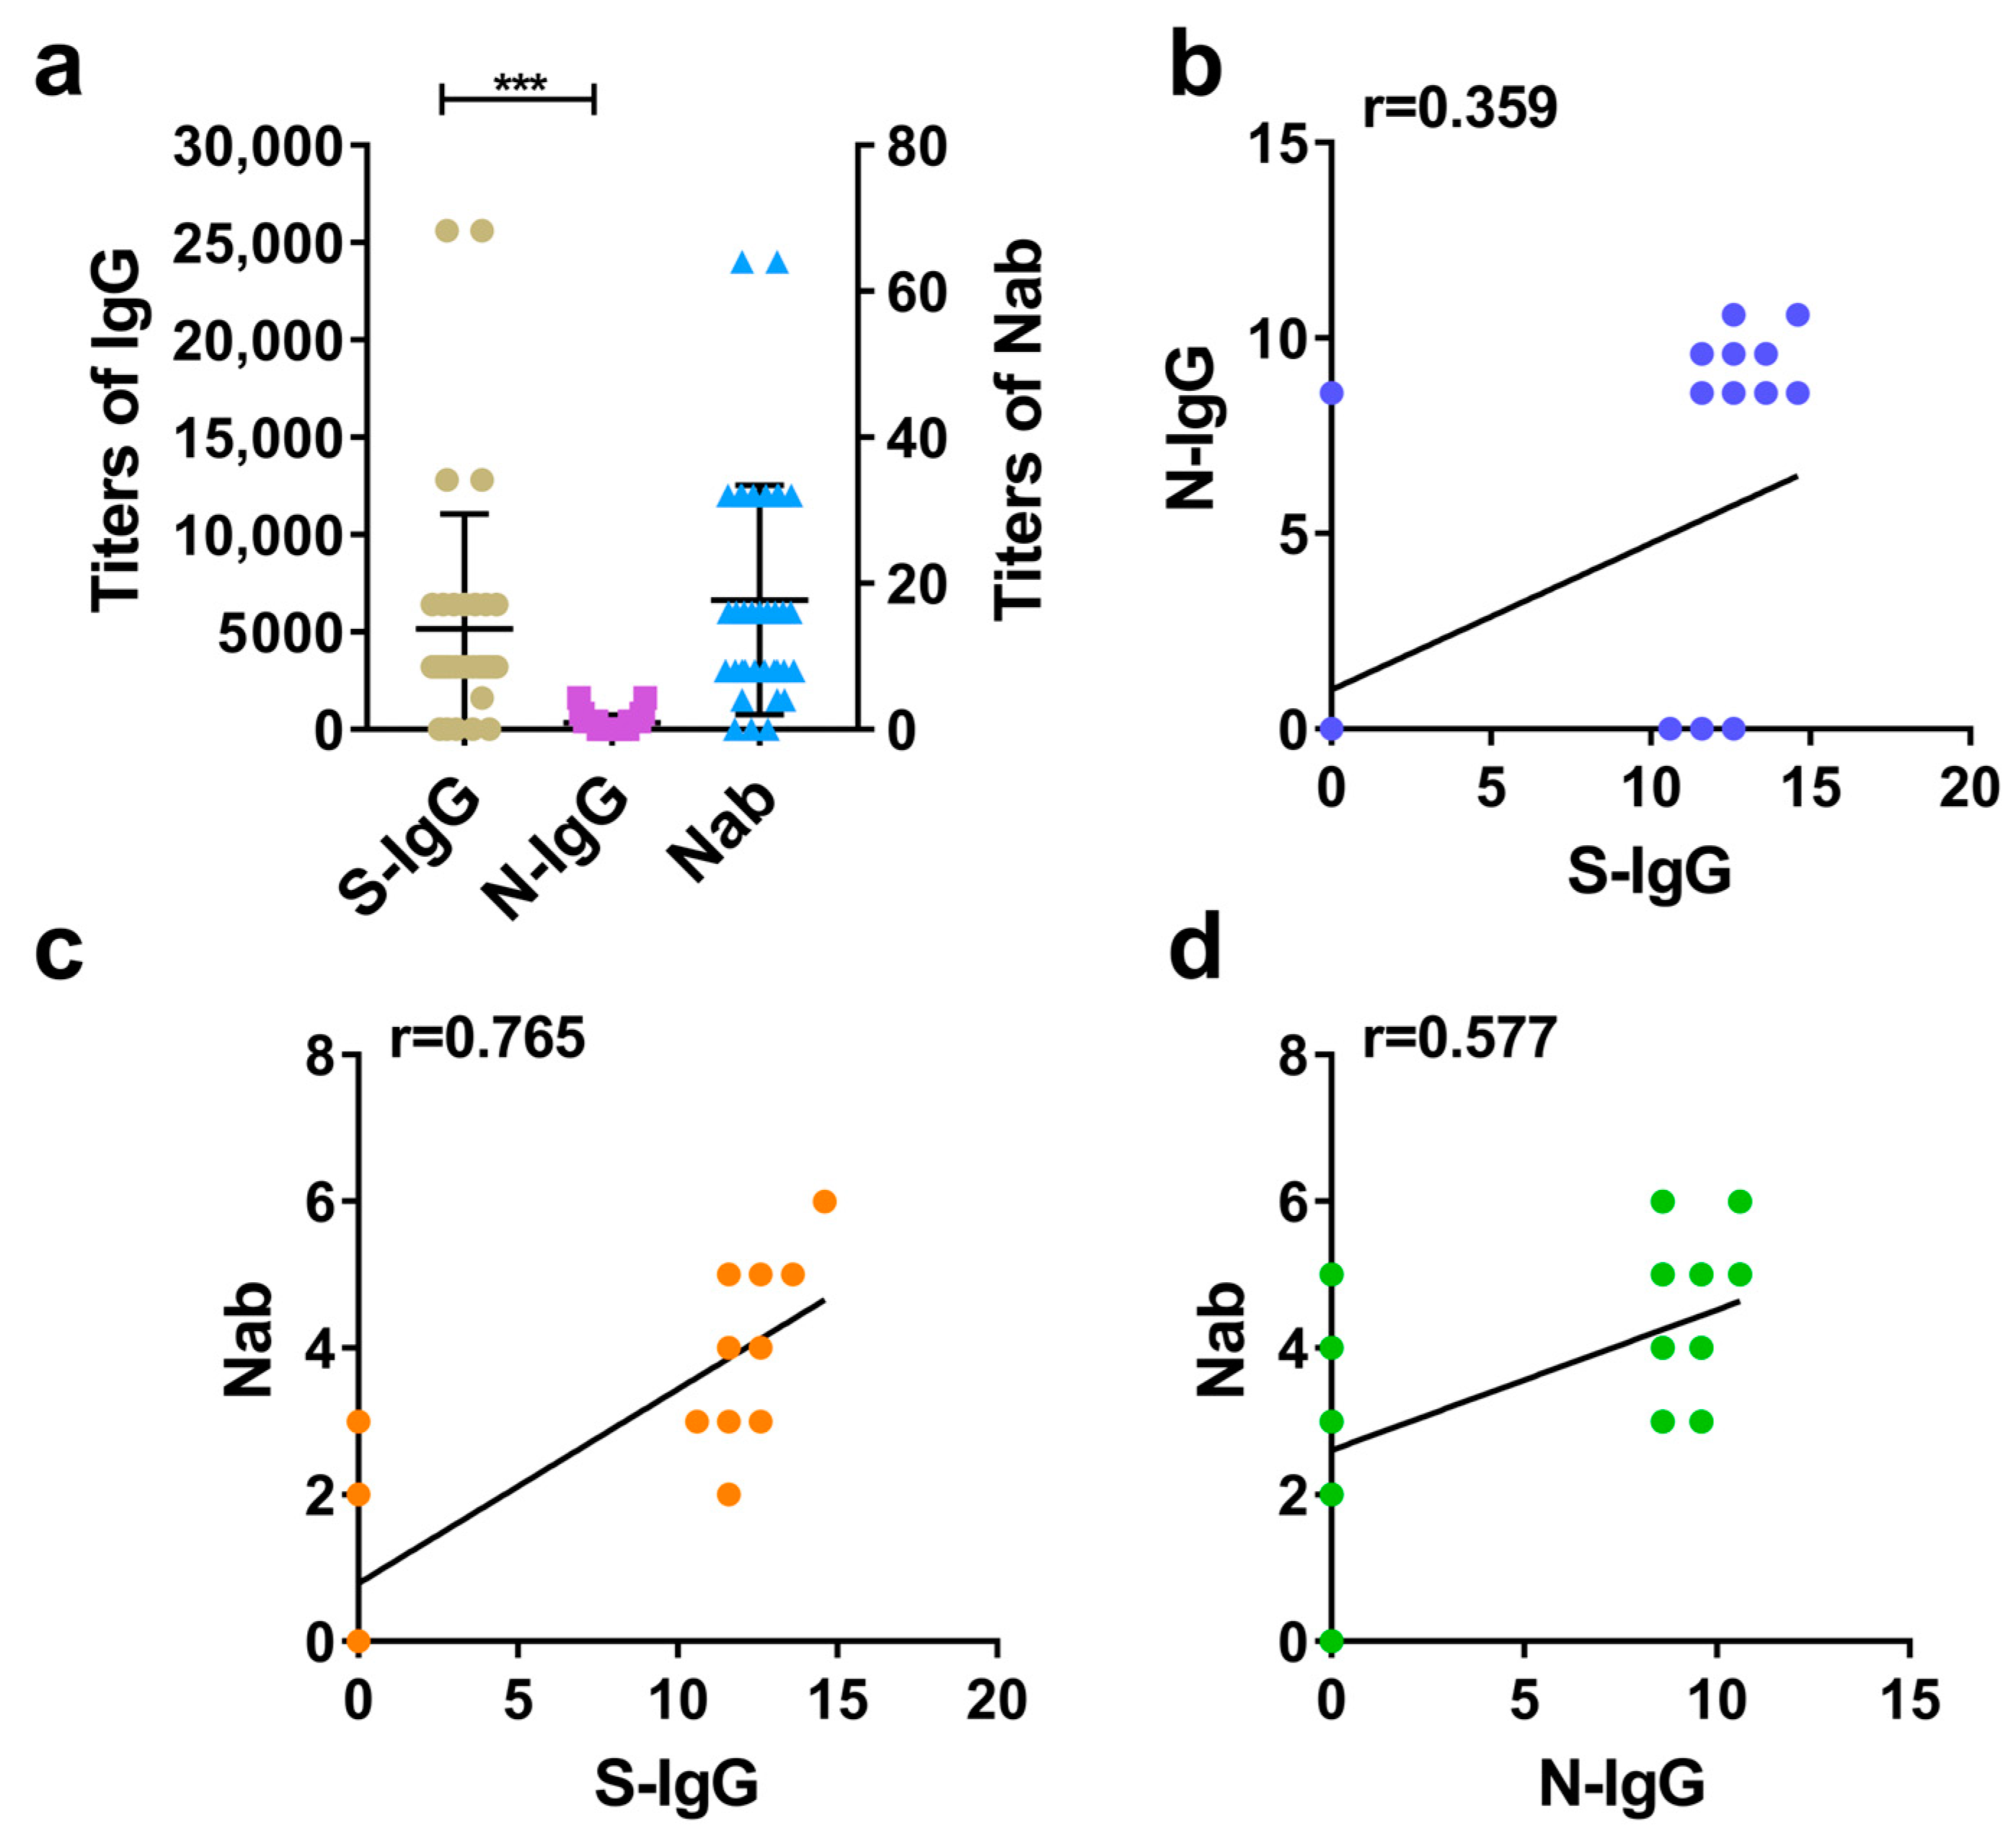
3.2. Comparison between S-IgG and N-IgG in Humans and Evaluation of Correlations between S-IgG, N-IgG, and Nabs
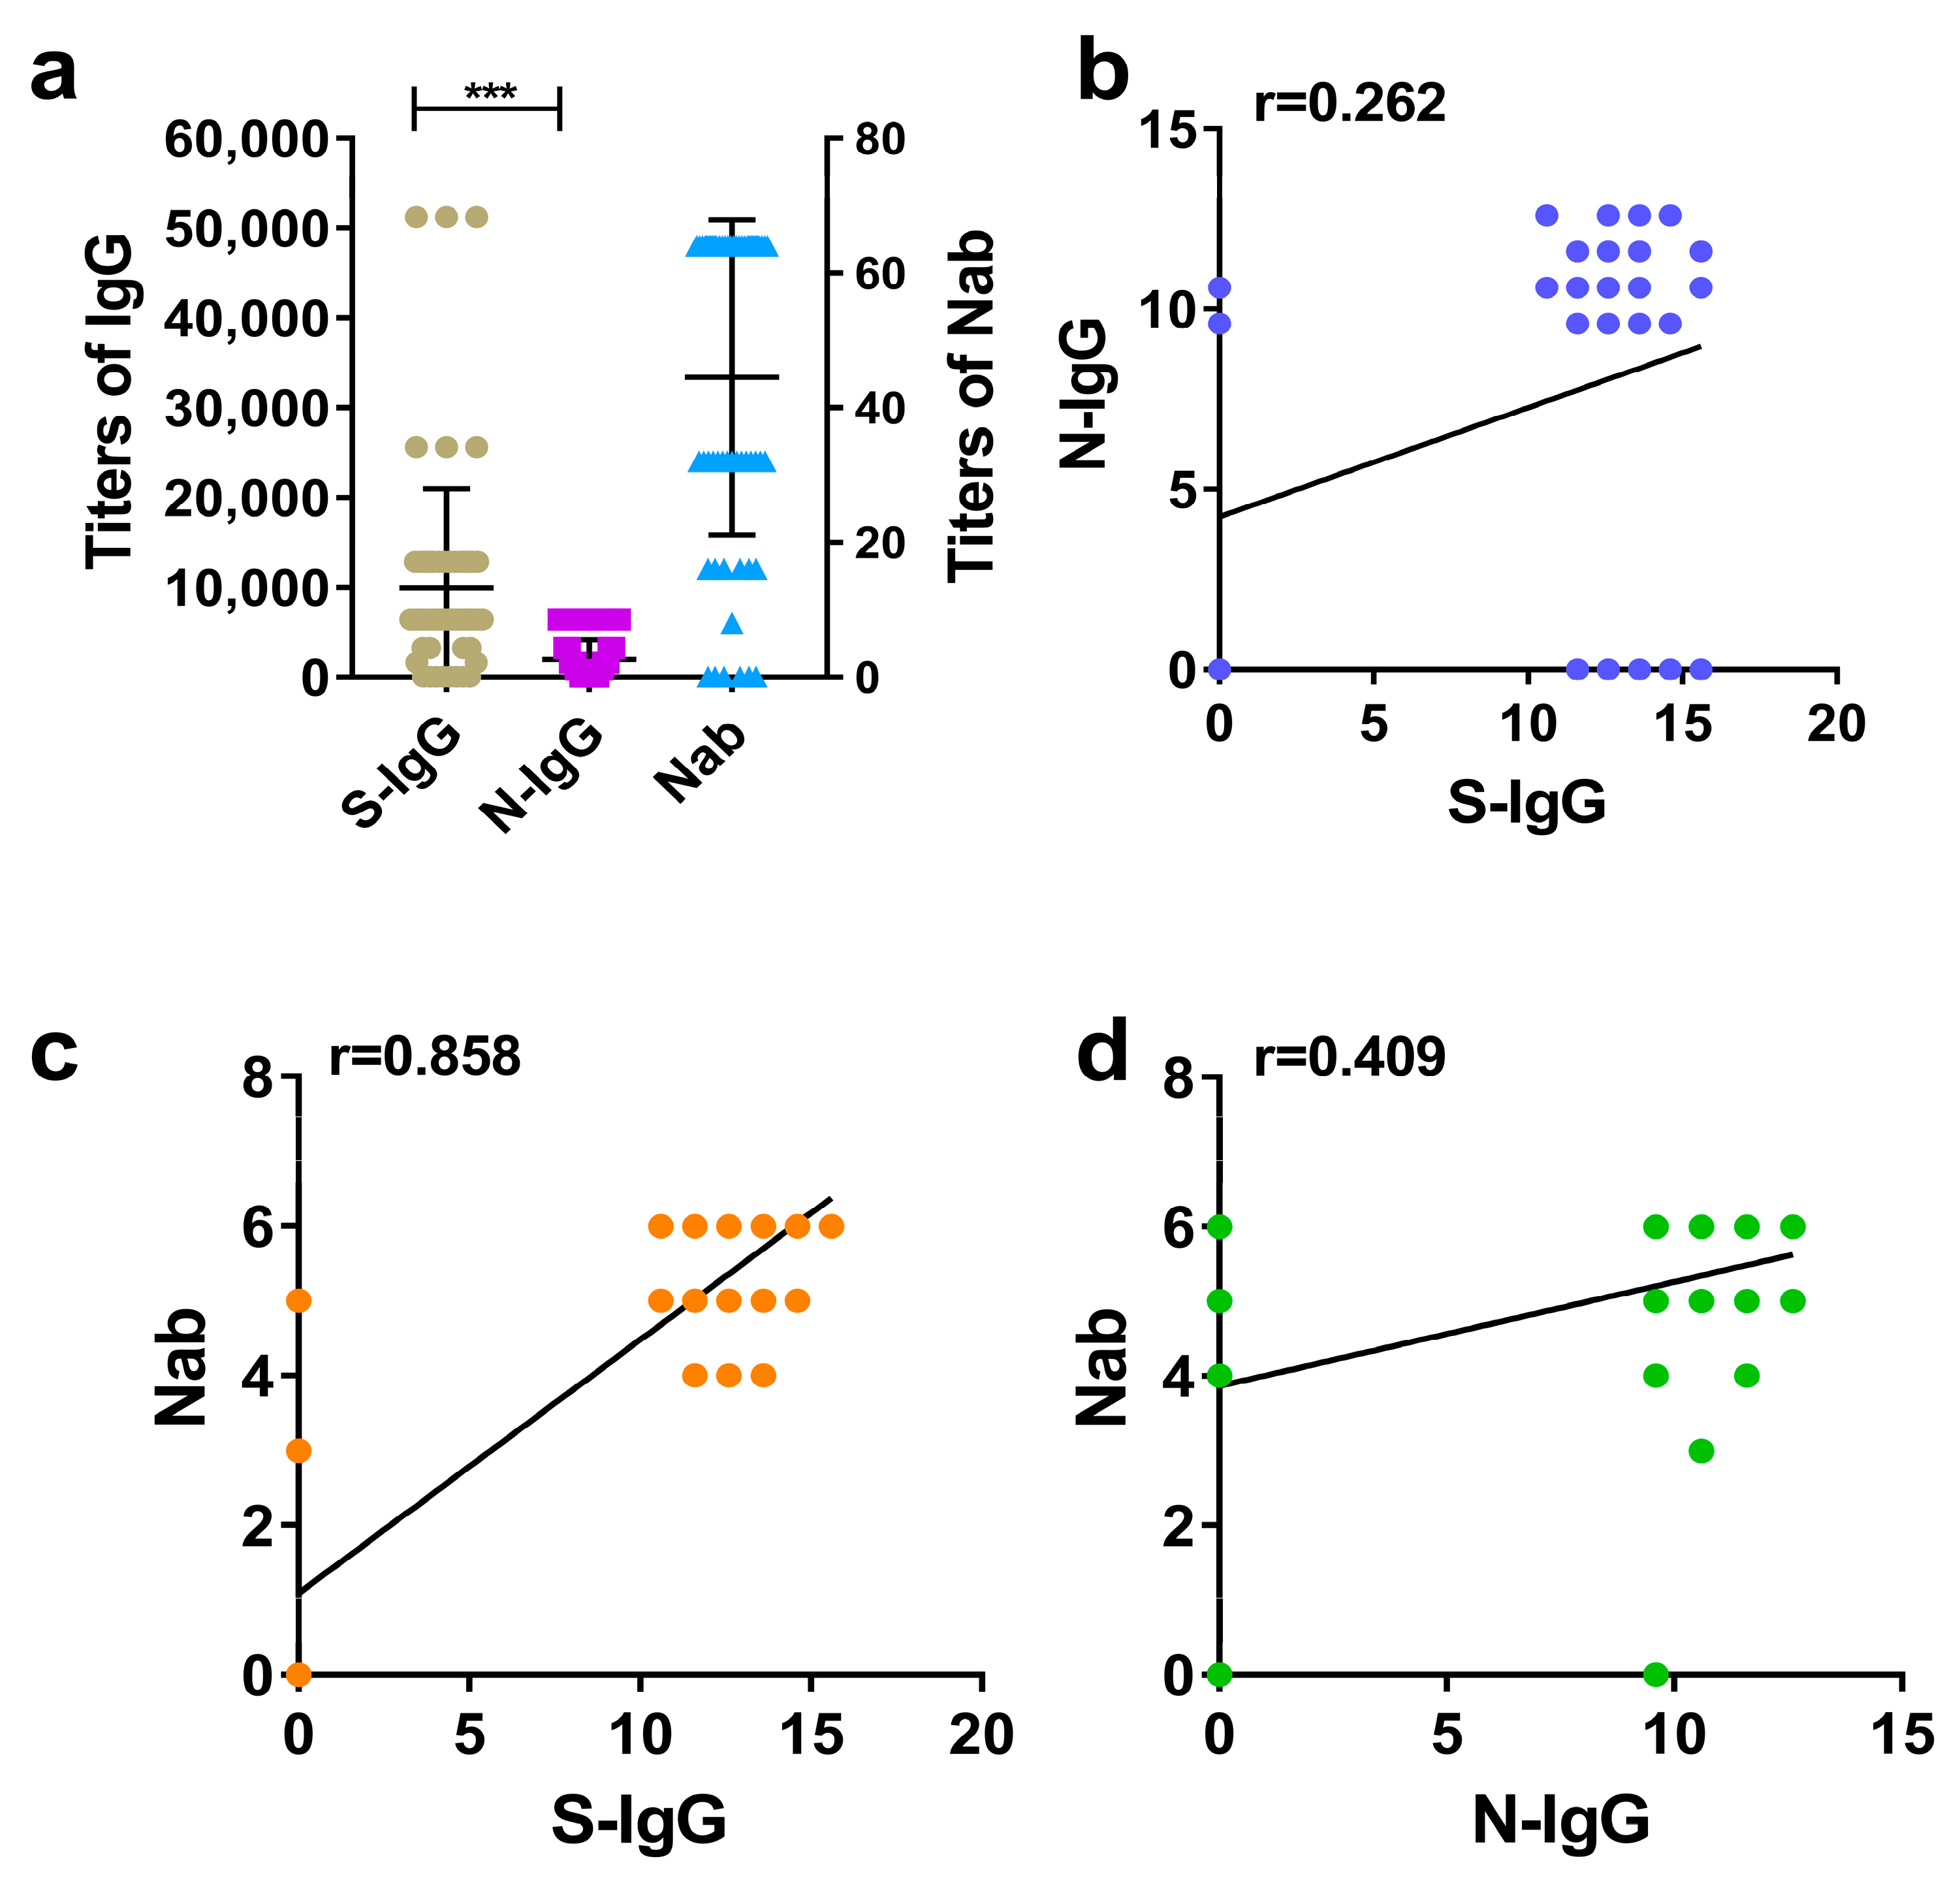
3.3. Comparison between S-IgG and N-IgG of Rhesus Macaques and Evaluation of Correlations between S-IgG, N-IgG, and Nabs
3.4. Comparison between S-IgG and N-IgG of Hamsters and Evaluation of Correlations between S-IgG, N-IgG, and Nabs
3.5. ROC Analysis of S-IgG and N-IgG Relating to Nabs in Humans, Rhesus Macaques, and Hamsters
4. Discussion
5. Conclusions
Author Contributions
Funding
Institutional Review Board Statement
Informed Consent Statement
Data Availability Statement
Acknowledgments
Conflicts of Interest
References
- Wang, J.; Peng, Y.; Xu, H.; Cui, Z.; Williams, R.O., 3rd. The COVID-19 Vaccine Race: Challenges and Opportunities in Vaccine Formulation. AAPS PharmSciTech 2020, 21, 225. [Google Scholar] [CrossRef] [PubMed]
- Baden, L.R.; El Sahly, H.M.; Essink, B.; Kotloff, K.; Frey, S.; Novak, R.; Diemert, D.; Spector, S.A.; Rouphael, N.; Creech, C.B.; et al. Efficacy and Safety of the mRNA-1273 SARS-CoV-2 Vaccine. N. Engl. J. Med. 2021, 384, 403–416. [Google Scholar] [CrossRef] [PubMed]
- Wrapp, D.; Wang, N.; Corbett, K.S.; Goldsmith, J.A.; Hsieh, C.-L.; Abiona, O.; Graham, B.S.; McLellan, J.S. Cryo-EM structure of the 2019-nCoV spike in the prefusion conformation. Science 2020, 367, 1260–1263. [Google Scholar] [CrossRef] [PubMed]
- Tai, W.; He, L.; Zhang, X.; Pu, J.; Voronin, D.; Jiang, S.; Zhou, Y.; Du, L. Characterization of the receptor-binding domain (RBD) of 2019 novel coronavirus: Implication for development of RBD potein as a viral attachment inhibitor and vaccine. Cell Mol. Immunol. 2020, 17, 613–620. [Google Scholar] [CrossRef] [PubMed]
- Walls, A.C.; Park, Y.J.; Tortorici, M.A.; Wall, A.; McGuire, A.T.; Veesler, D. Structure, Function, and Antigenicity of the SARS-CoV-2 Spike Glycoprotein. Cell 2020, 181, 281–292.e6. [Google Scholar] [CrossRef] [PubMed]
- Liu, L.; Wang, P.; Nair, M.S.; Yu, J.; Rapp, M.; Wang, Q.; Luo, Y.; Chan, J.F.; Sahi, V.; Figueroa, A.; et al. Potent neutralizing antibodies against multiple epitopes on SARS-CoV-2 spike. Nature 2020, 584, 450–456. [Google Scholar] [CrossRef] [PubMed]
- Corbett, K.S.; Edwards, D.K.; Leist, S.R.; Abiona, O.M.; Boyoglu-Barnum, S.; Gillespie, R.A.; Himansu, S.; Schäfer, A.; Ziwawo, C.T.; DiPiazza, A.T.; et al. SARS-CoV-2 mRNA vaccine design enabled by prototype pathogen preparedness. Nature 2020, 586, 567–571. [Google Scholar] [CrossRef] [PubMed]
- Hu, B.; Guo, H.; Zhou, P.; Shi, Z.L. Characteristics of SARS-CoV-2 and COVID-19. Nat. Rev. Microbiol. 2021, 19, 141–154. [Google Scholar] [CrossRef]
- Bai, Z.; Cao, Y.; Liu, W.; Li, J. The SARS-CoV-2 Nucleocapsid Protein and Its Role in Viral Structure, Biological Functions, and a Potential Target for Drug or Vaccine Mitigation. Viruses 2021, 13, 1115. [Google Scholar] [CrossRef] [PubMed]
- de Vries, R.D.; Rockx, B.; Haagmans, B.L.; Herfst, S.; Koopmans, M.P.; de Swart, R.L. Animal models of SARS-CoV-2 transmission. Curr. Opin. Virol. 2021, 50, 8–16. [Google Scholar] [CrossRef] [PubMed]
- Higashimoto, Y.; Kozawa, K.; Miura, H.; Kawamura, Y.; Ihira, M.; Hiramatsu, H.; Suzuki, R.; Haga, K.; Takai-Todaka, R.; Sawada, A.; et al. Correlation between anti-S IgG and neutralizing antibody titers against three live SARS-CoV-2 variants in BNT162b2 vaccine recipients. Hum. Vaccine Immunother. 2022, 18, 2105611. [Google Scholar] [CrossRef] [PubMed]
- Rezaei, M.; Sadeghi, M.; Korourian, A.; Tabarsi, P.; Porabdollah, M.; Askari, E.; Mortaz, E.; Mahmoudi, S.; Marjani, M.; Velayati, A.A. Comparative evaluation of SARS-CoV-2 IgG assays against nucleocapsid and spike antigens. Hum. Antibodies 2021, 29, 109–113. [Google Scholar] [CrossRef] [PubMed]
- Brismar, J.; Jacobsson, B.; Obuchowski, N.A. Understanding receiver-operating-characteristic curves: A graphic approach. AJR Am. J. Roentgenol. 1991, 157, 1119–1121. [Google Scholar] [CrossRef] [PubMed]
- BBoudewijns, R.; Thibaut, H.J.; Kaptein, S.J.F.; Li, R.; Vergote, V.; Seldeslachts, L.; Van Weyenbergh, J.; De Keyzer, C.; Bervoets, L.; Sharma, S.; et al. STAT2 signaling restricts viral dissemination but drives severe pneumonia in SARS-CoV-2 infected hamsters. Nat. Commun. 2020, 11, 5838. [Google Scholar] [CrossRef] [PubMed]
- Liu, W.; Liu, L.; Kou, G.; Zheng, Y.; Ding, Y.; Ni, W.; Wang, Q.; Tan, L.; Wu, W.; Tang, S.; et al. Evaluation of Nucleocapsid and Spike Protein-Based Enzyme-linked Immuno-sorbent Assays for Detecting Antibodies against SARS-CoV-2. J. Clin. Microbiol. 2020, 58, e00461-20. [Google Scholar] [CrossRef] [PubMed]
- Iyer, A.S.; Jones, F.K.; Nodoushani, A.; Kelly, M.; Becker, M.; Slater, D.; Mills, R.; Teng, E.; Kamruzzaman, M.; Garcia-Beltran, W.F.; et al. Dynamics and significance of the antibody response to SARS-CoV-2 infection. medRxiv 2020, 20, 2020.07.18.20155374. [Google Scholar]
- Krähling, V.; Halwe, S.; Rohde, C.; Becker, D.; Berghöfer, S.; Dahlke, C.; Eickmann, M.; Ercanoglu, M.S.; Gieselmann, L.; Herwig, A.; et al. Development and characterization of an indirect ELISA to detect SARS-CoV-2 spike protein-specific antibodies. J. Immunol. Methods 2021, 490, 112958. [Google Scholar] [CrossRef] [PubMed]
- Mazzini, L.; Martinuzzi, D.; Hyseni, I.; Benincasa, L.; Molesti, E.; Casa, E.; Lapini, G.; Piu, P.; Trombetta, C.M.; Marchi, S.; et al. Comparative analyses of SARS-CoV-2(IgG, IgM, IgA) and neutralizing antibodies from human serum samples. J. Immunol. Methods 2021, 489, 112937. [Google Scholar] [CrossRef] [PubMed]


| Species | Positive Rate (%) | Consistency Rate (%) | |||
|---|---|---|---|---|---|
| S-IgG | N-IgG | Nab | (S-IgG)-Nab | (N-IgG)-Nab | |
| human | 91 (269/297) | 72 (213/297) | 95 (282/297) | 92 (274/297) | 70 (209/297) |
| rhesus macaque | 86 (30/35) | 54 (19/35) | 91 (32/35) | 94 (33/35) | 63 (22/35) |
| hamster | 87 (54/62) | 69 (43/62) | 90 (56/62) | 97 (60/62) | 76 (47/62) |
| Antibody Type | Human | Rhesus Macaque | Hamster | ||||||||||||
|---|---|---|---|---|---|---|---|---|---|---|---|---|---|---|---|
| AUC | SE | p | 95% CI | AUC | SE | p | 95% CI | AUC | SE | p | 95% CI | ||||
| Lower | Upper | Lower | Upper | Lower | Upper | ||||||||||
| S-IgG | 0.89 | 0.03 | 0.00 | 0.83 | 0.96 | 0.97 | 0.03 | 0.08 | 0.91 | 1.00 | 0.98 | 0.02 | 0.00 | 0.95 | 1.00 |
| N-IgG | 0.65 | 0.07 | 0.05 | 0.51 | 0.79 | 0.80 | 0.09 | 0.09 | 0.61 | 0.97 | 0.84 | 0.06 | 0.01 | 0.73 | 0.95 |
| S + N-IgG | 0.88 | 0.04 | 0.00 | 0.81 | 0.96 | 0.98 | 0.20 | 0.01 | 0.94 | 1.00 | 1.00 | 0.00 | 0.00 | 1.00 | 1.00 |
| Species | S-IgG | N-IgG | ||||||
|---|---|---|---|---|---|---|---|---|
| AUC | Cutoff | Specificity | Sensitivity | AUC | Cutoff | Specificity | Sensitivity | |
| human | 0.89 | 600 | 0.93 | 0.71 | 0.65 | 600 | 0.53 | 0.71 |
| rhesus macaque | 0.97 | 800 | 1.00 | 0.94 | 0.80 | 200 | 1.00 | 0.59 |
| hamster | 0.98 | 800 | 1.00 | 0.96 | 0.84 | 1200 | 1.00 | 0.59 |
Disclaimer/Publisher’s Note: The statements, opinions and data contained in all publications are solely those of the individual author(s) and contributor(s) and not of MDPI and/or the editor(s). MDPI and/or the editor(s) disclaim responsibility for any injury to people or property resulting from any ideas, methods, instructions or products referred to in the content. |
© 2024 by the authors. Licensee MDPI, Basel, Switzerland. This article is an open access article distributed under the terms and conditions of the Creative Commons Attribution (CC BY) license (https://creativecommons.org/licenses/by/4.0/).
Share and Cite
Zhao, H.; Jiang, G.; Li, C.; Che, Y.; Long, R.; Pu, J.; Zhang, Y.; Li, D.; Liao, Y.; Yu, L.; et al. Evaluation of Binding and Neutralizing Antibodies for Inactivated SARS-CoV-2 Vaccine Immunization. Diseases 2024, 12, 67. https://doi.org/10.3390/diseases12040067
Zhao H, Jiang G, Li C, Che Y, Long R, Pu J, Zhang Y, Li D, Liao Y, Yu L, et al. Evaluation of Binding and Neutralizing Antibodies for Inactivated SARS-CoV-2 Vaccine Immunization. Diseases. 2024; 12(4):67. https://doi.org/10.3390/diseases12040067
Chicago/Turabian StyleZhao, Heng, Guorun Jiang, Cong Li, Yanchun Che, Runxiang Long, Jing Pu, Ying Zhang, Dandan Li, Yun Liao, Li Yu, and et al. 2024. "Evaluation of Binding and Neutralizing Antibodies for Inactivated SARS-CoV-2 Vaccine Immunization" Diseases 12, no. 4: 67. https://doi.org/10.3390/diseases12040067
APA StyleZhao, H., Jiang, G., Li, C., Che, Y., Long, R., Pu, J., Zhang, Y., Li, D., Liao, Y., Yu, L., Zhao, Y., Yuan, M., Li, Y., Fan, S., Liu, L., & Li, Q. (2024). Evaluation of Binding and Neutralizing Antibodies for Inactivated SARS-CoV-2 Vaccine Immunization. Diseases, 12(4), 67. https://doi.org/10.3390/diseases12040067