
Desmocollin-3 and Bladder Cancer

 , , , ,
  and
and
Abstract
1. Introduction
2. Materials and Methods
2.1. Bioinformatics Analysis
2.2. Statistical Analysis
3. Results
3.1. DSC3 Expression in Bladder Cancer
3.2. DSC3 Expression and Tumor Immune Infiltrate in Bladder Cancer
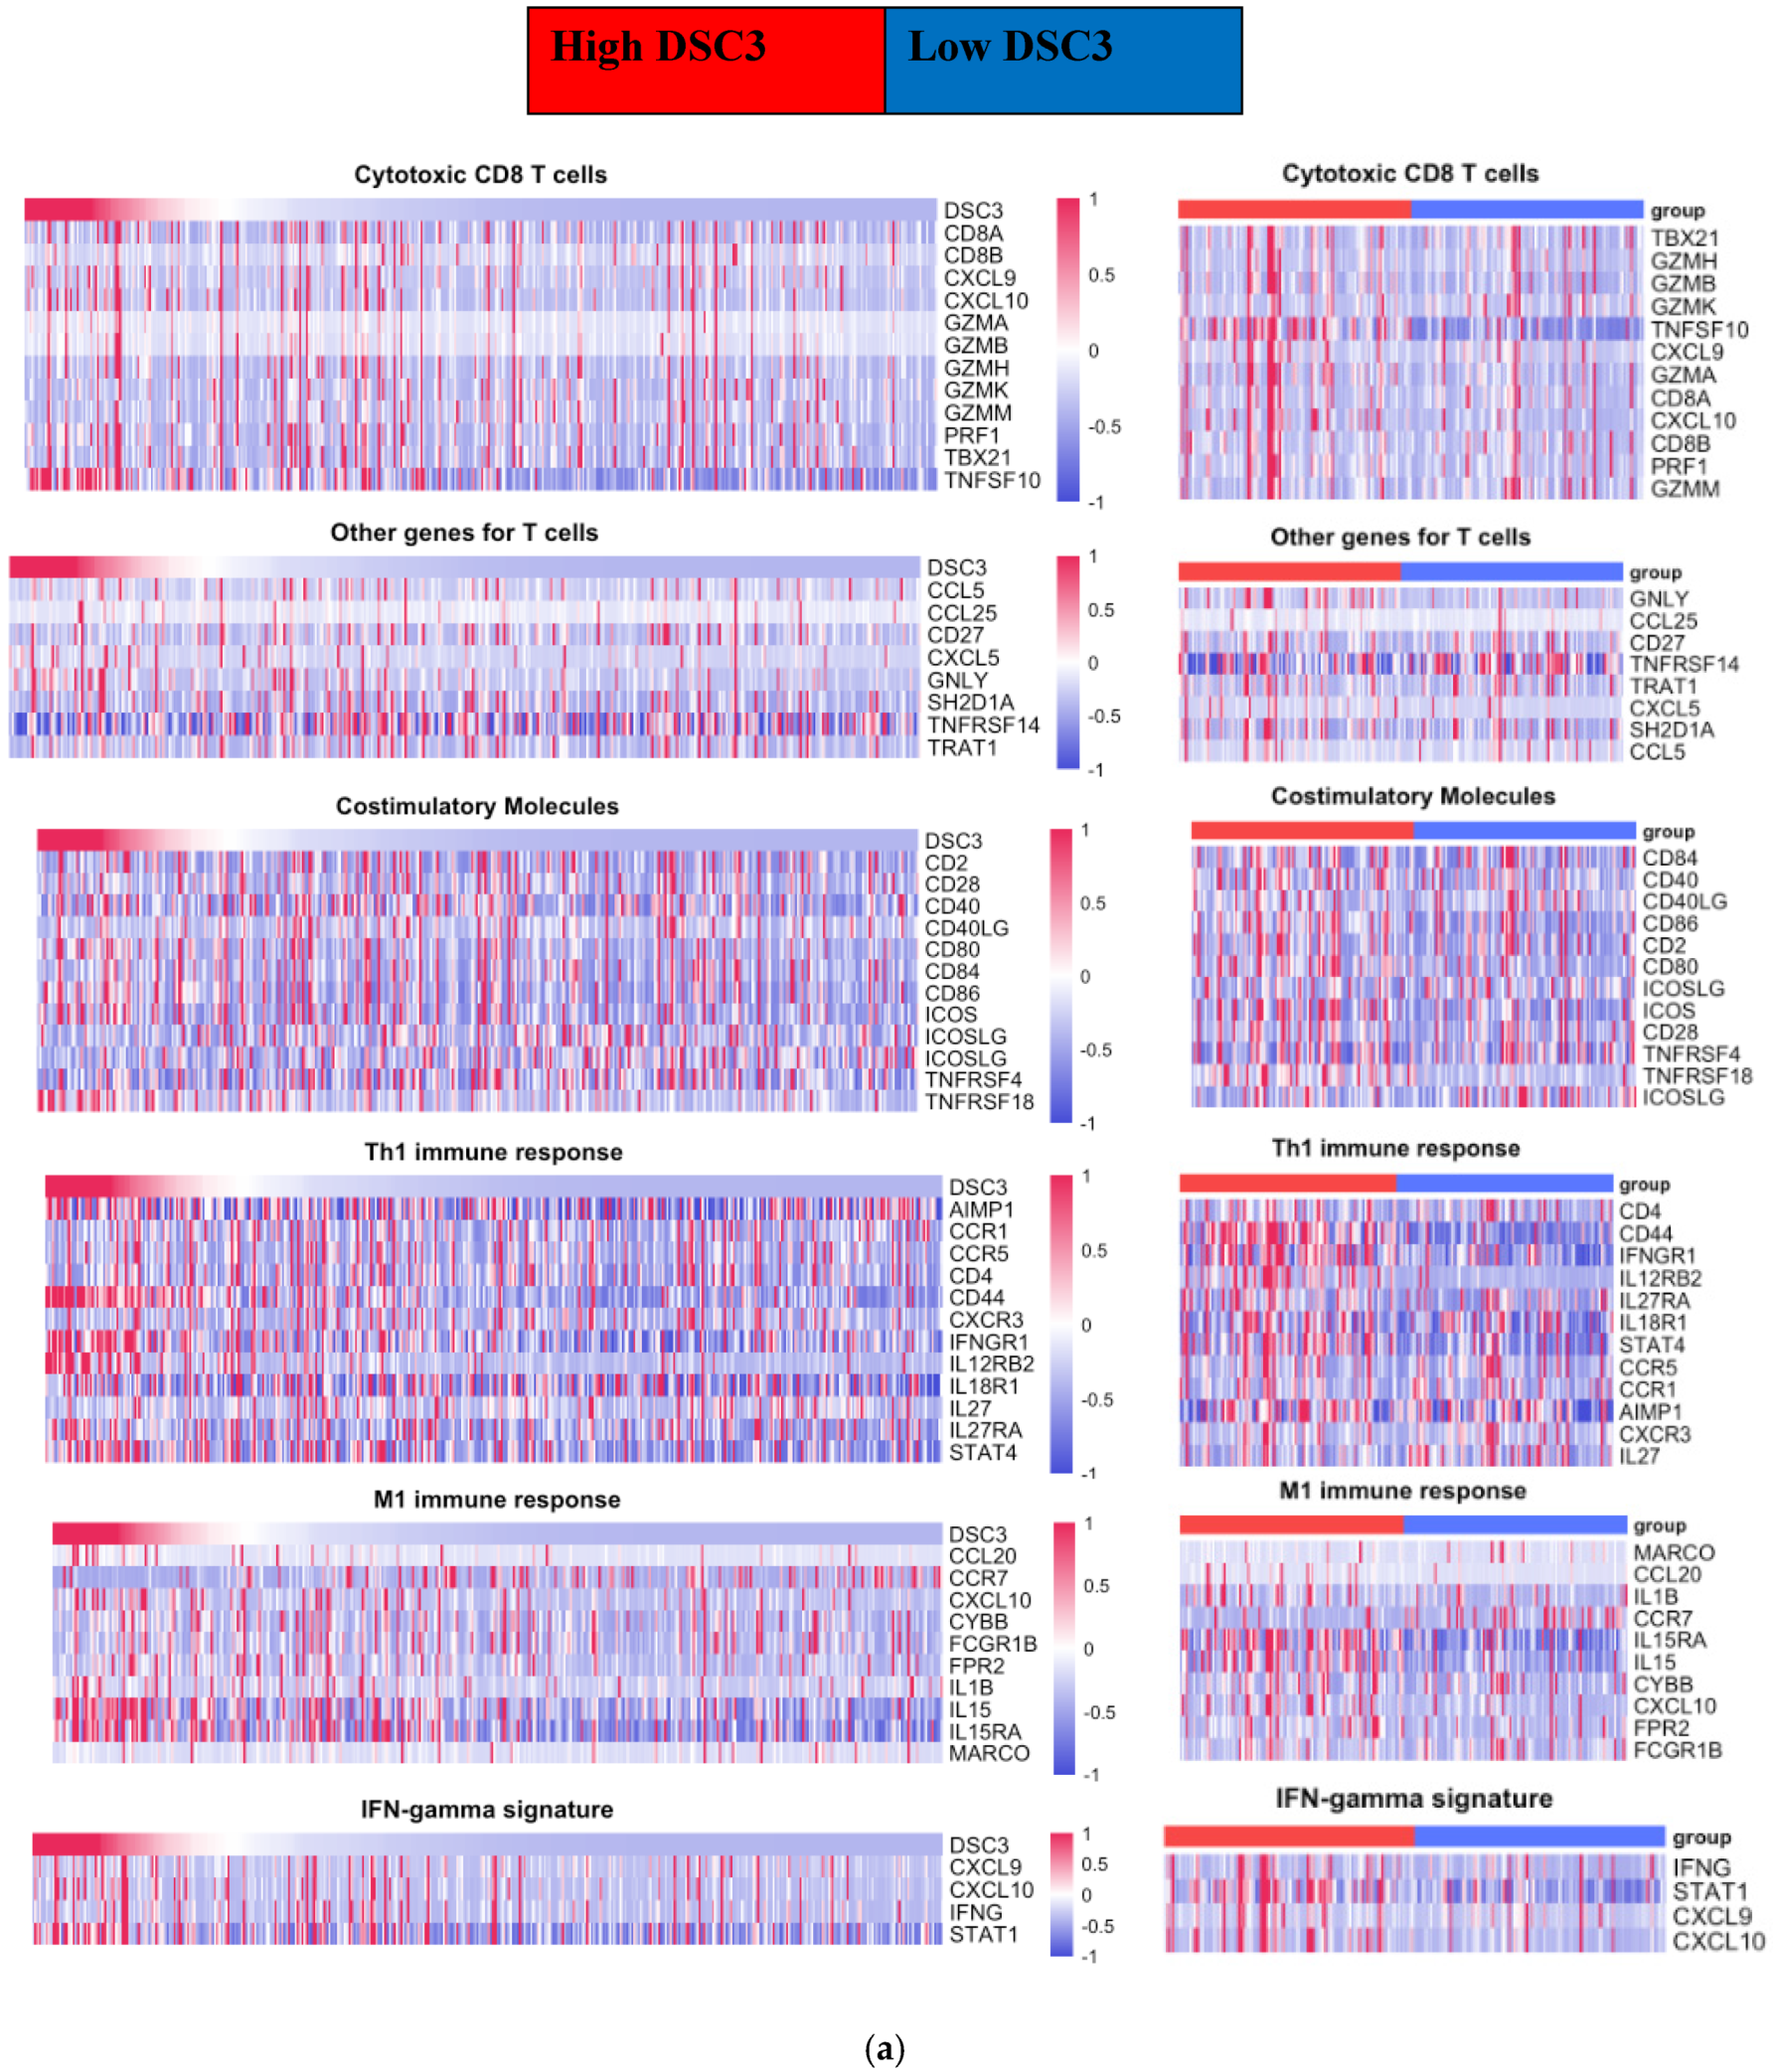
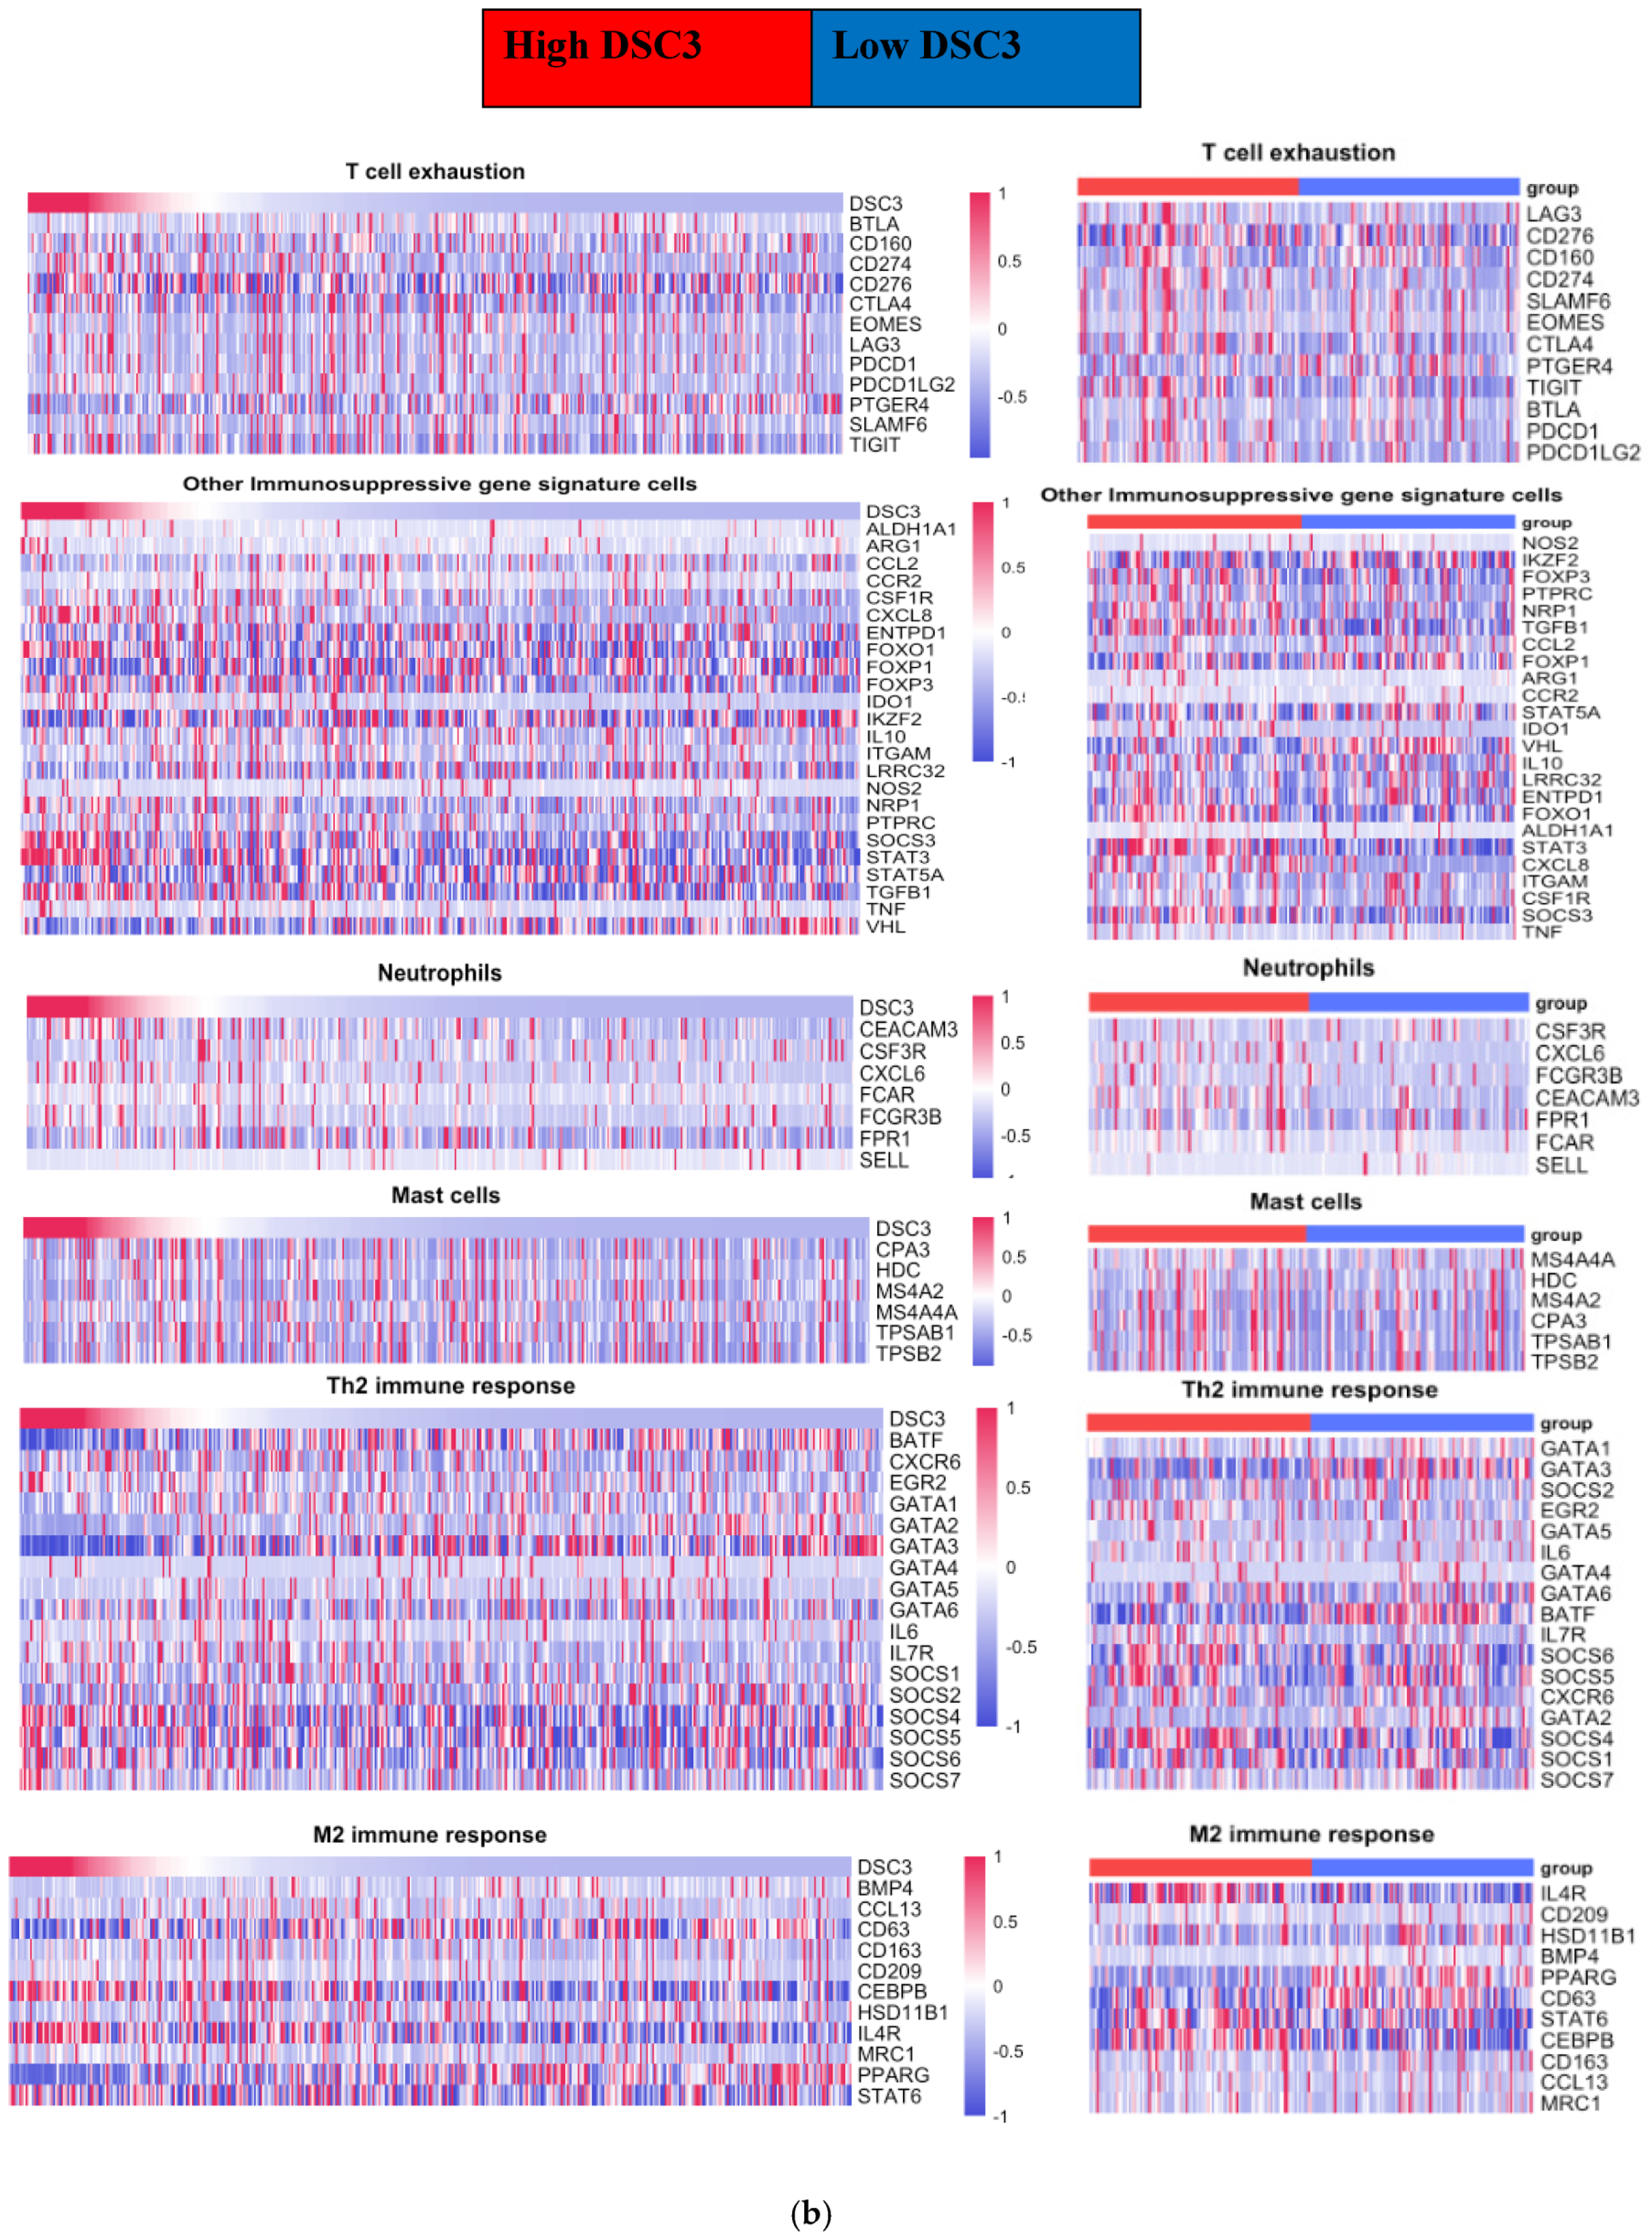
3.3. DSC3 Gene Correlated Tumor-Infiltrating Immune Cell Signature Genes
- NMIBC: Enrichment of DSC3 in NMIBC was associated with a decrease in the number of correlated TCIG and TPIG.
- b.
- MIBC: In contrast to NMIBC, we observed an increase in the number of TCIG having a positive correlation with DSC3 expression on DSC3-enrichment (9 to 14) and included CXCL10, ICOS, CCR7, IL1B, and CCL15 as additional DSC3 correlated TCIG. CCL15 was the only TCIG that converted from negative to positive correlation on DSC3 enrichment.
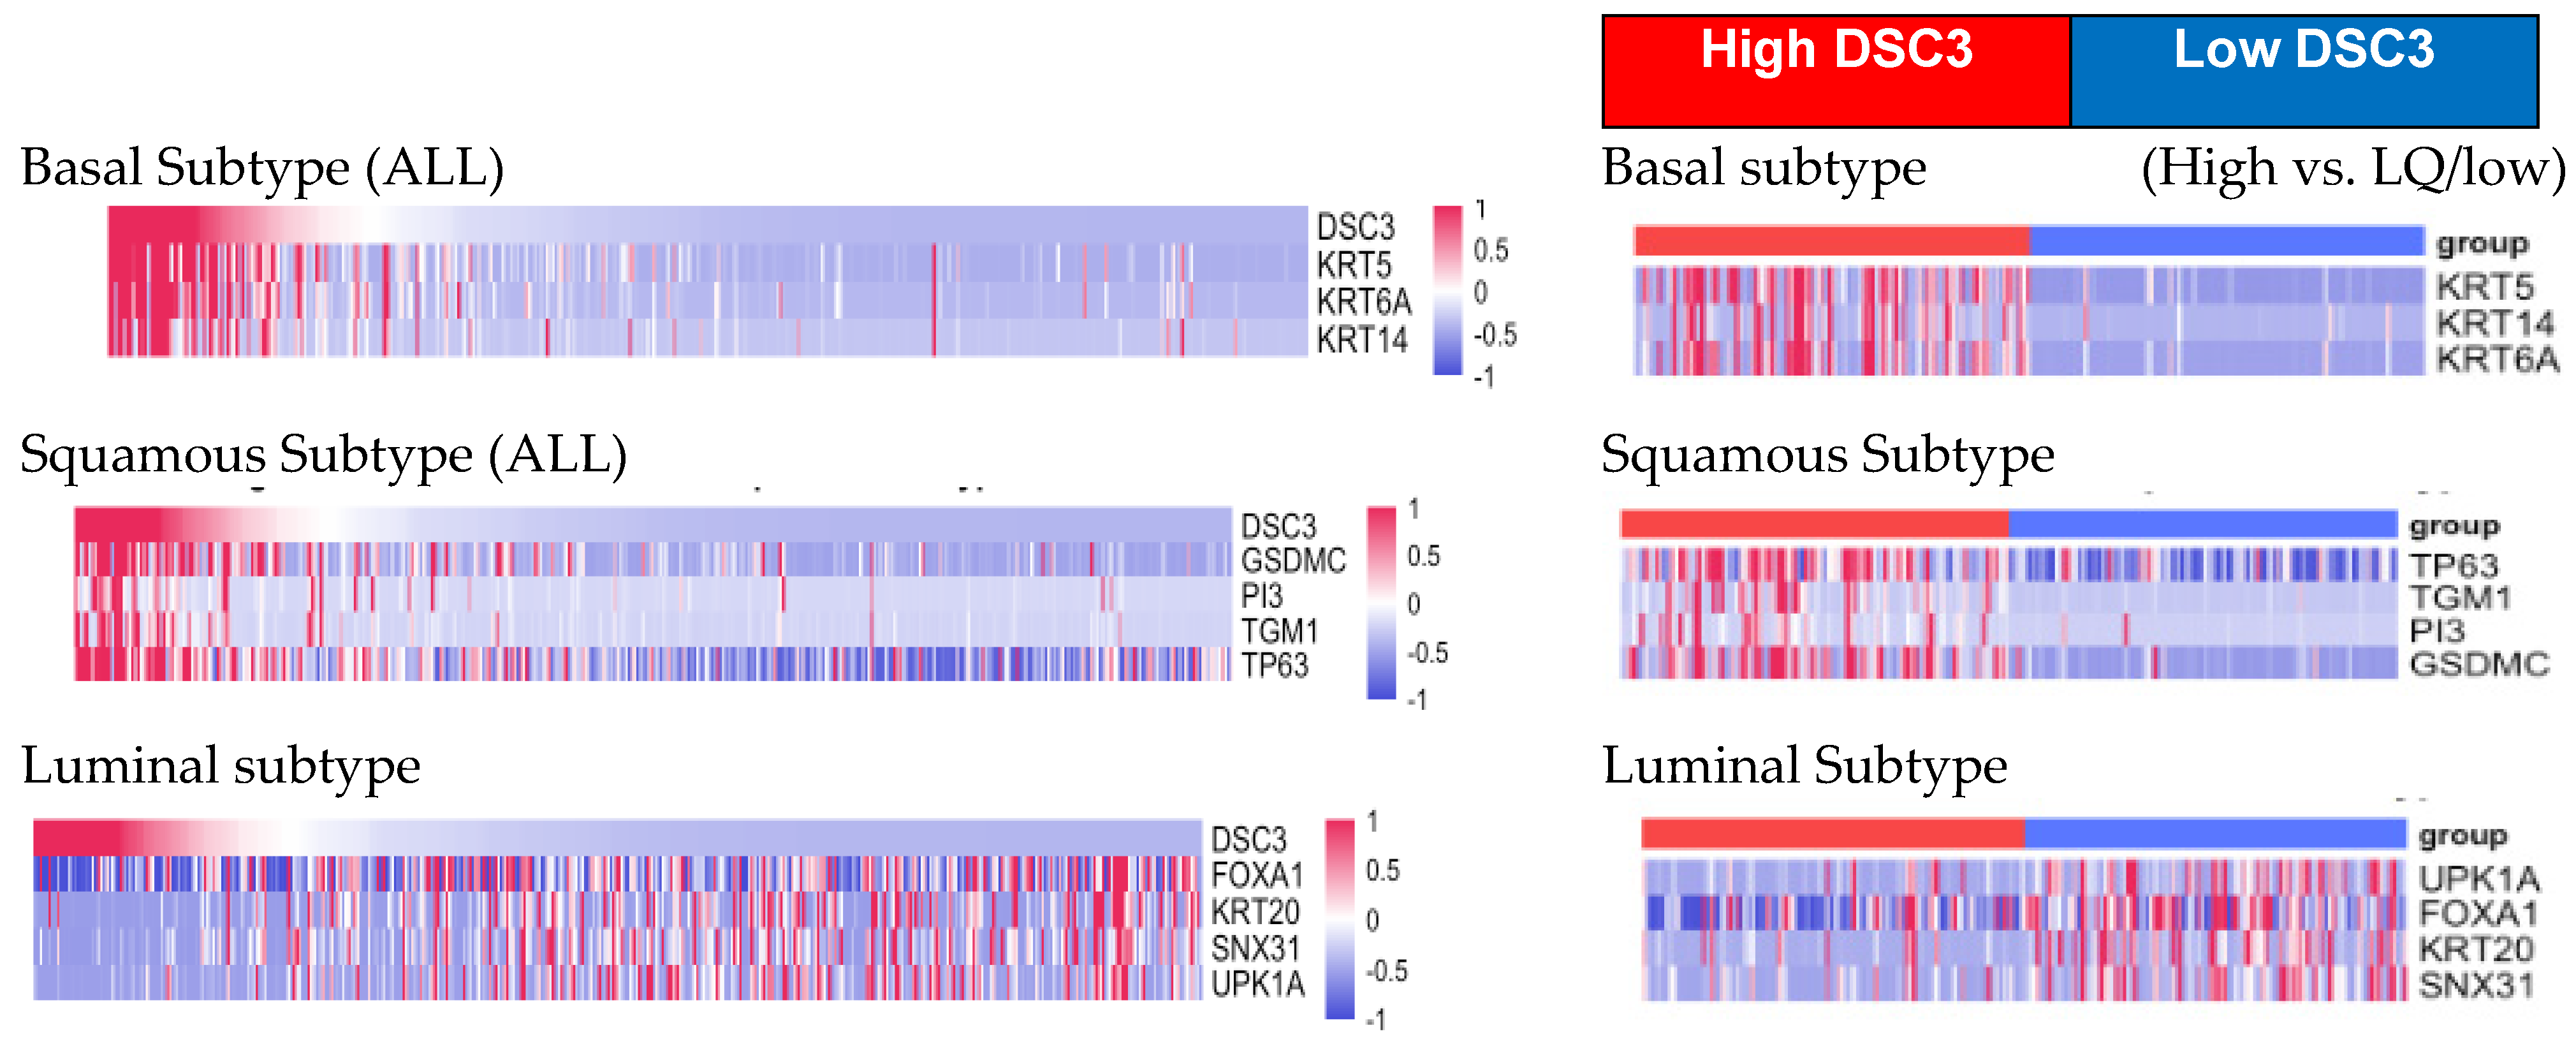
3.4. DSC3 Gene Expression and Pathological Classification
- DSC3 and molecular classification of bladder cancer (Table 8):
- DSC3 and P53:
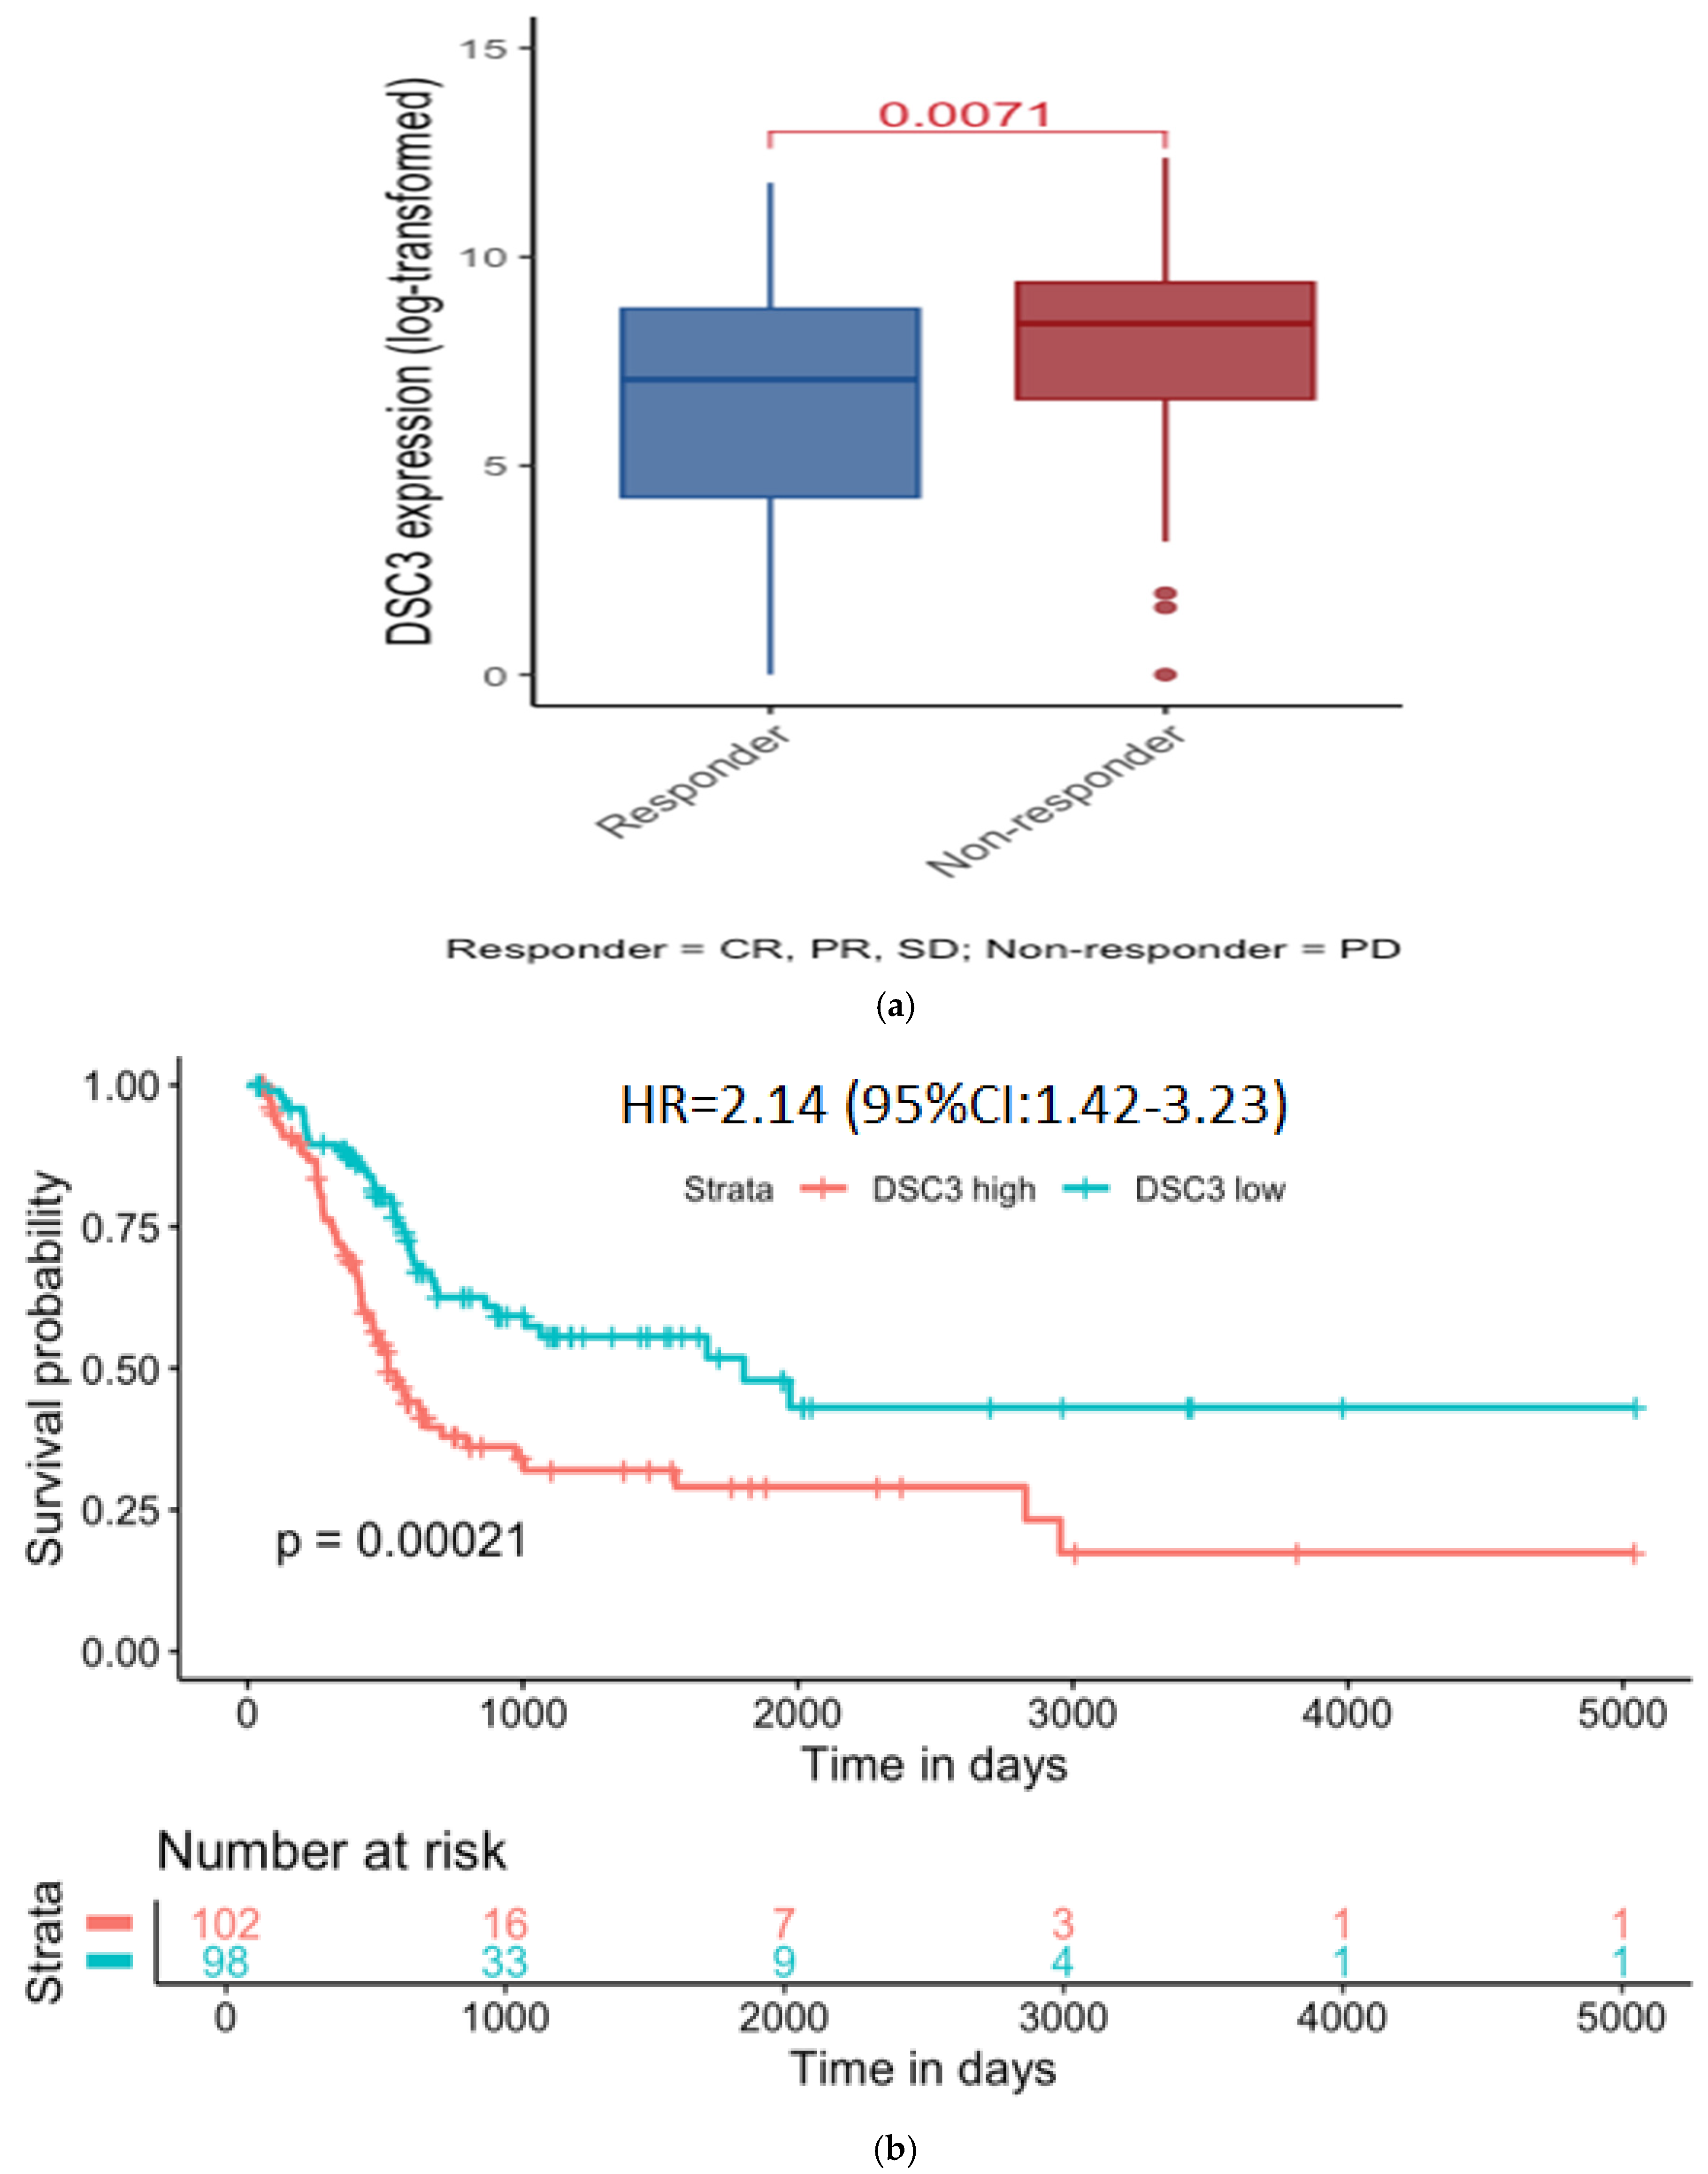
- DSC3 Expression and treatment outcome:
4. Discussion
- Its correlation with mutant p53 is seen in this study.
Supplementary Materials
Author Contributions
Funding
Institutional Review Board Statement
Informed Consent Statement
Data Availability Statement
Conflicts of Interest
Abbreviations
| DSC3: | Desmocollin-3 |
| BC: | Bladder cancer |
| TIL: | Tumor-infiltrating lymphocytes |
| NMIBC: | Non-muscle-invasive bladder cancer |
| MIBC: | Muscle-invasive bladder cancer |
| Ba/Sq: | Basal/squamous |
| TII: | Tumor immune infiltrate |
| EDTA: | Ethylenediamine tetraacetic acid |
| pH: | Potential of hydrogen |
| HRP: | Horseradish peroxidase |
| DAB: | 3,3′-Diaminobenzidine |
| H&E: | Haematoxylin and eosin |
| RSEM: | RNAseq by expectation-maximization |
| mRNA: | Messenger RNA |
| FPKM: | Fragments per kilobase of transcript per million mapped reads |
| HRNMIBC: | High-risk NMIBC |
| CI: | Confidence interval |
| TCGA: | The Cancer Genome Atlas |
| BLCA: | Bladder urothelial carcinoma |
| OS: | Overall survival |
| HR: | Hazard ratio |
| pSquamous: | Pathologic squamous |
| DSC3G: | DSC3 correlated genes |
References
- Gumbiner, B.M. Cell Adhesion: The Molecular Basis of Tissue Architecture and Morphogenesis. Cell 1996, 84, 345–357. [Google Scholar] [CrossRef]
- Shukla, C.; Jain, N.K.; Khamar, B. Chapter 4- Desmocollin-3 and Cancer. In Frontiers in Clinical Drug Research—Anti-Cancer Agents; Atta-ur-Rahman, Ed.; Bentham Books: Cambridge, UK, 2021; Volume 8, pp. 142–163. [Google Scholar] [CrossRef]
- Mauro, T. Endoplasmic reticulum calcium, stress, and cell-to-cell adhesion. J. Investig. Dermatol. 2014, 134, 1800–1801. [Google Scholar] [CrossRef]
- Kudo, I.; Esumi, M.; Yoshiaki, K.; Tohru, F.; Oshima, T. Particular gene upregulation and p53 heterogeneous expression in TP53-mutated maxillary carcinoma. Oncol. Lett. 2017, 14, 4633–4640. [Google Scholar] [CrossRef]
- Mo, Q.; Li, R.; Adeegbe, D.O.; Peng, G.; Chan, K.S. Integrative multi-omics analysis of muscle-invasive bladder cancer identifies prognostic biomarkers for frontline chemotherapy and immunotherapy. Commun. Biol. 2020, 3, 1–13. [Google Scholar] [CrossRef] [PubMed]
- Robertson, A.G.; Kim, J.; Al-Ahmadie, H.; Bellmunt, J.; Guo, G.; Cherniack, A.D.; Hinoue, T.; Laird, P.W.; Hoadley, K.A.; Akbani, R.; et al. Comprehensive Molecular Characterization of Muscle-Invasive Bladder Cancer. Cell 2017, 171, 540–556.e25. [Google Scholar] [CrossRef] [PubMed]
- Kim, B.; Jang, I.; Kim, K.; Jung, M.; Lee, C.; Park, J.H.; Kim, Y.A.; Moon, K.C. Comprehensive Gene Expression Analyses of Immunohistochemically Defined Subgroups of Muscle-Invasive Urinary Bladder Urothelial Carcinoma. Int. J. Mol. Sci. 2021, 22, 628. [Google Scholar] [CrossRef] [PubMed]
- Tan, T.Z.; Rouanne, M.; Tan, K.T.; Huang, R.Y.J.; Thiery, J.P. Molecular Subtypes of Urothelial Bladder Cancer: Results from a Meta-cohort Analysis of 2411 Tumors. Eur. Urol. 2019, 75, 423–432. [Google Scholar] [CrossRef]
- Inamura, K. Bladder Cancer: New Insights into Its Molecular Pathology. Cancers 2018, 10, 100. [Google Scholar] [CrossRef]
- O’donnell, M.A.; Singh, S.; Sood, R.; Amlani, J.; Krishnamoorthy, H.; Shukla, K.; Mohanty, N.; Bhatia, S.; Chakraborty, B.; Desai, N.; et al. A Clinical Trial of the Intradermal TLR2 Agonist CADI-05 for BCG Recurrent and Unresponsive Non-Muscle Invasive Bladder Cancer. Bladder Cancer 2019, 5, 171–180. [Google Scholar] [CrossRef]
- Ahmad, F.; Mani, J.; Kumar, P.; Haridas, S.; Upadhyay, P.; Bhaskar, S. Activation of anti-tumor immune response and reduction of regulatory T cells with Mycobacterium indicus pranii (MIP) therapy in tumor bearing mice. PLoS ONE 2011, 6, e25424. [Google Scholar] [CrossRef]
- Roy, G.; Chakraborty, A.; Swami, B.; Pal, L.; Ahuja, C.; Basak, S.; Bhaskar, S. Type 1 interferon mediated signaling is indispensable for eliciting anti-tumor responses by Mycobacterium indicus pranii. Front. Immunol. 2023, 14, 1104711. [Google Scholar] [CrossRef] [PubMed]
- Rakshit, S.; Ponnusamy, M.; Papanna, S.; Saha, B.; Ahmed, A.; Nandi, D. Immunotherapeutic efficacy of Mycobacterium indicus pranii in eliciting anti-tumor T cell responses: Critical roles of IFNγ. Int. J. Cancer 2012, 130, 865–875. [Google Scholar] [CrossRef]
- Hendry, S.; Salgado, R.; Gevaert, T.; Russell, P.A.; John, T.; Thapa, B.; Christie, M.; van de Vijver, K.; Estrada, M.V.; Gonzalez-Ericsson, P.I.; et al. Assessing Tumor-infiltrating Lymphocytes in Solid Tumors: A Practical Review for Pathologists and Proposal for a Standardized Method From the International Immunooncology Biomarkers Working Group: Part 1: Assessing the Host Immune Response, TILs in Invasive Breast Carcinoma and Ductal Carcinoma In Situ, Metastatic Tumor Deposits and Areas for Further Research. Adv. Anat. Pathol. 2017, 24, 235–251. [Google Scholar] [CrossRef] [PubMed]
- Chiu, Y.J.; Hsieh, Y.H.; Huang, Y.H. Improved cell composition deconvolution method of bulk gene expression profiles to quantify subsets of immune cells. BMC Med. Genom. 2019, 12, 169. [Google Scholar] [CrossRef] [PubMed]
- Gao, J.; Aksoy, B.A.; Dogrusoz, U.; Dresdner, G.; Gross, B.E.; Sumer, S.O.; Sun, Y.; Jacobsen, A.; Sinha, R.; Larsson, E.; et al. Integrative Analysis of Complex Cancer Genomics and Clinical Profiles Using the cBioPortal. Sci. Signal. 2013, 6, pl1. [Google Scholar] [CrossRef]
- Antonio, C.; Tiago, C.S.; Catharina, O.; Luciano, G.; Claudia, C.; Davide, G.; Thais, S.S.; Tathiane, M.M.; Stefano, M.P.; Isabella, C.; et al. TCGAbiolinks: An R/Bioconductor package for integrative analysis of TCGA data. Nucleic Acids Res. 2016, 44, e71. [Google Scholar] [CrossRef]
- Silva, T.C.; Colaprico, A.; Olsen, C.; D’Angelo, F.; Bontempi, G.; Ceccarelli, M.; Noushmehr, H. TCGA Workflow: Analyze cancer genomics and epigenomics data using Bioconductor packages. F1000Research 2016, 5, 1542. [Google Scholar] [CrossRef]
- Mounir, M.; Lucchetta, M.; Silva, T.C.; Olsen, C.; Bontempi, G.; Chen, X.; Noushmehr, H.; Colaprico, A.; Papaleo, E. New functionalities in the TCGAbiolinks package for the study and integration of cancer data from GDC and GTEx. PLoS Comput. Biol. 2019, 15, e1006701. [Google Scholar] [CrossRef]
- Alboukadel, K.; Marcin, K.; Biecek, P. Drawing Survival Curves Using ggplot2 [R Package Survminer Version 0.4.8]. 2020. Available online: https://api.semanticscholar.org/CorpusID:226195259 (accessed on 10 February 2023).
- Jeremy, S. Social Science Statistics (Updated 2018). Available online: https://www.socscistatistics.com/tests/spearman/default2.aspx (accessed on 10 February 2023).
- Hurst, C.D.; Cheng, G.; Platt, F.M.; Mauro, A.A.C.; Nour-al-dain, S.M.; Pontus, E.; Emma, V.I.B.; Olivia, A.; Andrew, R.J.L.; Sia, V.L.; et al. Stage-stratified molecular profiling of non-muscle-invasive bladder cancer enhances biological, clinical, and therapeutic insight. Cell Rep. Med. 2021, 2, 100472. [Google Scholar] [CrossRef]
- Xie, Y.; Li, P.; Gao, Y.; Gu, L.; Chen, L.; Fan, Y.; Zhang, F.; Zhang, X. Reduced E-cadherin expression is correlated with poor prognosis in patients with bladder cancer: A systematic review and meta-analysis. Oncotarget 2017, 8, 62489–62499. [Google Scholar] [CrossRef]
- Kamoun, A.; de Reyniès, A.; Allory, Y.; Sjödahl, G.; Robertson, A.G.; Seiler, R.; Hoadley, K.A.; Groeneveld, C.S.; Al-Ahmadie, H.; Choi, W. A Consensus Molecular Classification of Muscle-invasive Bladder. Eur. Urol. 2020, 77, 420–433. [Google Scholar] [CrossRef] [PubMed]
- Rosenberg, J.E.; Hoffman-Censits, J.; Powles, T.; van der Heijden, M.S.; Balar, A.V.; Necchi, A.; Dawson, N.; O’Donnell, P.H.; Balmanoukian, A.; Loriot, Y.; et al. Atezolizumab in patients with locally advanced and metastatic urothelial carcinoma who have progressed following treatment with platinum-based chemotherapy: A single-arm, multicentre, phase 2 trial. Lancet 2016, 387, 1909–1920. [Google Scholar] [CrossRef] [PubMed]
- Elise, P.S.; Davide, B.; Ileana, S.M.; Donna, H.D.; Sofia, M.S.; Joel, P.; Joseph, M.O.; George, C.; Ena, W.; Thomas, F.G.; et al. Human melanomas and ovarian cancers overexpressing mechanical barrier molecule genes lack immune signatures and have increased patient mortality risk. OncoImmunology 2016, 5, e1240857. [Google Scholar] [CrossRef]
- O’Donnell, J.S.; Teng, M.W.L.; Smyth, M.J. Cancer immunoediting and resistance to T cell-based immunotherapy. Nat. Rev. Clin. Oncol. 2018, 16, 151–167. [Google Scholar] [CrossRef]
- Karunamurthy, A.; Davar, D. There and back again: PD-L1 Positivity as a Biomarker for Immune Checkpoint Blockade in Urothelial Carcinoma. Cancer Immunol. Res. 2025, 13, 454–455. [Google Scholar] [CrossRef]
- Cui, T.; Chen, Y.; Yang, L.; Knösel, T.; Zöller, K.; Huber, O.; Petersen, I. DSC3 expression is regulated by p53, and methylation of DSC3 DNA is a prognostic marker in human colorectal cancer. Br. J. Cancer 2011, 104, 1013–1019. [Google Scholar] [CrossRef]
- Cui, T.; Yang, L.; Ma, Y.; Petersen, I.; Yuan, C. Desmocollin 3 has a tumor suppressive activity through inhibition of AKT pathway in colorectal cancer. Exp. Cell Res. 2019, 378, 124–130. [Google Scholar] [CrossRef]
- Cui, T.; Chen, Y.; Yang, L.; Knösel, T.; Huber, O.; Pacyna-Gengelbach, M.; Petersen, I. The p53 target gene desmocollin 3 acts as a novel tumor suppressor through inhibiting EGFR/ERK pathway in human lung cancer. Carcinogenesis 2012, 33, 2326–2333. [Google Scholar] [CrossRef]
- Oshiro, M.M.; Watts, G.S.; Wozniak, R.J.; Junk, D.J.; Munoz-Rodriguez, J.L.; Domann, F.E.; Futscher, B.W. Mutant p53 and aberrant cytosine methylation cooperate to silence gene expression. Oncogene 2003, 22, 3624–3634. [Google Scholar] [CrossRef]
- Riker, A.I.; Enkemann, S.A.; Fodstad, O.; Liu, S.; Ren, S.; Morris, C.; Xi, Y.; Howell, P.; Metge, B.; Samant, R.S.; et al. The gene expression profiles of primary and metastatic melanoma yields a transition point of tumor progression and metastasis. BMC Med. Genom. 2008, 1, 1–13. [Google Scholar] [CrossRef]
- Choi, W.; Shah, J.B.; Tran, M.; Svatek, R.; Marquis, L.; Lee, I.L.; Yu, D.; Adam, L.; Wen, S.; Shen, Y.; et al. p63 expression defines a lethal subset of muscle-invasive bladder cancers. PLoS ONE 2012, 7, e30206. [Google Scholar] [CrossRef] [PubMed]
- Yang, L.; Li, A.; Liu, F.; Zhao, Q.; Ji, S.; Zhu, W.; Yu, W.; Zhang, R.; Liu, Y.; Li, W.; et al. Immune Profiling Reveals Molecular Classification and Characteristic in Urothelial Bladder Cancer. Front. Cell Dev. Biol. 2021, 9, 596484. [Google Scholar] [CrossRef] [PubMed]
- Eckstein, M.; Strissel, P.; Strick, R.; Weyerer, V.; Wirtz, R.; Pfannstiel, C.; Wullweber, A.; Lange, F.; Erben, P.; Stoehr, R.; et al. Cytotoxic T-cell-related gene expression signature predicts improved survival in muscle-invasive urothelial bladder cancer patients after radical cystectomy and adjuvant chemotherapy. J. Immunother. Cancer 2020, 8, e000162. [Google Scholar] [CrossRef]
- McConkey, D.J.; Choi, W.; Shen, Y.; Lee, I.L.; Porten, S.; Matin, S.F.; Kamat, A.M.; Corn, P.; Millikan, R.E.; Dinney, C.; et al. A Prognostic Gene Expression Signature in the Molecular Classification of Chemotherapy-naïve Urothelial Cancer is Predictive of Clinical Outcomes from Neoadjuvant Chemotherapy: A Phase 2 Trial of Dose-dense Methotrexate, Vinblastine, Doxorubicin, and Cisplatin with Bevacizumab in Urothelial Cancer. Eur. Urol. 2016, 69, 855–862. [Google Scholar] [CrossRef]
- Wang, L.; Zhou, M.; Feng, C.; Gao, P.; Ding, G.; Zhou, Z.; Jiang, H.; Wu, Z.; Ding, Q. Prognostic value of Ki67 and p63 expressions in bladder cancer patients who underwent radical cystectomy. Int. Urol. Nephrol. 2016, 48, 495–501. [Google Scholar] [CrossRef] [PubMed]
- Wang, C.C.; Tsai, Y.C.; Jeng, Y.M. Biological significance of GATA3, cytokeratin 20, cytokeratin 5/6 and p53 expression in muscle-invasive bladder cancer. PLoS ONE 2019, 14, e0221785. [Google Scholar] [CrossRef]
- Choi, W.; Porten, S.; Kim, S.; Willis, D.; Plimack, E.R.; Hoffman-Censits, J.; Roth, B.; Cheng, T.; Tran, M.; Lee, I.L. Identification of distinct basal and luminal subtypes of muscle-invasive bladder cancer with different sensitivities to frontline chemotherapy. Cancer Cell 2014, 25, 152–165. [Google Scholar] [CrossRef]


| DSC3 Protein expression (immunohistochemistry) | |||||
| Total N | Positive N (%) | Negative N (%) | Chi-square test (p value) | ||
| Stage | NMIBC | 55 | 33 (60%) | 22 (40%) | 0.11 |
| MIBC | 16 | 6 (37.5%) | 10 (62.5%) | ||
| DSC3 gene expression—In silico | |||||
| Database | Total N | Mean DSC3 | t Test, 2 tail (p value) | ||
| ArrayExpress; E-MTAB-4321 (FKPM) | Stage | NMIBC | 457 | 16.1 | 0.001 |
| MIBC | 16 | 6.3 | |||
| TCGA; Cell 2017 & Cell 2017 supplement (RSEM) | Histology (Supplementary Table S3) | Papillary MIBC | 132 | 1956.8 | 0.001 |
| Non-Papillary MIBC | 270 | 4187.8 | |||
| Squamous non-papillary MIBC | 41 | 11,763 | <0.0001 | ||
| Non-squamous non-papillary MIBC | 229 | 2485 | |||
| A | ||||||
| TIL | ||||||
| DSC3 | Total (N) | Present(N) | Absent (N) | Odds Ratio (95% CI) p | ||
| Positive | 39 | 31(79.49%) | 8 (20.51%) | 5.663 (1.98 to 16.17) p = 0.001 | ||
| Negative | 32 | 13(40.63%) | 19(59.37%) | |||
| Stage | NMIBC | Positive | 33 | 25 (75.75%) | 8 (24.24%) | 3.75 (1.18 to 11.92) p = 0.0251 |
| Negative | 22 | 10(45.45%) | 12 (54.54%) | |||
| MIBC | Positive | 6 | 6 (100%) | 0 | 27.8571 (1.20 to 646.11) p = 0.0381 | |
| Negative | 10 | 3(30%) | 7(70%) | |||
| sTIL | |||
|---|---|---|---|
| DSC3 | Absent | Present | Odds Ratio (95% CI) p |
| Positive (N = 39) | 8 (20.51%) | 31 (79.49%) | 5.663 (1.98 to 16.18) p = 0.001 |
| Negative (N = 32) | 19 (59.37%) | 13 (40.63%) | |
| iTIL | |||
| DSC3 | Absent | Present | Odds ratio (95% CI) p |
| Positive (N = 39) | 15 (39.46%) | 24 (61.54%) | 15.467 (3.9997 to 59.8091) p = 0.000 |
| Negative (N = 32) | 29 (90.63%) | 3 (9.37%) | |
| Macrophage | ||||||
|---|---|---|---|---|---|---|
| DSC3 | Total (N) | Present (N) | Absent (N) | Odds Ratio (95% CI) p | ||
| Stage | NMIBC | Positive | 33 | 32 | 1 | 0.4815 (0.01 to 12.36) p = 0.6589 |
| Negative | 22 | 22 | 0 | |||
| MIBC | Positive | 6 | 6 | 0 | 0.6190 (0.01 to 35.18) p = 0.8160 | |
| Negative | 10 | 10 | 0 | |||
| Negative | 14 | 14 | 0 | |||
| sMacrophage | |||||
|---|---|---|---|---|---|
| DSC3 | Absent | Present | Odds Ratio (95% CI) p | ||
| Negative (N = 32) | 0 | 32 | 0.395 | 0.016 to 10.028 | p = 0.573 |
| Positive (N = 39) | 1 | 38 | |||
| iMacrophage | |||||
| DSC3 | Absent | Present | Odds Ratio (95% CI) p | ||
| Negative (N = 32) | 5 | 27 | 0.718 | 0.210 to 2.457 | p = 0.597 |
| Positive (N = 39) | 8 | 31 | |||
| Subset of Immune Cells | Correlated Genes | NMIBC | UQ NMIBC | MIBC | UQ MIBC |
|---|---|---|---|---|---|
| Cytotoxic CD8 T cells | TNFSF10 | 0.3 | 0.2 | 0.5 | 0.4 |
| CXCL10 | −0.3 | −0.1 | 0.2 | 0.3 | |
| Other genes for T cells | CTSW | −0.3 | −0.3 | 0.2 | −0.2 |
| Costimulatory Molecules | ICOS | −0.3 | −0.1 | 0.2 | 0.3 |
| TNFRSF18 | −0.1 | 0.0 | 0.3 | 0.4 | |
| Th1 immune response | CCR1 | −0.3 | −0.2 | 0.2 | 0.1 |
| CD44 | 0.3 | 0.1 | 0.5 | 0.6 | |
| IFNGR1 | 0.1 | 0.0 | 0.3 | 0.4 | |
| IL12RB2 | −0.1 | 0.0 | 0.4 | 0.5 | |
| STAT4 | 0 | 0.1 | 0.3 | 0.3 | |
| M1 immune response | CCL15 | −0.2 | −0.4 | −0.4 | 0.4 |
| CXCL10 | −0.3 | −0.1 | 0.2 | 0.3 | |
| CCL20 | −0.2 | −0.1 | 0.3 | 0.5 | |
| CCR7 | −0.3 | −0.1 | −0.2 | 0.3 | |
| IL1B | −0.3 | −0.3 | 0.1 | 0.3 | |
| IL15 | 0 | −0.1 | 0.3 | 0.4 | |
| IFN-gamma signature | CXCL10 | −0.3 | −0.1 | 0.2 | 0.3 |
| STAT1 | −0.1 | −0.2 | 0.3 | 0.3 |
| Subset of Immune Cells | Gene | NMIBC | UQ NMIBC | MIBC | UQ MIBC |
| T cell exhaustion | CTLA4 | −0.3 | −0.1 | 0.1 | 0.2 |
| TIGIT | −0.3 | −0.1 | 0.2 | 0.2 | |
| Other Immunosuppressive gene signature cells | CXCL8 | NA | NA | 0.4 | 0.4 |
| FOXP3 | −0.3 | −0.1 | 0.1 | 0.1 | |
| STAT3 | 0.1 | 0.1 | 0.3 | 0.4 | |
| VHL | −0.3 | −0.1 | −0.3 | −0.3 | |
| Neutrophil | CXCL6 | −0.1 | 0.0 | 0.3 | 0.2 |
| SELL | −0.3 | −0.1 | −0.2 | −0.2 | |
| S100A12 | −0.2 | −0.1 | 0.3 | 0.4 | |
| Mast cells | CPA3 | −0.3 | −0.1 | 0.1 | −0.1 |
| MS4A2 | −0.3 | −0.3 | 0.1 | −0.1 | |
| Th2 immune response | BATF | −0.1 | −0.1 | −0.3 | −0.6 |
| GATA2 | 0.1 | −0.1 | −0.4 | −0.6 | |
| GATA3 | 0.1 | 0.1 | −0.4 | −0.6 | |
| M2 immune response | BMP4 | −0.2 | 0.0 | −0.3 | −0.3 |
| CCL13 | −0.3 | −0.3 | 0.1 | 0.0. | |
| CEBPB | 0.1 | −0.1 | 0.3 | 0.3 | |
| IL4R | 0.1 | −0.3 | 0.3 | 0.3 | |
| SIGLEC5 | −0.3 | −0.2 | −0.2 | −0.1 | |
| CD63 | 0 | −0.1 | −0.3 | −0.5 | |
| PPARG | 0 | 0.0 | −0.4 | −0.6 |
| P MIBC | NPNPMIBCI | NMIBC | Squamous | ||
|---|---|---|---|---|---|
| BASAL | KRT5 | 0.6 | 0.7 | 0.4 | 0 |
| KRT6A | 0.5 | 0.7 | 0.4 | 0.1 | |
| KRT14 | 0.3 | 0.6 | −0.1 | 0.2 | |
| Average BASAL | 0.5 | 0.7 | 0.2 | 0.1 | |
| Squamous | CD44 | 0.3 | 0.5 | 0.3 | 0.2 |
| GSDMC | 0.3 | 0.6 | 0 | 0.3 | |
| PI3 | 0.1 | 0.6 | −0.1 | 0.1 | |
| TGM1 | 0.1 | 0.5 | 0 | 0.1 | |
| TP63 | 0.2 | 0.6 | 0.4 | 0.3 | |
| Average Squamous | 0.2 | 0.6 | 0.12 | 0.2 | |
| Luminal | PPARG | −0.3 | −0.5 | 0 | −0.2 |
| GATA3 | −0.2 | −0.4 | 0.1 | −0.1 | |
| KRT20 | −0.1 | −0.3 | −0.1 | 0 | |
| FOXA1 | −0.2 | −0.2 | 0 | −0.1 | |
| SNX31 | −0.1 | −0.3 | −0.1 | −0.1 | |
| UPK1A | −0.2 | −0.3 | −0.4 | −0.2 | |
| UPK2 | −0.3 | −0.4 | −0.4 | −0.2 | |
| Average Luminal | −0.2 | −0.3 | −0.1 | −0.1 |
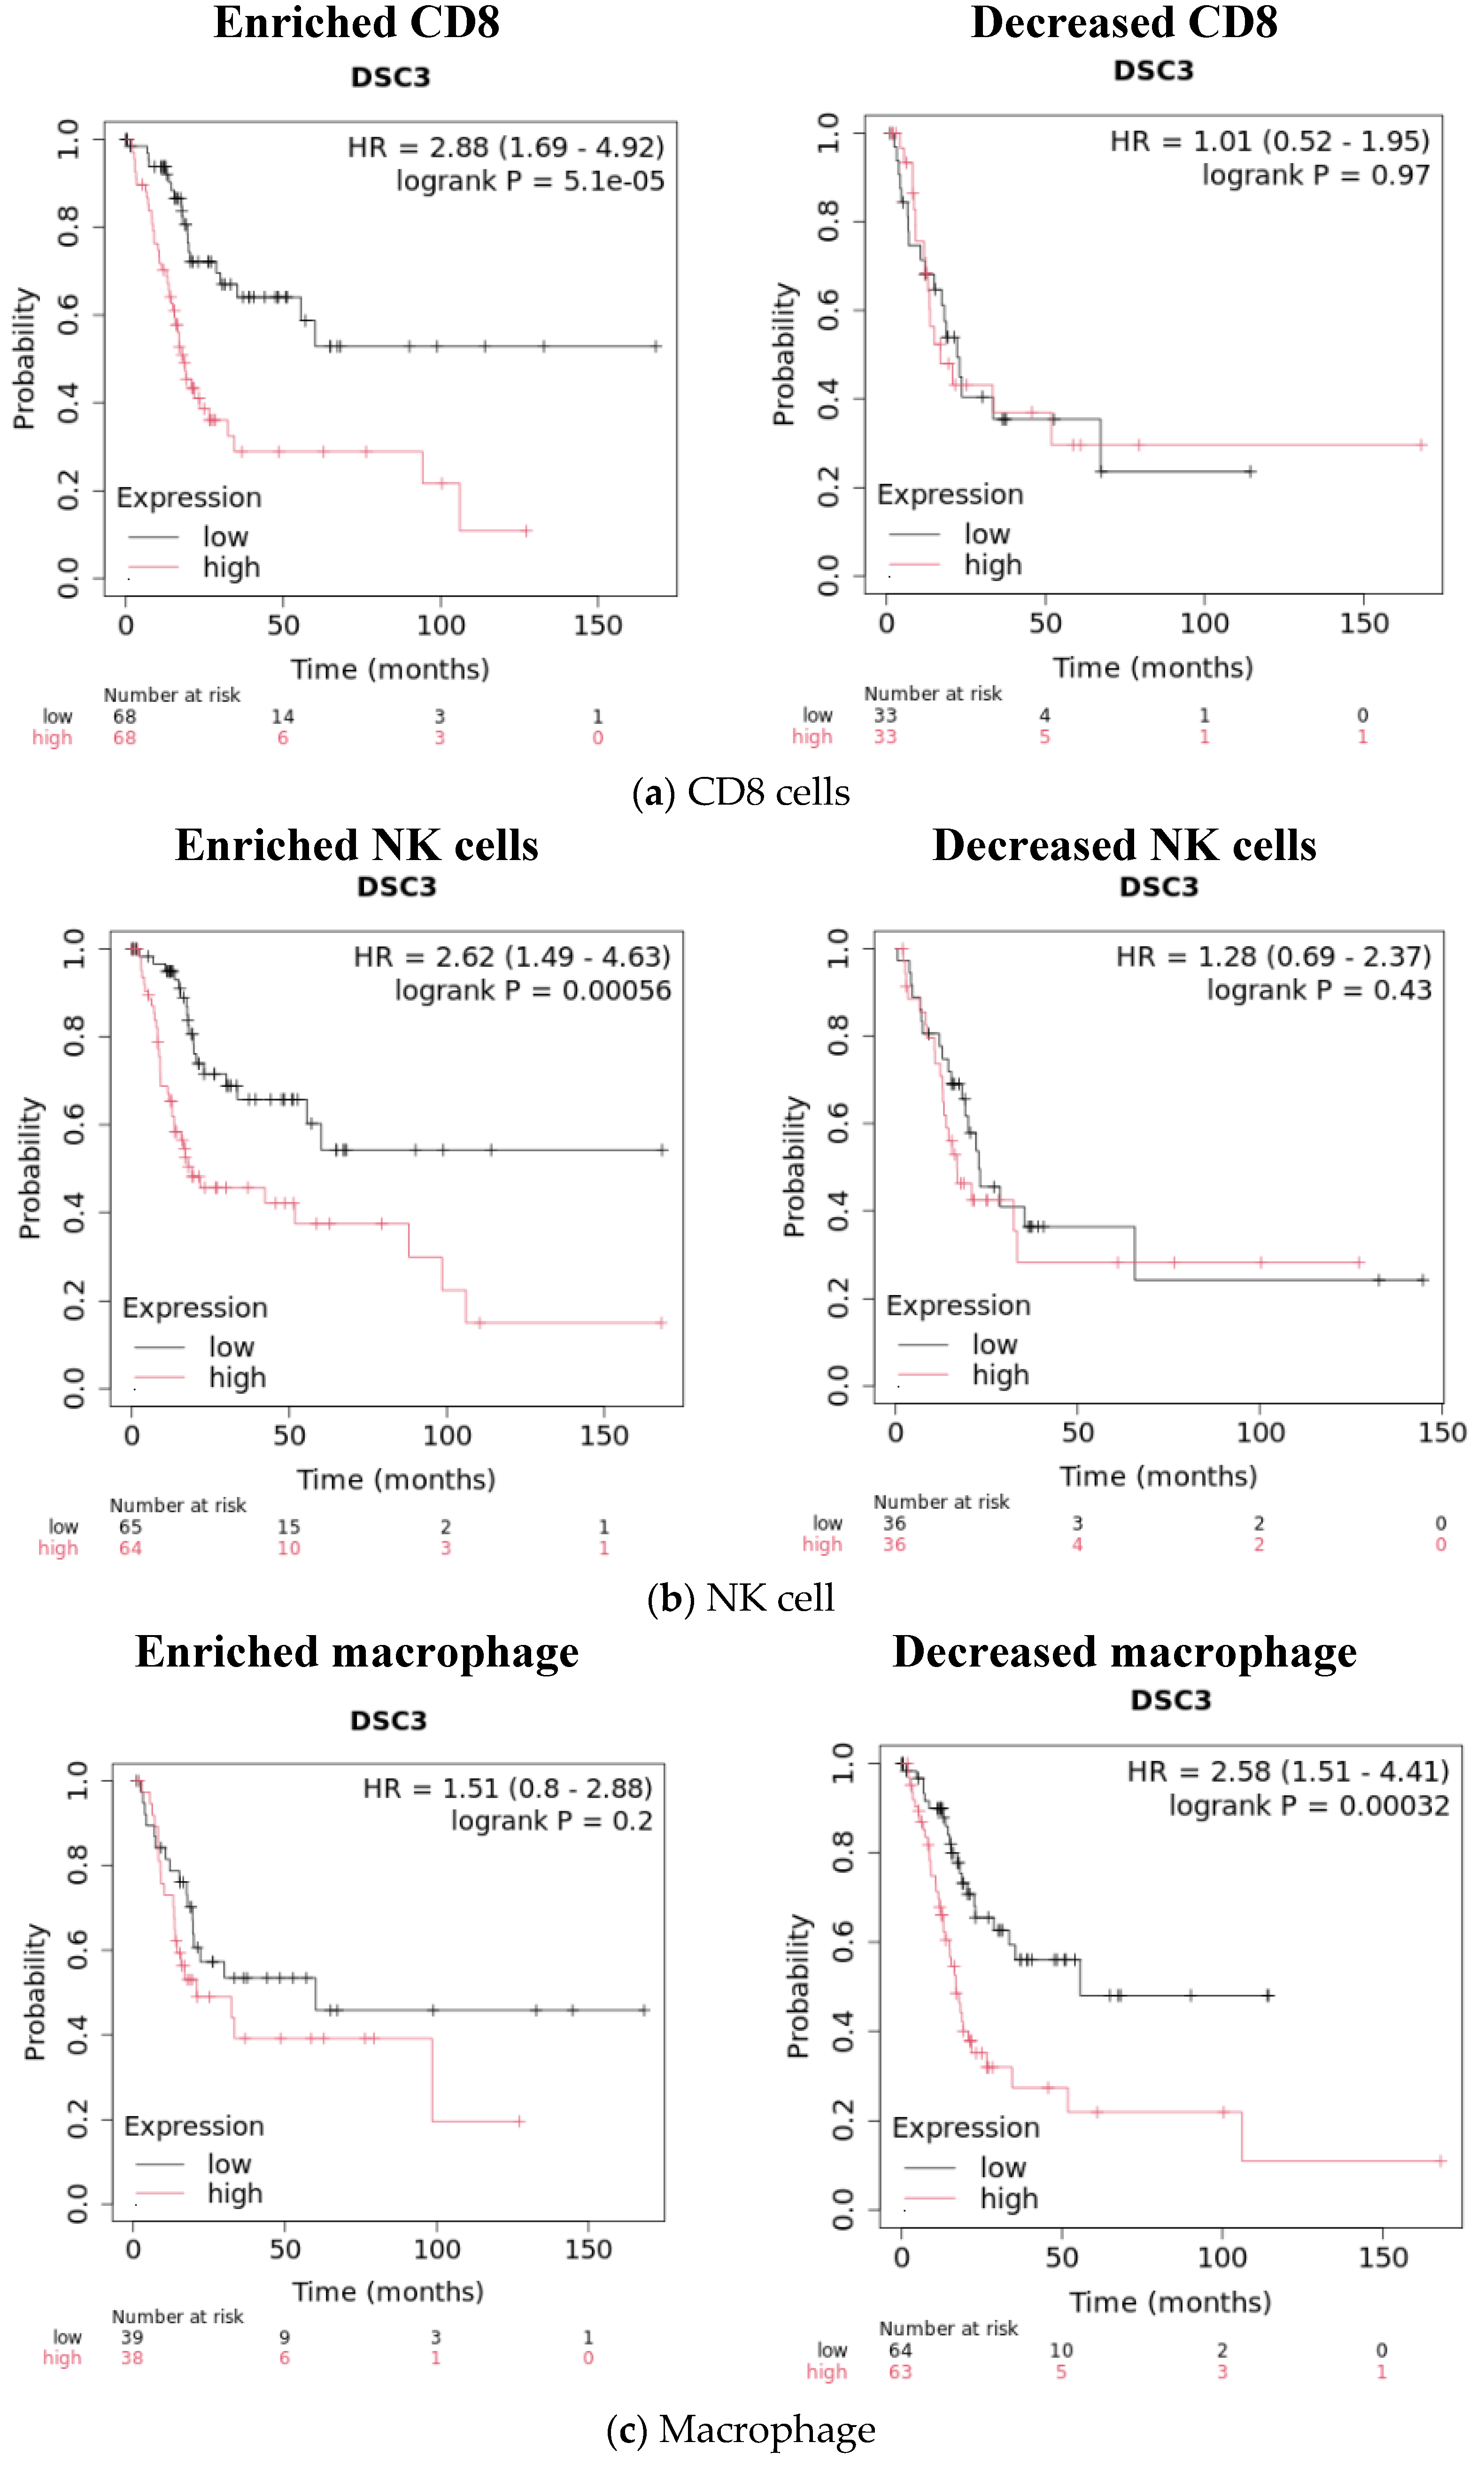
| HR | Log Rank p Value | N = Low | N = High | |
|---|---|---|---|---|
| UQ vs. LQ DSC3 | 2.14 (1.42–3.23) | 0.0002 | 101 | 101 |
| Effect of enrichment or decrease on survival in UQ and LQ DSC3 | ||||
| CD8 enrichment | 2.88 (1.69–4.92) | 0.00005 | 68 | 68 |
| NK cell enrichment | 2.62 (1.49–4.63) | 0.00056 | 65 | 64 |
| Macrophage decreased | 2.58 (1.51–4.41) | 0.00032 | 64 | 63 |
| B cell decreased | 2.41 (1.46–3.99) | 0.0004 | 63 | 62 |
| Regulatory T cell decreased | 1.71 (1.05–2.79) | 0.029 | 71 | 71 |
Disclaimer/Publisher’s Note: The statements, opinions and data contained in all publications are solely those of the individual author(s) and contributor(s) and not of MDPI and/or the editor(s). MDPI and/or the editor(s) disclaim responsibility for any injury to people or property resulting from any ideas, methods, instructions or products referred to in the content. |
© 2025 by the authors. Licensee MDPI, Basel, Switzerland. This article is an open access article distributed under the terms and conditions of the Creative Commons Attribution (CC BY) license (https://creativecommons.org/licenses/by/4.0/).
Share and Cite
Shukla, C.P.; Jain, N.K.; O’Donnell, M.A.; Vachhani, K.V.; Patel, R.; Patel, J.; Modi, R.; Dheeraj, A.; Lee, J.M.; Rolig, A.; et al. Desmocollin-3 and Bladder Cancer. Diseases 2025, 13, 131. https://doi.org/10.3390/diseases13050131
Shukla CP, Jain NK, O’Donnell MA, Vachhani KV, Patel R, Patel J, Modi R, Dheeraj A, Lee JM, Rolig A, et al. Desmocollin-3 and Bladder Cancer. Diseases. 2025; 13(5):131. https://doi.org/10.3390/diseases13050131
Chicago/Turabian StyleShukla, Chandreshwar P., Nayan K. Jain, Michael A. O’Donnell, Kapil V. Vachhani, Rashmi Patel, Janki Patel, Rajiv Modi, Arpit Dheeraj, Jee Min Lee, Annah Rolig, and et al. 2025. "Desmocollin-3 and Bladder Cancer" Diseases 13, no. 5: 131. https://doi.org/10.3390/diseases13050131
APA StyleShukla, C. P., Jain, N. K., O’Donnell, M. A., Vachhani, K. V., Patel, R., Patel, J., Modi, R., Dheeraj, A., Lee, J. M., Rolig, A., Malhotra, S. V., & Khamar, B. (2025). Desmocollin-3 and Bladder Cancer. Diseases, 13(5), 131. https://doi.org/10.3390/diseases13050131