1. Introduction
Hepatocellular carcinoma (HCC) is one of the most common cancers worldwide [
1,
2]. The prognosis of HCC depends on its stage at diagnosis. Although the prognosis is favorable for patients with early HCC who receive radical therapy, it is poor for those with advanced HCC. Sorafenib is the first targeted agent with significant clinical activity for advanced HCC. In previous multicenter, double-blind, randomized phase 3 studies, the SHARP [
3] and Asia-Pacific [
4] studies, sorafenib provided statistically-significant survival benefits compared with placebo in patients with advanced HCC. Because survival is influenced by second- and beyond-line therapies, reviews of other cancers demonstrate the requirement for post-progression survival (PPS) analysis [
5,
6,
7].
However, sorafenib only induces modest tumor shrinkage. Cytotoxic therapy is most often discontinued or changed when radiological progressive disease (rPD) occurs; however, the optimal termination point for targeted therapy can be difficult to determine according to rPD [
3,
4,
8]. So-called clinical PD (cPD) does not correspond to rPD during sorafenib therapy for HCC, because we experienced a few patients who continued sorafenib after diagnosis of rPD retaining disease control over a long period in clinical practice. The Response Evaluation Criteria in Solid Tumors (RECIST) was originally developed to assess responses to cytotoxic agents and may not be appropriate for targeted agents [
9,
10].
This study analyzed prognostic factors for PPS using patient parameters at rPD. We then attempted to develop an indicator for judging cPD as an adjunct to RECIST using these prognostic factors for patients with advanced HCC administered sorafenib as first-line therapy.
2. Experimental Section
The Saga Liver Cancer Study Group (SALC) comprises tertiary-care hospitals in Saga, Japan, with specialists in liver cancer treatment. A retrospective analysis of all patients with HCC treated with sorafenib in Saga Prefecture was performed using the unified database system of the SALC. The patients received 400 mg of sorafenib twice daily; however, initial dose reduction considering each patient’s condition was allowed. All other aspects of sorafenib therapy, including dose adjustment or interruption, treatment schedule, supportive therapies and post-rPD therapies, were determined by a physician. The institutional review board or ethics committee of each institution approved the SALC protocol.
All patients had histologically- or radiologically-confirmed HCC that was diagnosed as advanced, ineligible for resection or locoregional treatment or refractory to chemoembolization. Patients’ conditions when sorafenib treatment was initiated were defined according to the Eastern Cooperative Oncology Group performance status (ECOG PS) as scores ranging from 0 to 2, Child–Pugh scores ≤8 and adequate hematologic and liver function. Adequate hematologic functions were defined as follows: hemoglobin concentration ≥8.5 g/dL, neutrophil count >1500/µL and platelet count >75,000/µL. Adequate liver functions were defined as alanine aminotransferase and aspartate aminotransferase levels lower by a factor of 5 than the normal upper limit and total bilirubin level <3.0 mg/dL. Patients requiring hemodialysis were not included. Patients were also considered ineligible if they received concomitant systemic therapy, including any targeted agents. All patients provided written informed consent before receiving sorafenib therapy.
The physician determined the first rPD. Radiologic evaluations were conducted every 4–8 weeks using enhanced computed tomography or magnetic resonance imaging, according to RECIST Version 1.1 [
11]. Time to progression (TTP) was calculated from the date of initial sorafenib administration to the date of first rPD, or was censored at the last follow-up, or at the time of death without rPD. PPS was the primary endpoint and was calculated from the date of first rPD until the date of death or last follow-up.
For this analysis, patients with first rPD were classified into three groups according to post-rPD management as follows: patients who continued to receive sorafenib beyond rPD for at least 1 month (Group A), patients who received other second-line therapies after rPD (Group B) and patients who received best supportive care (BSC) (Group C). Groups A and B were integrated into one post-rPD therapy group (Group A + B) and compared with Group C. Post-rPD management was decided by the physician in accordance with the patient’s condition.
Distributions of variables among the groups were compared using the χ
2 test for categorical data and the Mann–Whitney
U test for continuous data. TTP and PPS were estimated using the Kaplan–Meier method, and the curves were compared using the log-rank test. Cox proportional hazards models were used to identify factors associated with PPS. The models were also used to devise the scoring system for judging the first rPD. Univariate analyses were performed to assess potential factors related to PPS. If the factors attained a significance level of
p < 0.01, a multivariate proportional hazard model for these factors was constructed to estimate each coefficient (β) and hazards ratio. Scores were defined according to the weighted sum of those factors, with weights defined simply as the estimated coefficients. Cutoff value, sensitivity and specificity for PPS were assessed using the time-dependent receiver-operating characteristic (ROC) curve [
12] and area under ROC (AUROC) curves. ROC curves were plotted with 1-specificity and sensitivity measured along the horizontal and vertical axes, respectively. All statistical analyses were performed using R Version 3.0.1 (The R Foundation for Statistical Computing, Vienna, Austria).
3. Results and Discussion
3.1. Results
3.1.1. Patient Characteristics and Outcomes
Sorafenib was administered to 101 patients from July, 2008–April, 2012, at five SALC institutions. Seventy-six patients experienced their first rPD, and the remaining 25 patients were either alive without rPD (
n = 17) or discontinued sorafenib caused by adverse events before rPD (
n = 8). Among the patients documented with rPD, 26 were in Group A, 29 in Group B and 21 in Group C. Group A (beyond rPD) and Group B (second-line therapy) were integrated into one group (Group A + B), and the patient characteristics for the A + B and C groups at the first rPD are listed in
Table 1. At the first rPD, ECOG PS, Child–Pugh class and the level of α-fetoprotein (AFP) of Group C were significantly worse than those of Group A + B. Dose reduction or interruption of sorafenib were required for 45 patients (81.8%) in Group A + B and 12 patients (57.1%) in Group C (
p = 0.027). The median TTP was significantly longer in Group A + B than in Group C (2.5
vs. 1.8 months, respectively;
p = 0.012). Similarly, median PPS was also significantly longer in Group A + B than in Group C (9.5
vs. 2.1 months, respectively;
p < 0.001).
Table 1.
Patient characteristics.
Table 1.
Patient characteristics.
| Variable | Group A + B
n = 55 | Group C
n = 21 | p |
|---|
| At initiation of sorafenib treatment |
| Sex, n (%) | | | |
| Male | 42 (76) | 17 (81) | 0.670 |
| Female | 13 (24) | 4 (19) | |
| Therapy before sorafenib, n (%) | | | |
| Surgical resection | 23 (42) | 8 (38) | 0.769 |
| Locoregional ablation | 29 (53) | 12 (57) | 0.732 |
| Transarterial chemoembolization | 45 (82) | 15 (71) | 0.324 |
| Median number of therapies before sorafenib | 4 | 5 | 0.420 |
| At the first rPD |
| Median age, years | 74 | 77 | 0.406 |
| ECOG PS, n (%) | | | |
| 0, 1 | 51 (93) | 12 (57) | <0.001 |
| ≥2 | 3 (5) | 9 (43) | |
| Unknown | 1 (2) | 0 | |
| Cause of liver disease, n (%) | | | |
| HCV | 29 (53) | 17 (80) | 0.074 |
| HBV | 9 (16) | 2 (10) | |
| Others | 17 (31) | 2 (10) | |
| Child–Pugh class, n (%) | | | |
| A | 35 (64) | 5 (24) | <0.001 |
| B | 19 (34) | 11 (52) | |
| C | 0 | 5 (24) | |
| Unknown | 1 (2) | 0 | |
| BCLC stage, n (%) | | | |
| B | 21 (38) | 5 (24) | 0.241 |
| C | 34 (62) | 16 (76) | |
| Incidence of severe AEs, n (%) | 30 (55) | 10 (48) | 0.591 |
| History of treatment interruption, n (%) | 30 (55) | 10 (48) | 0.591 |
| Best antitumor response †, n (%) | | | |
| Partial response | 2 (4) | 1 (5) | 0.424 |
| Stable disease | 22 (40) | 5 (24) | |
| Progression disease | 31 (56) | 15 (71) | |
| Median AFP, ng/mL | 77 | 2,506 | 0.032 |
| AFP >1000 ng/mL, n (%) | 14 (25) | 11 (52) | 0.023 |
3.1.2. Prognostic Factors for PPS
The following variables at the first rPD based on previous reports [
3,
4,
13,
14,
15,
16,
17,
18,
19,
20,
21,
22] and clinical experiences were selected for analysis as follows: age, gender, ECOG PS, Child–Pugh class, Barcelona Clinic Liver Cancer stage, best antitumor response until first rPD using RECIST Version 1.1, tumor shrinkage, contrast enhancement disappeared lesion, adverse events caused by sorafenib, course of treatment and AFP level. In univariate analyses, ECOG PS ≥2 points (
p < 0.001), Child-Pugh B (
p < 0.001), Child-Pugh C (
p < 0.001), PD as the best antitumor response (
p = 0.004) and AFP level >1000 ng/mL (
p = 0.002) were statistically-significant factors for PPS. These factors were selected as independent factors affecting PPS in multivariate analysis (
Table 2).
Table 2.
Cox proportional hazard model analysis of post-progression survival (PPS).
Table 2.
Cox proportional hazard model analysis of post-progression survival (PPS).
| Variable | Univariate | Multivariate |
|---|
| p | β | HR (95% CI) | p |
|---|
| Age > 70 years | 0.090 | | | |
| Male | 0.646 | | | |
| ECOG PS ≥ 2 | <0.001 | 0.943 | 2.568 (1.317–5.006) | 0.006 |
| Child-Pugh Class A | | | 1 | |
| B | <0.001 | 0.846 | 2.329 (1.173–4.624) | 0.016 |
| C | <0.001 | 3.200 | 24.525 (5.860–102.635) | <0.001 |
| BCLC Stage C | 0.414 | | | |
| PD as the best antitumor response | 0.004 | 1.162 | 3.195 (1.625–6.279) | 0.001 |
| Absence of tumor shrinkage | 0.918 | | | |
| Absence of contrast enhancement disappeared lesion | 0.398 | | | |
| History of AEs ≥ Grade 3 | 0.468 | | | |
| History of interrupted treatment | 0.457 | | | |
| AFP > 1000 ng/mL | 0.002 | 0.912 | 2.490 (1.327–4.673) | 0.005 |
3.1.3. Post-rPD Therapy
To determine an indicator for judging cPD at the first rPD, the scoring system for PPS was designed using the factors described above (
Table 3). The median score was significantly lower for Group A + B than Group C (one
vs. three points, respectively;
p < 0.001). The AUROC was 0.856 in time-dependent ROC for PPS according to Group C. The cutoff value for the scoring system of two points yielded a theoretical sensitivity of 71.5% and a theoretical specificity of 87.5%. When scores were limited to ≥2 points, no statistically-significant difference in PPS was observed between Groups A + B and C (median 4.1
vs. 1.9 months, respectively;
p = 0.220). In contrast, the PPS of Group A + B was significantly longer than that of Group C in patients with scores of zero or one (median 14.0
vs. 3.3 months, respectively;
p < 0.001) (
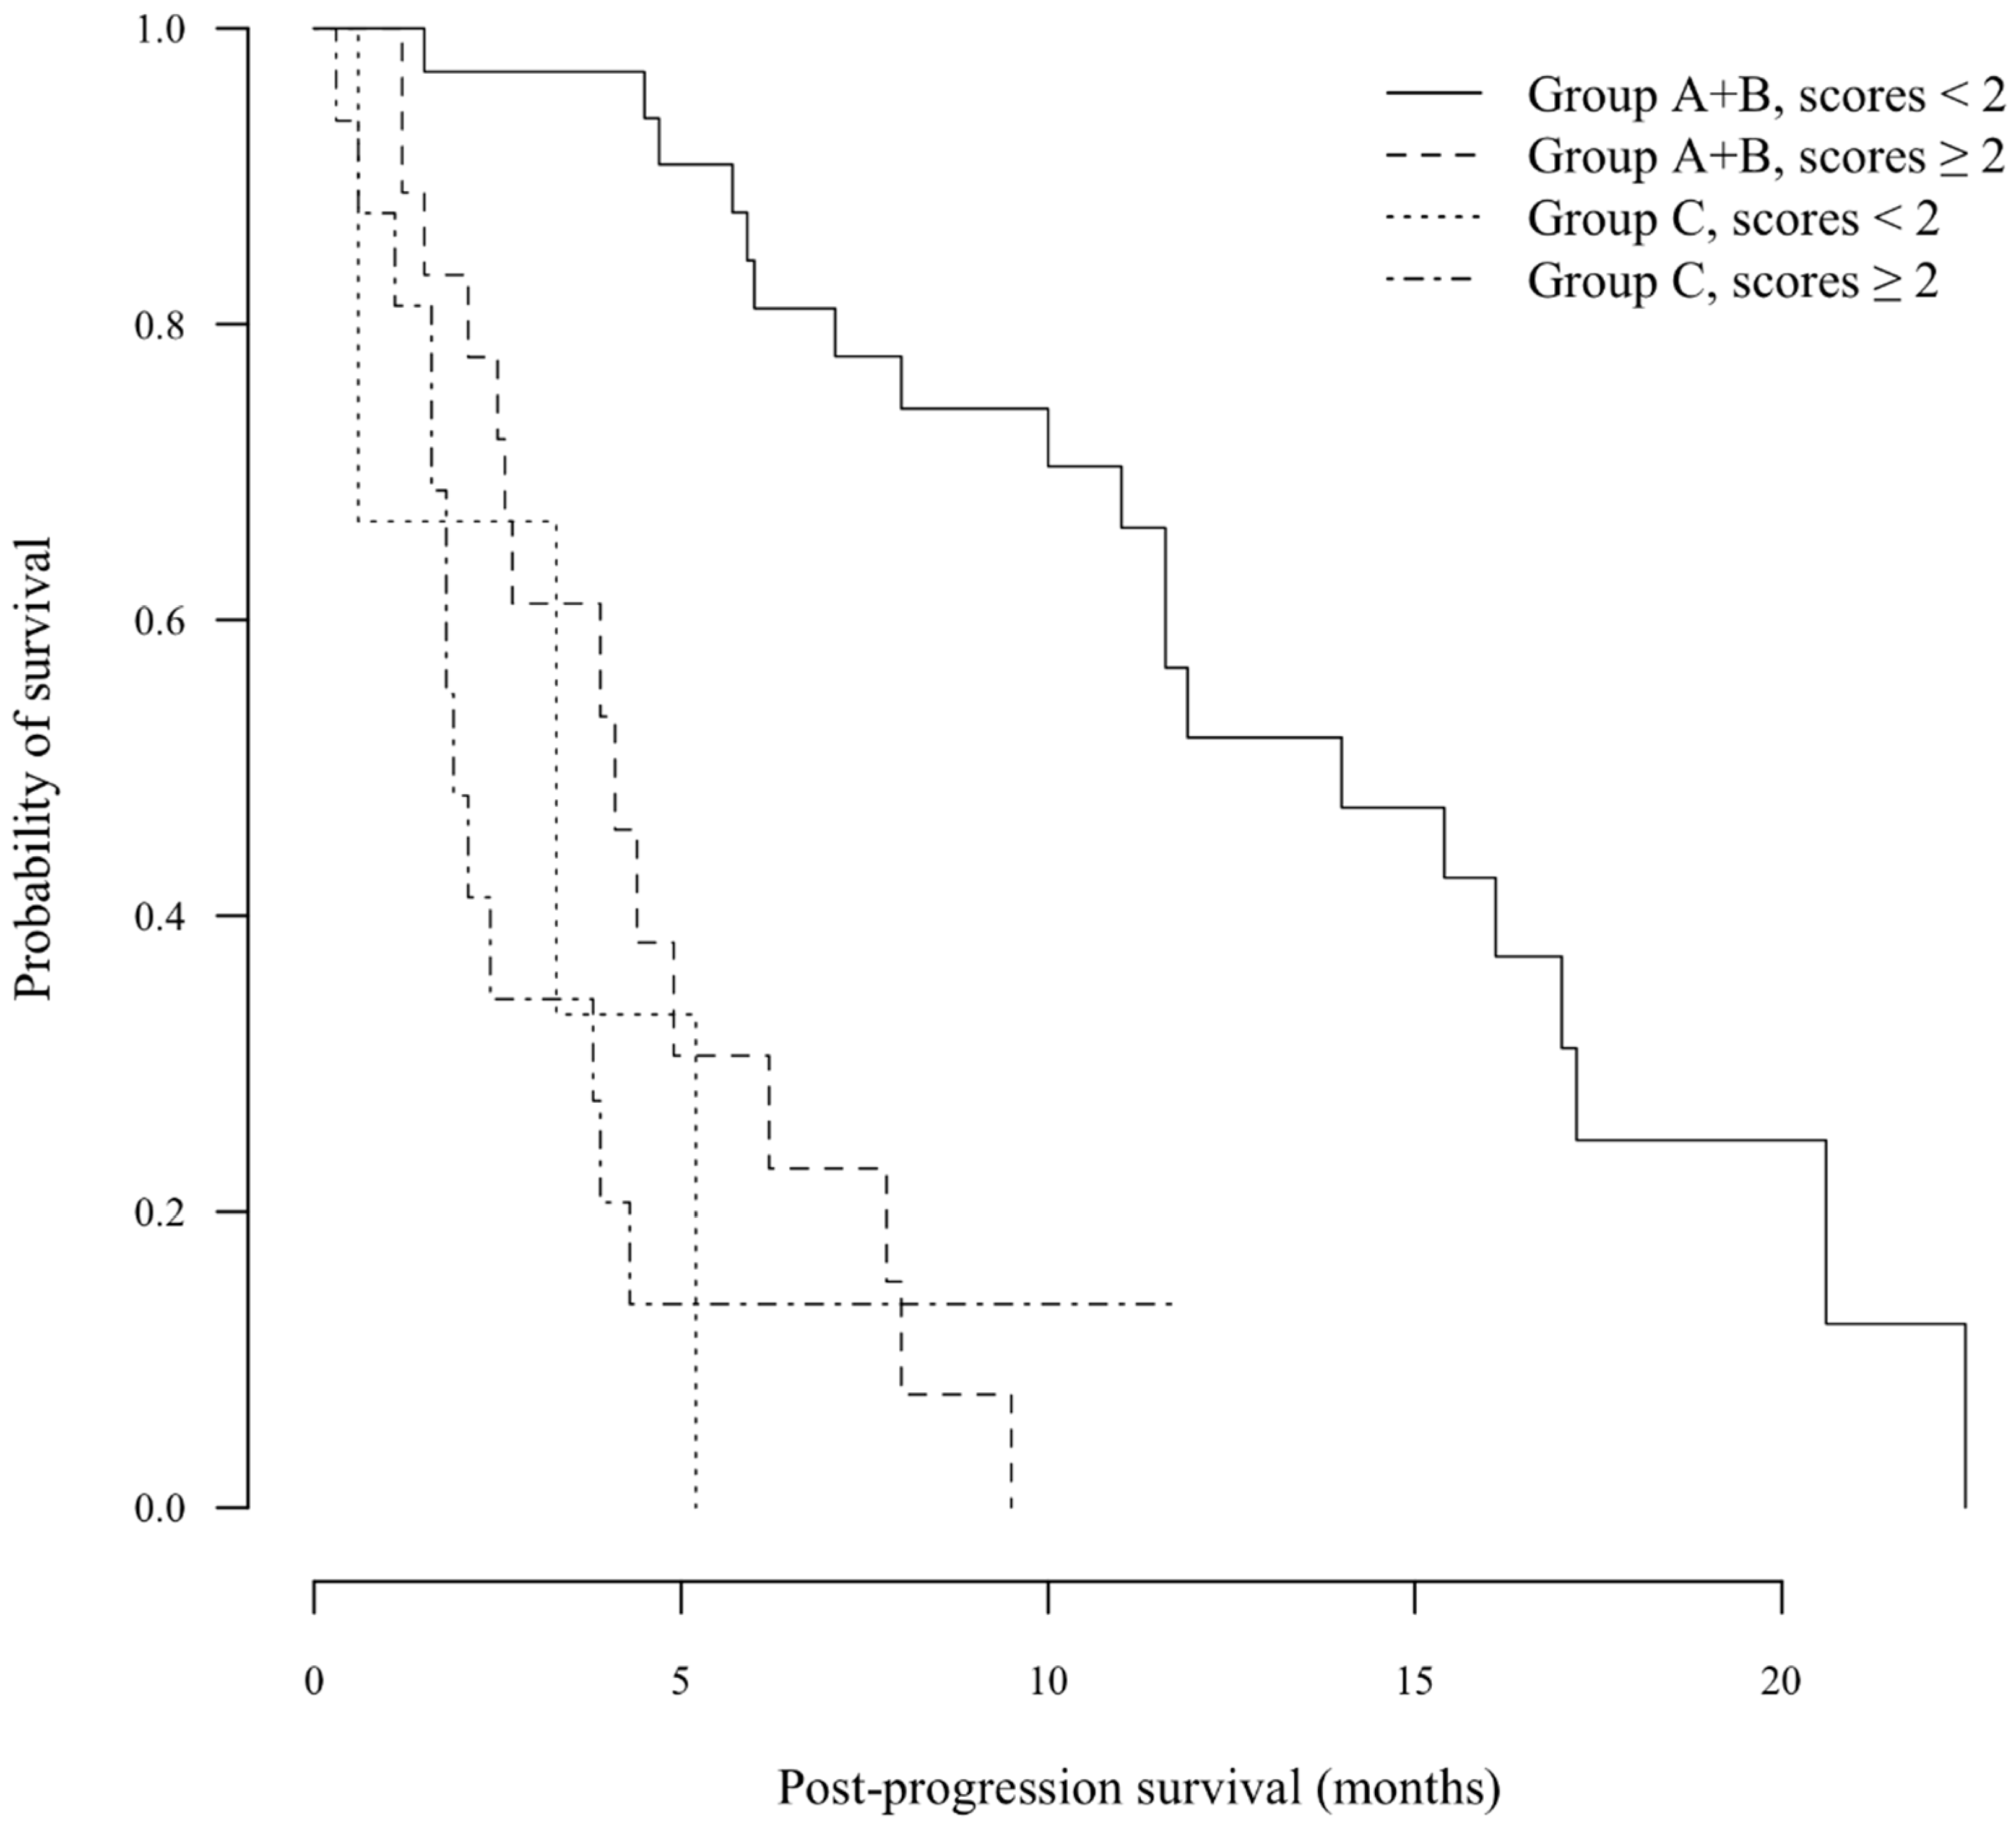
Figure 1), although there were only three patients in Group C with scores of zero or one.
Table 3.
Scoring system for PPS.
Table 3.
Scoring system for PPS.
| Variables at the first rPD | Score |
|---|
| 0 | 1 | 2 |
|---|
| Child-Pugh class | A | B | C |
| ECOG PS | 0, 1 | ≥2 | |
| Best response † | CR/PR/SD | PD | |
| AFP | <1000 ng/mL | ≥1000 ng/mL | |
Figure 1.
Kaplan–Meier analysis of post-progression survival (PPS). In patients with scores ≥2 points, no statistically-significant difference in PPS was observed between the A + B and C groups (median 4.1 vs. 1.9 months, respectively; p = 0.220). In contrast, the PPS of Group A + B was significantly longer than that of Group C in patients with scores <2 points (median 14.0 vs. 3.3 months, respectively; p < 0.001).
3.1.4. Beyond rPD
When patient characteristics were compared between Groups A and B, there were no statistically-significant differences with respect to the variables at baseline or first rPD as described above in comparisons between the A + B and C groups. With reference to treatment duration of sorafenib after first rPD in Group A, median time to sorafenib withdrawal was 2.7 months. Post-rPD therapies of Group B were as follows: transarterial chemoembolization (n = 14), systemic chemotherapy with fluoropyrimidines (n = 7), hepatic arterial infusion chemotherapy (n = 4), other targeted therapy (n = 3) and radiofrequency ablation (n = 1).
The median PPS was 8.0 months for Group A and 10.0 months for Group B (p = 0.310). Sixteen and 18 patients in Group A and B, respectively, scored between zero and one. Their prognoses were better, and median PPS was comparable between the two groups (both median 11.6 months; p = 0.537). In contrast, patients with scores ≥2 points, PPS was poorer compared with those with scores of zero or one (median 3.9 vs. 11.6 months, respectively; p < 0.001).
3.2. Discussion
The present study identifies prognostic factors for PPS in patients treated with sorafenib, and we propose a numerical indicator for cPD. Prognoses for patients with scores ≥2 were very poor; PPS did not vary significantly between Groups A + B and C. Therefore, these patients could be judged as cPD, and BSC would be recommended for treating these patients after the first rPD.
Although tumor response has been used in clinical research as a surrogate indicator of survival, the survival benefit of sorafenib for advanced HCC does not correlate with decreased tumor size [
3,
4]. Therefore, distinguishing disease progression using conventional response criteria can be difficult, and vigorous research has been conducted to identify other surrogate indicators or biomarkers to assess the effects of sorafenib on patients with HCC. For example, AFP levels and AFP response correlate with survival outcomes [
3,
16,
17]. Similarly, ECOG PS and Child-Pugh class correlated with the prognosis of patients with advanced HCC who were treated with sorafenib [
3,
19,
20]. The modified RECIST (mRECIST) is widely used to assess the effect of treatment on patients with HCC [
22]. The data of the present study were also evaluated with mRECIST, and the same results were obtained.
PPS was comparable between patients in Groups A and B who continued sorafenib beyond rPD, as well as for patients treated using other therapies after rPD. For patients with metastatic colorectal cancer treated with first-line therapy that included bevacizumab, continuing bevacizumab beyond progressive disease increased survival, showing the efficacy of continuous inhibition of angiogenesis for cancer therapy [
23,
24,
25]. Moreover, tumor rebound occurs after discontinuing anti-angiogenic therapy [
26,
27,
28]. Second-line therapy after sorafenib failure is not well established for patients with advanced HCC, although several randomized trials are in progress to define salvage therapy [
29,
30,
31]. A randomized phase 2 study showed that increasing the dose of sorafenib beyond progressive disease resulted in a trend, although not statistically significant, toward improved progression-free and overall survival, compared with BSC administered to patients with progressive disease previously treated with sorafenib [
32]. Our present results demonstrate that continuation of sorafenib beyond rPD may provide a therapeutic option for patients with scores of zero or one until promising second-line regimens become available. However, we were unable to identify patients more likely to respond to continued sorafenib treatment beyond rPD. The number of patients in our study was limited. Moreover, it is possible that the lower score in Group A + B might be reflected by a selection bias because post-rPD management relied on physician’s decision in this retrospective study. To overcome these limitations, further studies are required to define the role of post-rPD therapy. We are conducting a prospective study to validate the efficacy of sorafenib therapy beyond rPD and the reliability of the score.
4. Conclusions
Child-Pugh class, ECOG PS, the best antitumor response during treatment and AFP levels were identified as independent factors affecting PPS. We propose a useful scoring system as an adjunct to RECIST for predicting rPD in patients with advanced HCC. Because prognoses for patients with scores ≥2 at first rPD were very poor, BSC may be recommended in these patients with cPD until promising second-line therapy becomes available.
Author Contributions
T.O. designed the study, analyzed and interpreted the data and wrote the manuscript. T.O. and S.N. collected the data. Y.E. and T.M. supervised the study and edited the manuscript. All authors treated patients and gave final approval of the article.
Conflicts of Interest
The authors declare no conflict of interest.
References
- El-Serag, H.B.; Rudolph, K.L. Hepatocellular carcinoma: Epidemiology and molecular carcinogenesis. Gastroenterology 2007, 132, 2557–2576. [Google Scholar] [CrossRef] [PubMed]
- McGlynn, K.A.; Tsao, L.; Hsing, A.W.; Devesa, S.S.; Fraumeni, J.F., Jr. International trends and patterns of primary liver cancer. Int. J. Cancer 2001, 94, 290–296. [Google Scholar] [CrossRef] [PubMed]
- Llovet, J.M.; Ricci, S.; Mazzaferro, V.; Hilgard, P.; Gane, E.; Blanc, J.F.; de Oliveira, A.C.; Santoro, A.; Raoul, J.L.; Forner, A.; et al. Sorafenib in advanced hepatocellular carcinoma. N. Engl. J. Med. 2008, 359, 378–390. [Google Scholar] [CrossRef] [PubMed]
- Cheng, A.L.; Kang, Y.K.; Chen, Z.; Tsao, C.J.; Qin, S.; Kim, J.S.; Luo, R.; Feng, J.; Ye, S.; Yang, T.S.; et al. Efficacy and safety of sorafenib in patients in the Asia-Pacific region with advanced hepatocellular carcinoma: A phase III randomised, double-blind, placebo-controlled trial. Lancet Oncol. 2009, 10, 25–34. [Google Scholar] [CrossRef] [PubMed]
- Saad, E.D.; Katz, A.; Buyse, M. Overall survival and post-progression survival in advanced breast cancer: A review of recent randomized clinical trials. J. Clin. Oncol. 2010, 28, 1958–1962. [Google Scholar] [CrossRef] [PubMed]
- Hotta, K.; Kiura, K.; Fujiwara, Y.; Takigawa, N.; Hisamoto, A.; Ichihara, E.; Tabata, M.; Tanimoto, M. Role of survival post-progression in phase III trials of systemic chemotherapy in advanced non-small-cell lung cancer: A systematic review. PLoS ONE 2011, 6, e26646. [Google Scholar] [CrossRef] [PubMed]
- Petrelli, F.; Barni, S. Correlation of progression-free and post-progression survival with overall survival in advanced colorectal cancer. Ann. Oncol. 2013, 24, 186–192. [Google Scholar] [CrossRef] [PubMed]
- Oxnard, G.R.; Morris, M.J.; Hodi, F.S.; Baker, L.H.; Kris, M.G.; Venook, A.P.; Schwartz, L.H. When progressive disease does not mean treatment failure: Reconsidering the criteria for progression. J. Natl. Cancer Inst. 2012, 104, 1534–1541. [Google Scholar] [CrossRef] [PubMed]
- Therasse, P. Measuring the clinical response. What does it mean? Eur. J. Cancer 2002, 38, 1817–1823. [Google Scholar] [CrossRef] [PubMed]
- Ratain, M.J.; Eckhardt, S.G. Phase II studies of modern drugs directed against new targets: If you are fazed, too, then resist RECIST. J. Clin. Oncol. 2004, 22, 4442–4445. [Google Scholar] [CrossRef] [PubMed]
- Eisenhauer, E.A.; Therasse, P.; Bogaerts, J.; Schwartz, L.H.; Sargent, D.; Ford, R.; Dancey, J.; Arbuck, S.; Gwyther, S.; Mooney, M.; et al. New response evaluation criteria in solid tumours: Revised RECIST guideline (version 1.1). Eur. J. Cancer 2009, 45, 228–247. [Google Scholar] [CrossRef] [PubMed]
- Heagerty, P.J.; Lumley, T.; Pepe, M.S. Time-dependent ROC curves for censored survival data and a diagnostic marker. Bilmetrics 2000, 56, 337–344. [Google Scholar] [CrossRef]
- Kim, H.Y.; Park, J.W.; Nam, B.H.; Kim, H.K.; Choi, J.I.; Kim, T.H.; Kim, H.B.; Kim, C.M. Survival of patients with advanced hepatocellular carcinoma: Sorafenib versus other treatments. J. Gastroenterol. Hepatol. 2011, 26, 1612–1618. [Google Scholar] [CrossRef] [PubMed]
- Marrero, J.A.; Lencioni, R.; Kudo, M.; Ye, S.; Nakajima, K.; Cihon, F.; Venook, A.P. Global Investigation of Therapeutic Decisions in Hepatocellular Carcinoma and of its Treatment with Sorafenib (GIDEON) second interim analysis in more than 1,500 patients: Clinical findings in patients with liver dysfunction. J. Clin. Oncol. 2011, 29. Abstract 4001. [Google Scholar]
- Bruix, J.; Raoul, J.L.; Sherman, M.; Mazzaferro, V.; Bolondi, L.; Craxi, A.; Galle, P.R.; Santoro, A.; Beaugrand, M.; Sangiovanni, A.; et al. Efficacy and safety of sorafenib in patients with advanced hepatocellular carcinoma: Subanalyses of a phase III trial. J. Hepatol. 2012, 57, 821–829. [Google Scholar] [CrossRef] [PubMed]
- Shao, Y.Y.; Lin, Z.Z.; Hsu, C.; Shen, Y.C.; Hsu, C.H.; Cheng, A.L. Early alpha-fetoprotein response predicts treatment efficacy of antiangiogenic systemic therapy in patients with advanced hepatocellular carcinoma. Cancer 2010, 116, 4590–4596. [Google Scholar] [CrossRef] [PubMed]
- Personeni, N.; Bozzarelli, S.; Pressiani, T.; Rimassa, L.; Tronconi, M.C.; Sclafani, F.; Carnaghi, C.; Pedicini, V.; Giordano, L.; Santoro, A. Usefulness of alpha-fetoprotein response in patients treated with sorafenib for advanced hepatocellular carcinoma. J. Hepatol. 2012, 57, 101–107. [Google Scholar] [CrossRef] [PubMed]
- Kudo, M.; Ueshima, K.; Arizumi, T. Real-life clinical practice with sorafenib in advanced hepatocellular carcinoma: A single-center experience. Digit. Distrib. 2012, 30, 609–616. [Google Scholar]
- Nojiri, S.; Kusakabe, A.; Fujiwara, K.; Shinkai, N.; Matsuura, K.; Iio, E.; Miyaki, T.; Nomura, T.; Sobue, S.; Sano, H.; et al. Clinical factors related to long-term administration of sorafenib in patients with hepatocellular carcinoma. Cancer Manag. Res. 2012, 4, 423–429. [Google Scholar] [CrossRef] [PubMed]
- Pressiani, T.; Boni, C.; Rimassa, L.; Labianca, R.; Fagiuoli, S.; Salvagni, S.; Ferrari, D.; Cortesi, E.; Porta, C.; Mucciarini, C.; et al. Sorafenib in patients with Child-Pugh class A and B advanced hepatocellular carcinoma: A prospective feasibility analysis. Ann. Oncol. 2013, 24, 406–411. [Google Scholar] [CrossRef] [PubMed]
- Otsuka, T.; Eguchi, Y.; Kawazoe, S.; Yanagita, K.; Ario, K.; Kitahara, K.; Kawasoe, H.; Kato, H.; Mizuta, T.; the Saga Liver Cancer Study Group. Skin toxicities and survival in advanced hepatocellular carcinoma patients treated with sorafenib. Hepatol. Res. 2012, 42, 879–886. [Google Scholar] [CrossRef] [PubMed]
- Lencioni, R.; Llovet, J.M. Modified RECIST (mRECIST) assessment for hepatocellular carcinoma. Semin. Liver Dis. 2010, 30, 52–60. [Google Scholar] [CrossRef] [PubMed]
- Grothey, A.; Sugrue, M.M.; Purdie, D.M.; Dong, W.; Sargent, D.; Hedrick, E.; Kozloff, M. Bevacizumab beyond first progression is associated with prolonged overall survival in metastatic colorectal cancer: Results from a large observational cohort study (BRiTE). J. Clin. Oncol. 2008, 26, 5326–5334. [Google Scholar] [CrossRef] [PubMed]
- Cohn, A.L.; Bekaii-Saab, T.; Bendell, J.C.; Hurwitz, H.; Kozloff, M.; Roach, N.; Tezcan, H.; Feng, S.; Sing, A.; Grothey, A.; et al. Clinical outcomes in bevacizumab (BV)-treated patients (pts) with metastatic colorectal cancer (mCRC): Results from ARIES observational cohort study (OCS) and confirmation of BRiTE data on BV beyond progression (BBP). J. Clin. Oncol. 2010, 28. Abstract 3596. [Google Scholar]
- Bennouna, J.; Sastre, J.; Arnold, D.; Österlund, P.; Greil, R.; Van Cutsem, E.; von Moos, R.; Viéitez, J.M.; Bouché, O.; Borg, C.; et al. Continuation of bevacizumab after first progression in metastatic colorectal cancer (ML18147): A randomised phase 3 trial. Lancet Oncol. 2013, 14, 29–37. [Google Scholar] [CrossRef] [PubMed]
- Mancuso, M.R.; Davis, R.; Norberg, S.M.; O'Brien, S.; Sennino, B.; Nakahara, T.; Yao, V.J.; Inai, T.; Brooks, P.; Freimark, B.; et al. Rapid vascular regrowth in tumors after reversal of VEGF inhibition. J. Clin. Investig. 2006, 116, 2610–2621. [Google Scholar] [CrossRef] [PubMed]
- Batchelor, T.T.; Sorensen, A.G.; di Tomaso, E.; Zhang, W.T.; Duda, D.G.; Cohen, K.S.; Kozak, K.R.; Cahill, D.P.; Chen, P.J.; Zhu, M.; et al. AZD2171, a pan-VEGF receptor tyrosine kinase inhibitor, normalizes tumor vasculature and alleviates edema in glioblastoma patients. Cancer Cell 2007, 11, 83–95. [Google Scholar] [CrossRef]
- Van Malenstein, H.; Dekervel, J.; Verslype, C.; Van Cutsem, E.; Windmolders, P.; Nevens, F.; van Pelt, J. Long-term exposure to sorafenib of liver cancer cells induces resistance with epithelial-to-mesenchymal transition, increased invasion and risk of rebound growth. Cancer Lett. 2013, 329, 74–83. [Google Scholar] [CrossRef] [PubMed]
- Villanueva, A.; Llovet, J.M. Targeted therapies for hepatocellular carcinoma. Gastroenterology 2011, 140, 1410–1426. [Google Scholar] [CrossRef] [PubMed]
- Chan, S.L.; Yeo, W. Targeted therapy of hepatocellular carcinoma: Present and future. J. Gastroenterol. Hepatol. 2012, 27, 862–872. [Google Scholar] [CrossRef] [PubMed]
- Santoro, A.; Rimassa, L.; Borbath, I.; Daniele, B.; Salvagni, S.; van Laethem, J.L.; van Vlierberghe, H.; Trojan, J.; Kolligs, F.T.; Weiss, A.; et al. Tivantinib for second-line treatment of advanced hepatocellular carcinoma: A randomised, placebo-controlled phase 2 study. Lancet Oncol. 2013, 14, 55–63. [Google Scholar] [CrossRef] [PubMed]
- Rimassa, L.; Pressiani, T.; Boni, C.; Carnaghi, C.; Rota Caremoli, E.; Fagiuoli, S.; Foa, P.; Salvagni, S.; Cortesi, E.; Chiara Tronconi, M.; et al. A phase II randomized dose escalation trial of sorafenib in patients with advanced hepatocellular carcinoma. Oncologist 2013, 18, 379–380. [Google Scholar] [CrossRef] [PubMed]
© 2015 by the authors; licensee MDPI, Basel, Switzerland. This article is an open access article distributed under the terms and conditions of the Creative Commons Attribution license (http://creativecommons.org/licenses/by/4.0/).


