Article

The Impact of Over-the-Top Television Services on Pay-Television Subscription Services in South Africa

by
Nokuphiwa Udoakpan
* and
Robertson Khan Tengeh
*
Graduate Centre for Management, Faculty of Business and Management Sciences, Cape Peninsula University of Technology, Cape Town 7535, South Africa
*
Authors to whom correspondence should be addressed.
J. Open Innov. Technol. Mark. Complex. 2020, 6(4), 139; https://doi.org/10.3390/joitmc6040139
Submission received: 13 October 2020 / Revised: 7 November 2020 / Accepted: 8 November 2020 / Published: 10 November 2020

Abstract

:
Globally, developments and innovations in television technology, including the launch and growth of over-the-top television services (OTT TV), have affected traditional pay-TV operators’ ability to grow a subscriber base and retain existing customers. Despite attempts made by the Independent Communications Authority of South Africa (ICASA) to ascertain the impact of the OTT TV on pay-TV services, the results have remained inconclusive. In the absence of a comprehensive assessment and credible evidence, this paper sought to ascertain the impact that OTT TV services have on traditional pay-TV services in South Africa. A quantitative research method was adopted using a non-probability sampling technique for data collection. A total of 391 responses were collected utilising an online survey questionnaire and analysed using descriptive statistics on IBM® SPSS® version 26. The main findings of the study showed that OTT TV services are a complementary service to pay-TV services as opposed to a substitute. Low-income earners are using free/paid mobile applications to consume TV content, and for those who have neither OTT TV nor pay-TV services, free-to-air services are the preferred platform for TV consumption. This study benefits all stakeholders in digital media and business strategy, as well as marketing students.

1. Introduction

Television consumers are increasingly streaming television content online using OTT TV services that distribute online videos through the Internet or other Internet Protocol (IP)-based transmission paths [1,2]. These services are also known as subscription video-on-demand (SVOD) or online video streaming platforms, and throughout this document, the term OTT TV will be used [3]. Owing to accessibility, availability, and increasingly cheap broadband data, consumer television viewing habits are changing, and thus, consumers are adopting online streaming platforms as they want to watch what they want and when they want.
Noting that South Africa is not immune to global changes in the television broadcasting sector, the Group CEO of MultiChoice South Africa (MCSA) complained that OTT TV service operators have an unfair advantage as there is little or no regulation [4]. Furthermore, the same source notes that this makes it difficult to compete, and thus MCSA requested the Independent Communications Authority of South Africa (ICASA) to regulate the industry. However, the consumer survey initiated by ICASA to “understand consumer behaviour concerning television broadcasting and video-on-demand services”, in its preliminary findings, disputed these complaints, noting that the impact in South Africa is small and imperceptible owing to the unavailability of affordable and quality broadband data [5].
In response to ICASA’s preliminary findings, MCSA argues that the findings are unreliable owing to the vagueness and lack of credibility of the survey questions. MCSA further notes that the survey questions did not consider that consumers are adopting alternative devices for television consumption. Thus, consumers are either cancelling their pay-TV services or downgrading premium packages for lower packages to substitute with OTT TV services. Moreover, the study did not take into consideration that there are new subscribers who are choosing OTT TV over pay-TV subscription services for the first-time subscription [6].
Elsewhere, there are suggestions that there is a relationship between the adoption of OTT TV services and the subscription base of the traditional pay-TV services [7,8,9]. That relationship is not clear in South Africa. In the absence of a comprehensive and credible assessment of the impact that OTT TV services have on traditional pay-TV subscription services, a scientific investigation and evidence were necessary to enable regulatory bodies to make informed decisions on the real impact. Therefore, this research study’s main objective was to ascertain the impact that OTT TV services have on traditional pay-TV services in South Africa.
Although OTT TV services proliferate, the literature on this subject is limited, and the majority of the research focuses on the U.S. markets [2]. Therefore, this paper will assess the impact of OTT TV services on pay-TV in the South African context. A critical review of empirical and theoretical studies relevant to this paper is discussed. This is followed by discussions of the research methodologies adopted to carry out the study to achieve its objectives. After that, the study findings are presented and discussed. Finally, discussion of the findings correlated with the study’s research objectives takes place with conclusions drawn from the findings provided, including recommendations and suggestions for future research.

2. Literature Review

2.1. Overview of Pay-TV Subscription Services in South Africa

South Africa has an estimated population of 58.78 million, and according to the general household survey conducted by Statistics South Africa (Stats SA) in 2018, 82.2% of South African households own a TV set. Almost 90% of the population owns a mobile handset [10,11]. South Africa has free-to-air television (FTA) stations and pay-TV services. The primary FTA services are the state-owned national broadcaster, the South African Broadcasting Corporation (SABC), and the privately-owned broadcaster, eTV, including OpenView. eMedia holdings own both eTV and OpenView. OpenView launched in 2013 [12].
Pay-TV refers to paid television services provided to a consumer for a fee [6]. Home Box Office (HBO) was the first network to distribute television content via satellite in 1972 and this was a significant technological advancement in the TV broadcasting sector and the beginning of cable television. Over the years, the world has seen the emergence of other pay-TV providers [13]. In South Africa, such pay-TV operators are DStv and StarSat, and the estimated number of pay-TV subscribers in South Africa is about 6.8 million [14].
Pay-TV services in South Africa launched in 1986 with the launch of the M-Net company by the Naspers group, which subsequently formed MultiChoice in 1995. MultiChoice launched digital satellite television services (DStv) in 1995. DStv was the first pay-TV product launched outside of the United States of America (USA) and the African region [15]. MultiChoice’s DStv has been a dominant player in the pay-TV industry for decades up until the issue of pay-TV operators licences in 2007, leading to the birth of pay-TV operators such as StarSat and many others who subsequently failed to launch their services [16]. StarSat launched in 2007 following the acquisition of TopTV [17].
Dramatic changes across the world, including South Africa, have seen the emergence of OTT TV service providers such as Netflix, YouTube Premium, Amazon Prime, Black, and Showmax. These OTT TV service providers disrupt the television broadcasting space, change TV content consumption and give viewers more choice [6]. These developments are painting the future of pay-TV as we know it, perhaps threatening its survival, and thus, it is not business as usual in South Africa.
Further to this, reduction trends in data costs, including the accessibility of the internet through public Wi-Fi free zones and the workplaces have contributed to the growth of OTT TV [18,19]. These trends have made it possible for consumers to access TV content conveniently, using any device of their choice [6]. The calls and recommendations for broadband data cost reduction, including pressure from the #DataMustFall campaign, predict a further reduction in data costs in the future [20]. There has already been a reduction in data costs, as MTN and Vodacom announced a data price reduction in South Africa by almost 30% following the competition council pronouncement [21].
Given these developments, it is arguable that TV viewing behaviour may be changing as we know it, and this prompts a question about the impact of these developments on South African traditional pay-TV services.

2.2. Overview of OTT TV Services in South Africa

Some of the significant OTT TV services providers operating in South Africa are Netflix, Showmax, YouTube Premium, and Amazon Prime Video [6]. Table 1 provides a summarised view of these OTT TV services.

2.3. Theoretical Perspective

The uses and gratifications theory establish the influences of consumers’ television consumption habits. Furthermore, it aids in studying, predicting, and understanding how TV consumption can evolve [34].

The Uses and Gratifications Theory

The uses and gratifications theory emerged in the late 1940s [35]. This theory “represents an attempt to explain something of how individuals use communications, among other resources in their environment, to satisfy their needs and to achieve their goals, and to do so by simply asking them” [36].
It is applied to measure consumers’ motivation for using chosen media platforms such as newspapers, television, and smartphones [35]. It propels consumers’ choice of the type of media and content consumed to satisfy social and psychological needs [37]. The uses and gratifications theory states that people are affected differently by the same media content, based on their ideas and what they want to do with the media [38]. Additionally, it implies that the consumer’s choice and selection of media depend on individual personalities, values, background, race, and gender [37,39].
The need for information, convenience utility, entertainment, and social connection interaction informs gratification sought from media consumption [39,40].
  • Information—This refers to the need to obtain information online for self-education for various reasons, including entertainment. Therefore, for online TV content, this refers to consumers browsing different sites to obtain information or to find a specific programme to view at a specific time based on their preference and what is convenient to their lifestyle or needs.
  • Convenience utility—OTT TV services are a convenient media source to search for content without being bound by geographical location, unlike with pay-TV subscription services; furthermore, information is sourced at any place and on any device.
  • Entertainment—OTT TV services can be a source of entertainment for consumers. They kill time and aid in relaxation.
  • Social interaction—This refers to users’ ability to interact with others and ease of access to online TV content. This, therefore, is an advantage, as consumers can interact with others and communicate their experiences of a specific programme in real-time; for instance, when a particular programme is airing, users can have hashtags on social platforms such as Twitter to discuss the programme.
Entertainment is, therefore, a significant factor that influences consumers to adopt streaming services. Thus, the need for entertainment is a better predictor of cord-cutting than the need for information seeking and companionship.
Further to this, Tefertiller [7] citing Ruggiero (2000) state that “with the arrival of digital media, three concepts closely related to Web technology would facilitate audience behaviours related to gratification seeking: interactivity, demassification, and asynchroneity”.
  • Demassification—Refers to users’ ability to select programmes or content from a wide variety of menus. One can argue that pay-TV services enable consumers to access a wide variety of content, similar to OTT TV services.
  • Asynchroneity—Refers to users’ ability to control a message when it is received. Given that OTT TV services such as Netflix, Showmax, and Amazon Prime have a variety of programmes in their digital library and allow users to select programmes they wish to see at a time convenient to them, this then can predict users’ intentions to cut the cord with pay-TV service operators.
Therefore, consumers may alternate between several media, and pick one over the other based on the level of satisfaction of their specific needs. Thus, consumers may choose OTT TV services over pay-TV based on the need to fulfil and gratification to derive from these services. Therefore, this paper sought to ascertain the impact of these OTT TV services on pay-TV subscription services.

2.4. Impact of OTT TV Services on Pay-TV Operators

Customers are increasingly cord-cutting, which means they are abandoning pay-TV services in favour of OTT TV services [41]. There is a wave of consumers who are cord-shaving, which is downgrading their traditional premium pay-TV subscription services to standard/lower packages and combining their pay-TV services with OTT TV services [42]. Some first-time subscribers have never subscribed to traditional pay-TV services and favour OTT TV services for the first-time subscription; these consumers are called cord-nevers [43].
The cord-cutting, cord-shaving phenomena, including the cord nevers, have resulted in revenue reduction for the pay-TV service providers, while OTT TV service providers are making remarkable market gains [44]. As the world’s economies are going into recession, consumers are cutting down on expenditure, and pay-TV is the initial cost to cut. In the US, pay-TV operators such as DirecTV have lost nearly two million subscribers due to subscription cancellations. Most pay-TV operators’ key selling point is the live sport, and in the absence of sport due to COVID-19, most consumers are turning to game consoles, including OTT TV services [45].

2.4.1. Cord-Cutting

As fixed broadband data subscription grows, so do OTT TV services’ revenues. In contrast, the pay-TV service operators are experiencing the loss of subscribers, with a decline in subscriber numbers, and are struggling to retain existing customers as more consumers are embracing OTT TV services for TV consumption [46]. This phenomenon is proliferating, and the projections are that it will reach over 40 million by the year 2021 [9]. The accessibility to original TV content and convenience by these providers has made it easier for the consumer to access the content. Therefore, OTT TV services are direct competitors of traditional pay-TV operators, as their rise is contributing significantly to the cord-cutting phenomenon.

Cord-Cutting by Demographic Population

From a demographic perspective, several authors report that:
  • The older generation, including those who are not tech-savvy, are hesitant to cut the cord with pay-TV operators because of the fear of adapting to new technologies, including difficulties in learning new technologies [47].
  • Millennials and Generation Z are highly likely to cut the cord as the cost of purchasing a TV set, including a setup box, is deemed a costly exercise compared with a portable laptop used for dual purposes. Young people do not have a steady income. With the continuous rise in subscription fees, these age groups tend to opt for OTT TV services convenient to their lifestyle and which they deem affordable [43]. This trend will continue to grow, especially with these age groups [7].

Reasons for Cord-Cutting

Several authors, including Christenson [48] and Lee, Nagpal et al. [49] concur that reasons for abandoning pay-TV services for OTT TV services are as stated below:
  • Increase in subscription fees. As broadband data becomes affordable, consumers may re-evaluate the cost of a pay-TV subscription, considering the cost of broadband data which is used for multiple purposes.
  • Ability to choose channels, including TV content of one’s choice. Pay-TV subscribers, in general, want to pay for what they use; therefore, availability of this option may indeed lead to cord-cutting.
  • Convenience—the ability to consume TV content using any preferred device at any time. Consumers do not wish to be restricted to one choice of device and place to consume TV content.
Crawford [46] states that cord-cutting emanates from the following factors:
  • Consumption of TV content to satisfy personal needs and lifestyle. Although this may be fulfilling to consumers, it has setbacks, such as limited content available.
  • From a cost–benefit analysis, pay-TV subscription services are perceived not to be worth the price. Moreover, considering the setup costs, including broadband data subscription and time available to consume content, it may not be beneficial. However, it is also arguable that pay-TV offers a variety of genres and content which spans sport, reality TV, documentaries, and news channels.
  • Technology preferences based on the number of available devices at their disposal.
Moreover, migration from pay-TV to OTT TV services is due to the following:
  • The perceived advantages that OTT TV services have over pay-TV services such as the ability to consume television content using any device from more than one service provider, cost of subscription fees, including frustrations with old technology and the inability to obtain features available on OTT TV services [7].
  • Poor customer service [49]. How consumers perceive customer service and their experience may indeed influence cord-cutting, despite the quality of content.
During the COVID-19 pandemic in the US, 1.8 million households cancelled their pay-TV subscriptions with pay-TV operators because of unemployment, high subscription fees, and the lack of live sport. There are now as many non-pay-TV subscribers as there were pay-TV subscribers in 1988. The COVID-19 pandemic will accelerate the cord-cutting phenomenon, while OTT TV services such as Hulu and YouTube Premium continue to grow with Disney+ signing up 54.5 million customers worldwide during this pandemic [50].
Although the cord-cutting phenomenon is high in countries like the US, this trend is not significant in other markets, such as the Korean market. This is due to pay-TV operators combining their traditional offerings with OTT TV services as part of their retention strategy, thus giving these pay-TV operators a competitive advantage [51]. Furthermore, in Japan, a local TV network took over Hulu; this, therefore, can be argued as a strategy to ‘kill the competitor’, retaining existing and attracting new customers [51]. In the South African market, MCSA that owns DStv has combined its offering with Showmax and JOOX music streaming services, a value-add to its top-tier subscribers at no cost [52].
In addition to these strategies, Park [44] states that pay-TV providers are responding to the cord-cutting phenomenon by:
  • implementing a multiscreen which enables consumers to access television everywhere and anywhere;
  • obtaining exclusive rights to television content;
  • having online packages which do not require a setup box. In South Africa, the MultiChoice Group that owns DStv announced a launched of a ‘dishless’ services which do not require a setup box, and this is called Showmax Pro [27].
  • having cloud pay-TV accessible using smart TV sets; and
  • offering consumers the option to select and pay for the channels they use [53].
Although the cord-cutting phenomenon poses threats to pay-TV operators, they continue to increase subscription fees, despite growing concerns of losing subscribers. In South Africa, year after year, DStv continues to increase subscription fees despite the threat of cord-cutting [54]. The projections are that traditional pay-TV services subscribers will decrease even further, with the OTT TV market growing significantly [9].
Notwithstanding this, although OTT TV services are growing exponentially, pay-TV is here to stay, as people turn to their television sets during times of crisis and watch live shows such as American Idol [43]. There is still a 57% revenue increase for cable and satellite companies [47]. For instance, in the Turkish market, OTT TV services are expected to be complementary to pay-TV services due to the availability of broadband internet services, including the fact that pay-TV service operators offer OTT TV services to their customers as a value-add at no cost or a small fee [55].
It is also worth noting that, despite COVID-19 and the threat of OTT TV services, MultiChoice South Africa (MCSA), that owns DStv, reported an increase of 5% in their subscriber base and 3% in revenue. Furthermore, MCSA announced a distribution partnership with Netflix and Amazon Prime [56]. OTT TV services are, therefore, a more significant part of the consumer experience, and this strategy is a simplification of the customer experience and a game-changer, as noted globally.

2.4.2. Cord-Nevers

Cord-nevers refer to first-time subscribers who have never subscribed to pay-TV services in favour of OTT TV services. The projections are that the cord-nevers will increase, reaching over 41 million in 2021, with 24% of users being from 18–34 years, and the primary reason being the burden of pay-TV services subscription fees [9]. In the US, more than a quarter of millennials have never subscribed to pay-TV services, favouring OTT TV services for a first-time subscription [57].
Cord-nevers are the biggest threat to pay-TV operators’ survival compared with cord-cutters and play a considerable role in pay-TV’s declining subscriber numbers [58]. In the US alone, the projections are that 50% of adults under the age of 30 will not subscribe to pay-TV services by the year 2025 [59]. The adult population of cord-nevers and cord-cutters forecast in the US by eMarketer [60] reveals that there is a growing trend of cord-nevers.
From a demographics perspective, consumers between the ages of 18 and 34 years indicate that they have never subscribed to pay-TV because they can access content through OTT TV services [48]. Considering that 35.7% of the total population in South Africa comprises young people between the ages of 18 and 34, one might argue that there are rising cord-nevers in South Africa [61]. According to Statista [62], the unemployment rate among the youth in South Africa is currently at 52.85%, and this raises the question of whether this presents a threat of growing and potential cord-nevers based on international trends.

2.4.3. Cord-Shavers

Cord-shaving refers to the downgrading of premium pay-TV subscription services for lower packages, although not cancelling services, and complementing the current services with OTT TV services. This phenomenon presents a more significant threat to pay-TV service providers owing to revenue loss, although there is no total loss of the subscriber [7]. Drastic changes in subscription fees influence the cord-shaving phenomenon, meaning that when prices go up, consumers are highly likely to downgrade subscription services to lower packages and complement them with cheaper OTT TV services [6]. The risk with the cord-shavers is that once this group is dissatisfied with pay-TV services, they become cord-cutters [43].
The cord-shaving phenomenon is highly likely to increase as fibre is rolled out to more areas in South Africa, and as data prices are reduced [6]. In the UK, 36% of OTT TV subscribers downgraded their premium pay-TV services. A further 71% of OTT TV subscribers have combined their subscription with pay-TV subscription services owing to the inability of OTT TV services to offer elite sport, and this phenomenon is called cord-stacking [63].

2.4.4. Summary

Given all these trends and changes, the landscape in the broadcasting sector is changing rapidly. As revealed in the literature, as access to affordable and quality broadband data becomes available, consumer viewing behaviours change. These changes differ among generational age groups. More TV consumers are adopting different devices to consume TV content. The cost of a subscription fee is the main reason for cord-cutting because of the perceived value of OTT TV services and expensive pay-TV services costs. The cord-shaving phenomenon and rising cord-nevers present a more significant threat to pay-TV operators’ business sustainability.
Arguably, the emergence of OTT TV services will change the pay-TV services sector significantly. However, the OTT TV services subscriber base may eventually decrease as consumers realise that lower subscription fees mean restricted content. Moreover, pay-TV service providers may remain dominant players; thus, these new platforms will not replace the existing platforms; instead, they will benefit some market segments. The lack of regulation gives OTT TV service providers a more significant advantage, and thus they can offer services more cheaply, which impacts traditional pay-TV operators’ ability to compete and their business sustainability.
The COVID-19 outbreak also depicts the future of TV consumption, as Netflix reported having more than doubled subscriber numbers during the outbreak, which is more than double their projections for 2020. With consumers being at home, more and more are looking for new applications to consume TV content. As indicated in the reviewed literature, these trends have given rise to the cord-cutting, cord-nevers, and cord-shaving phenomena said to have an impact on pay-TV operators [48].
Based on the reviewed literature, this study therefore asks the following questions:
  • Sub-RQ 1—Are OTT TV services a substitute for or complementary to traditional pay-TV subscription services in South Africa?
  • Sub-RQ 2—Do first-time subscribers favour OTT TV subscription services over pay-TV services in South Africa? If so, which OTT TV services do they favour for the first-time subscription?

3. Research Design and Methodology

The objectives of the paper were to investigate if OTT TV services are a substitute for or complementary to traditional pay-TV subscription services and to establish if first-time subscribers favour OTT TV services over pay-TV subscription services in South Africa. Therefore, the researchers adopted a descriptive research design using a single cross-sectional design as data is collected from the targeted population’s respondents only once [64,65]. Following the study’s objectives and research questions, as indicated in Section 2.4.4, the researchers elected a survey strategy to ensure reliable data collection from an ample population in a cost-effective manner [66]. Moreover, based on the positivism philosophical assumptions adopted for the study, a quantitative research approach was most suited, as the main objective was to ascertain the impact of OTT TV services on pay-TV services in South Africa. This paper described and made predictions on future trends based on the study findings, including global trends based on reviewed literature.

3.1. Population and Sampling Strategy

The study targeted people who consume television content using OTT TV services and pay-TV services in South Africa between the ages of 18 and 55+, with internet access [64].
The sampling frame could not be established for the targeted population owing to restrictions around disclosure of customer data from the pay-TV and OTT TV operators and also considering the protection of private customer information as stipulated in POPIA [67,68]. Therefore, using a similar approach to Chen [1], the researchers asked the participants at the beginning of the survey if they were pay-TV and OTT TV subscribers with internet access in order to qualify them to participate in the study.
The researchers elected a non-probability sampling technique, as the chance of someone chosen to take part in the study is not known, nor can it be determined [67]. The advantage of a non-probability sampling method is that the researcher can still generalise the population, although not on numerical grounds. Owing to the accessibility of the participants within the researchers reach and because of limited financial resources, the study adopted a convenience sampling method [69,70].

3.2. Sampling Size

The size of the population could not be determined owing to restrictions around disclosure of customer data from the pay-TV operators and also considering the protection of private customer information as stipulated in POPIA [68]. However, according to Statista [71], it is estimated that there are 6.8 million pay-TV households, and 3.46 million video streaming users in South Africa, although the demographic profile is unknown. Following the approach used by Tengeh and Talom [72], the sample size was calculated using the function illustrated below.
n 0 = z 2 × p ( 1 p ) e 2
Table 2 depicts the calculations of the sample size as follows: based on the estimated number of pay-TV subscribers in South Africa, under the confidence level of 95% with a margin error of 5%, the required sample size for this study was 384 valid responses, which are within the statistical requirements for data analysis in quantitative studies.

3.3. Data Collection and Analysis

A structured online survey questionnaire was administered from 22 April 2020 and closed on 6 June 2020. The survey link was shared within the researcher’s network using WhatsApp, Twitter, and LinkedIn for convenience, broader reach, and the popularity of these social media networks by the targeted population [73]. Further to this, the promotion of the survey link was on Facebook, targeting the studied population. The researchers took care to set the demographic characteristics and interest criteria on Facebook to ensure the respondents were residing in South Africa and were members of the targeted population. The total number of valid questionnaires collected was 391, and therefore, the researchers obtained the requisite sample for data analysis and to generalise. The collected data were captured and analysed using the descriptive analysis to describe and compare variables, using a numeric format based on the research study’s objectives and questions IBM SPSS Statistics [66,74].

3.4. Reliability and Validity

Validity and reliability in research address issues relating to error and measurement of the research instruments [67]. Furthermore, reliability and validity refer to an understanding of questions by the respondents as intended by the researcher and the researcher’s understanding of the answers provided by the respondent as intended by the respondent [66].

3.4.1. Reliability

Reliability refers to the degree to which the data-collection instrument would produce consistent results time and again if it were to be replicated by another researcher at a different time [65,67]. To ensure reliability, the survey questionnaire was piloted to 15 participants to test if the questions sounded right, were understood by the respondents in simple terms without any complicated jargon, and elicited the respondents’ interest. Based on the feedback received, some of the questions were removed and paraphrased. Furthermore, to get the respondents’ attention, the biographical questions were moved to the end of the questionnaire [75]. Cronbach’s alpha was used to test the internal consistency and reliability of the responses based on the feedback received from the respondents in the survey questionnaire to establish if respondents understood the questions asked and if they responded truthfully. The researcher identified six variables that are summarised in Table 3 along with Cronbach alpha scores, which are illustrated in Appendix A Table A1. The Cronbach coefficient score was above the recommended score of 0.65 to 0.8 or higher; thus, these results suggest the reliability of the measurement as satisfactory [76].

3.4.2. Validity

Validity comprises internal and external validity, where internal validity refers to “the extent to which a particular treatment in an experiment produces the sole effect on the dependent variable”. External validity is “the degree to which the study’s findings can be generalised and representable of the targeted population” [67]. Several authors concur that the evaluation of a questionnaire’s validity is through content and construct validity, and is criterion-related [65,66].
Based on this, the researchers ensured content and construct validity by using two experts in the research field to scrutinise and assess the questionnaire, including establishing if the questions were necessary and made sense and checking for inconsistencies by piloting to 15 participants. The pilot of the survey questionnaire further tested if the respondents were able to answer the questions asked by the researcher [75].

4. Results and Discussions

Skip logic was applied to the survey to ensure the respondents only see questions that apply to them based on how they answered the current questions. The purpose of this was to ensure that the respondents do not answer the questions randomly, for a high completion rate and relevance of the questions [77]. The coding of these questions reflects as non-applicable (n/a).
The population consisted of 219 pay-TV subscribers (highlighted in yellow), 138 OTT TV subscribers with FTA services (highlighted in green), and 34 consumers who use free or paid applications to consume TV content online, as reflected in Table 4. In total, 55.2% of the pay-TV respondents were DStv subscribers, reflecting the dominance and influence of DStv in South Africa.

4.1. Demographic Profiles

Table 5 depicts the demographic profile of the sampled population. Of the 391 respondents, 65.5% identified as male, followed by the female at 31.2%. The gender profiles were significantly different from a similar study conducted by Elias [43], where the majority of the respondents were female at 60.3% and male at 39.7%. Furthermore, the gender profile findings were consistent with a report from Stats SA, which states that gender identifying as males consume more TV content than females or any other gender profile [78].
The largest age groups were between the ages of 35 and 45 years at 36.3%, followed by 46 and 54 years at 20.2%. Of the studied population, 13.0% was between the ages of 18 and 24 years, while 13.3% of the respondents were aged 55+. The generational age group of the respondents was slightly different from the study conducted by Elias [43] in Portugal, where the majority of the population were equally millennials and Generation Z. In contrast, millennials/Generation Y and Gen Xers dominated this study. The age group profile of the respondents is attributed to the fact that these are the people responsible for the payment of subscription fees.
Of the 362 respondents who answered the question about income levels, the majority were from the lowest income groups, earning less than ZAR 10,000.00 at 28.5%, with the highest income group earning ZAR 33,000.00+ at 24.0%. These results reflect income distribution levels in South Africa, as stated by Stats SA [79]. All provinces were represented in the study and reflected the population size of each province as the most significant provinces are the Gauteng, KwaZulu-Natal, Western Cape, and Eastern Cape provinces, with the Northern Cape having the smallest population at 2.2% of the South African population [11].

4.2. Sub-RQ 1—Are OTT TV Services a Substitute for or Complementary to Traditional Pay-TV Subscription Services in South Africa?

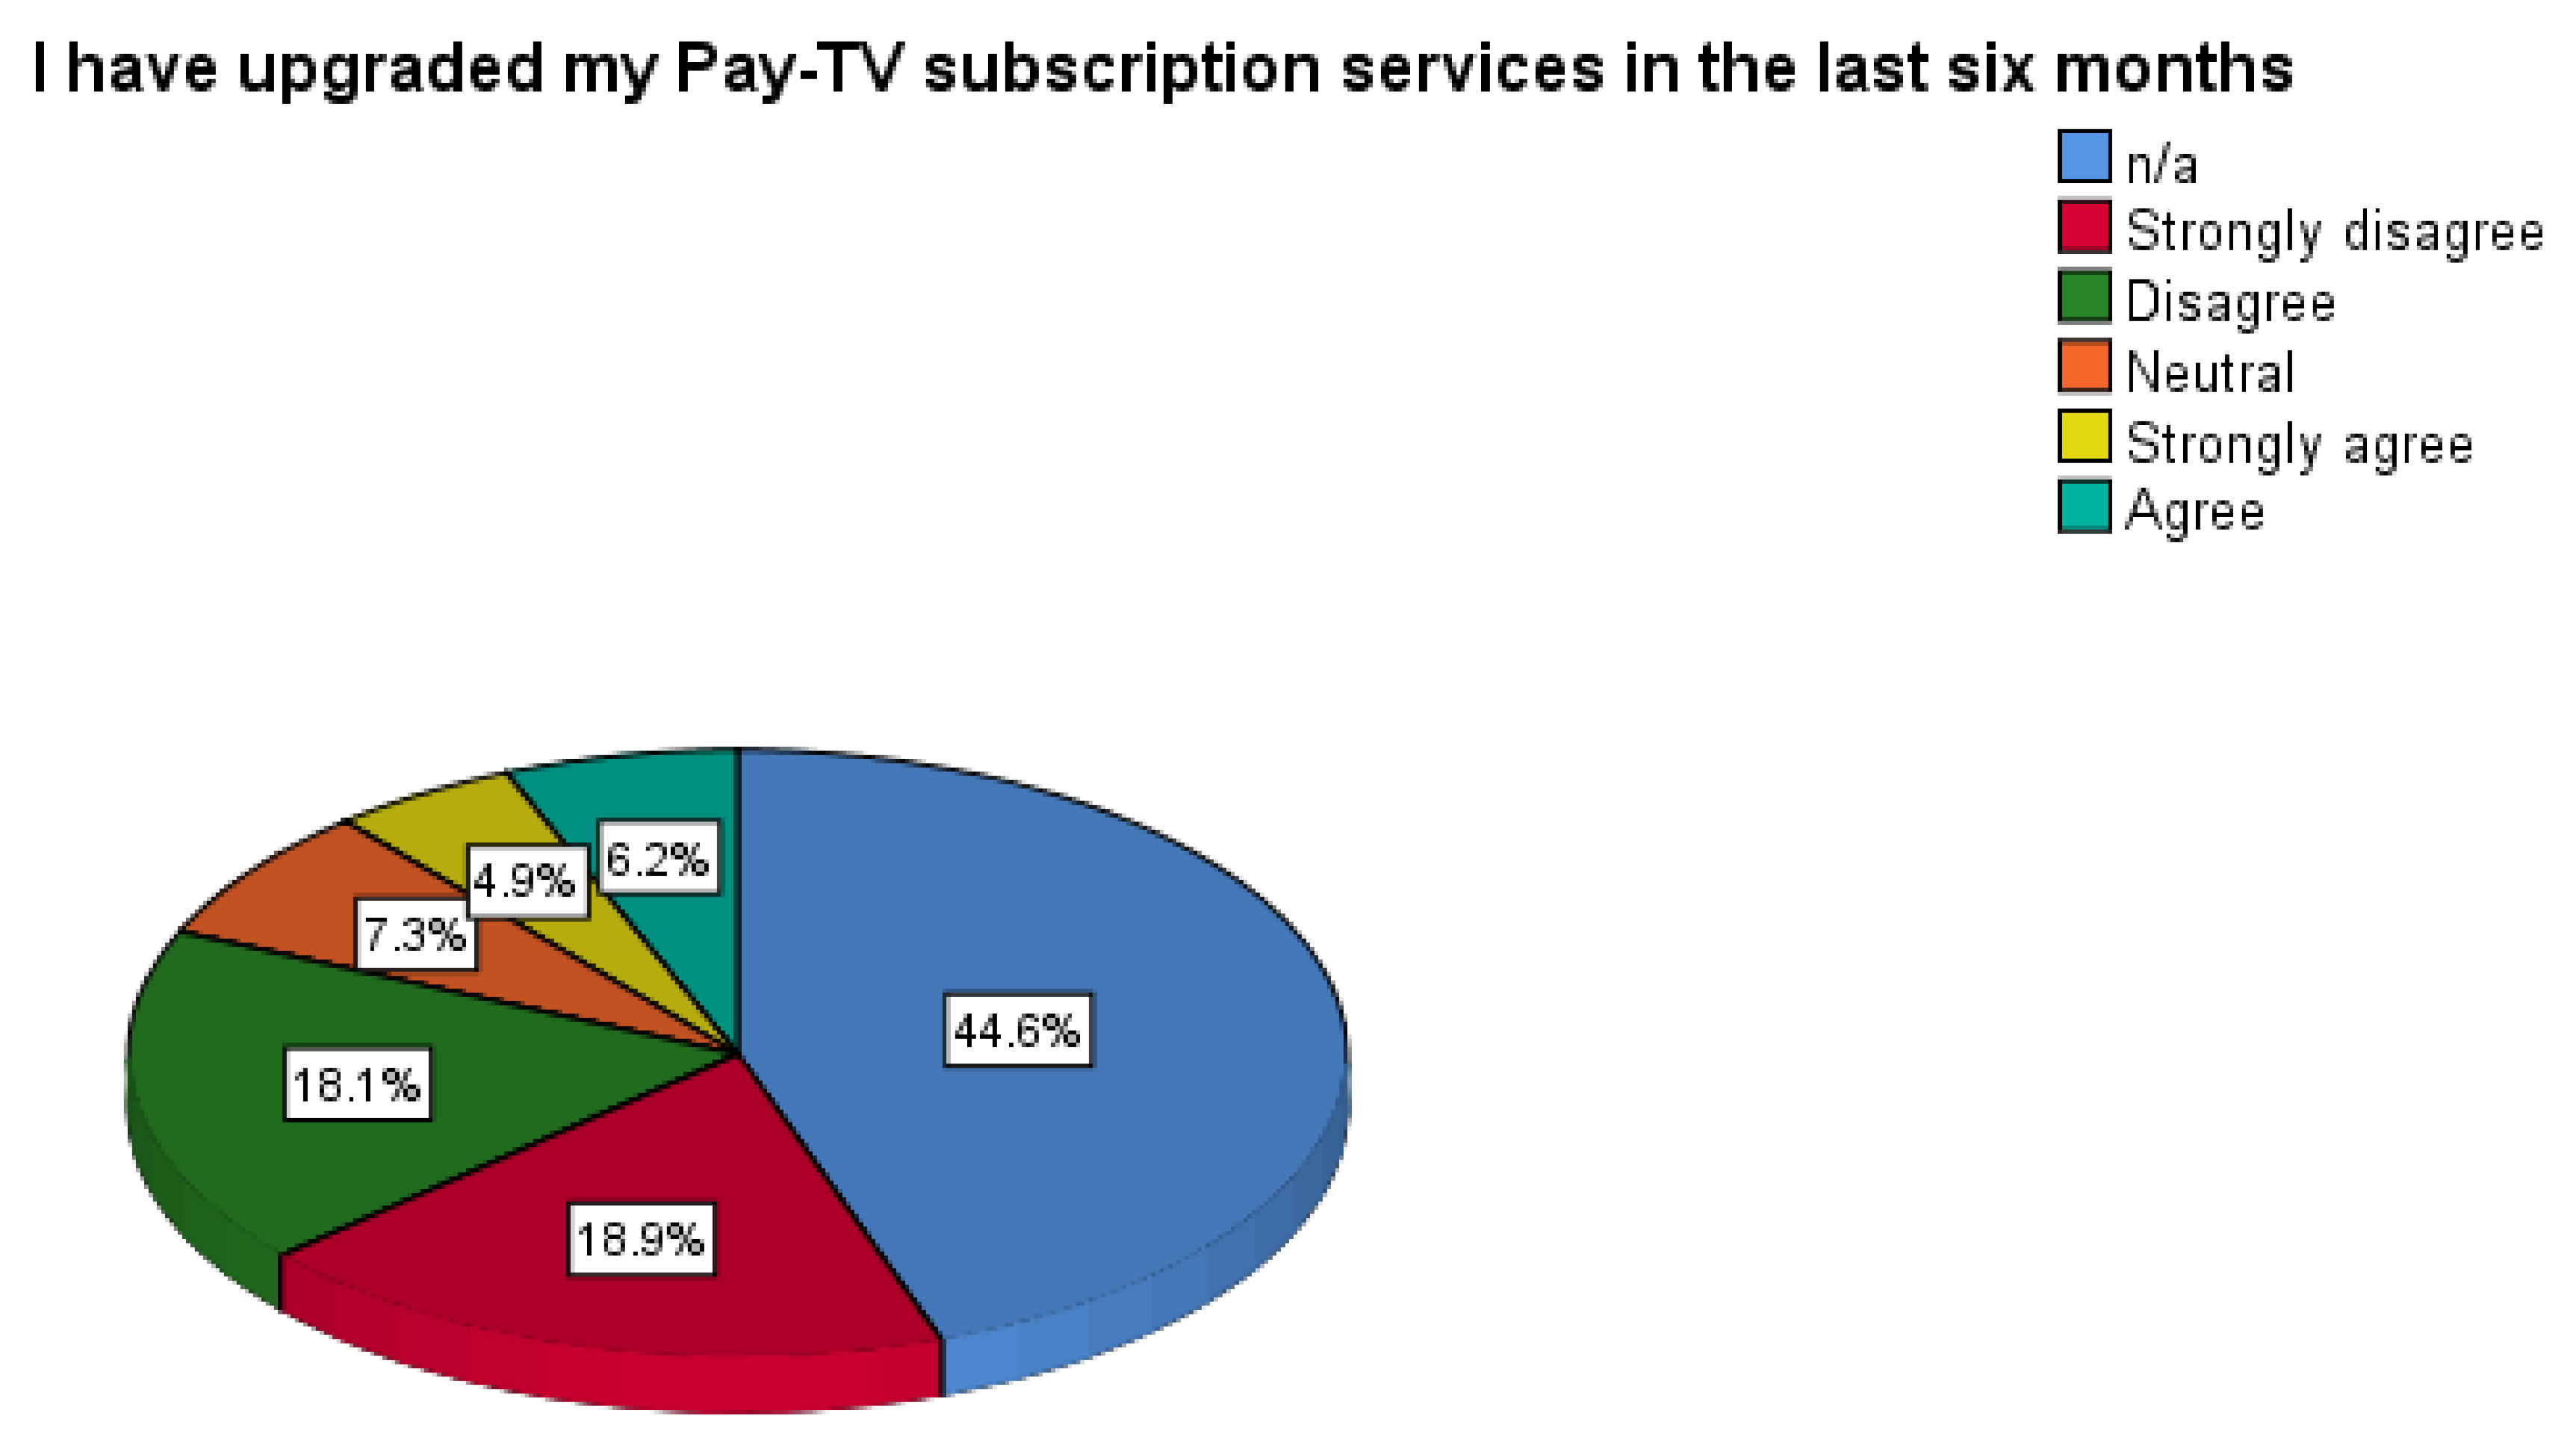
4.2.1. Respondents Who Have Upgraded Pay-TV Subscription

Of the 219 respondents who indicated that they had a pay-TV subscription, 1.3% (n = 5) did not answer the question. Of the remaining 214 respondents, as illustrated in Figure 2, the summarised findings revealed that 37.0% (n = 143) of the respondents disagreed or strongly disagreed that they had not upgraded their pay-TV subscription in the last six months, while only 11.1% (n = 43) agreed or strongly agreed that they had upgraded their pay-TV subscription services in the last six months. The study further revealed that of the 43 respondents who had upgraded their subscription, the majority of those were premium subscribers (n = 21).

4.2.2. Cord-Cutters

Of the 219 respondents who indicated they were pay-TV subscribers, the summarised findings illustrated in Figure 3 reveals that 42.2% (n = 163) of the respondents either disagreed or strongly disagreed not to have cancelled their pay-TV subscription. In contrast, only 5.5% (n = 21) agreed that they had cut the cord with their pay-TV service provider in favour of OTT TV services. This is in line with the claims by the ICASA [5] as reviewed in the literature that the cord-cutting phenomenon is small in South Africa owing to the unavailability of affordable and quality broadband data. Further to this, the findings reveal that OTT TV services are not a substitute for pay-TV services, and this concurs with Cell C’s assertion that OTT TV services are not a direct threat to pay-TV operators, although this may change in the future as many do not have internet access [5].
Table 6 illustrates that of the 5.5% (n = 21) who indicated they had cut the cord with pay-TV services, the majority (n = 7) of the cord-cutters were between the ages of 35 and 45. These findings concur with the assertion by Elias [43] that the ages between 35 and 45 represent a higher risk to the abandonment of pay-TV services in favour of OTT TV services. Only one respondent between the ages of 18 and 24 indicated having cancelled his or her pay-TV subscription in favour of OTT TV subscription. Furthermore, most of the respondents (n = 10) earn between ZAR 10,000.00 and 17,000.00 per month, as illustrated in Table 7. Of the high-income earners of the studied population, only two either agreed or strongly agreed with having cut the cord with their pay-TV service provider in favour of OTT TV services.
The Western Cape province had more cord-cutters than the rest of the provinces, as illustrated in Table 8. As illustrated in Table 9, mostly males indicated having cut the cord with their pay-TV service provider in favour of OTT TV services.

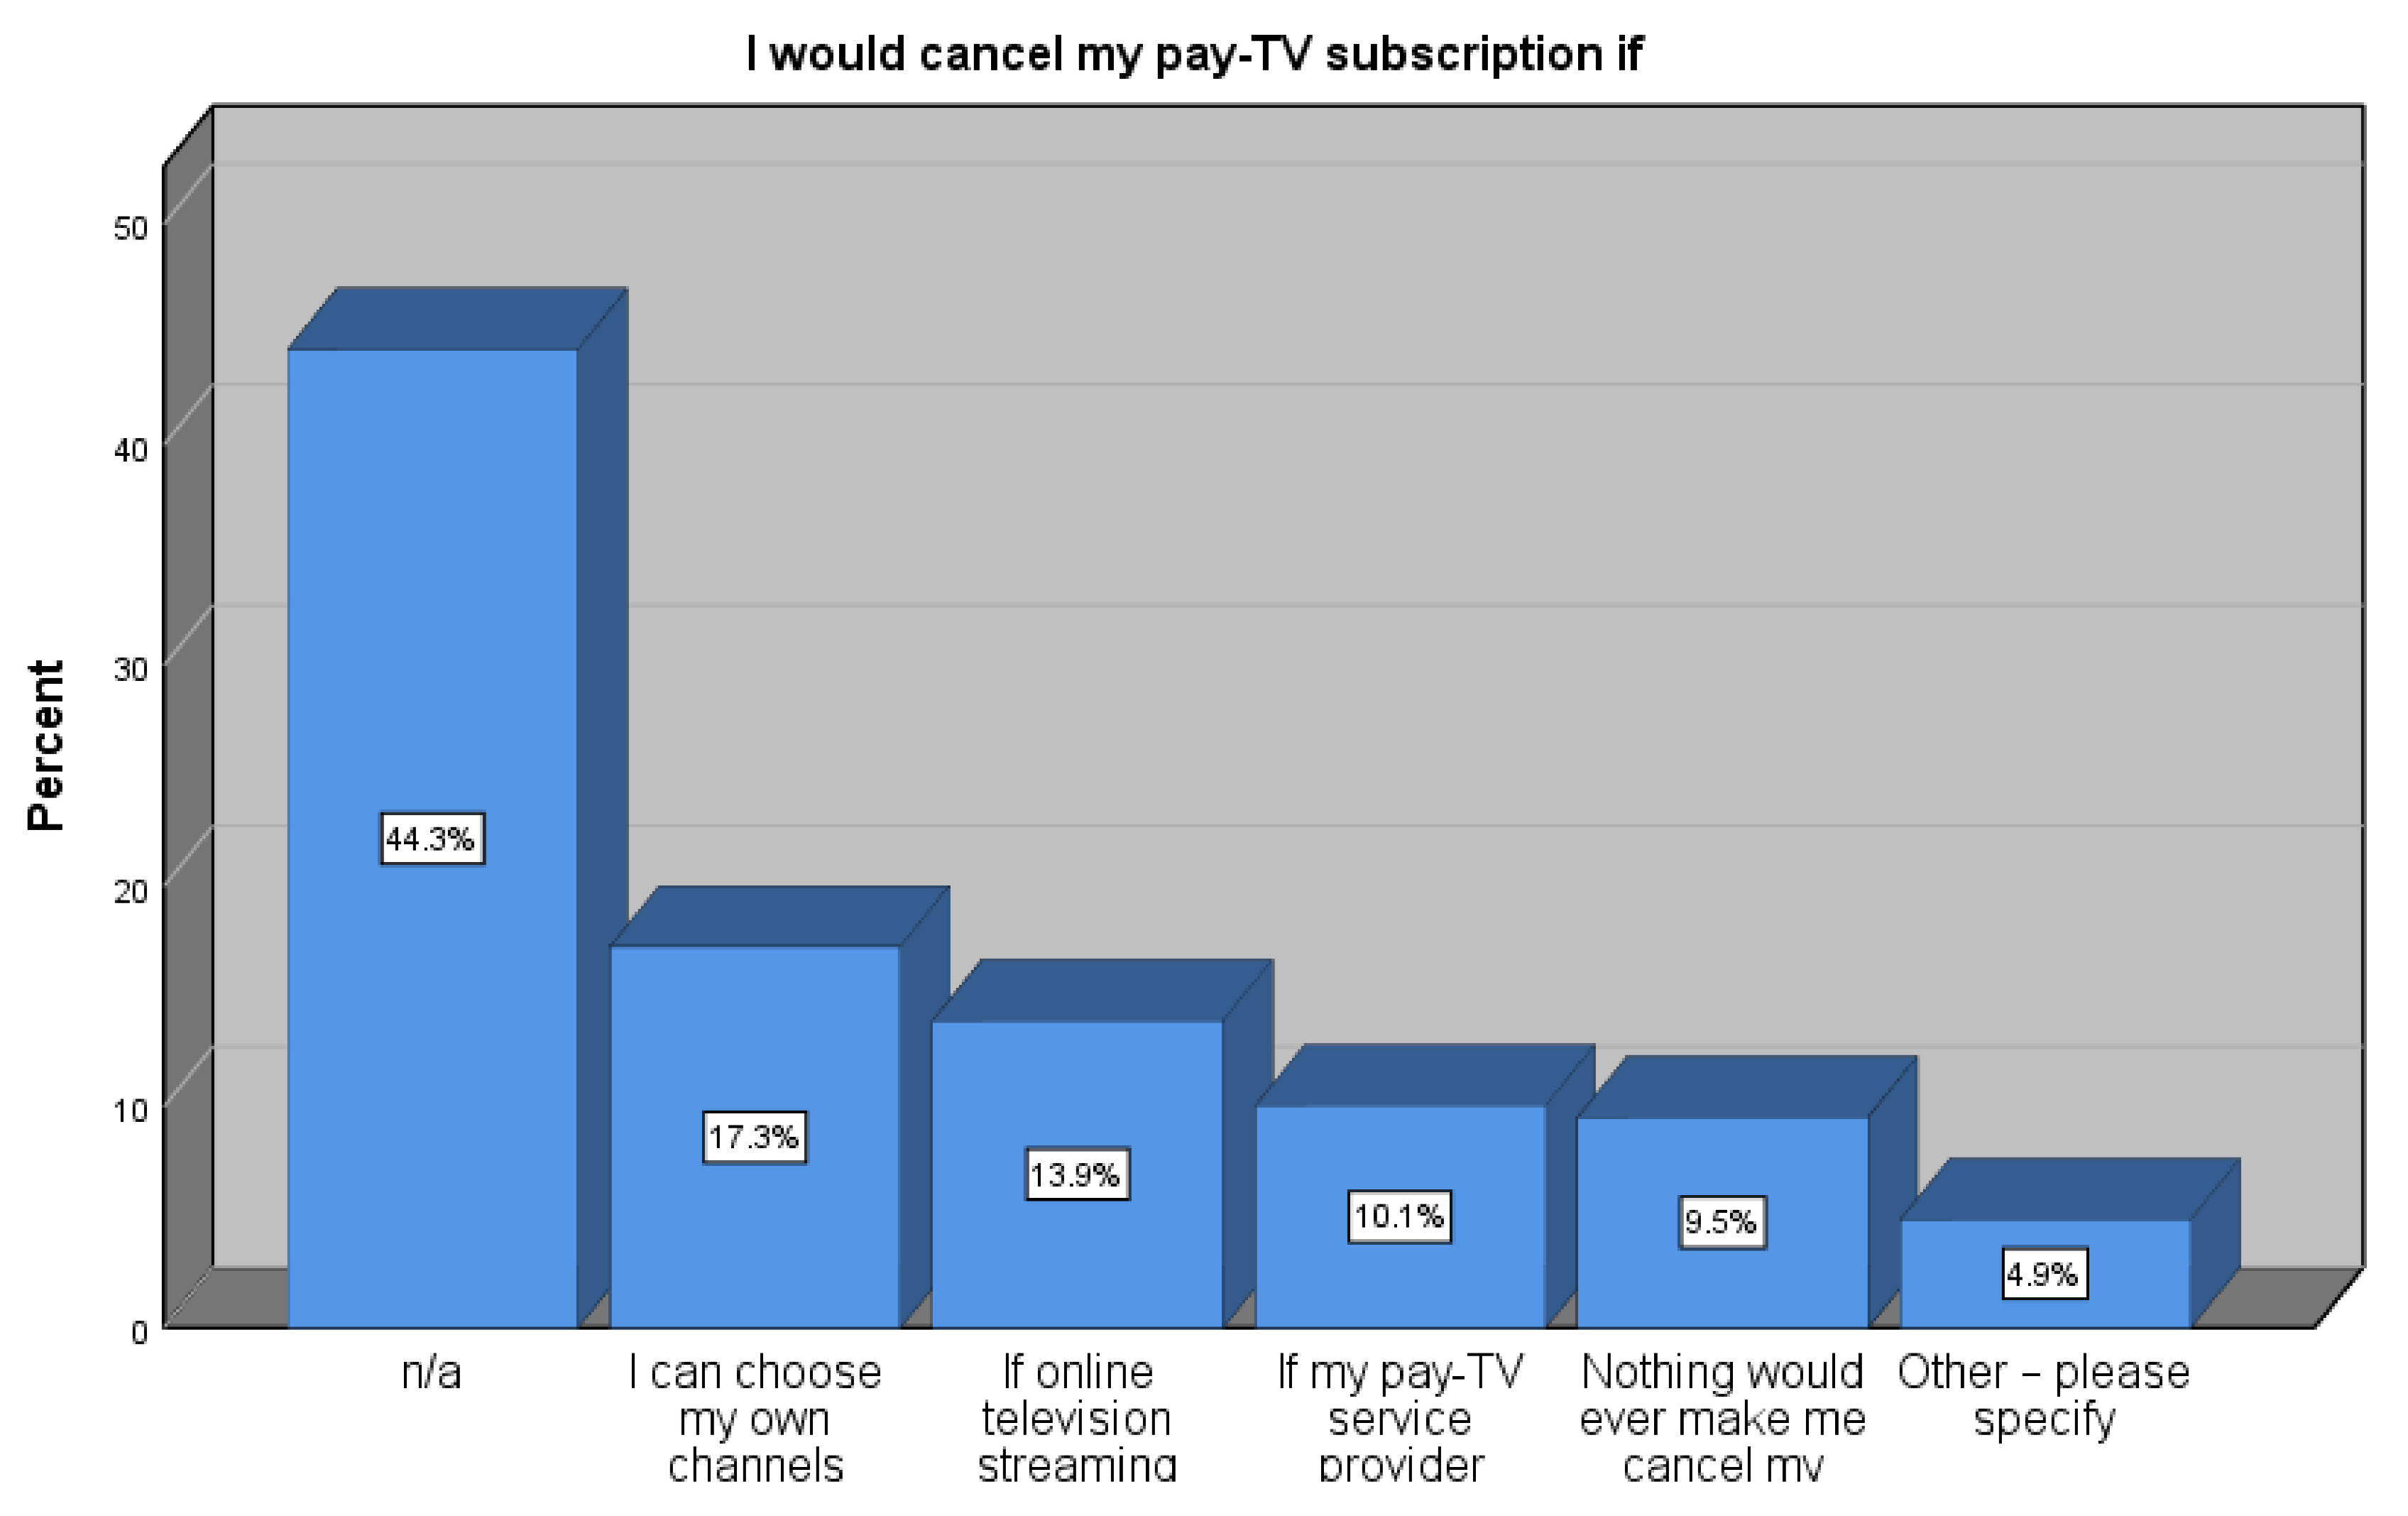
Reason for Future Cancellation Consideration

Summarised findings in Figure 4 illustrate the reasons that could prompt pay-TV subscribers to cancel their current subscription. The study revealed that the top reasons that could prompt the respondents to cancel their pay-TV subscription would be choosing their own channels at 17.1% (n = 67) and if OTT TV services had live sport at 13.8% (n = 54). These findings slightly differ from those of Lee, Nagpal et al. [49] as reviewed in the literature, who indicated that the majority of those who plan to cut the cord with their pay-TV services is because of the high subscription fees.
Interestingly, 9.5% (n = 37) indicated that nothing would make them cancel their pay-TV subscription, and an increase in price subscription was the least of the reasons to consider for cancellation of pay-TV subscription at 10.0% (n = 39).
A follow up open-ended question was asked to ascertain other reasons that would prompt pay-TV subscribers to cancel their pay-TV subscription as illustrated in Table 10. Therefore, the availability of reliable, fast broadband data and poor TV content would prompt cancellation of pay-TV subscription fees in favour of OTT TV services.

4.2.3. Cord-Shavers

Figure 5 illustrates the summarised findings of the respondents who have downgraded their current pay-TV subscription in favour of OTT TV. 35.1% (n = 136) of the respondents either disagreed or strongly disagreed that they have not downgraded their pay-TV premium subscription services in favour of OTT TV services. Only 13.0% (n = 49) of the population either strongly agreed or agreed with having downgraded their premium pay-TV subscription in favour of OTT TV services. Of the 219 respondents, 1.0% did not answer the question.
Therefore, the cord-shaving phenomenon in South Africa is lower than in countries like the UK, where, according to Ofcom [63], 36% of pay-TV subscribers downgraded their premium services and complemented them with OTT TV. Given these findings, it is agreed that the reason for the low cord-shaving phenomenon is due to the unavailability of affordable and fast broadband data. Moreover, as data becomes more accessible and affordable, there could be an increase in the cord-shaving phenomenon as predicted by the ICASA [6].
From the perspective of the demographic characteristics, the male gender predominantly combined their pay-TV services compared with other gender groups, as illustrated in Table 11. A significant number (n = 36) of high income-earners earning ZAR 33,000.00+ were more prevalent in downgrading their pay-TV for OTT TV services, followed by those earning between ZAR 10,000.00 and 17,000.00 (n = 19); this is illustrated in Table 12. Arguably, the high-income earners have access to broadband data, hence are more likely to downgrade premium pay-TV packages and complement them with an OTT TV subscription.
Most of the cord-shavers were between the ages of 35 and 45 years (n = 40), followed by ages of 25–34 and 35–46. The illustration of the summarised findings is reflected in Table 13. The Western Cape province had the most cord-shavers (n = 36) followed by Gauteng (n = 20) as illustrated in Table 14.

4.2.4. Cord-Stacking

Figure 6 illustrates a summary of the findings in respect of the population who have combined their pay-TV subscription services with OTT TV services. Surprisingly, 25.0% (n = 96) of the respondents either disagreed or strongly disagreed in that they had not combined their pay-TV subscription services with OTT TV. Only 24.0% (n = 92) agreed or strongly agreed to had combined their pay-TV subscription services with OTT TV services. These findings were different from the study conducted in the UK by Ofcom [63], where it was reported that 71% of OTT TV subscribers are combining their pay-TV subscription due to the unavailability of sport on OTT TV services. These results further support MultiChoice’s arguments in that some, and not all consumers, will combine their pay-TV with OTT TV services [6]. Further to this, Table 15 illustrates that, in comparison, respondents with a premium pay-TV subscription (n = 61) are combing their subscription with OTT TV services, while (n = 6) of the respondents with lower packages indicated the same.
Showmax emerged as the favoured OTT TV services for cord-stacking at 18.7%, as illustrated in Figure 7; this could be attributed to its being a value-added service for DStv Premium subscribers. Notably, the study revealed that Netflix is also a favoured OTT TV subscription at 17.1%, while a low 0.6% of the respondents indicated favouring Amazon Prime Video, and 1.8% (n = 7) did not answer the question. Of the 9.6% of respondents who indicated favouring other OTT TV services, YouTube, followed by DStv Now, emerged as the most favoured streaming platform.

4.3. Sub-RQ 2—Do First-Time Subscribers Favour OTT TV Subscription Services over Pay-TV Services in South Africa? If So, Which OTT TV Services Do They Favour for the First-Time Subscription?

4.3.1. Cord-Nevers

This question was asked to determine if first-time subscribers favour OTT TV services over pay-TV subscription services. Interestingly, summarised findings illustrated in Figure 8 revealed that 18.1% (n = 70) of the studied population either disagreed or strongly disagreed with choosing OTT TV services for the first-time subscription, while 11.1% (n = 43) strongly agreed or agreed to having chosen OTT TV services for the first time subscription instead of a pay-TV subscription. These findings dispute MultiChoice’s arguments, which state that there is a significant increase in the number of consumers who see no need to subscribe to pay-TV services and therefore choose OTT TV services for the first-time subscription [6].
As illustrated in Table 16, from the perspective of the demographic characteristics, the majority (n = 18) of the cord-nevers were between the ages of 18 and 24. These findings are consistent with Christenson and Harris [48,59], who stated that the majority of the cord-nevers are within these age groups. From the gender perspective, the majority (n = 26) of the cord-nevers were male, as illustrated in Table 17. Most first-time subscribers who prefer OTT TV over pay-TV are significantly high in Gauteng (n = 16), followed by the Western Cape (n = 13), as illustrated in Table 18.

Favoured OTT TV Services by Cord-Nevers

This question was asked to investigate favoured OTT TV services by first-time subscribers. Of the cord-nevers, 20.5% prefer Netflix, as illustrated in the summarised findings in Figure 9. Amazon Prime Video was the least preferred OTT TV service provider by cord-nevers at 1.6%.
From the 4.6% who indicated they favoured other OTT TV services, an open-ended question was asked to probe other favoured OTT TV services. The summarised findings are illustrated in Table 19 in no order. Interestingly, a significant number of respondents also indicated that they use all the OTT TV services listed in the questionnaire (Amazon Prime Video, Netflix, Showmax, and YouTube Premium).

Reasons Influencing Cord-Nevers to Favour OTT TV over Pay-TV Subscription Services

This question was asked to determine what influences first-time subscribers to favour OTT TV over pay-TV subscription services. Summarised findings in Figure 10 reveal that although 13.2% of the respondents indicated that they had pay-TV previously, but had cancelled due to price, the main reason influencing first-timers to favour OTT TV over pay-TV subscription is the price of subscription fees at 7.8%. These findings are consistent with the findings of Daniels [80], where the high cost of subscription fees was the reason the cord-nevers chose OTT TV services for the first-time subscription over pay-TV subscription.
This study further revealed that 6.2% of the first-time subscribers opted for OTT TV services due to the availability of a variety of content provided by OTT TV service providers. 5.4% (n = 21) did not answer this question. Other reasons influencing first-time subscribers to favour OTT TV over pay-TV are listed in Table 20 and include price, customer service, content, and the nature of the respondents’ jobs, which involve travelling.

4.4. General Findings

Table 21 shows that low-income earners earning less than ZAR 10,000.00 are using free/paid mobile applications to consume TV content, including those who consume content using free-to-air services. Furthermore, the high-income earners, that is those earning between ZAR 23,000.00 and 33,000+, subscribe to pay-TV and OTT TV services.

5. Conclusions and Recommendations

In the absence of a comprehensive and credible assessment, this study contributes to the existing literature by providing scientific evidence of the impact of OTT TV on pay-TV services in South Africa.
The study revealed that contrary to what is happening globally, as noted in the literature reviewed, most of the studied population did not cancel their pay-TV subscription in favour of OTT TV services. This finding is also supported by one of the respondents, who, in the open-ended questions, noted that “pay-TV has a ±10 year life span if not more, as there is still much work to be done to strengthen the internet spectrum”. The cord-cutting phenomenon is low, owing to pay-TV operators such as DStv that combine their subscription offering with OTT TV services such as Showmax as a value-add service for premium subscribers. The study showed that most cord-cutters are between the ages of 35 and 45 low-income groups, indicating affordability as the reason for choosing OTT TV services over pay-TV subscription. Allowed to choose or structure their packages, the respondents indicated that they would cancel their pay-TV subscription services. Interestingly, the respondents indicated they would cut the cord if pay-TV operators cancelled or stopped favourite TV content.
Regarding cord-shaving, this phenomenon is small in South Africa and lower than in countries like the UK and US, where pay-TV subscribers have downgraded their premium services and complemented them with OTT TV. However, the study also showed that the high-earning income groups downgraded their premium pay-TV packages for lower packages and complemented them with OTT TV services.
The study further revealed that most of the studied population do not combine their pay-TV subscription with OTT TV subscription services. However, many DStv premium subscribers combined their pay-TV service with OTT TV services. The reason for this is that Showmax is a value-added service for DStv subscribers. Accordingly, Showmax emerged as the favoured OTT TV subscription for cord-stacking.
Concerning the cord-nevers, although most first-time subscribers do not favour OTT TV services over pay-TV, the millennial generation age group preferred OTT TV over pay-TV for first-time subscription. First-time subscribers in Gauteng and the Western Cape, and those who identify as male, prefer OTT TV for first-time subscription. The researchers note that provincial preference is associated with the rollout and availability of broadband data in these provinces. It is considered cheaper to have OTT TV, considering that the combined cost of data and OTT TV subscriptions is still lower than a pay-TV subscription. Furthermore, data can be used for other purposes, and more than one person can use the OTT TV services with a smartphone as opposed to having to buy another setup box and incur installation costs for additional viewing, including access fees.
Furthermore, the study showed that one of the reasons for first-time subscribers choosing OTT TV over pay-TV is because of the nature of their job which involves extensive travelling, and therefore there is no need for a pay-TV subscription that requires a fixed installation and TV set. This reason is an indicator of future television subscriptions; as people move around, they may not necessarily require a setup box and dish installation to consume TV content. This, therefore, may further impact hotels and holiday accommodation establishments as guests may not require a TV during their stay. Therefore, it prompts a change in business strategy for these establishments.
Although there is a growing trend of consumers migrating from pay-TV services to OTT TV services, migration has little or no impact on pay-TV services. Thus, based on the findings, the researchers conclude that OTT TV services are a complementary service to pay-TV services instead of a substitute, and both services have their unique advantages. Furthermore, in South Africa, pay-TV subscription services will continue dominating OTT TV, and this is mainly due to sporting rights, live content, breaking news, and availability of fast, affordable broadband data. The availability of Wi-Fi in considering preference to subscribe to OTT TV over pay-TV for first-time subscribers depicts a future trend of cord-nevers, especially in the Gauteng and Western Cape provinces, the provincial economic hubs in South Africa. This poses a more significant threat to pay-TV operators. Finally, although it is expected that OTT TV will grow, pay-TV will continue to grow as streaming will run out of content. The nature of work, including economic trends, will impact the subscription type adopted by consumers, based on their needs and financial capabilities.
Therefore, the researchers suggest that the pay-TV operators should not remain stagnant/complacent; continuous innovations focusing on the drivers motivating consumers to migrate from pay-TV to OTT TV services are critical. We further recommend that the same service providers implement an option for those who prefer to consume content online to subscribe without the need to purchase a setup box and pay for installation. Such options would lead to a reduction in subscription fees, benefiting consumers in terms of cost and pay-TV operators in terms of customer acquisition and retention. Pay-TV operators would benefit from renting sports rights to their OTT TV competitors, which would contribute to their revenue. OTT TV should not only be seen as a competitor affecting pay-TV’s operators’ sustainability, but also as an opportunity to expand the content offering and other business revenue streams.
Although the majority of first-time subscribers do not favour OTT TV services over pay-TV services in South Africa, pay-TV service providers should take note of first-time subscribers who prefer to stream online, and therefore should proactively implement strategies to attract this group of consumers in order to compete with OTT TV service providers. Noting broadband data is increasingly becoming affordable, it is beneficial for the pay-TV services to partner with internet service providers for bundled services. The advantage of this would be to lock the customer in with a pay-TV subscription on the standalone streaming platform through own in-house OTT TV services.
Finally, the regulatory bodies such as ICASA should pay careful attention to OTT TV service providers’ contribution to the country’s economy through employment, tax, and Broad-Based Black Economic Empowerment (BBBEE) measures. Therefore, considerations to regulate the industry to ensure international players’ contributions to the country’s economy would benefit fair competition and job security.

6. Limitations and Future Research

Access to customer data from pay-TV and OTT TV service operators would have benefited the study, as the subscribers would have been sampled as part of the study and segmented accordingly. Thus, future research using actual customer data from both OTT TV and pay-TV service providers should be conducted. Both the OTT TV and pay-TV service operators would benefit from making the data available based on the customer’s authorisation to participate in such studies. Furthermore, the paucity of literature on the topic posed a challenge, especially in the South African context. Therefore, conducting more research studies on OTT TV services and pay-TV in South Africa and the entire African region would contribute to the body of knowledge. Additionally, companies operating in this space would benefit from funding research in this field as it would influence government policies, contribute to the body of knowledge, and assist in developing strategies for companies in the digital media space.
Future studies could focus on strategies that pay-TV operators could implement to compete and turn around their businesses to remain competitive. Finally, without further studies on the hidden impact of pay-TV operators on matters such as contribution to tax, BBBEE, employment, and corporate social responsibility, it would be impossible for regulatory bodies to implement policies to regulate the industry. Therefore, the researchers recommend that investigative studies on the regulation of the OTT TV service sector by the relevant regulatory bodies.

Author Contributions

N.U. and R.K.T. equally designed and performed the study. All authors have read and agreed to the published version of the manuscript.

Funding

The study received no external funding.

Conflicts of Interest

The authors declare no conflict of interest.

Appendix A

Table A1. Cronbach Alpha scores of each variable.
Scale Mean if Item DeletedScale Variance if Item DeletedCorrected Item—Total CorrelationSquared Multiple CorrelationCronbach’s Alpha if Item Deleted
I have upgraded my Pay-TV subscription services in the last six months.6.8548.6980.7670.6220.910
I have cancelled my pay-TV subscription services in favour of OTT TV subscription7.0050.6560.8020.6980.908
I have downgraded my premium pay-TV subscription for a lower-priced package in favour of OTT TV services6.8048.2640.7790.6790.908
I have combined my pay-TV with OTT TV subscription6.3943.7980.7740.6380.912
Which OTT TV services have you combined your pay-TV subscription with?6.5145.6890.8120.7080.903
I would cancel my pay-TV subscription if6.7347.7270.7760.6420.908

References

  1. Chen, Y.-N.K. Competitions among OTT TV platforms and traditional television in Taiwan: A niche analysis. In Proceedings of the 14th International Telecommunications Society (ITS) Asia-Pacific Regional Conference: “Mapping ICT into Transformation for the Next Information Society”, 24–27 June 2017; International Telecommunications Society (ITS): Kyoto, Japan, 2017; pp. 1–25. Available online: http://hdl.handle.net/10419/168477 (accessed on 14 March 2020).
  2. Kim, M.S.; Kim, E.; Hwang, S.; Kim, J.; Kim, S. Willingness to pay for over-the-top services in China and Korea. Telecommun. Policy 2017, 41, 197–207. [Google Scholar] [CrossRef]
  3. Kannisto, K. The Motivations for Netflix to Vertically Integrate its Business Model: Why Netflix Began the Production of Netflix. Bachelor’s Thesis, Aalto University, Espoo, Finland, 2019. Available online: www.aalto.fi (accessed on 14 March 2020).
  4. BusinessTech. Netflix Has an Unfair Advantage over DStv: Multichoice CEO; BusinessTech: Gauteng, South Africa, 2018. [Google Scholar]
  5. ICASA. Draft findings document: Inquiry into subscription television broadcasting services. Gov. Gaz. 2019, 42391, 1–189. [Google Scholar]
  6. ICASA. MultiChoice Submission on Discussion Document Inquiry into Subscription TV Broadcasting Services. ICASA 2019. Available online: https://www.icasa.org.za/legislation-and-regulations/multichoice-submission-on-discussion-document-inquiry-into-subscription-tv-broadcasting-services (accessed on 18 December 2019).
  7. Tefertiller, A. Media substitution in cable cord-cutting: The adoption of web-streaming television. J. Broadcast Electron. Media 2018, 62, 390–407. [Google Scholar] [CrossRef]
  8. Kearney. OTT Streaming in the Limelight: Four Trends and Predictions for the Media Industry. Available online: https://www.es.kearney.com/communications-media-technology/ott-streaming-in-the-limelight-four-trends-and-predictions-for-the-media-industry (accessed on 31 July 2020).
  9. Park, S.; Kwon, Y. Research on the relationship between the growth of OTT service market and the change in the structure of the Pay-TV market. In Proceedings of the 30th European Conference of the International Telecommunications Society (ITS): “Towards a Connected and Automated Society”, Helsinki, Finland, 16–19 June 2020; International Telecommunications Society (ITS): Helsinki, Finland, 2019. Available online: https://www.econstor.eu/bitstream/10419/205203/1/Park-Kwon.pdf (accessed on 16 April 2020).
  10. De Villiers, J. Almost a Third of South African Households Now Own Their Own Cars—While 90% have Electric Stoves. Business Insider SA. 2019. Available online: https://www.businessinsider.co.za/general-household-survey-2018-south-african-households-third-own-cars-electrical-stoves-2019-5 (accessed on 23 February 2020).
  11. Stats, S.A. Mid-year Population Estimates. 2019. Available online: http://www.statssa.gov.za/publications/P0302/MYPE2019Presentation_final_forSG26_07staticPop_1.pdf (accessed on 14 June 2020).
  12. eMedia Holdings. Broadcasting—eMedia Holdings. 2020. Available online: http://www.emediaholdings.co.za/broadcasting/ (accessed on 16 February 2020).
  13. Mulyana, A. Media and cultural preference: Watching activity on pay television. Int. J. Commun. Res. 2019, 9, 53–58. [Google Scholar]
  14. Statista. Video Streaming (SVoD)—South Africa. Available online: https://www.statista.com/outlook/206/112/video-streaming--svod-/south-africa#market-users (accessed on 24 January 2020).
  15. MultiChoice. Our History. 2020. Available online: https://www.multichoice.com/about-us/our-history/ (accessed on 16 February 2020).
  16. ICASA. Subscription Broadcasting Services Market Inquiry. 2019. Available online: https://www.icasa.org.za/legislation-and-regulations/inquiries/subscription-broadcasting-services-market-inquiry (accessed on 18 December 2019).
  17. StarSat. Who We Are. Available online: http://starsat.co.za/about/ (accessed on 16 February 2020).
  18. Gilbert, P. How Data Bundle Prices Changed over Five Years. ITWeb 2018. Available online: https://www.itweb.co.za/content/LPwQ5MlyKoOqNgkj (accessed on 23 February 2020).
  19. Prior, B. Past, Present, and Future of Fibre Prices in South Africa. MyBroadBand 2019. Available online: https://mybroadband.co.za/news/fibre/311493-past-present-and-future-of-fibre-prices-in-south-africa.html (accessed on 23 February 2020).
  20. Omarjee, L. MTN, Vodacom to Slash Data Prices or Face Prosecution; All Providers Must Give Free Data Daily—Competition Watchdog. Fin 2019. Available online: https://www.fin24.com/Companies/mtn-vodacom-to-slash-prices-or-face-prosecution-all-providers-must-give-free-data-daily-competition-watchdog-20191202-2 (accessed on 23 February 2020).
  21. Mungadze, S. MTN to Drop Its Data Prices ‘Soon’. ITWeb 2020. Available online: https://www.itweb.co.za/content/kLgB1Me8npo759N4 (accessed on 10 April 2020).
  22. Netflix. Netflix—Overview—Profile. 2020. Available online: https://www.netflixinvestor.com/ir-overview/profile/default.aspx (accessed on 23 February 2020).
  23. SimilarWeb. Top TV Movies and Streaming Websites in South Africa. 2020. Available online: https://www.similarweb.com/top-websites/south-africa/category/arts-and-entertainment/tv-movies-and-streaming (accessed on 16 April 2020).
  24. MultiChoice. Companies and Brands. 2020. Available online: https://www.multichoice.com/companies-brands/ (accessed on 23 February 2020).
  25. BusinessTech. Showmax Subscribers vs Netflix in South Africa. BusinessTech 2019. Available online: https://businesstech.co.za/news/media/297640/showmax-subscribers-vs-netflix-in-south-africa/ (accessed on 23 February 2020).
  26. Showmax. How Does Showmax Work? Showmax 2018. Available online: https://stories.showmax.com/how-does-showmax-work/ (accessed on 12 April 2020).
  27. McLeod, D. Showmax Pro, with live sport, launched in South Africa at R449/month. TechCentral 2020. Available online: https://techcentral.co.za/showmax-pro-with-live-sport-launched-in-south-africa-at-r449-month/100569/ (accessed on 20 August 2020).
  28. Eloff, H. This Graph Shows How Streaming on Showmax Drastically Increases as the Coronavirus Pandemic Grows. Channel 2020. Available online: https://www.channel24.co.za/TV/News/this-graph-shows-how-streaming-on-showmax-drastically-increases-as-the-coronavirus-pandemic-grows-20200408 (accessed on 8 April 2020).
  29. Fingas, J. YouTube Premium and Music Have 20 Million Subscribers. Engadget 2020. Available online: https://www.engadget.com/2020/02/03/youtube-premium-and-music-20-million-subscribers/ (accessed on 23 February 2020).
  30. Van der Merwe, M. South African Generation Y Students’ Attitude towards On-Demand Streaming Services. Master’s Thesis, North-West University, Potchefstroom, South Africa, 2019. Available online: http://repository.nwu.ac.za/handle/10394/32296 (accessed on 24 October 2020).
  31. TechCentral. Amazon Prime Video launched in SA. TechCentral 2016. Available online: https://techcentral.co.za/amazon-prime-video-launched-in-sa/70712/ (accessed on 12 April 2020).
  32. Ferreira, T. Watching TV in South Africa in 2020 just Got a Whole Lot More Complicated. Channel 2020. Available online: https://www.news24.com/channel/tv/news/watching-tv-in-south-africa-in-2020-just-got-a-whole-lot-more-complicated-20200131 (accessed on 24 October 2020).
  33. Ferreira, T. Google launches YouTube Premium in South Africa but There’s a Catch. Channel 2019. Available online: https://www.channel24.co.za/Music/News/google-launches-youtube-premium-in-south-africa-but-theres-a-catch-20190314 (accessed on 23 February 2020).
  34. Schouw, L. “To Binge or not to Binge”—The Online Viewing Habits of Dutch Millennials. Master’s Thesis, Erasmus University, Rotterdam, The Netherlands, 2018. Available online: https://www.semanticscholar.org/paper/“To-binge-or-not-to-binge”-The-online-Viewing-of-Schouw/0352d31c56ab55fd3f56a220d829d1f6e2702567 (accessed on 24 October 2020).
  35. Hossain, M.; Kim, M.; Jahan, N. Can “Liking” Behavior Lead to Usage Intention on Facebook? Uses and Gratification Theory Perspective. Sustainability 2019, 11, 1166. [Google Scholar] [CrossRef] [Green Version]
  36. Katz, E.; Blumler, J.G.; Gurevitch, M. Uses and Gratifications Research. Public Opin. Q. 1973, 37, 509–523. [Google Scholar] [CrossRef]
  37. Kirui, E.K. The Impact of Media Digitization on Local Video Production: A Case of Nairobi County. Master’s Thesis, University of Nairobi, Nairobi, Kenya, 2017. [Google Scholar]
  38. Samani, M.C.; Guri, C.J. Revisiting Uses and Gratification Theory: A Study on Visitors to Annah Rais Homestay. J. Komun. Malays. J. Commun. 2019, 35, 206–221. [Google Scholar] [CrossRef] [Green Version]
  39. Shobiye, T.; Naidoo, G.M.; Rugbeer, H. Factors that Influence One’s Choice for Viewing Public Television in South Africa. Altern. Interdiscip. J. Study Arts. Humanit. S. Afr. 2018, 25, 394–424. [Google Scholar] [CrossRef]
  40. Gossmann, N. Millennials’ Motivation to Consume Sport Content Online. Master’s Thesis, University of Pretoria, Pretoria, South Africa, 2018. Available online: https://repository.up.ac.za/handle/2263/68846 (accessed on 24 October 2020).
  41. Massad, V.J. Understanding the cord-cutters: An adoption/self-efficacy approach. Int. J. Media Manag. 2018, 20, 216–237. [Google Scholar] [CrossRef]
  42. Kim, J.; Kim, S.; Nam, C. Competitive dynamics in the Korean video platform market: Traditional pay TV platforms vs. OTT platforms. Telemat. Inform. 2016, 33, 711–721. [Google Scholar] [CrossRef]
  43. Elias, J. The Transition Trend From Pay-TV to Streaming Platforms: The Influence of Decision-Making-Power and Age on Consumers’ Motivations; Universidade Católica Portuguesa: Lisbon, Portugal, 2019. [Google Scholar]
  44. Park, E. Business strategies of Korean TV players in the age of Over-The-Top (OTT) video service. Int. J. Commun. 2018, 12, 4646–4667. [Google Scholar]
  45. Bloomberg. How COVID-19 Is Changing Entertainment. MyBroadBand 2020. Available online: https://mybroadband.co.za/news/technology/351331-how-covid-19-is-changing-entertainment.html (accessed on 10 May 2020).
  46. Crawford, J. Cutting the cord—A marketing case: An examination of changing TV Viewership. Atl. Mark. J. 2016, 5, 137–150. [Google Scholar]
  47. Mckinley, J. Are online streaming services hurting traditional television and radio? UWire Text 2018. Available online: http://link.galegroup.com/apps/doc/A559275564/AONE?u=capetech&sid=AONE&xid=ff5ec1b5 (accessed on 11 June 2020).
  48. Christenson, C. Changing Times: An Examination Changing Video Entertainment Sources and Cable TV Companies Communicating with Customers. Master’s Thesis, Bowling Green State University, Bowling Green, OH, USA, 2017. Available online: https://scholarworks.bgsu.edu/ms_smc/5%0AThis (accessed on 11 June 2020).
  49. Lee, C.C.; Nagpal, P.; Ruane, S.G.; Lim, H.S. Factors Affecting Online Streaming Subscriptions. Commun. IIMA 2018, 16, 2. [Google Scholar]
  50. Premium Times. Nearly Two Million U.S. Households Cancel Cable, Satellite TV. Prem. Times 2020. Available online: https://www.premiumtimesng.com/news/top-news/392349-nearly-two-million-u-s-households-cancel-cable-satellite-tv.html (accessed on 12 May 2020).
  51. Park, E.-A. Why the networks can’t beat Netflix: Speculations on the US OTT services market. Digit. Policy Regul. Gov. 2017, 19, 21–39. [Google Scholar] [CrossRef]
  52. De Villiers, J. Multichoice Plans to Make 52 Local Movies the Next Year—And Saw Streaming Subscriber Double. Business Insider SA 2019. Available online: https://www.businessinsider.co.za/multichoice-netflix-showmax-dstv-dtsv-now-local-movies-streaming-service-naspers-2019-6 (accessed on 10 May 2020).
  53. Chulkov, D.; Nizovtsev, D. Bundling, cord-cutting and the death of TV as we know it. J. Int. Acad. Case Stud. 2015, 21, 7–14. [Google Scholar]
  54. Bronkhorst, Q. Here are All the DStv Price Increases for 2020. BusinessTech 2020. Available online: https://businesstech.co.za/news/media/374572/here-are-all-the-dstv-price-increases-for-2020/ (accessed on 10 May 2020).
  55. Gürkaynak, G.; Akgün, B.; Aydogan, Z. An analysis on the television broadcasting sector—The impact of OTT services: Are they complementary or substitutable? In The Second Academic Gift Book of ELIG Gürkaynak Attorneys-At Law on Selected Contemporary Competition Law Matters; Legal Yayıncılık, A.Ş: İstanbul, Turkey, 2019; pp. 281–338. Available online: https://ssrn.com/abstract=3396937 (accessed on 11 June 2020).
  56. MultiChoice. MultiChoice Group—FY20 Results. 2020. Available online: https://multichoice-reports.co.za/annuals/2020/pdf/results-presentation-final-final.pdf (accessed on 11 June 2020).
  57. Baumgartner, J. OTT Closes Penetration Gap With Pay TV. Multichannel News, 30 November 2015; Volume 36, p. 16. [Google Scholar]
  58. Enli, G.; Syvertsen, T. The end of television—Again! How TV is still influenced by cultural factors in the age of digital intermediaries. Media Commun. 2016, 4, 142–153. [Google Scholar] [CrossRef] [Green Version]
  59. Harris, S. Cord-Nevers Could Be Bigger Threat to TV than Cord-Cutters. CBC News. 2015. Available online: https://www.cbc.ca/news/business/cord-nevers-cord-cutters-tv-1.3308072 (accessed on 11 May 2020).
  60. eMarketer. US Adult Cord-Cutters and Cord-Nevers, 2018–2022 (Millions and % of Adult Population). eMarketer 2018. Available online: https://www.emarketer.com/chart/224703/us-adult-cord-cutters-cord-nevers-2018-2022-millions-of-adult-population (accessed on 11 May 2020).
  61. Evans, J. South Africa is Young and Female—Stats SA Report. News 2018. Available online: https://www.news24.com/SouthAfrica/News/south-africa-is-young-and-female-stats-sa-report-20180723 (accessed on 11 May 2020).
  62. Statista. South Africa: Youth Unemployment Rate from 1999 to 2019. 2020. Available online: https://www.statista.com/statistics/813010/youth-unemployment-rate-in-south-africa/ (accessed on 16 May 2020).
  63. Ofcom. Media Nations: UK. 2018. Available online: https://www.ofcom.org.uk/__data/assets/pdf_file/0014/116006/media-nations-2018-uk.pdf (accessed on 11 May 2020).
  64. Cooper, D.R.; Schindler, P.S. Business Research Methods, 12th ed.; McGraw-Hill/Irwin: New York, NY, USA, 2013; 692p. [Google Scholar]
  65. Malhotra, N.K. Marketing Research: An Applied Orientation, 6th ed; Pearson Education: Upper Saddle River, NJ, USA, 2010. [Google Scholar]
  66. Saunders, M.; Lewis, P.; Thornhill, A. Research Methods for Business Students, 5th ed.; Pearson Education: Harlow, UK, 2009. [Google Scholar]
  67. Clow, K.E.; James, K.E. Essentials for Marketing Research: Putting Research into Practice; Sage: Thousand Oaks, CA, USA, 2014. [Google Scholar]
  68. South Africa. Protection of Personal Information Act, No. 4 of 2013. Gov. Gaz. 2013, 581, 37067.
  69. Taherdoost, H. Sampling Methods in Research Methodology; How to Choose a Sampling Technique for Research. Int. J. Acad. Res. Manag. 2016, 5, 18–27. [Google Scholar] [CrossRef]
  70. Bryman, A.; Bell, E. Business Research Methods, 3rd ed.; Oxford University Press: New York; NY, USA, 2011. [Google Scholar]
  71. Statista. No. of Pay TV Households in South Africa 2016 to 2021. 2016. Available online: https://www.statista.com/statistics/505602/pay-tv-subscribers-south-africa/ (accessed on 24 January 2020).
  72. Tengeh, R.K.; Talom, F.S.G. Mobile Money as a Sustainable Alternative for SMEs in Less Developed Financial Markets. 2020. Available online: https://www.researchgate.net/publication/340463868_Mobile_money_as_a_sustainable_alternative_for_SMEs_in_less_developed_financial_markets (accessed on 8 July 2020).
  73. Oji, O.N.E.; Iwu, C.G.; Tengeh, R.K. Social media adoption challenges of small businesses: The case of restaurants in the Cape Metropole, South Africa. Afr. J. Hosp. Tour. Leis. 2017, 6, 1–12. [Google Scholar]
  74. Sarstedt, M.; Mooi, E. A Concise Guide to Market Research: The Process, Data, and Methods Using IBM SPSS Statistics, 3rd ed.; Springer: Berlin/Heidelberg, Germany, 2019. [Google Scholar]
  75. Brace, I. Questionaire Design: How to Plan, Structure and Write Survey Material for Effective Market Research, 2nd ed.; Kogan Page: London, UK, 2008. [Google Scholar]
  76. Goforth, C. Using and Interpreting Cronbach’s Alpha. 2015. Available online: https://data.library.virginia.edu/using-and-interpreting-cronbachs-alpha/ (accessed on 8 July 2020).
  77. Survey Monkey. Using Skip Logic in a Survey. 2020. Available online: https://www.surveymonkey.com/mp/tour/skiplogic/?program=7013A000000mweBQAQ&utm_bu=CR&utm_campaign=71700000064157458&utm_adgroup=58700005704021376&utm_content=39700052007818772&utm_medium=cpc&utm_source=adwords&utm_term=p52007818772&utm_kxconfid=s4bvpi0ju& (accessed on 19 July 2020).
  78. BusinessTech. South Africans love TV: Stats SA. BusinessTech 2013. Available online: https://businesstech.co.za/news/trending/44899/south-africans-love-tv-stats-sa/ (accessed on 12 June 2020).
  79. Stats, S.A. How Unequal is South Africa? 2020. Available online: http://www.statssa.gov.za/?p=12930 (accessed on 21 June 2020).
  80. Daniels, R.H. Subscription Video on Demand: Viewing Preferences among New Zealand Audiences. Master’s Thesis, Auckland University of Technology, Auckland, The Netherlands, 2017. Available online: https://pdfs.semanticscholar.org/b36a/4f79a462b9c1f60a28053d44f2cd82d80a4d.pdf (accessed on 8 July 2020).
Figure 1. OTT TV standard subscription fees, Adapted from [32,33].
Joitmc 06 00139 g001
Figure 2. Pay-TV subscription upgrade (Source: authors).
Joitmc 06 00139 g002
Figure 3. Cord-cutters (Source: authors).
Joitmc 06 00139 g003
Figure 4. Reasons for future cancellation considerations (Source: authors).
Joitmc 06 00139 g004
Figure 5. Cord-shavers (Source: authors).
Joitmc 06 00139 g005
Figure 6. Cord-shavers (Source: authors).
Joitmc 06 00139 g006
Figure 7. Favoured OTT TV services for cord-stacking (Source: authors).
Joitmc 06 00139 g007
Figure 8. Cord-nevers (Source: authors).
Joitmc 06 00139 g008
Figure 9. Favoured OTT TV services by cord-nevers (Source: authors).
Joitmc 06 00139 g009
Figure 10. Reasons influencing first-time subscribers to favour OTT TV over pay-TV (Source: authors).
Joitmc 06 00139 g010
Table 1. Summarised overview of OTT TV service providers.
OTT TV Service ProviderAbout
NetflixDescribes itself as a leading online streaming service provider with over 190 million subscribers across 190 countries globally [22]. Estimated to have over 400,000 subscribers since it officially launched in South Africa in 2016, and it is still experiencing continual growth [6]. According to SimilarWeb [23], Netflix ranks in third place for streaming in South Africa.
ShowmaxAn online video subscription service owned by the MultiChoice Group and launched in South Africa in 2015 in competition with global OTT TV services [24]. This OTT TV platform has an estimated subscriber base of 595,000 [25]. Like other OTT TV service providers, its services are accessible on a smart TV, tablet, smartphone, and laptop. Showmax offers international content and also produces local content.
MultiChoice provides Showmax as a value-added benefit to its DStv Premium subscribers at no cost [26].
MultiChoice launched ShowmaxPro on 19 August 2020, which enables consumers to stream movies, including live sport on its platform as a standalone subscription on higher or standard definition quality [27].
Interestingly, during the national lockdown in South Africa owing to the COVID-19 pandemic, Showmax reported an increase in online streaming through its platform, depicting a change in customer viewership and increased consumption of content by consumers using OTT TV services [28].
YouTube PremiumYouTube is a significant video application, ranked as the top website for TV movie viewing and streaming in South Africa [23]. YouTube has a broader reach, making it the most significant OTT TV player in South Africa, as broadcasters such as eTV and the SABC use its platform for streaming services. Its subscriber base is over 20 million subscribers globally, combined with music services offerings [29]. However, subscriber numbers in South Africa have not been made public.
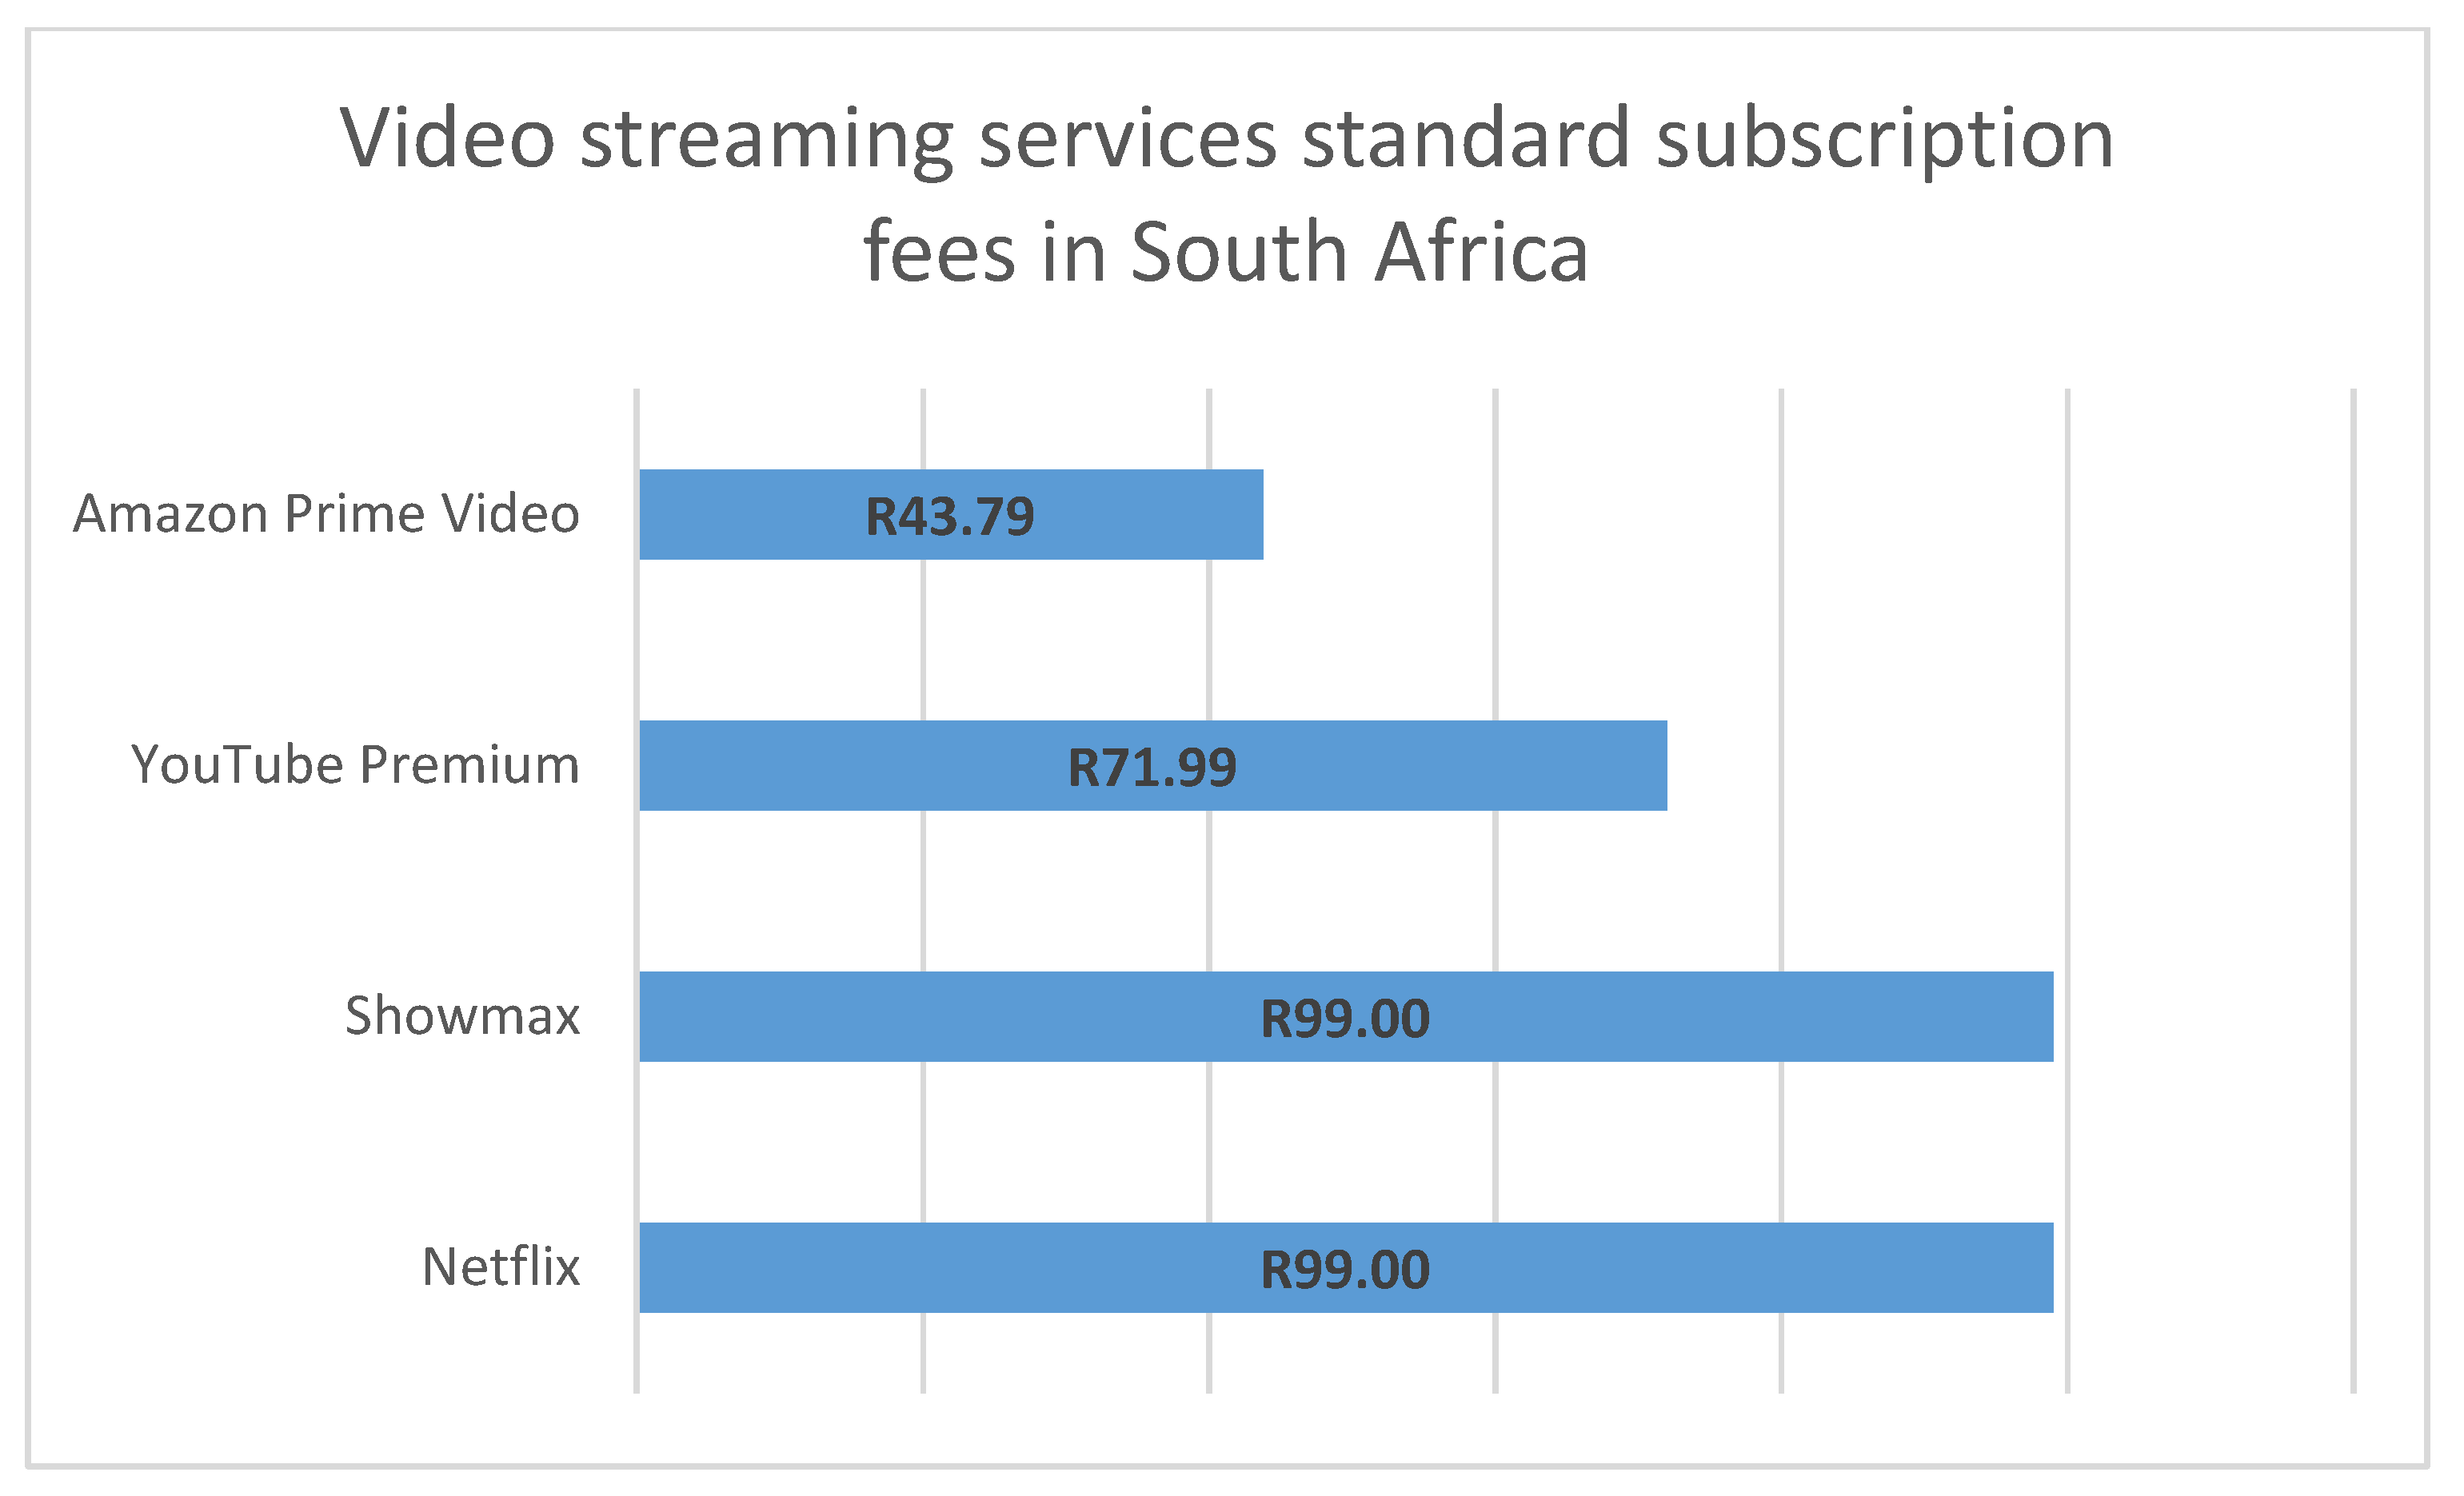
Amazon Prime VideoA streaming service owned by Amazon, with over 2000 TV titles in its library. It was the first to offer its customers the ability to download content offline for later viewing. This is a data cost-saving, especially in South Africa, where broadband data is still unaffordable for the majority of the population. Its platform has over 100 million subscribers and is available in more than 200 countries worldwide [30].
Amazon Prime Video launched in South Africa in December 2016, and it offers online streaming video content to its subscribers for a minimal fee of ZAR 43.00 per month, and this makes it the lowest subscription fee compared with other OTT TV operators in South Africa, as depicted in Figure 1 [31].
Table 2. The formula for population size calculation.
Confidence Level95%
Population proportion0.5
Margin of error5%
Population size6,800,000.00
Alpha0.03
Z-score1.96
Sample size384
(Source: authors).
Table 3. Reliability analysis.
Cronbach’s AlphaCronbach’s Alpha Based on Standardised ItemsN of Items
0.9220.9266
Source: survey data (2020).
Table 4. Sample size reflecting population per category.
FrequencyPercentValid PercentCumulative Percent
DStv21655.255.255.2
StarSat30.80.856.0
I have free-to-air (FTA—SABC, eTV, OVHD, etc.) and OTT TV services4311.011.067.0
I only have OTT TV services (Netflix, Showmax, etc.)9524.324.391.3
I use free/paid mobile apps to consume TV content.348.78.7100.0
Total391100.0100.0
Note: Highlighted in yellow are the pay-TV subscribers, the colour green represents OTT TV subscribers with FTA services and in grey are free/paid mobile apps users. Source: authors.
Table 5. Demographic profiles (n = 391).
Variable FrequencyPercentage
I identify asFemale12231.2
Male25665.5
Gender fluid20.5
Non-binary41.0
Prefer not to say71.8
My age is18–245113.0
25–346717.1
35–4514236.3
46–547920.2
55+5213.3
My household income per month, including any additional jobs, but excluding government grants isLess than ZAR 10,000.0010326.3
R10,000.00–R17,000.007519.2
R18,000.00–R22,000.004812.3
R23,000.00–R32,000.004912.5
R33,000.00+8722.3
My province of residenceEastern Cape338.4
Free State225.6
Gauteng8622.0
Kwa-Zulu Natal328.2
Limpopo92.3
Mpumalanga184.6
North West194.9
Northern Cape92.3
Western Cape16341.7
Table 6. Cord-cutting by age.
I Have Cancelled My Pay-TV Subscription Services in Favour of OTT TV Subscription.Total
n/aStrongly DisagreeDisagreeNeutralStrongly AgreeAgree
My age is18–24357610150
25–3428141642367
35–455926341416140
46–5432151981479
55+17131342150
Total171758831615386
Source: authors.
Table 7. Cord-cutting by income levels.
I Have Cancelled My Pay-TV Subscription Services in Favour of OTT TV Subscription.Total
n/aStrongly DisagreeDisagreeNeutralStrongly AgreeAgree
My household income per month, including any additional jobs, but excluding government grants isLess than R10,000.005112201125101
R10,000.00–R17,000.0033131363775
R18,000.00–R22,000.0023101220148
R23,000.00–R32,000.0018111180048
R33,000.00+31252431185
Total156718030614357
Note: Comparison of cord-cutters by income levels; Source: authors.
Table 8. Cord-cutting by province.
I Have Cancelled My Pay-TV Subscription Services in Favour of OTT TV Subscription.Total
n/aStrongly DisagreeDisagreeNeutralStrongly AgreeAgree
My province of residenceEastern Cape147820132
Free State125121021
Gauteng47151671086
KwaZulu- Natal166330432
Limpopo3500109
Mpumalanga73311116
North West87120018
Northern Cape5030019
Western Cape5927531428163
Total171758831615386
Source: authors.
Table 9. Cord-cutting by gender.
I Identify asTotal
FemaleMaleGender FluidNon-BinaryPrefer Not to Say
I have cancelled my pay-TV subscription services in favour of OTT TV subscriptionn/a37124046171
Strongly disagree363620175
Disagree325600088
Neutral112000031
Strongly agree060006
Agree6900015
Total122251247386
Source: authors.
Table 10. Other reasons for future cancellation considerations.
“Should the area I stay in have a stable and established internet infrastructure, there is a strong possibility of cancelling the pay-tv subscription.”
“If for some reason, I would lose my job.”
“If another competitor with strong content comes along and if subscription would be more than R1000.”
“If they cancel or stop my favourite TV programmes.”
“We get poor content.”
“Should the area I stay in have a stable and established internet infrastructure, there is a strong possibility of cancelling the pay-tv subscription.”
Source: authors.
Table 11. Cord-shaving by gender.
I Identify asTotal
FemaleMaleGender FluidNon-BinaryPrefer Not to Say
I have downgraded my premium pay-TV subscription for a lower-priced package in favour of OTT TV servicesn/a37125046172
Strongly disagree203900160
Disagree344200076
Neutral141600030
Strongly agree141720033
Agree21400016
Total121253247387
Source: authors.
Table 12. Cord-shaving by income levels.
My Household Income Per Month, Including any Additional Jobs, but Excluding Government Grants IsTotal
Less than R10,000.00R10,000.00–R17,000.00R18,000.00–R22,000.00R23,000.00–R32,000.00R33,000.00+
I have combined my pay-TV with OTT TV subscriptionn/a5133231832157
Strongly disagree13655635
Disagree1711814858
Neutral8411519
Strongly agree55671740
Agree614531947
Total10073484887356
Source: authors.
Table 13. Cord-shaving by age.
My Age IsTotal
18–2425–3435–4546–5455+
I have combined my pay-TV with OTT TV subscriptionn/a3628593217172
Strongly disagree45136836
Disagree11218181160
Neutral3495324
Strongly agree561710341
Agree211237851
Total51661397850384
Source: authors.
Table 14. Cord-shaving by province.
My Province of ResidenceTotal
Eastern CapeFree StateGautengKwaZulu-NatalLimpopoMpumalangaNorth WestNorthern CapeWestern Cape
I have combined my pay-TV with OTT TV subscriptionn/a14124716388559172
Strongly disagree316411211736
Disagree6011112113760
Neutral122213101224
Strongly agree341053241941
Agree3210401312751
Total30218632917199161384
Source: authors.
Table 15. Cord-stacking by subscription package.
I Have Combined My Pay-TV with OTT TV Subscription.Total
n/aStrongly DisagreeDisagreeNeutralStrongly AgreeAgree
My monthly pay-TV subscription fee isn/a17200000172
Entry package—less than R100.00/R1100.00 per annum03816422
Lower package—Less than R300.00/R3300.00 per annum06834223
Middle package—less than R400/R4400.00 per annum061586944
Premium package—R500.00+/R5500.00+ per annum02129122536123
Total1723660244151384
Source: authors.
Table 16. Cord-nevers by age.
I only Have OTT TV Services and Have Never Subscribed to Pay-TV.Total
n/aStrongly DisagreeDisagreeNeutralStrongly AgreeAgree
My age is18–242525017150
25–34486521567
35–45881220939141
46–54525782478
55+404421051
Total2532941212419387
Source: authors.
Table 17. Cord-nevers by gender identification.
I Identify asTotal
FemaleMaleGender FluidNon-BinaryPrefer Not to Say
I only have OTT TV services and have never subscribed to pay-TV.n/a90158203253
Strongly disagree52301029
Disagree102901141
Neutral21700221
Strongly agree81402024
Agree61200119
Total121253247387
Source: authors.
Table 18. Cord-nevers by the province of residence.
I only Have OTT TV Services and Have Never Subscribed to Pay-TV.Total
n/aStrongly DisagreeDisagreeNeutralStrongly AgreeAgree
My province of residenceEastern Cape202322332
Free State142320122
Gauteng5077613386
KwaZulu-Natal191531231
Limpopo7100109
Mpumalanga113400018
North West132021119
Northern Cape6100119
Western Cape1131019658161
Total2532941212419387
Source: authors.
Table 19. Cord-nevers by the province of residence.
Hulu
Sling TV
Expat Vision UK
“I am using all of the services, as mentioned above.”
Source: authors.
Table 20. Other reasons influencing first-time subscribers to favour OTT TV over pay-TV.
“Considering the price of data and subscription, I am still paying less. Also, I can use my laptop and data for multiple purposes compared to DStv, which needs a TV, decoder, etc.”
“DSTV plays the same movies and shows over and over again.”
“I move around a lot as a freelancer sometimes.”
“I never thought about subscribing to any pay-TV in the past.”
“Bad call service, unprofessional.”
Source: authors.
Table 21. Subscription type by the level of income.
I Subscribe toTotal
DStvStarSatI Have Free-to-Air (FTA—SABC, eTV, OVHD, etc) and OTT TV ServicesI only Have OTT TV Services (Netflix, Showmax, etc)I Use Free/Paid Mobile Apps to Consume TV Content
My household income per month, including any additional jobs, but excluding government grants isLess than R10,000.00511161817103
R10,000.00–R17,000.004201117575
R18,000.00–R22,000.00241317348
R23,000.00–R32,000.00301610249
R33,000.00+550522587
Total2023418432362
Source: authors.
Publisher’s Note: MDPI stays neutral with regard to jurisdictional claims in published maps and institutional affiliations.

