Abstract
This paper analyzes the relationship between efficiency and innovation activity in Spanish industrial and service sectors by introducing a new methodology framework. A new model combining principal component analysis (PCA) and data envelopment analysis (DEA) is applied in order to obtain an efficiency score. To achieve a more comprehensive evaluation, a large dataset is included, but a large number of variables compared with the number of decision-making units (DMUs) may diminish the discriminatory power of DEA. To avoid this effect, we first apply PCA to separately obtain the input and output main factors. We then apply DEA to the new variables. The PCA–DEA model allows us to identify 5 efficient sectors out of 42. If only DEA were applied, 16 sectors would turn out to be efficient. This shows that the model improves the discriminatory capability of DEA. Methodologically, this work contributes to the literature by proposing an efficiency measurement using a large number of inputs and outputs that could be applied in different fields. Likewise, this analysis allows for the evaluation and interpretation of innovation activity in the different sectors, which can be taken into account in the management and allocation of resources by institutions.
1. Introduction
Innovation is fundamental because of the benefits that it brings to society and the economy. Following the Organisation for Economic Co-operation and Development (OECD) [1], innovation helps to achieve economic growth and social change. It has an influence on social welfare, sustainability, and climate change. At this point, it is necessary to establish a method for measuring and evaluating innovation.
Managers and consultancies are paying increasing attention to the importance of measuring innovations, but a common overall innovation measurement framework cannot be extracted from academic research [2]. Adams, Bessant, and Phelps [3] and Cruz-Cázares, Bayona-Sáez, and García-Marco [4] indicated that theoretical indicators cannot be directly applied to business. There are many influencing factors in the complex process of innovation [5], and companies cannot easily obtain all of the needed data to evaluate innovation activities.
As has been highlighted by the OECD innovation strategy, a better measurement of innovation and its impact on economic and sustainable growth is key to achieving better coordinated innovation policies nowadays [6]. The assessment of innovation efficiency is included in these measurements because the optimal use of resources drives us forward to a better innovation performance and can lead to increased sustainability. Although the innovation efficiency concept could be considered a simplification of the innovation process, it may be useful as a tool for guiding policy decisions [7].
Innovation is a complex process in which the transformation of inputs into outputs is not automatic, so innovation performance should be measured as efficiency, considering inputs and outputs together [7,8].
This paper aims to contribute to innovation efficiency research by proposing a new approach to evaluate efficiency. We propose a new model, a two-stage method combining two techniques: principal component analysis (PCA) and data envelopment analysis (DEA). This new approach allows us to use a large number of inputs and outputs without diminishing the discriminatory power of DEA. We apply PCA over input and output sets separately, obtaining the main factors with high explanatory power, which will be used as inputs and outputs in DEA. Therefore, we will obtain a more comprehensive evaluation of efficiency by using a large set of source data while maintaining the discriminatory capability of DEA.
On the other hand, with regard to decision-making units (DMUs) considered in innovation efficiency studies, firms, provinces, regions, and even countries have been analyzed [7,8,9,10], but we found a gap related to the innovation efficiency of sectors within a country. Defining a map of the innovation efficiency of the industrial and service sectors of a country would be useful to understand the innovation activity within that country. Extending this analysis would be useful to compare the innovation efficiencies of specific sectors in different countries.
In this work, we use the new methodology described above to evaluate the innovation efficiencies of the industrial and service sectors in Spain. We analyze 42 industrial and service sectors from the 2016 Innovation in Companies Survey (ICS) [11] using a broad set of inputs and outputs. In this way, a large dataset can be included in the research, which could not be included if we apply only DEA. This allows for a more complete and robust efficiency result, taking into account several nuances that are difficult to include with traditional methods.
This paper aims to analyze the innovation efficiencies in the Spanish industrial and service sectors. To reach this aim, we define two complementary objectives: (1) the definition of an adequate model for evaluating efficiency in a more complete and robust way and (2) the application of this model in order to obtain the innovation efficiencies in the Spanish sectors.
The rest of the paper is organized as follows: Section 2 reviews the related literature and presents the research objective. Section 3 describes the sample and the variables employed in the empirical tests, relating them to previous works. Section 4 reports on the empirical results and includes the discussion. The final section concludes.
2. Literature Review
Innovation is a topic that has been attracting interest for more than 50 years. Since Schumpeter [12] defined innovation as the “recombination of current resources to create a new production function,” there have been countless studies that scientists and researchers have carried out on the subject. Schumpeter’s definition of innovation refers to the new changes that take place in the launch of a new product or in the development of an existing one, such as in production processes, in markets, with both resources and materials, and in organizational systems [12]. It is the first extended definition of innovation.
The Oslo Manual, the basis upon which the OECD and other organizations publish statistics on business innovation, contains this definition: “An innovation is a new or improved product or process (or combination thereof) that differs significantly from the unit’s previous products or processes and that has been made available to potential users (product) or brought into use by the unit (process)” [13].
Following Gault [14], the Oslo Manual definition of innovation in later editions was only related to the business sector, but in the last Oslo Manual definition of innovation, the term “unit” is used to describe the actor responsible for the innovations. It refers to any institutional unit in any sector, including households and their individual members, but there is no specific concept to define innovation in the public sector.
The major change in the definition of business innovation in the latest edition of the Oslo Manual has been the reduction in the complexity of the previous definition of the four types of innovation (product, process, organizational, and marketing) into two main types: product innovations and business process innovations.
A product innovation is a new or improved good or service that presents significant differences from the firm’s previous goods or services and that has already been introduced to the market. A business process innovation is a new or improved business process for one or more business functions that presents significant differences from the firm’s previous business processes and that has already been put into use by the firm.
At this point, it is important to mention research and development (R&D) due to the great influence it usually has on innovation results. For R&D to contribute to innovation, it needs to be incorporated into the production function [15]; that is, it needs to be considered into the variable set of an innovation study. According to the Frascati Manual [16], research and development (R&D) is the “creative work undertaken on a systematic basis in order to increase the stock of knowledge, including knowledge of human, culture and society, and the use of this stock of knowledge to devise new applications.”
R&D includes key factors needed to increase economic growth, although innovation is a major driver of the economy to increase productivity. Innovation refers to a new way of doing something with revolutionary changes not only in products but also in processes or even in the marketing or organization itself. Innovation is a critical added value linked to performance and growth improvements in efficiency.
The importance, definition, and differences between innovation and R&D have been widely studied in the academic literature. Some of the most significant studies have been carried out by Schumpeter [12]; Dosi [17]; Mckeown [18]; Thomke [19]; Fagerberg, Mowery, and Nelson [20]; Fagerberg [21]; Audretsch and Belitski [15]; Ebersberger, Marsili, and Reichstein [22]; and Huergo and Moreno [23].
Not only researchers but also international organizations have studied the importance of innovation in relation to the growth of the economy. There is a big interest in understanding how science, technology, and innovation increase productivity and profits, stimulating the growth and competitiveness of the economy [24]. Innovation and technology are key elements for fostering competitiveness and progress that can help to obtain sustainable economic growth.
At this point, we need to refer to open innovation. Open innovation allows us to bring together existing and prospective forms of knowledge flows across the boundaries of innovation-active firms [13].
Definitions aside, innovation must be studied quantitatively in order to better understand the contribution of innovation inputs to national economies and the contribution of different industries to national innovation.
2.1. Innovation in Spain
In most of the research studies on the most developed economies, development and innovation are the basis of economic growth. According to the International Monetary Fund (IMF), Spain is one of the advanced economies in the world, and it is considered to be the 13th largest economy of the world and the 4th in the European Union [25].
According to the OECD Economic Surveys, such as Spain 2018 [6], Spain has made a successful economic recovery. The real gross domestic product (GDP) grew by around 3% in the years 2016–2018. The economic activity in Spain has been supported by past structural reforms, robust employment growth, gains in competitiveness, and favorable external conditions. In the following years, this growth is set to continue, although at a slower pace.
Policies that improve competition and innovation are key to fostering productivity and growth. In that sense, there is wide room for policies to boost productivity growth, including in the best-performing Spanish regions and firms. There is a large productivity gap between Spanish firms and the best-performing global firms. This suggests that policies to increase the exposure of firms to innovation are needed [6].
Nevertheless, there is a significant gap between the position of Spain and that of Europe concerning research, development, and innovation. According to the European Innovation Scoreboard (EIS) 2017, Spain was considered to be a moderate innovator [26], even though it is one of the most advanced economies in the European Union.
Spain’s innovation performance relative to that of the European Union has declined by about 1.5% since 2010, with its performance increasing in 2015 and 2016. In that sense, the innovation gap still exists.
In this context, the EIS 2017 identified the strongest and weakest dimensions in Spanish innovation. Human resources and a favorable environment for innovation were the strongest innovation dimensions, while firm investments and linkages were the weakest innovation dimensions within small and medium-sized enterprise (SME) innovations.
Regarding economic structure, the Spanish economy is mainly based on SMEs, especially microenterprises with fewer than 10 employees [27]. The productivity gap between large companies and microenterprises in Spain is greater than that in other large economies of the EU [28], especially in the information and communication sector and the manufacturing sector [29].
The low productivity of the Spanish economy is partly explained by the business fabric formed mainly by SMEs. In addition, the growth rate of Spanish companies was below the European average [27]. Corporate R&D expenditure was low, which limited the increase of productivity [29].
At the national level, the National Statistics Institute (INE), in coordination with the Eurostat and within the framework of the OECD Oslo Manual and the Frascati Manual [16], measures the level of technological innovation in Spanish companies. Using statistical data from the INE, the aim of the present work is to analyze the innovation efficiencies of industrial and service sectors in Spain.
The organization of the innovation process in Spanish companies was analyzed by Galende [30]. He concluded his research by explaining that the generation of innovation is mainly based on internal activities, especially the activities of R&D (fundamentally technological development), with the external acquisition of R&D being a marginal method. Nevertheless, we considered that this is a very complex topic of study because there are different determinants that have a considerable influence on innovation performance in addition to R&D. In this sense, innovation has been measured in different ways, with different techniques, and from different approaches.
2.2. Using Efficiency to Evaluate Innovation
Innovation is fundamental to achieving improvements in living standards, and this has influence on individuals, institutions, entire economic sectors, and countries, and therefore, on sustainability. Measuring innovation and researching about this topic can help policy makers to evaluate the effectiveness and efficiency of their policies. In that sense, the measurement of innovation allows us to understand social and economic changes [13].
“Innovation drives growth and helps to address social challenges” [1]. It is desirable that innovation pursues sustainable development and promotes social cohesion, but this is not always necessarily the case. In general, innovation has a positive relationship with labor demand. The debate about the effect of innovation on employment distinguishes between process innovation and product innovation. Following Peters et al. [31], a process innovation theoretically leads to an increase of production efficiency. This efficiency implies the use of less inputs to produce the same outputs, so it can imply reduction in employments. However, other mechanisms, like costs and price reductions, could compensate labor demand [32]. On the other hand, product innovations seem to have a positive effect on employment [31].
Several studies carried out in recent years in Spain about the relationship between innovation and employment have been analyzed. In that sense, Harrison et al. [33], Bianchini and Pellegrino [34], and Calvino [35] found that product innovation had a positive effect on employment. Likewise, Díaz et al. [36] suggested a positive general effect of innovation on the total employment of companies across different industries, even in a crisis period. This effect was higher in high-tech industries.
In addition, innovation is a priority in the fight against climate change. In this sense, the monitoring and evaluation of innovation policies is fundamental. In order to extract information from applied policies, innovation must be measured [14].
Innovation is a long and complex process that involves the phases of looking for, selecting, implementing, and capturing value. Therefore, the innovation process should be evaluated as a whole process, not only paying attention to inputs and outputs separately [37]. Assessing innovation efficiency allows us to evaluate innovation by taking both inputs and outputs into account.
A regulatory framework that supports the efficient allocation of resources and drives innovation to increase productivity and promote business growth is necessary [6]. The evaluation of the innovation efficiencies of the industrial and service sectors would lead us to know which sectors present a better innovative performance. Decision makers will be able to allocate resources optimally across both industries and service companies, identifying the strengths and weaknesses in the innovation activities.
Efficiency is related to the use of productive resources in the production process of a firm that operates according to existing technology. Efficiency is determined by analyzing the level of inputs that a firm uses to produce goods and services and the level of outputs that the firm supplies.
The study and measurement of efficiency were formally addressed for the first time in the works of Koopmans [38], Debreu [39], and Farrell [40].
Innovation efficiency is related to the concept of productivity. Shin et al. [10] mentioned that it used to be defined as “the ability to translate innovation inputs into innovation outputs.” Innovation efficiency is improved when, with the same amount of innovation inputs, more innovation outputs are generated or when less innovation inputs are needed to generate the same amount of innovation outputs [7]. Cruz-Cázares et al. [4] defined the technological innovation efficiency of a firm as the relative capability to maximize innovation outputs given a certain quantity of inputs.
Efficiency is an important concept for innovation because results of innovation are an important matter for society [7]. Evaluating the efficiency of innovation systems can be a tool for formulating policies that allow us to identify best practices and develop improvement actions and strategies. It can also help to understand the innovation process [41]. Furthermore, the evaluation of innovation efficiency provides guidelines for improving efficiency as it allows us to identify the possible weaknesses and to know which units are the best to benchmark [42].
Nonparametric methods, with DEA as the most widely used, are capable of effectively combining the different facets, inputs, and outputs of innovation without the need to establish a specific production function [41]. The DEA method has been widely used in different studies on the measurement of the innovation efficiency of different sets of units. Thus, DEA is used to study the innovation efficiency of national innovation systems [43] and regional innovation systems [8], to carry out cross-country comparisons [44], to study innovation efficiency in firms [4], and even to evaluate eco-innovation efficiency [43].
The existing studies about this topic have analyzed innovation efficiency in firms, regions, or countries, but not in sectors. To complement previous research, this work provides information on innovation efficiencies in the industrial and service sectors within a country.
3. Methodology
3.1. Data and Sample
The context of the study is Spain. Data were extracted from the 2016 Innovation in Companies Survey [11]. This survey is carried out annually by the National Statistics Institute (INE) since 1994, as the Spanish version of the Community Innovation Survey (CIS). The main objective of this survey is to provide direct information on the innovation process in companies—developing indicators in order to understand different aspects of the innovation process. This statistical research extends to all industrial and service companies with at least 10 paid employees. The methodology used is widely accepted on an international level, allowing the international comparability of the results obtained. The CIS survey data are representative of the size, industry, and regional location of the population of Spanish companies.
For this study, we used the classification of firms in terms of the Nomenclature générale des Activités économiques dans les Communautés Européennes (NACE) used for indicating the activity sector. The possibility of translating NACE code into the International Standard Industrial Classification (ISIC) that is used in the USA would allow us to carry out international comparisons [45]. The Innovation in Companies Survey is random and stratified according to industry (NACE Review 1 classification) and firm size, among others. This survey offers the main indicators of innovation in companies in 2016. The analysis relies on a dataset of 42 activity sectors defined by NACE code.
3.2. Input and Output Variables
We selected 7 inputs and 10 outputs to evaluate the innovation efficiency of Spanish industries based on previous literature.
The input variables are related to innovation expenditures and R&D human resources in the industries. Specifically, we take into account not only the general variables but also other inputs that can add subtleties to the variables of innovation expenditures and R&D staff. Table 1 provides the inputs used in this study.

Table 1.
Selected inputs and outputs.
Traditionally, R&D expenditure is an input used in most of the innovation efficiency revised works: Bin [46]; Díaz-Blateiro et al. [47]; Guan et al. [48]; Guan and Chen [8]; Hong et al. [49]; Lee et al. [50]; Liu and Wang [51]; Revilla, Sarkis, and Modrego [52]; Zhang, Zhang, and Zhao [53]; and Zhong et al. [54]. All of these authors took into account the firm’s annual total expenditure on internal R&D activities. In our case, we can use the expenses in innovation as input specifically collected in the 2016 ICS.
The second selected input is R&D staff. It refers to the number of full-time R&D employees and the converted full-time equivalent of other part-time R&D staff in the year. This input was used by Guan and Chen [8], Lee et al. [50], Zhang et al. [53], and Zhong et al. [54].
We completed the selection of inputs with others related to the activities of acquisition of R&D and innovation training carried out in the companies.
Regarding the selected outputs, these provide information about the proportion of innovative companies, the turnover related to innovation, and the technological and nontechnological innovation activities. Information about the selected outputs can be found in Table 1.
The selected outputs regarding turnover are in line with those used by Díaz-Blateiro et al. [47], Hashimoto and Haneda [55], and Zhong et al. [54]. These authors used profits as an output in innovation efficiency studies.
This paper aims to analyze the innovation efficiency in industries, which is why the proportion of innovative companies is a main result in our study, such as the intensity of innovation. Other outputs, such as companies with different types of innovation, provide a more comprehensive approach to the innovative behavior of industries. In this way, a more precise result is obtained when considering the wide spectrum of innovation activities taking place in companies.
3.3. Methodology: PCA-DEA Model
The aim of this paper is to analyze the relationship between efficiency and innovation activity in Spanish industries. In order to carry out this study, we proposed a new analysis method: the PCA-DEA model. The methodological strategy of this new model was executed in two stages. In the first stage, we applied principal component analysis (PCA) over a set of previously selected inputs and outputs separately. These variables are described above and associated with the innovation activities in industries. In this way, we obtained the main components of the set of inputs and outputs. In the second stage, we applied data envelopment analysis (DEA), a nonparametric technique, on this new dataset and obtained a robust efficiency score.
DEA is an extended method used to evaluate efficiency in different fields, and concretely, it has been used to evaluate the innovation efficiency in a large number of works. This technique is frequently used in the study of efficiency evaluation regarding regional innovation systems [8,54,56] and in comparative studies of innovative performance in different countries [57]. In general, DEA has been widely applied to evaluate the efficiency of innovation [10].
Related to the analysis of innovation efficiency within countries, Revilla et al. [52] analyzed the performance of Spanish firms in public–private research collaborations using a sample of 118 firms carrying out 281 cooperation projects with public centers. Díaz-Blateiro et al. [47] studied the innovation activity in the Spanish wood-based industry, analyzing the data of 171 firms for a period of 4 years. Guede et al. [58] analyzed innovation efficiency according to activity sector. Guan et al. [48] applied DEA to a sample of 182 industrial innovative firms from China, studying the relationship between technological innovation capability and competitiveness.
In DEA, a decision-making unit (DMU) is efficient when it produces more quantity in some of the outputs without producing less quantity for the rest and without consuming more quantity of inputs. It is also efficient if it generates the same outputs by consuming fewer inputs and no more of the rest. A DMU will be efficient if, and only if, it is not possible to produce more outputs without modifying the quantity of the inputs or to consume less inputs to produce the same quantity of outputs [59].
Following Charnes, Cooper, and Rhodes [59] when applying DEA, it is possible to choose between two options: input-oriented DEA or output-oriented DEA. In the first case, the minimum quantity of inputs necessary to obtain a certain level of outputs is calculated, which is equivalent to calculating how much the amount of inputs can be reduced in order to continue producing the same outputs. On the other hand, output-oriented DEA calculates the maximum level of outputs that a unit can produce if the quantity of inputs remains fixed. This paper selected output-oriented DEA.
The practical application of DEA presents the range of procedural issues to be examined and resolved, including those relating to the homogeneity of the units under assessment, the selected input/output set, the measurement of the selected variables, and the weights attributed to them [60,61].
Each of these issues can present difficulties in practice. In this paper, we tried to highlight the pitfall related to the number of variables, thus improving DEA’s discrimination capability.
As has been said, a large number of variables implied in DEA could make it difficult to obtain a robust result on efficiency. This is because when considering many inputs and outputs, the number of efficient DMUs increases. It is well known that a large number of variables implied in DEA may hinder the obtainment of a robust result on efficiency. Banker et al. [62] stated that the number of DMUs should be at least three times the number of inputs and outputs combined.
In order to obtain a more realistic result, and based on Guede et al. [58], we proposed a new model to solve the problem regarding the number of variables. With the PCA-DEA model, we applied principal component analysis (PCA) over the set of inputs and, separately, over the set of outputs. As a result, it was possible to reduce the number of inputs and outputs to apply DEA, thus increasing its discriminating ability. The PCA-DEA model is shown in Figure 1.
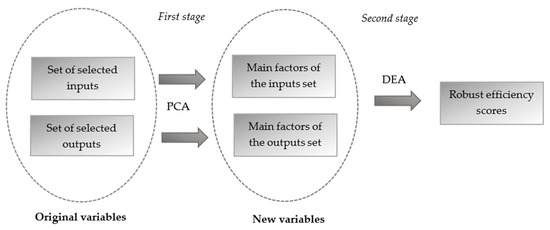
Figure 1.
PCA-DEA model (own elaboration).
3.3.1. First Stage: Principal Component Analysis
First, we obtained the principal components of the inputs and, separately, the outputs. With reference to the inputs, only one main factor has been identified. It has an explanation ability of 93.906% of the global variance. Extracting only one main factor implies that there is a high correlation between the inputs. The explained variance of the components in 2016 can be observed in Table 2.
Table 2.
Inputs’ explained total variance.
Related to the output set, three main factors were identified, which together explain 84.388% of the variance. The explained variance of each component in 2016 can be observed in Table 3. The first main factor (output 1) mostly compiles data on the intensity of innovations, the percentage of innovative companies, and the introduction of innovations in the market. The second main factor (output 2) mostly compiles data on the percentages of 2016 turnover due to goods and/or services that were new only for the company and in new in the market. The third main factor (output 3) mostly compiles the data on companies with different types of innovations.
Table 3.
Outputs’ explained total variance.
Once the matrix of rotated component weights was applied using the rotated method of Varimax normalization with Kaiser, three main factors that explain most of the variance and oppose some variables to another were obtained.
3.3.2. Second Stage: Data Envelopment Analysis
Second, we obtained the efficient and nonefficient industries by applying DEA over the new variables that stemmed from principal component analysis. We applied output-oriented DEA with variable returns to scale (VRS) and without weight restrictions. We selected output-oriented VRS DEA since companies first establish R&D and innovation budgets, namely, inputs. We then pursued the innovation results, that is, output maximization [4]. Therefore, the output-oriented model seems to be the most appropriate analysis tool because of its output enhancement, not input reduction, on which the industry management will focus their attention [18]. We selected the variable “returns to scale” as the dimension of the industries’ inputs and outputs, which varies greatly among the DMUs.
The model assumes that there are DMUs, and each DMU can obtain output with the use of input. The input vector of DMU is , and the output vector is .
The VRS’s output-oriented programming model is as follows:
s.t.:
is the amount of input used by DMU, while is the amount of output used by DMU.
is the objective function and represents the relative efficiency of the
are the weights obtained with the resolution of the program and indicate the weight of each of the units in the reference set of the evaluated DMU.
On the other hand, DEA allows each DMU (sector in our study) to specify its own weights in order to obtain a maximum efficiency score for itself. We did not contemplate the possibility of introducing weight restrictions in this study, so complete weight flexibility was allowed. It has been preferred to exploit the advantage offered by DEA regarding the freedom of behavior of the units. Without any restrictions on weights, each sector can be efficient operating in its own way.
4. Results
By carrying out the analysis, 5 out of 42 DMUs were identified as innovation-efficient industrial and service sectors (with an efficiency score of 100%), and therefore, there were 37 nonefficient industries whose efficiency score ranged from 93.58% to 20.04%. Table A1 shows the results of the efficiency analysis. It should be noted that when applying DEA on the original dataset, without using the PCA–DEA model, 16 efficient DMUs were obtained. Therefore, the discriminatory power of DEA is increased when using the proposed model in this paper.
Observing the total of efficient DMUs, four of them belonged to the service sector, and the other one belonged to the industrial sector. In Spain, the service sector represented 49% of research and innovation (R&I) expenditures executed by the business sector in 2016. The percentage for the industrial sector was 48.7% [11]. It thus seems to be easier to achieve innovation efficiency in the service sector since the necessary investments are usually higher in the industrial sector.
The service sector’s four efficient DMUs can be observed in Table A1: artistic, recreational, and entertainment activities; accommodation and food and beverage service activities; commerce; and R&D services. The first three sectors were not traditionally very innovative. However, they were classified as efficient because they obtained good innovation results without using more inputs when compared with other DMUs.
On the other hand, as expected, the R&D services turned out to be efficient at innovation. This DMU used high inputs but produced very high outputs related to innovation activity. In this sector, 75% of the R&D service companies were innovative companies, and the innovation results stood out from those of other activities.
The oil industry was the only industrial sector that turned out to be efficient at innovation. This sector is small in size in terms of the number of companies, and the investment in innovation is not very high. However, 70% of the companies in the oil industry sector were innovative, and the proportion of turnover in reference to new and improved products was high compared with other DMUs.
Regarding the industrial and service sectors that turned out not to be innovation efficient, the efficiency score varied between 20.04% and 93.58%. By taking into account the results shown in Figure 1, 76.19% of the DMUs concentrated their efficiency score between 31% and 80%.
For the nonefficient DMUs, Figure 2 shows the number of DMUs by their efficiency score interval.
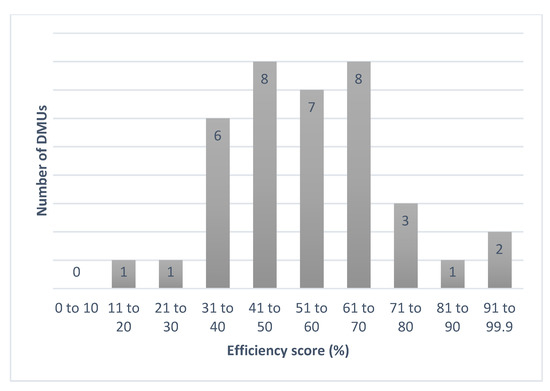
Figure 2.
Number of DMUs by their efficiency score intervals.
Health activities and social services and buildings were found to be nonefficient DMUs with a higher score. These DMUs presented relatively low innovation expenditures, but both of them were able to foster their innovation results in relative terms. It is important to remark that nontechnology innovation activities were key to obtaining a high efficiency score in both cases.
Chiesa and Fratini [63] introduced the idea that a larger availability of resources or inputs does not necessarily imply a higher performance in R&D. According to the obtained results in this study, this can be extended to innovation performance. Following Gao and Chou [64], R&D intensity is negatively associated with innovation efficiency, thus indicating that more capital invested in R&D or innovation does not necessarily guarantee better innovation performance.
In our sample, the R&D service sector that turned out to be efficient had the highest innovation expenses. Nevertheless, the next four DMUs with higher innovation expenses were classified as nonefficient. Thus, pharmaceutical; motor vehicle, trailer, and semitrailer; telecommunications; and financial and insurance activities turned out to be inefficient DMUs in spite of their high inputs.
Considering the nature of the pharmaceutical industry, high investments are needed to introduce new drugs to the market, in addition to the most advanced technologies. Similarly, the motor vehicle and telecommunications industries need big expenses in relation to innovation in order to obtain new products or processes that improve the production and turnover of companies. In that sense, these innovation efforts were not directly reflected in the innovation results or in the performance of the four DMUs, so they were therefore classified as inefficient units.
5. Discussion: Innovation Efficiency in Spanish Service Sectors and Open Innovation
The present work represents a step forward in the study of innovation efficiency by economic sectors. In this context, one of the most outstanding aspects are the results obtained in service sectors. As can be seen, four service sectors turned out to be efficient, and only one industrial sector was classified as efficient in innovation. Service companies do not innovate less than manufacturing companies but can innovate in different ways [65].
Innovation practices in the service sector are highly dependent on information and communication technologies and non-R&D innovation expenditures [66,67]. It should be noted that service companies tend to collaborate more frequently with customers and suppliers [65].
Open innovation encourages firms to use external knowledge sources and external paths to foster innovation. Many open innovation concepts can be applied to the service sector. However, it should be noted that open innovation works somewhat differently in service sector companies. These firms work with intangible goods whose requirements are difficult to exactly specify by customers. Furthermore, the same service may be perceived differently by different customers. Therefore, service companies could move towards open innovation by working closely with customers in order to develop new solutions to suit their demand [68].
Obtaining successful innovative results increasingly depends on effective recombination of knowledge inputs across company boundaries. In that sense, service companies seem to use more external knowledge than manufacturers [69].
Specifically, regarding the R&D services sector, one of the efficient DMUs in this study, there are outstanding examples of structured business models that pursue both the search for external knowledge and the use of internal knowledge. In [69], business services resulted to more open users of external knowledge than in manufacturing industries. They used informal rather than formal open innovation practices more intensively in relation to manufacturers.
However, the interactions between service companies and specialist external sources of knowledge are present in different service sectors, including more traditional ones, such as restaurants [69]. This leads us to another efficient sector in this study: accommodation and food and beverage service activities. Regarding restaurants, open innovation seems to be a rational strategy for small restaurants, and launching an open innovation platform for recipes, food, or service could generate additional benefit due to independent ingredients or services selling [70]. Regarding the accommodation sector, external knowledge also seems to drive open innovation performance in companies. Open innovation in hospitality firms turns out to be important for service innovation and business performance [71].
On the other hand, culture is considered to be a critical driver of innovation. Culture can be a booster of open innovation that not only companies but also societies will benefit from [72]. Establishing a culture of open innovation in companies in any service sector would result in greater use of both external and internal sources of knowledge. External knowledge would accelerate internal innovation, while external knowledge would allow us to achieve internal knowledge of the market.
Otherwise, the health and social services sector has achieved the highest efficiency score among nonefficient sectors. There seems to be a high concentration of social enterprises in this sector. In that sense, most social enterprises are considered to thrive on open innovation, and the success of social enterprises depends on the effort they make to move towards open innovation [73,74].
6. Conclusions and Implications
6.1. Conclusions
Many authors have contributed to the study of innovation efficiency, which overall is referred to as regional or national innovation systems. However, a gap related to the evaluation of innovation efficiency in the industrial and service sectors within a country exists.
Measuring innovation efficiency is not a novel topic. Nevertheless, evidence of empirical works specifically focused on technology innovation is limited, and it is generally used to evaluate efficiency in relation to the cross-sectional samples of a single industry [4].
The conducted research allowed us to expand this field by introducing a new model that can be used to evaluate efficiency in different fields obtaining more accurate results. This new approach consists of combining PCA and DEA in order to obtain a more realistic and robust result.
It is possible to take into account the information provided by a large number of variables in DEA and to ensure its discriminatory capacity if PCA is first applied. The combination of PCA and DEA allows for the reduction of the dimensionality of the problem while maintaining the subtleties that consider how data contribute to the problem.
The totality of the most representative innovation data related to the entire activity of each sector was considered in this work in order to compare the innovative performances between the sectors and to distinguish the efficient ones. Therefore, at the documentation level, we used the majority of available data about innovation in the industrial and service sectors in Spain, adding, in this way, subtleties to the frequently used variables in innovation efficiency studies and thus enriching the research.
By carrying out the two-stage analysis applying the PCA–DEA model, we were able to identify 5 robustly efficient sectors ranked out of 42. Four of them are service sectors, and the other one is an industrial sector. It should be noted that applying only DEA, the number of innovation-efficient sectors amounted to 16. This shows how the discriminatory power of DEA increases when the model proposed in this work is used.
To go deeper in the research and to fill the existing gap when a broad set of variables wants to be used in DEA, we have proposed a new approach to assess innovation efficiency that could be used to evaluate efficiency across different fields. From a methodological perspective, this work proposes a method for assessment efficiency by considering a large number of inputs and outputs without diminishing the discrimination capability.
Furthermore, the proposed approach in this paper could provide support for the formulation of innovation policies since the global vision of innovative efficiency of a country is offered. In that way, decision makers would find it easier to select the appropriate innovation strategies for resource allocation and the sectors’ innovation evaluation.
Innovation has contributed to the growth of the Spanish economy, but innovation data are still far from the results from major European countries. In the present paper, only five sectors are classified as efficient in innovation. For nonefficient sectors, the current allocation of resources (inputs) seems to be far from being efficient. This requires a reconsideration of the inputs that must be enhanced to improve innovation efficiency.
On the other hand, increasing innovation resources does not necessarily result in profits and competitiveness increment—hence the importance of including the efficiency perspective in the evaluation of innovation [75]. The present study puts forward several policy recommendations. First, the government should expand current measures to promote innovation. The secretary of state for R&D offers tools in order to drive innovation mainly through calls for proposals and tax deductions. It would be interesting to promote these measures among firms belonging to sectors that obtained low scores in the innovation efficiency ranking.
In that sense, following Greco et al. [76], public subsidies are positively associated with open innovation efficiency. This is due to the increased propensity of companies to collaborate with other organizations. The majority of researchers acknowledge the positive impact of open innovation on the innovation performance of companies [77,78,79]. Public subsidies could aim to foster the adoption of open innovation in order to enhance innovation performance [76]. Therefore, innovation efficiency would also be enhanced, as well as encourage the establishment of collaborations between organizations. In that sense, the government should establish a comprehensive and continuously updated space to make access to information on innovation easier for firms. This measure would contribute to the sharing of scientific and technological resources if an incentive system is stablished. An incentive program for companies that share scientific and technological resources and experiences in innovation could be designed. These measures could lead to the adoption of open innovation in participating companies or at least have a first contact with open innovation. Obviously, there are some sectors whose innovations are highly protected that would not participate in these actions, but it could be a good measure for other sectors.
In addition, a best practice guideline that recollects success stories in firms that have received grants and awards for innovation should be created. Finally, monitoring the innovation efficiency of sectors in the following years would allow us to know the evolution of innovation efficiency.
The proposed policy recommendations could be specified as follows:
- ○
- Promote open innovation by creating mechanisms for sharing knowledge and experiences among companies.
- ○
- In that sense, design an incentive program for firms that share knowledge and resources.
- ○
- Create a best practice guideline for collecting success stories in firms.
- ○
- Design a monitoring system that allows us to follow the evolution of the innovation efficiency of sectors in the next years.
6.2. Implications
This paper contributes to the literature and practice by introducing a new model in order to evaluate efficiency by considering a large number of variables. One of the disadvantages of DEA is that an overly large set of input and output variables seriously biases efficiency scores. The PCA–DEA model proposed in this paper allows us to go further in efficiency research since it allows us to consider a wide set of variables without diminishing the discriminatory power of DEA.
On the other hand, this paper analyzes the innovation efficiency of the economic sectors of a country. The information provided by the study allows us to obtain general guides for the study of innovation efficiency within a country, which could complement the results of research on the efficiency of national innovation systems.
Therefore, this paper sheds light on the evaluation of efficiency by introducing the PCA–DEA model. This model allows a large set of inputs and outputs to be used without diminishing the discriminatory capacity of DEA. Thus, particular aspects and details of the research data can be introduced into the analysis. Likewise, we obtained an evaluation of the efficiency of innovation in Spanish sectors. Regarding this, the service sector seems to have a better performance related to innovation efficiency.
6.3. Limitation and Future Recommendation
Although this work fills the existing gap of using a large set of variables in DEA and allows us to appreciate the innovation efficiency in different sectors, some limitations can be pointed out. First, although DEA is a perfect technique for evaluating the efficiency of heterogeneous DMUs, we only obtained an efficient or nonefficient classification. It would be interesting to combine this PCA–DEA model with other techniques that allow us to know more about the intrinsic behavior of efficiency. It could be carried out with multicriteria analysis. Furthermore, the analysis by NACE code provides a general vision of the innovation efficiency in the country, but the singularities of each economic activity are not considered. Likewise, we considered a dataset of only 1 year. It would be interesting to apply the PCA–DEA model by considering a time series in order to obtain a more precise result. This would allow us to better capture the real relationship between innovation inputs related to the production of innovation outputs. Finally, future research could be carried out to evaluate the innovation efficiency in sectors in other countries. This analysis would be useful to compare the innovation efficiency of specific sectors in different countries and to detect similar or different behaviors in countries with similar economic structures. We leave these ideas to future research.
Author Contributions
Conceptualization, R.G.-C.; Data curation, R.G.-C. and L.R.-A.; Formal analysis, R.G.-C. and A.I.C.-C.; Investigation, R.G.-C., L.R.-A., S.L.-G. and A.I.C.-C.; Methodology, R.G.-C. and S.L.-G.; Supervision, R.G.-C.; Writing—original draft, R.G.-C.; Writing—review & editing, R.G.-C., L.R.-A., S.L.-G. and A.I.C.-C. All authors have read and agreed to the published version of the manuscript.
Funding
This research received no external funding.
Data Availability Statement
Data available in a publicly accessible repository.
Acknowledgments
The authors would like to thank the editor and two anonymous reviewers for their helpful comments on this paper.
Conflicts of Interest
The authors declare no conflict of interest.
Appendix A
Table A1.
Efficiency scores.
Table A1.
Efficiency scores.
| Industry | Score (%) |
|---|---|
| Artistic, recreational, and entertainment activities | 100.00 |
| Oil industries | 100.00 |
| Accommodation and food and beverage service activities | 100.00 |
| Commerce | 100.00 |
| R&D services | 100.00 |
| Health activities and social services | 93.58 |
| Building | 92.58 |
| Computer, electronic, and optical products | 81.47 |
| Other transport equipment | 78.54 |
| Other services | 75.51 |
| Chemistry | 71.86 |
| Pharmaceutical | 70.55 |
| Furniture | 70.28 |
| Building of ships and boats | 69.65 |
| Textile | 69.05 |
| Air and spacecraft and related machinery | 67.65 |
| Administrative and support service activities | 66.35 |
| Motor vehicles, trailers, and semitrailers | 64.33 |
| Computer programming, consultancy, and related activities | 61.74 |
| Electrical equipment | 59.03 |
| Human health, residential care, and social work activities | 56.99 |
| Printing and reproduction of recorded media | 56.93 |
| Machinery and equipment | 55.99 |
| Other manufacturing | 53.97 |
| Other activities | 51.28 |
| Wood and cork | 51.14 |
| Paper and paper products | 48.85 |
| Food, beverages, and tobacco | 48.81 |
| Leather and related products | 48.28 |
| Rubber and plastic products | 47.94 |
| Repair and installation of machinery | 46.30 |
| Financial and insurance activities | 43.97 |
| Basic metals | 43.62 |
| Fabricated metal products, except machinery and equipment | 43.13 |
| Other nonmetallic mineral products | 40.60 |
| Other information and communication services | 39.23 |
| Real estate activities | 38.88 |
| Telecommunications | 37.53 |
| Transport and warehousing | 35.93 |
| Energy and water | 35.36 |
| Wearing apparel | 23.83 |
| Extractive industries | 20.04 |
References
- OECD. The OECD Innovation Strategy: Getting a Head Start on Tomorrow; OECD Publishing: Paris, France, 2010. [Google Scholar]
- Dziallas, M.; Blind, K. Innovation indicators throughout the innovation process: An extensive literature analysis. Technovation 2019, 80–81, 3–29. [Google Scholar] [CrossRef]
- Adams, R.; Bessant, J.; Phelps, R. Innovation management measurement: A review. Int. J. Manag. Rev. 2006, 8, 21–47. [Google Scholar] [CrossRef]
- Cruz-Cázares, C.; Bayona-Sáez, C.; García-Marco, T. You can’t manage right what you can’t measure well: Technological innovation efficiency. Res. Policy 2013, 42, 1239–1250. [Google Scholar] [CrossRef]
- Becheikh, N.; Landry, R.; Amara, N. Lessons from innovation empirical studies in the manufacturing sector: A systematic review of the literature from 1993–200. Technovation 2006, 26, 644–664. [Google Scholar] [CrossRef]
- OECD. OECD Economic Surveys: Spain 2018; OECD Publishing: Paris, France, 2018. [Google Scholar]
- Hollanders, H.; Celikel-Esser, F. Measuring Innovation Efficiency. 2007. Available online: https://cris.maastrichtuniversity.nl/ws/portalfiles/portal/1522179/guid-46a68016-6c74-4576-b337-e00c41715756-ASSET1.0.pdf (accessed on 23 January 2021).
- Guan, J.C.; Chen, K. Measuring the innovation production process: A crossregion empirical study of China’s high-tech innovations. Technovation 2010, 30, 348–358. [Google Scholar] [CrossRef]
- Chen, K.; Guan, J. Measuring the Efficiency of China’s Regional Innovation Systems: Application of Network Data Envelopment Analysis (DEA). Reg. Stud. 2012, 46, 355–377. [Google Scholar] [CrossRef]
- Shin, J.; Kim, C.; Yang, H. The Effect of Sustainability as Innovation Objectives on Innovation Efficiency. Sustainability 2018, 10, 1966. [Google Scholar] [CrossRef]
- INE. 2016 Innovation in Companies Survey (ICS). Available online: https://www.ine.es/prensa/eie_2016.pdf (accessed on 20 June 2019).
- Schumpeter, J.A. The Theory of Economic Development: An Inquiry into Profits, Capital, Credit, Interest and the Business Cycle; Harvard University Press: Cambridge, MA, USA, 1934. [Google Scholar]
- OECD/Eurostat. Oslo Manual 2018: Guidelines for Collecting, Reporting and Using Data on Innovation, 4th ed.; The Measurement of Scientific, Technological and Innovation Activities; OECD Publishing: Paris, France; Eurostat: Luxembourg, 2018.
- Gault, F. Defining and measuring innovation in all sectors of the economy. Res. Policy 2018, 47, 617–622. [Google Scholar] [CrossRef]
- Audretsch, D.B.; Belitski, M. The role of R & D and knowledge spillovers in innovation and productivity. Eur. Econ. Rev. 2020, 123, 103391. [Google Scholar]
- OECD. Frascati Manual 2015: Guidelines for Collecting and Reporting Data on Research and Experimental Development, The Measurement of Scientific, Technological and Innovation Activities; OECD Publishing: Paris, France, 2015. [Google Scholar]
- Dosi, G. Technological paradigms and technological trajectories: A suggested interpretation of the determinants and directions of technical change. Res. Policy 1982, 11, 147–162. [Google Scholar] [CrossRef]
- McKeown, M. The Truth about Innovation; Prentice Hall: Old Tappan, NJ, USA, 2008. [Google Scholar]
- Thomke, S. Experimentation Matters; Harvard Business School Press: Cambridge, MA, USA, 2003. [Google Scholar]
- Fagerberg, J.; Mowery, D.C.; Nelson, R.R. (Eds.) Oxford Handbook of Innovation; Oxford University Press: Oxford, UK, 2004. [Google Scholar]
- Fagerberg, J. Innovation: A guide to the literature. In Oxford Handbook of Innovation; Fagerberg, J., Mowery, D.C., Nelson, R.R., Eds.; Oxford University Press: Oxford, UK, 2004; pp. 1–26. ISBN 0-19-926455-4. [Google Scholar]
- Ebersberger, B.; Marsili, O.; Reichstein, T.; Salter, A. Into thin air: Using a quantile regression approach to explore the relationship between R&D and innovation. Int. Rev. Appl. Econ. 2010, 24, 95–102. [Google Scholar]
- Huergo, E.; Moreno, L. Does history matter for the relationship between R&D, innovation, and productivity? Ind. Corp. Chang. 2011, 20, 1335–1368. [Google Scholar]
- OECD. Science, Technolgy and Innovation Indicators in a Changing World: Responding to Policy Needs; OECD Publishing: Paris, France, 2007. [Google Scholar]
- IMF (International Monetary Fund). World Economic Outlook: Growth Slowdown, Precarious Recovery; IMF: Washington, DC, USA, 2018. [Google Scholar]
- EC (European Commission). European Innovation Scoreboard 2017 (IUSB); Publications Office of the European Union: Luxembourg, 2017. [Google Scholar]
- EC (European Commission). Commission Staff Working Document. Country Report Spain 2016; European Commission: Brussels, Belgium, 2016. [Google Scholar]
- OECD. Compendium of Productivity Indicators 2016; OECD Publishing: Paris, France, 2016. [Google Scholar]
- EC (European Commission). Commission Staff Working Document. Country Report Spain 2017; European Commission: Brussels, Belgium, 2017. [Google Scholar]
- Galende, J. La organización del proceso de innovación en la empresa española. Econ. Ind. 2008, 368, 169–185. [Google Scholar]
- Peters, B.; Hud, M.; Dachs, B.; Köhler, C. Employment effects of innovations over the business cycle: Firmlevel evidence from European countries. In ZEW Discussion Papers; Zentrum für Europäische Wirtschaftsforschung (ZEW): Mannheim, Germany, 2017; No. 16-076. [Google Scholar]
- Vivarelli, M. Innovation, employment and skills in advanced and developing countries: A survey of economic literature. J. Econ. Issues 2014, 48, 123–154. [Google Scholar] [CrossRef]
- Harrison, R.; Jaumandreu, J.; Mairesse, J.; Peters, B. Does innovation stimulate employment? A firm-level analysis using comparable micro-data from four European countries. Int. J. Ind. Organ. 2014, 35, 29–43. [Google Scholar] [CrossRef]
- Bianchini, S.; Pellegrino, G. Innovation persistence and employment dynamics. Res. Policy 2019, 48, 1171–1186. [Google Scholar] [CrossRef]
- Calvino, F. Technological innovation and the distribution of employment growth: A firm-level analysis. Ind. Corp. Chang. 2019, 28, 177–202. [Google Scholar] [CrossRef]
- Díaz, G.A.; Barge-Gil, A.; Heijs, J. The effect of innovation on skilled and unskilled workers during bad times. Struct. Chang. Econ. Dyn. 2020, 52, 141–158. [Google Scholar] [CrossRef]
- Tidd, J.; Bessant, J. Managing Innovation: Integrating Technological, Market, and Organizational Change; John Wiley and Sons: Chinchester, UK, 2009. [Google Scholar]
- Koopmans, T.C. An Analysis of Production as an Efficient Combination of Activities. In Activity Analysis of Production and Allocation; Koopmans, J., Ed.; Cowles; Commission for Research in Economics: New York, NY, USA, 1951. [Google Scholar]
- Debreu, G. The coefficient of resource utilization. Econometrica 1951, 19, 273–292. [Google Scholar] [CrossRef]
- Farrell, M.J. The Measurement of Productive Efficiency. J. R. Stat. Soc. 1957, 3, 253–290. [Google Scholar] [CrossRef]
- Carayannis, E.G.; Grigoroudis, E.; Goletsis, Y. A multilevel and multistage efficiency evaluation of innovation systems: A multiobjective DEA approach. Expert Syst. Appl. 2016, 62, 63–80. [Google Scholar] [CrossRef]
- Yesilay, R.B.; Halac, U. An Assessment of Innovation Efficiency in EECA Countries Using the DEA Method. In Contemporary Issues in Business Economics and Finance; Grima, S., Özen, E., Boz, H., Eds.; Emerald Publishing Limited: Bentley, UK, 2020. [Google Scholar]
- Kotsemir, M. Measuring National Innovation Systems Efficiency—A Review of DEA Approach; Higher School of Economics: Moscow, Russia, 2013. [Google Scholar]
- Guan, J.; Zuo, K. A cross-country comparison of innovation efficiency. Scientometrics 2014, 100, 541–575. [Google Scholar] [CrossRef]
- Leydesdorff, L.; Wagner, C.S.; Porto-Gomez, I.; Comins, J.A.; Phillips, F. Synergy in the knowledge base of US innovation systems at national, state, and regional levels: The contributions of high-tech manufacturing and knowledge-intensive services. J. Assoc. Inf. Sci. Technol. 2019, 70, 1108–1123. [Google Scholar] [CrossRef]
- Bin, G. Technology acquisition channels and industry performance: An industry-level analysis of Chinese large-and medium-size manufacturing enterprises. Res. Policy 2008, 37, 194–209. [Google Scholar] [CrossRef]
- Díaz-Blateiro, L.; Casimiro, A.; Martinez, M.; González-Pachón, J. An analysis of productive efficiency and innovation activity using DEA: An application to Spain’s wood-based industry. Forest Policy Econ. 2006, 8, 762–773. [Google Scholar] [CrossRef]
- Guan, J.C.; Yam, R.C.M.; Mok, C.K.; Ma, N. A study of the relationship between competitiveness and technological innovation capability based on DEA models. Eur. J. Oper. Res. 2006, 170, 971–986. [Google Scholar] [CrossRef]
- Hong, J.; Feng, B.; Wu, Y.; Wang, L. Do government grants promote innovation efficiency in China’s high-tech industries? Technovation 2016, 57, 4–13. [Google Scholar] [CrossRef]
- Lee, S.K.; Mogi, G.; Lee, S.K.; Hui, K.S.; Kim, J.W. Econometric analysis of the R & D performance in the national hydrogen energy technology development for measuring relative efficiency: The fuzzy AHP/DEA integrated model approach. Int. J. Hydrog. Energy 2010, 35, 2236–2246. [Google Scholar]
- Liu, X.; Wang, C. Does foreign direct investment facilitate technological progress? Evidence from Chinese industries. Res. Policy 2003, 32, 945–953. [Google Scholar] [CrossRef]
- Revilla, E.; Sarkis, J.; Modrego, A. Evaluating performance of public-private research collaborations: A DEA analysis. J. Oper. Res. Soc. 2003, 54, 165–174. [Google Scholar] [CrossRef]
- Zhang, A.; Zhang, Y.; Zhao, R. A study of the R&D efficiency and productivity of Chinese firms. J. Comp. Econ. 2003, 31, 444–464. [Google Scholar]
- Zhong, W.; Yuan, W.; Li, S.; Huang, Z. The performance evaluation of regional R&D investments in China: An application of DEA based on the first oficial economic census data. Omega 2011, 39, 447–455. [Google Scholar]
- Hashimoto, A.; Haneda, S. Measuring the change in R & D efficiency of the Japanese pharmaceutical industry. Res. Policy 2008, 37, 1829–1836. [Google Scholar]
- Buesa, M.; Heijs, J.; Baumert, T.; Gutiérrez, C. Eficiencia de los Sistemas Regionales de Innovación en España; Serie Análisis Fundación de las Cajas de Ahorro; FUNCAS: Madrid, Spain, 2015. [Google Scholar]
- Wang, E.C.; Huang, W. Relative efficiency of R & D activities: A cross-country study accounting for environmental factors in DEA approach. Res. Policy 2007, 36, 260–273. [Google Scholar]
- Guede, R.; De Vicente, M.; Manera, J.; Romero, A. Innovation Efficiency and Open Innovation: An Application to Activity Branches in Spain. In Open Innovation in Firms and Public Administrations: Technologies for Value Creation; Pablos, C., y López, D., Eds.; IGI Global: Herchey, PA, USA, 2012. [Google Scholar]
- Charnes, A.; Cooper, W.W.; Rhodes, E. Evaluating program and managerial efficiency: An application of data envelopment analysis to Program Follow Through. Manag. Sci. 1981, 27, 668–697. [Google Scholar] [CrossRef]
- Cook, W.D.; Tone, K.; Zhu, J. Data envelopment analysis: Prior to choosing a model. Omega-Int. J. Manag. Sci. 2014, 44, 1–4. [Google Scholar] [CrossRef]
- Dyson, R.G.; Allen, R.; Camanho, A.S.; Podinovski, V.V.; Sarrico, C.S.; Shale, E.A. Pitfalls and protocols in DEA. Eur. J. Oper. Res. 2001, 132, 245–259. [Google Scholar] [CrossRef]
- Banker, R.D.; Charnes, A.; Cooper, W.W.; Swarts, J.; Thomas, D. An introduction to data envelopment analysis with some of its models and their uses. Res. Gov. Nonprofit Account. 1989, 5, 125–163. [Google Scholar]
- Chiesa, V.; Fratini, F. Evaluation and Performance Measurement of Research and Development: Techniques and Perspectives for Multi-level Analysis; Edward Elgar Publishing Limited: Cheltenham, UK, 2009. [Google Scholar]
- Gao, W.; Chou, J. Innovation efficiency, global diversification: And firm value. J. Corp. Financ. 2015, 30, 278–298. [Google Scholar] [CrossRef]
- Tether, B.S. Do services innovate (differently)? Insights from the European innobarometer survey. Ind. Innov. 2005, 12, 153–184. [Google Scholar] [CrossRef]
- Cainelli, G.; Evangelista, R.; Savona, M. Innovation and economic performance in services: A firm-level analysis. Camb. J. Econ. 2006, 30, 435–458. [Google Scholar] [CrossRef]
- Hipp, C. Collaborative innovation in services. In The Handbook of Innovation and Services: A Multi-Disciplinary Perspective; Gallouj, F., Djellal, F., Eds.; Edward Elgar: Cheltenham, UK, 2010; pp. 318–341. [Google Scholar]
- Chesbrough, H.W. Bringing open innovation to services. MIT Sloan Manag. Rev. 2011, 52, 85. [Google Scholar]
- Mina, A.; Bascavusoglu-Moreau, E.; Hughes, A. Open service innovation and the firm’s search for external knowledge. Res. Policy 2014, 43, 853–866. [Google Scholar] [CrossRef]
- Yun, J.J.; Park, K.; Gaudio, G.D.; Corte, V.D. Open innovation ecosystems of restaurants: Geographical economics of successful restaurants from three cities. Eur. Plan. Stud. 2020, 28, 2348–2367. [Google Scholar] [CrossRef]
- Hameed, W.U.; Nisar, Q.A.; Wu, H.C. Relationships between external knowledge, internal innovation, firms’ open innovation performance, service innovation and business performance in the Pakistani hotel industry. Int. J. Hosp. Manag. 2021, 92, 102745. [Google Scholar] [CrossRef]
- Yun, J.J.; Zhao, X.; Jung, K.; Yigitcanlar, T. The Culture for Open Innovation Dynamics. Sustainability 2020, 12, 5076. [Google Scholar] [CrossRef]
- Yun, J.J.; Park, K.; Im, C.; Shin, C.; Zhao, X. Dynamics of social enterprises—Shift from social innovation to open innovation. Sci. Technol. Soc. 2017, 22, 425–439. [Google Scholar] [CrossRef]
- Yun, J.J.; Egbetoku, A.A.; Zhao, X. How does a social open innovation succeed? Learning from Burro battery and grassroots innovation festival of India. Sci. Technol. Soc. 2019, 24, 122–143. [Google Scholar] [CrossRef]
- Edquist, C.; Zabala-Iturriagagoitia, J.M.; Barbero, J.; Zofío, J.L. On the meaning of innovation performance: Is the synthetic indicator of the Innovation Union Scoreboard flawed? Res. Eval. 2018, 27, 196–211. [Google Scholar] [CrossRef]
- Greco, M.; Grimaldi, M.; Cricelli, L. Hitting the nail on the head: Exploring the relationship between public subsidies and open innovation efficiency. Technol. Forecast. Soc. Chang. 2017, 118, 213–225. [Google Scholar] [CrossRef]
- Chesbrough, H.W. Open Innovation: The New Imperative for Creating and Profiting from Technology; Harvard Business Press: Massachusetts, MA, USA, 2003. [Google Scholar]
- Chiang, Y.H.; Hung, K.P. Exploring open search strategies and perceived innovation performance from the perspective of inter-organizational knowledge flows. R&D Manag. 2010, 40, 292–299. [Google Scholar]
- Greco, M.; Grimaldi, M.; Cricelli, L. Open innovation actions and innovation performance. Eur. J. Innov. Manag. 2015, 18, 150–171. [Google Scholar] [CrossRef]


Publisher’s Note: MDPI stays neutral with regard to jurisdictional claims in published maps and institutional affiliations. |
© 2021 by the authors. Licensee MDPI, Basel, Switzerland. This article is an open access article distributed under the terms and conditions of the Creative Commons Attribution (CC BY) license (http://creativecommons.org/licenses/by/4.0/).