Article

Digitalization of Small and Medium-Sized Enterprises and Economic Growth: Evidence for the EU-27 Countries

by
Jarosław Brodny
1,* and
Magdalena Tutak
2,*
1
Faculty of Organization and Management, Silesian University of Technology, 44-100 Gliwice, Poland
2
Faculty of Mining, Safety Engineering and Industrial Automation, Silesian University of Technology, 44-100 Gliwice, Poland
*
Authors to whom correspondence should be addressed.
J. Open Innov. Technol. Mark. Complex. 2022, 8(2), 67; https://doi.org/10.3390/joitmc8020067
Submission received: 4 March 2022 / Revised: 16 March 2022 / Accepted: 26 March 2022 / Published: 1 April 2022

Abstract

:
Successful implementation of digital solutions in a given region or country significantly depends on the implementation of this process by Small and Medium-Sized Enterprises (SMEs). This problem is very well understood in the European Union, where actions are being taken to accelerate this process and build a sustainable and competitive knowledge-based economy. This article addresses this issue by conducting a study of the digital maturity of SMEs among the EU-27 countries. The aim of the study was to determine the level of digital maturity of SMEs in the EU-27 countries as well as whether and how the economic parameters of individual EU countries affect the process of SME digitalization. The adopted objectives determined the developed research methodology and the applied methods. The research was based on data from the Eurostat database, on the basis of which 11 indicators characterizing technologies and digital solutions identified with the Industry 4.0 concept were specified and adopted for the study. The entropy-based Evaluation based on distance from average solution (EDAS) method was used to assess the EU countries in terms of the level of digital maturity of SMEs, and the Principal Component Analysis (PCA) method was used to analyze similarities between these countries in terms of technologies implemented in SMEs. On the other hand, to determine a relationship between the digital maturity index (digitalization) and the basic economic parameters of the economy, two nonparametric tests (Spearman and Tau Kendall) were utilized. Based on the determined digital maturity index, the EU-27 countries were evaluated in terms of the level of digital maturity of SMEs, dividing them into four groups. The results showed large discrepancies between individual EU-27 countries and between the old (EU-14) and the new (EU-13) EU countries in terms of SMEs digitalization. These results should be widely used to develop a digitalization strategy for the EU economy and policies to improve the degree of digitalization, especially in countries lagging in this area. The universality of the developed methodology creates wide opportunities for its use to study other countries and regions worldwide.

1. Introduction

The dynamic development of information and communication technology (ICT) has caused huge changes in the global economy [1,2]. The development of networks, the Internet, and the increasingly widespread use of digital solutions have led to enormous changes in almost all areas of life. The pandemic caused by the SARS CoV-2 coronavirus, which has been ongoing since the beginning of 2020, has further accelerated these changes [3]. Synonymous with them is the concept of Industry 4.0, which first appeared at the Hannover Fair in 2011 [4,5].
Currently, digital technologies are increasingly being used in production and service processes, where they are becoming synonymous with modernity and innovation. Therefore, innovations related to the digitalization and implementation of the Industry 4.0 concept are becoming a driver of economic growth for many companies, countries, and regions worldwide [6]. Companies using these technologies and related solutions are becoming both more competitive and innovative. Thus, to effectively conduct their business, these companies must adapt to the changes occurring in the market. While this process, due to financial and human resources, is easier for large companies, it can be a serious problem for small and medium-sized enterprises (SMEs) [7]. Their smaller potential and investment opportunities make the introduction of modern, and thus expensive, technologies and solutions—requiring high-class specialists—an uneasy process. However, the role and significance of SMEs in the global economy make the problem of their adjustment to the changes taking place very serious, and, in many cases, even key for the economic and social development of particular countries and regions [8].
Micro, small, and medium enterprises are the basis of the economy of many countries and regions, including the European Union (EU), where they comprise as much as 99% of all enterprises. They employ about 100 million employees and are responsible for generating over half of the European GDP (European Commission—Entrepreneurship and small and medium-sized enterprises (SMEs)). They also play a key role in the production of gross value added in virtually every sector of the EU economy. Therefore, it can be concluded that SMEs are also an indispensable and key link of the EU economy, both because of their huge share in GDP and as one of the largest employers in the market [9].
In the context of the digital transformation related to the Industry 4.0 concept, given the position of SMEs in the EU, the process of adapting this group of companies to the ongoing economic changes is of key importance for the further development of the region. On the one hand, this process is a great opportunity for the development of these companies and the entire EU economy, and on the other hand, it is a big organizational, social, and economic challenge. It is obvious that the digitalization of economy and the implementation of Industry 4.0 are also associated with many risks and problems. As for the EU, this process is additionally complicated due to fragmentation (27 countries) and thus different levels of their development.
Despite these issues, the EU is very determined to promote and encourage SMEs to introduce solutions based on new digital technologies. This process is also very important for large companies which cooperate with SMEs to a large extent. The globalization of the economy also makes it more efficient in the supply chain, especially in the medium and long term, to work with companies adapted to the digital economy.
Therefore, it is in the interest of individual countries, regions, and large companies and corporations, as well as local societies and SMEs themselves, to adapt as quickly as possible to the changes associated with the development of new technologies and the digitalization of the economy. In the case of SMEs, due to limited personal and financial resources, e.g., in relation to large enterprises, this process is significantly hindered. However, it is clear that the future of SMEs, which are the main contributors to most industries and countries [10], depends largely on their ability to respond effectively to customer expectations while maintaining a competitive advantage in their market, which their digitalization can largely guarantee [11]. This implies the need to adapt to current trends and to also continuously improve management processes, such as planning, resource utilization, controlling production/services, and evaluating operational performance.
On the other hand, as the authors of several papers (e.g., [12,13,14]) indicate, the implementation of Industry 4.0 brings great opportunities for sustainable development and increase in production efficiency by up to about one third. Therefore, this growth, and, consequently, the possibility of acquiring new customers and markets, the development of staff, and many other benefits make the implementation of new technologies in the group of SMEs both a necessity and an opportunity for their development, including the whole world economy.
This problem is well understood in the EU, where the importance of SMEs for the construction of a single digital market has now become one of the key areas of development in the region. The EU is constantly expanding its legal and financial support for the development of business activities in this respect. In the last ten years, many documents related to the digitalization of the EU economy have been adopted. Some of the very important documents include “A Digital Agenda for Europe” [15], “European Broadband: Investing in Digitally Driven Growth” [16], “Towards a Thriving Data-Driven Economy” [17], “The EU’s New Digital Single Market Strategy” [18], “Building a European Data Economy” [19], “Information Society” [20], “Age of Artificial Intelligence: Towards a European Strategy for Human-Centric Machines” [21], and the most recent one, “The Digital Europe Programme” (DIGITAL) [22]. The budget of The Digital Europe Programme is around EUR 8.1 billion. It is part of the EU budget for 2021–2027 and aims to financially support the digital transformation of European economies and societies. It is designed to develop and financially support UE-27 countries in key areas: supercomputing, artificial intelligence (AI), cybersecurity, advanced digital skills, and the use of digital technologies in the economy.
Large financial outlays that are, and will be, allocated to the digital development of SMEs make it necessary to develop appropriate rules for their distribution, taking into account the different levels of economic development of individual countries and their economic and scientific potential. An important element is also the ongoing assessment of the state of digital maturity and the effectiveness of existing policies in this area. It is important that EU funds are optimally invested and support the digitalization processes of countries and enterprises that experience certain problems and can make full use of them.
SMEs are one of the main beneficiaries of the EU’s digitalization support policy. In order to achieve the expected results, it is necessary to assess the level of digital maturity of this group of enterprises in individual EU-27 countries. The results of such an assessment should be used to develop guidelines for the targeting of financial support in terms of countries, groups of enterprises, and specific projects. It also seems reasonable to cooperate between companies from different countries and to exchange good practices in this area.
Publications on the digitalization and implementation of the Industry 4.0 concept in SMEs among the EU-27 countries cover many problems related to it. They are mainly devoted to the analysis of the impact of investment in new technologies on the financial performance of this group of companies [23] and the identification of determinants and barriers in the implementation of digital technologies [24,25,26].
However, there are no studies devoted to the assessment and comparison of the level of digital maturity of SMEs in all EU-27 countries and the impact of the economies of these countries on the level of digitalization of this group of companies. There are only works devoted to single countries, such as the Czech Republic [27] or Bulgaria [28]. This problem is slightly more extensively presented only in one study [29], which assesses the level of the EU countries in terms of digital readiness of manufacturing enterprises.
The conducted analysis proves that at this stage, there are no studies and, consequently, knowledge in terms of assessing the level of digital maturity of SMEs in the countries of the entire European community. Undoubtedly, such a study could be used to develop comprehensive solutions to accelerate the implementation of the digitalization process in this group of companies. Therefore, it can be concluded that there is a research gap in the assessment of digital maturity of SMEs in the EU-27, which this paper attempts to fill by conducting an extensive study of the cumulative and multidimensional knowledge of digital maturity of this group of enterprises.
For this purpose, methodology was developed and a study was carried out to assess the digital maturity of SMEs in the EU-27. The results obtained should significantly enrich the knowledge of the assessment of the state of use of digital technologies and solutions in SMEs in the countries under study.
The presented research problem led the authors to formulate the following research questions, which clarify and order the subject and scope of research as well as enable the analysis of results, formulation of final conclusions, and limitations and directions for future research:
(1)
What is the level of digital maturity of SMEs among the EU-27 countries?
(2)
What are similarities between the EU-27 countries in terms of digital technologies implemented in SMEs?
(3)
Do the economic parameters of the EU-27 economies affect the state of digitalization (which is measured by the value of the digitalization index) in these countries?
In order to answer the questions posed, research was conducted using data from the Eurostat database and a number of methods and analytical tools. The assessment of the level of the EU countries in terms of digital maturity of SMEs was made using the entropy- evaluation based on the distance from average solution (EDAS) method. The analysis of similarities between these countries in terms of implemented digital technologies in companies was performed using the method of principal components analysis (PCA). To assess the relationship between the digital maturity index (determined by the entropy-EDAS method) and the basic economic parameters of the economies of each country, two nonparametric tests were used, based on which the Spearman’s rank correlation coefficients and the Kendall’s tau coefficients were determined.
In relation to the existing studies, the presented work is characterized by a new approach to the studied problem in three areas. First, no assessment of the EU-27 countries in terms of the digital maturity of SMEs has been conducted so far. Such an assessment, as already mentioned, is extremely important for the diagnosis of the current state and the development of a digitalization strategy for the EU-27 countries. Secondly, there is also no research that would indicate which digital technology solutions (related to the Industry 4.0 concept) are used in SMEs in the EU-27 countries and which countries show the greatest similarity in this regard. Third, the existing literature still lacks studies that would indicate whether and how the economic parameters of individual countries are related to the process of digitalization of SMEs in these countries.
This research can also be taken as part of the monitoring of innovation and areas around innovation in SMEs in the EU-27, divided into the EU-14 (old EU countries) and the EU-13 (new EU countries), which is also a new approach to the problem of studying the digital maturity of individual countries.

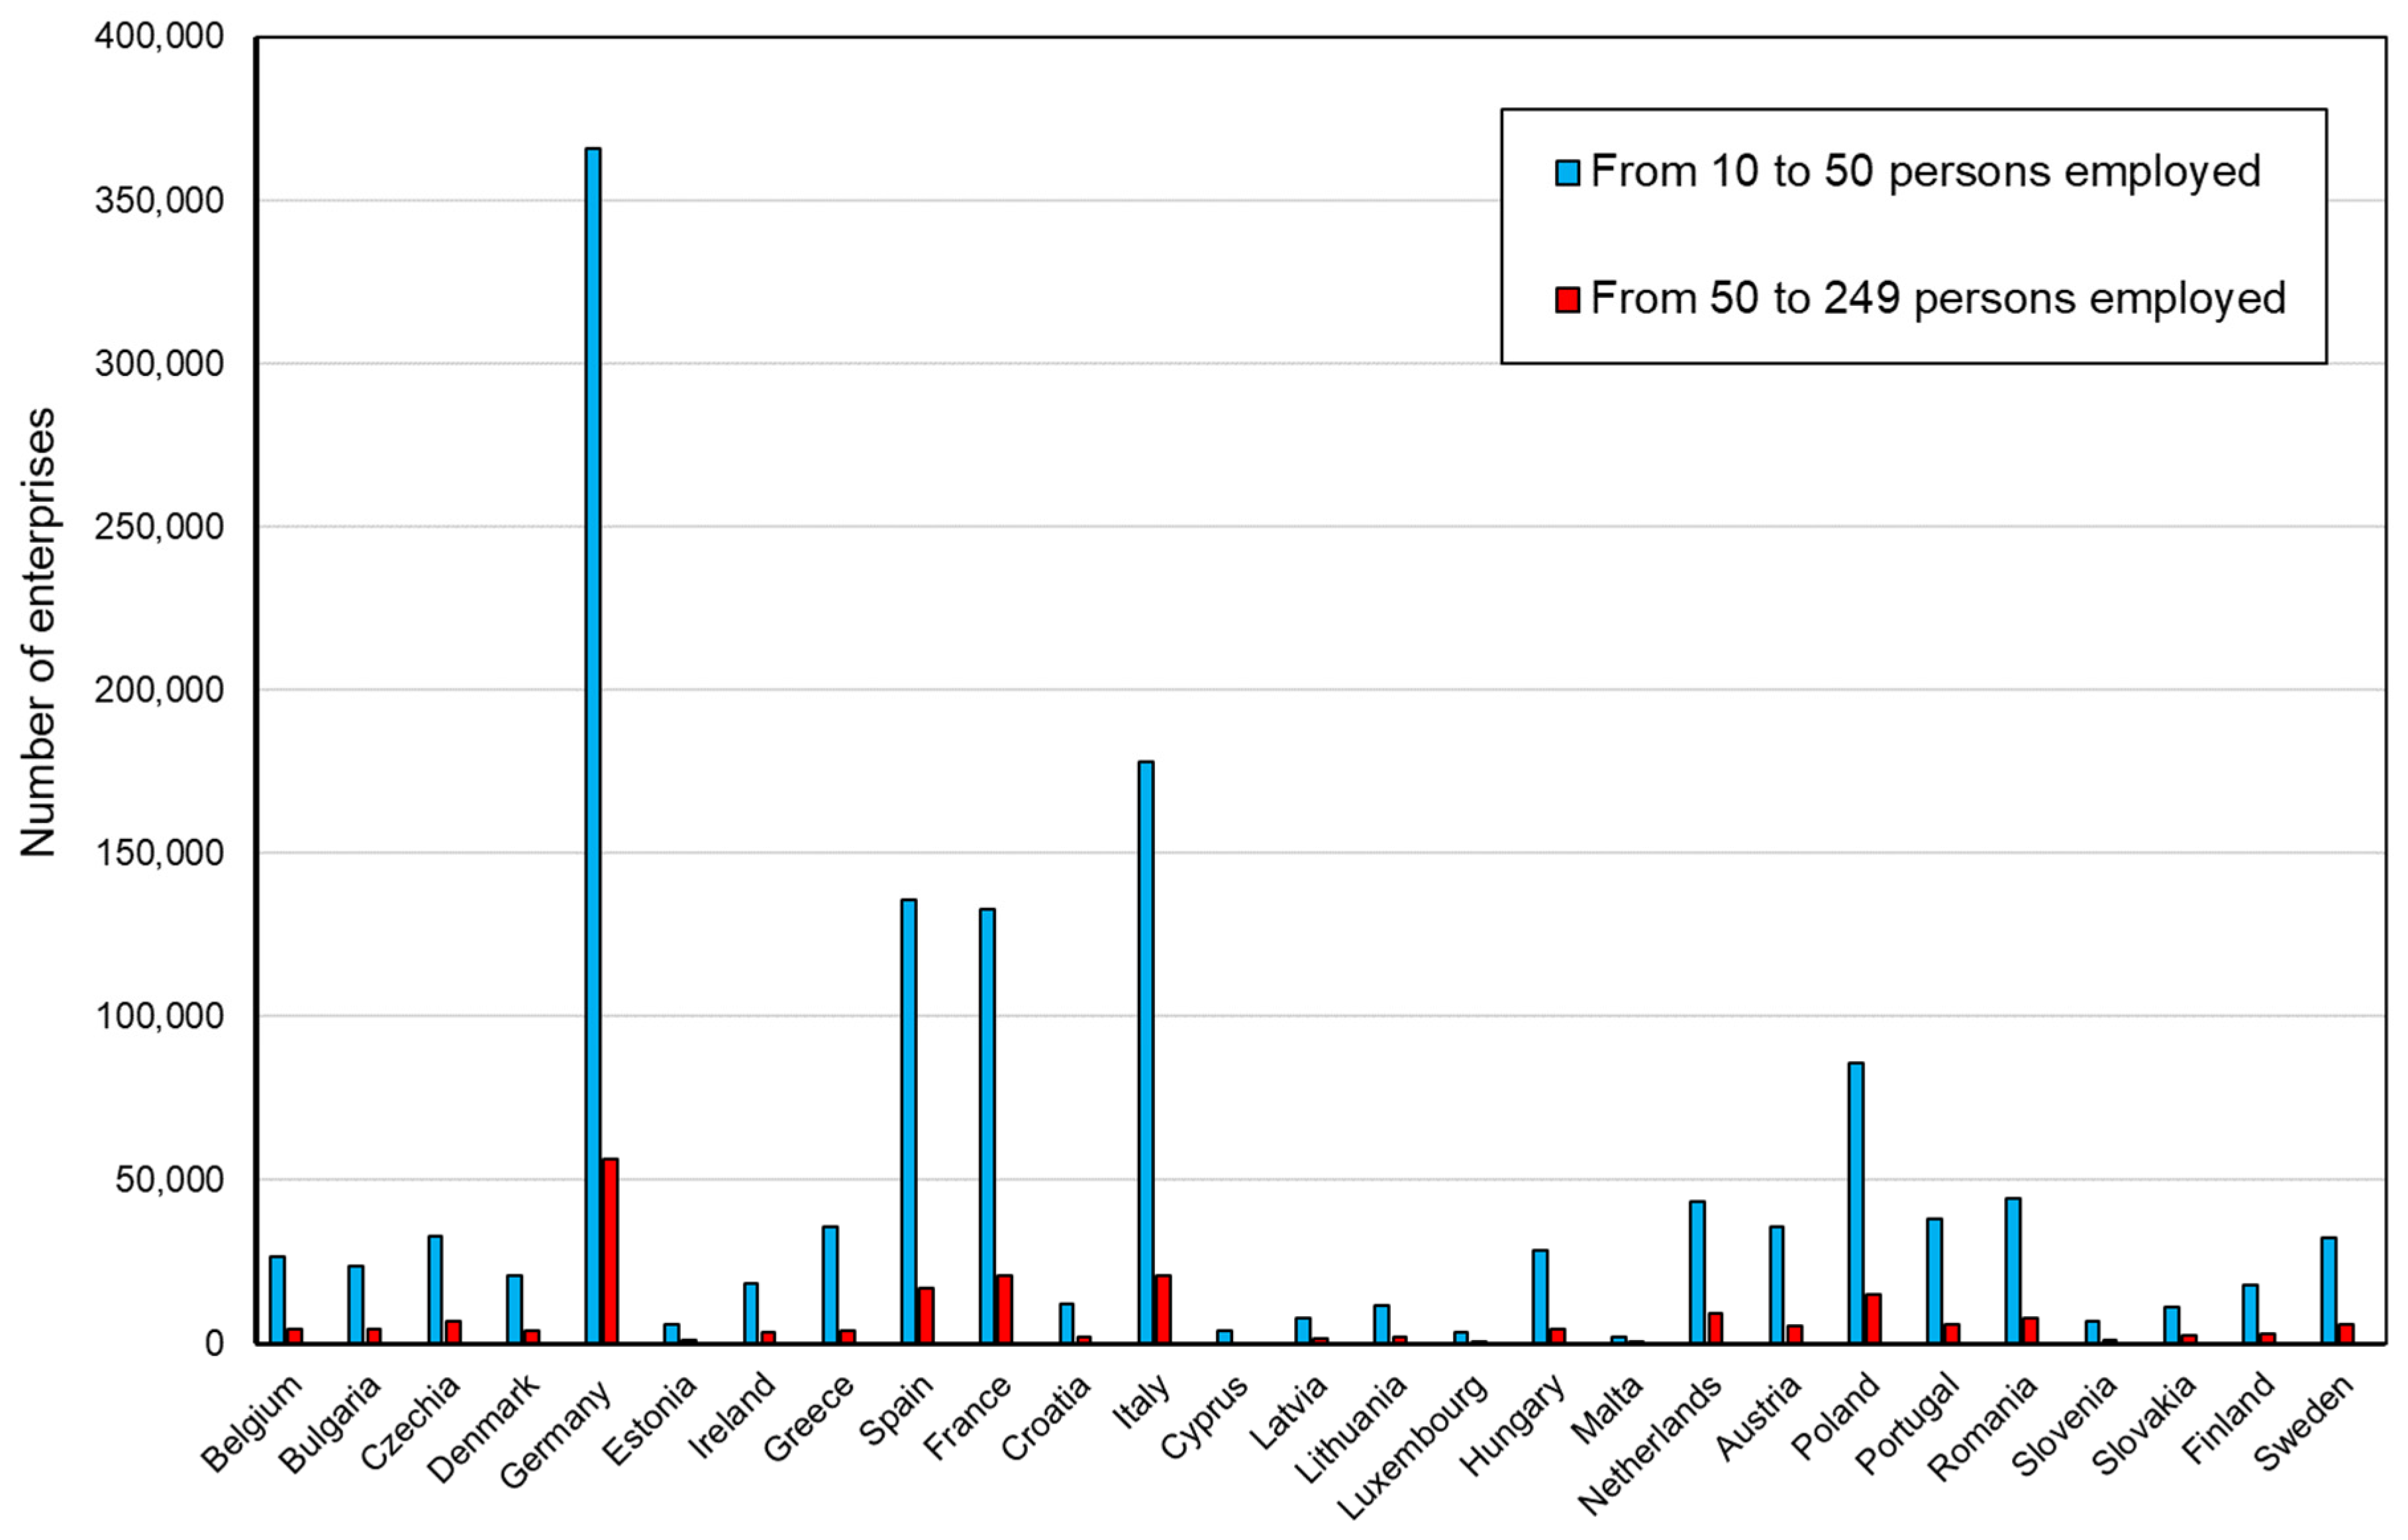
2. The Role and Significance of SMEs in the EU

According to the European Commission Recommendation 2003/361 [30], small and medium-sized enterprises (SMEs) are defined as enterprises with a number of employees and profits within certain limits:
A medium-sized enterprise has up to 250 employees (and not more than 10), a turnover of up to EUR 50 million, or a balance sheet total of up to EUR 43 million.
A small enterprise has between 10 and 50 employees and a turnover or balance sheet total up to EUR 10 million.
Micro enterprises are also identified, which have up to 9 employees and a turnover or balance sheet total of up to EUR 2 million.
Therefore, the entire group of SMEs is made up of enterprises that have between 10 and 250 employees and an annual turnover of less than EUR 50 million and/or an annual balance sheet total of less than EUR 43 million [31]. For several years, the number of SMEs in the EU-27 has been increasing. Per every three jobs in the EU-27, as many as two are generated by this group of enterprises. Therefore, these enterprises are a key element of the EU-27 economy.
According to one report [32], in 2020 there were just over 22 million micro, small, and medium-sized enterprises (all SMEs) in the EU-27, which accounted for as high as 99.8% of all enterprises in the non-financial business sector (NFBS). Of these, as high as 93% were micro-enterprises, while about 1.3 million were small enterprises with 10 to 49 employees and about 200,000 were medium-sized enterprises with 50 to 249 employees. Moreover, 53% of the total value added in the EU-27 was generated by this group of NFBS enterprises, which employed 65% of the employees from the total NFBS in the EU-27. The number of SMEs in EU-27 countries is presented in Figure 1.
Therefore, all SMEs are an important part of the overall European economy. However, the diversity of the EU means that their importance and their role and share in the economies of individual countries varies considerably. Across the EU-27, the average value of SMEs’ contribution to GDP is around 56%. However, in Malta, this share is as high as 93.1%, and in Germany—82% of GDP. Altogether, in the EU-27, all SMEs employ about 84 million people. In Europe’s largest economy, Germany, nearly 18.5 million people work in these enterprises, of which more than 6.8 million are employed in small businesses.
These data show that almost 1.5 million enterprises in the EU-27 are small and medium-sized enterprises (SMEs), which account for more than 6.6% of the total number of companies in the EU-27. These enterprises employ more than 45 million workers, which accounts for 35.9% of all employed in the EU-27 and produce 34.3% of the value added in the entire EU-27.
When analyzing the data presented, it can be concluded that the group of SMEs has a major impact on the overall well-being and performance of the EU economy. Therefore, it is not surprising that the European community is very concerned about the development of this group of enterprises. Currently, the main objectives of the EU in relation to SMEs are to introduce digital solutions related to the Industry 4.0 concept as soon as possible in these enterprises. It has become the basis for the EU’s operational activities to improve the level of digitalization while maintaining the principles of sustainable development, including economic, environmental, and social factors, as well as reducing regulatory burdens and improving access to free market and sources of financing in relation to these enterprises [33].
The role and importance of SMEs in the EU and the global economy in general is very large and growing, which makes the assessment of the digital maturity of this group of companies in the EU countries fully justified and concerns a current and important problem.

3. Literature Review

3.1. Industry 4.0 in SMEs

The digitalization and implementation of solutions related to Industry 4.0 in SMEs are discussed by many authors, as evidenced by a large number of publications devoted to this subject (Figure 2). In order to analyze them, a synthetic review was conducted in accordance with the general principles of systematic review [34]. The SCOPUS database was used to search for phrases “Industry 4.0” and “SMEs” used in the titles, abstracts, and keywords of the publications included in this database (in journals, conference materials, books, and their chapters).
The total number of identified papers was 609 (as of 2 January 2022). The first work indexed in this database combining the concepts of Industry 4.0 and SMEs comes from 2014 and concerns technical requirements for efficient networking of companies in complex logistics and production systems of SMEs [35]. Since then, the number of publications on this topic has been growing, especially since 2016 (Figure 2). These publications address various research problems, including the implementation of Industry 4.0 solutions [36,37,38], sustainability and the Industry 4.0 concept [13,39], digital factories, business models, Industry 4.0-related technologies (IoT, AI, cloud computing, big data), digital readiness, and maturity assessment [24,40,41]. A summary of the most frequently cited keywords by the authors of these publications, in the form of a cloud, is shown in Figure 3.
Many publications from this group also deal with the discrepancy between the concept of Industry 4.0 and the actual needs of SMEs and the barriers associated with the digitalization process in this group of companies [42,43,44,45]. With regard to the studies dedicated to the problem of digital readiness and maturity, the analysis identified a total of 11 such works. Their titles, abstracts, or keywords contained the following phrases: “Industry 4.0” and “SMEs” and “digital readiness” or “Industry 4.0” and “SMEs” and “digital maturity”. The issue of digital readiness of SMEs was addressed in five papers [45,46,47,48,49], and digital maturity in six papers [50,51,52,53,54,55].
The work of Genest and Gamache [47] identifies the conditions necessary to prepare SME manufacturing companies for the digital revolution. A review of these conditions indicates that, as a first step, appropriate business practices must be emplaced to improve manufacturing agility. The second important factor is the company’s access to data on production parameters (preferably in real time), as only this will enable the implementation of appropriate technological solutions of Industry 4.0. However, this process requires a company to have a high-speed Internet connection. A very important factor identified in this work is also the need for staff training. The factors identified in this study, in particular appropriate infrastructure and staff competence, are necessary for the process of digitalization, i.e., the implementation of Industry 4.0 solutions. In turn, Pirola et al. [49] proposed a comprehensive model for assessing the digital readiness of SMEs in Italy. The authors conducted research using the developed model in 20 companies. The model allowed the assessment of the digital maturity of enterprises in four dimensions: strategy, people, processes, and technology integration. The adopted dimensions are a valuable achievement of this publication, although it covered a relatively small number of companies. In turn, Brozzi et al. [46] presented methodology for self-assessment of SMEs in terms of the level of digital readiness, which can be low, medium, or high. The method is based on a set of key readiness indicators (KRI) in terms of strategy, technology requirements, awareness of digital trends, and employee competencies. In addition, relying on a broad set of KRI indicators is a significant advantage. Cuhna and Sousa [56] discuss the need for a reconceptualization of Industry 4.0 adapted to the needs of SMEs. The authors point out the lack of skilled personnel and understanding of Industry 4.0 concepts in SMEs, which hinders the digital transformation of this group of companies. A valuable achievement of this work is the identification of very specific barriers related to the implementation of Industry 4.0 concepts in SMEs. Lassnig et al. [48] conducted a study to discuss the differences between SMEs and large companies in terms of digital readiness. The results of the study showed that large companies have a dedicated person or department responsible for the Industry 4.0 strategy, while SMEs are flexible in this regard—it is usually the CEO or management that holds responsibility. The results of this research also indicate that employees in SMEs are less aware of the opportunities and risks associated with digitalization and are less prepared to implement this strategy than employees in large companies. This work shows that SMEs are significantly less prepared to implement Industry 4.0 concepts than large enterprises.
In terms of assessing the digital maturity of enterprises, Cognet et al. [52] presented a framework of two models to assess this maturity: the IMPULS and PwC models. These assessments include several steps and provide a valuable proposal to compare different research methods. On the other hand, Sassanelli et al. [54] presented an ecosystem–technology–business–skills–data (ETBSD) reference model that DIHs can use to configure their service portfolios that include new technology and business capabilities of SMEs. By contrast, Garzoni et al. [53] presented the results of their analysis on the impact of new technologies on business process changes in SMEs. The authors presented four main factors underlying the digital maturity of SMEs (digital awareness, digital requirement, digital collaboration, and digital transformation).
The presented works indicate a very different approach to assessing the digital maturity of SMEs and studying the possibility of implementing Industry 4.0 solutions in this group of enterprises. However, they lack comprehensive research results for a larger group of countries, which is undoubtedly the EU-27.

3.2. Models Used to Assess the Digital Maturity and Readiness of Enterprises

Models used to assess the level of digital readiness and maturity generally consist of a set of dimensions and criteria. In these models, based on the analysis of certain indicators, the level of the studied organization, process, country, etc., can be evaluated. In recent years, more than a dozen such models have been developed to assess the digital maturity of enterprises. The range of factors taken into account in these models varies greatly and depends on their authors or on the area that was evaluated. Table 1 summarizes the most relevant models.
The models presented in Table 1 are characterized by a wide variety of approaches to analyze the digital maturity/readiness of enterprises. The complexity of this problem means that many factors are taken into account in this assessment and different sets of levels are used to classify the degree of this maturity. However, the analysis of these models makes it possible to select a group of factors that can be assumed to be the most relevant and for which there are reliable and available data. However, there is an apparent lack of solutions that cover the assessment of digital maturity of a group of companies (such as SMEs) in a multi-country region (such as the EU-27). The lack of such a solution justifies addressing this problem in this paper.

3.3. Open Innovation Dynamics in the Context of Industry 4.0 and SME’s

The implementation and use of modern and digital technologies in SMEs is a great challenge for these companies. It is mainly connected with their limited resources and access to new innovative solutions. A great chance to solve this problem has been created by the concept of open innovation (OI) dynamics. The openness of this concept in terms of exchanging ideas and solutions between different units creates a possibility for SMEs to obtain needed solutions and to make their own solutions available. This approach provides opportunities for companies with limited resources to cooperate with external institutions in order to acquire and implement technological innovations, including digital ones [41,42,43,44,45,46,47,48,49,50,51,52,53,54,55,56,57,58,59,60,61,62,63,64,65,66,67,68,69,70,71,72,73,74]. It is obvious that the development of innovative solutions in the field of digitalization requires significant investment, appropriate staff, and time, which may prove to be difficult to overcome for SMEs [75,76]. In addition, the process of implementation of these solutions can be quite a challenge for the enterprises in question [11].
This has been confirmed by several studies [77,78,79], which show that SMEs, having fewer resources, encounter a number of difficulties in the process of digital transformation. Therefore, for this group of companies, the IO concept is particularly relevant as it enables them to use the knowledge of technology providers and other entities, including scientific units, to modernize their production and service processes [79,80]. This also applies to SMEs operating in industries with a low degree of innovation. They should especially quickly change their business model to a more open and thus modern one [81].
In conclusion, for SMEs implementing Industry 4.0 solutions, the concept of open innovation dynamics is a great opportunity to transform their business.

4. Materials and Methods

4.1. Data

In order to assess the level of digital maturity in SMEs among the EU-27 countries, as well as to identify similar countries in terms of implemented technologies related to the digitalization of enterprises, the latest data from the Eurostat were used [82]. The data indexed in this database refer to ICT usage and e-commerce across Europe, including the EU-27 countries. The data are related to the size of enterprises and are classified by type of activity in accordance with NACE Rev. 2.
Based on the literature review and the availability and completeness of data indexed in the Eurostat database, a set of 11 indicators characterizing digital maturity was identified and used in the research. These indicators define the percentage of SMEs that use given solutions and digital technologies related to Industry 4.0 and digital skills (big data analysis, artificial intelligence, Internet of Things, cloud computing, 3D printing, cybersecurity, robotics, horizontal and vertical integration) in a given country. The indicators adopted for the evaluation, along with their designation and description, are presented in Table 2.

4.2. Methods

The conducted research was divided into two stages: preliminary and fundamental. For the preliminary research, the methods of descriptive statistics were used, and for the fundamental research—the principal component analysis (PCA) method and the entropy-EDAS method from the group of multiple-criteria decision-making (MCDM) methods.
The preliminary research involved the determination of basic descriptive statistics of the indicators adopted for the study, and their purpose was to obtain information on their statistical properties. The aim of applying the PCA method was to determine the structure and general regularities adopted for the analysis of indicators in each of the studied countries. In turn, the application of the entropy-EDAS method was aimed at creating a ranking of the EU-27 countries in terms of their SME digital maturity. Then, based on the values of the digital maturity index, the level of digital maturity of SMEs in individual EU-27 countries was evaluated.
In the last stage, the study of the relationship between the digital maturity index of SMEs, determined for individual EU-27 countries, and the basic economic parameters of these countries was conducted. This subsection discusses the research methods used in the study.

4.2.1. The PCA Method

The idea of the PCA method is to reduce a large number of mutually correlated primary variables (11 indicators) to a few uncorrelated factors (principal components) that retain as much of the information about the phenomenon under study (contained in the primary variables) as possible. The observable input variables are transformed into new unobservable variables, which are called principal components (they are linear combinations of the primary variables). The principal components are ordered so that their variances become smaller and smaller. Since the new variables are uncorrelated, the sum of their variances is equal to the sum of the variances of the original variables, and as a result, the transformation of the variables does not lead to a loss of information about the phenomenon under study. Most frequently, the first 2–3 principal components contain the vast majority of information contained in the original collection of input variables.
In the PCA method, data X, with m objects and n variables, is represented as the product of two new matrices T (m × f) and P (n × f), where fn, which contain the coordinates of objects and parameters on the directions maximizing the variance description of the data. The number of columns of the matrix with a dimension T × P depends on the order of the matrix X, which is at most equal to its mathematical order. The PCA model can be described by the following general equation [83]:
X [ m , n ] = T [ m , f ] P [ f , n ] T + E [ m , n ]
where E is the matrix of residuals from the PCA model with f number of main factors.
The columns of the matrix T and P contain the coordinates of the objects and parameters on the new latent variables, called main factors. The main factors are iteratively constructed to maximize the description of the variance in the data. Each successive main factor describes the variance of the data unexplained by the previous factors, making its contribution to the description of the total variance of the data smaller. The T columns are orthogonal, and the P columns are orthonormal. This means that they have unit length and are orthogonal.
For each main factor, there is a so-called eigenvalue (vi). It is determined as the sum of the squares of the score values for the i-th main factor. The eigenvalues quantify the variance of the data described by subsequent factors. The percentage of the total variance of the data, I, is described by f of consecutive main factors and can be determined from Equation (2):
I = i = 1 f v i i = 1 m j = 1 n x i j 2 × 100 %
where xij means the individual elements of the centered matrix X.

4.2.2. The EDAS Method

The evaluation based on distance from average solution (EDAS) method was developed by Keshavarz Ghorabaee, Zavadskas, Olfat, and Turskis [84]. The algorithm for solving a decision problem with m number of alternatives and n number of criteria in the EDAS method consists of the following steps:
  • To construct a decision matrix with m number of alternatives and n number of criteria:
    X = [ x i j ] n × m = [ x 11 x 1 m x n 1 x n m ]
  • To determine an average solution for all criteria:
    A V = [ A V j ] 1 × m
    A V j = i = 1 n x i j n
  • To calculate, for each alternative, the PDA matrix (positive distance from the mean solution) and the NDA matrix (negative distance):
    P D A = [ P D A i j ] n × m
    N D A = [ N D A i j ] n × m
    where for stimulants:
    P D A i j = m a x ( 0 , ( x i j A V j ) ) A V j
    N D A i j = m a x ( 0 , ( A V j x i j ) ) A V j
    and for destimulants:
    P D A i j = m a x ( 0 , ( A V j x i j ) ) A V j
    N D A i j = m a x ( 0 , ( x i j A V j ) ) A V j
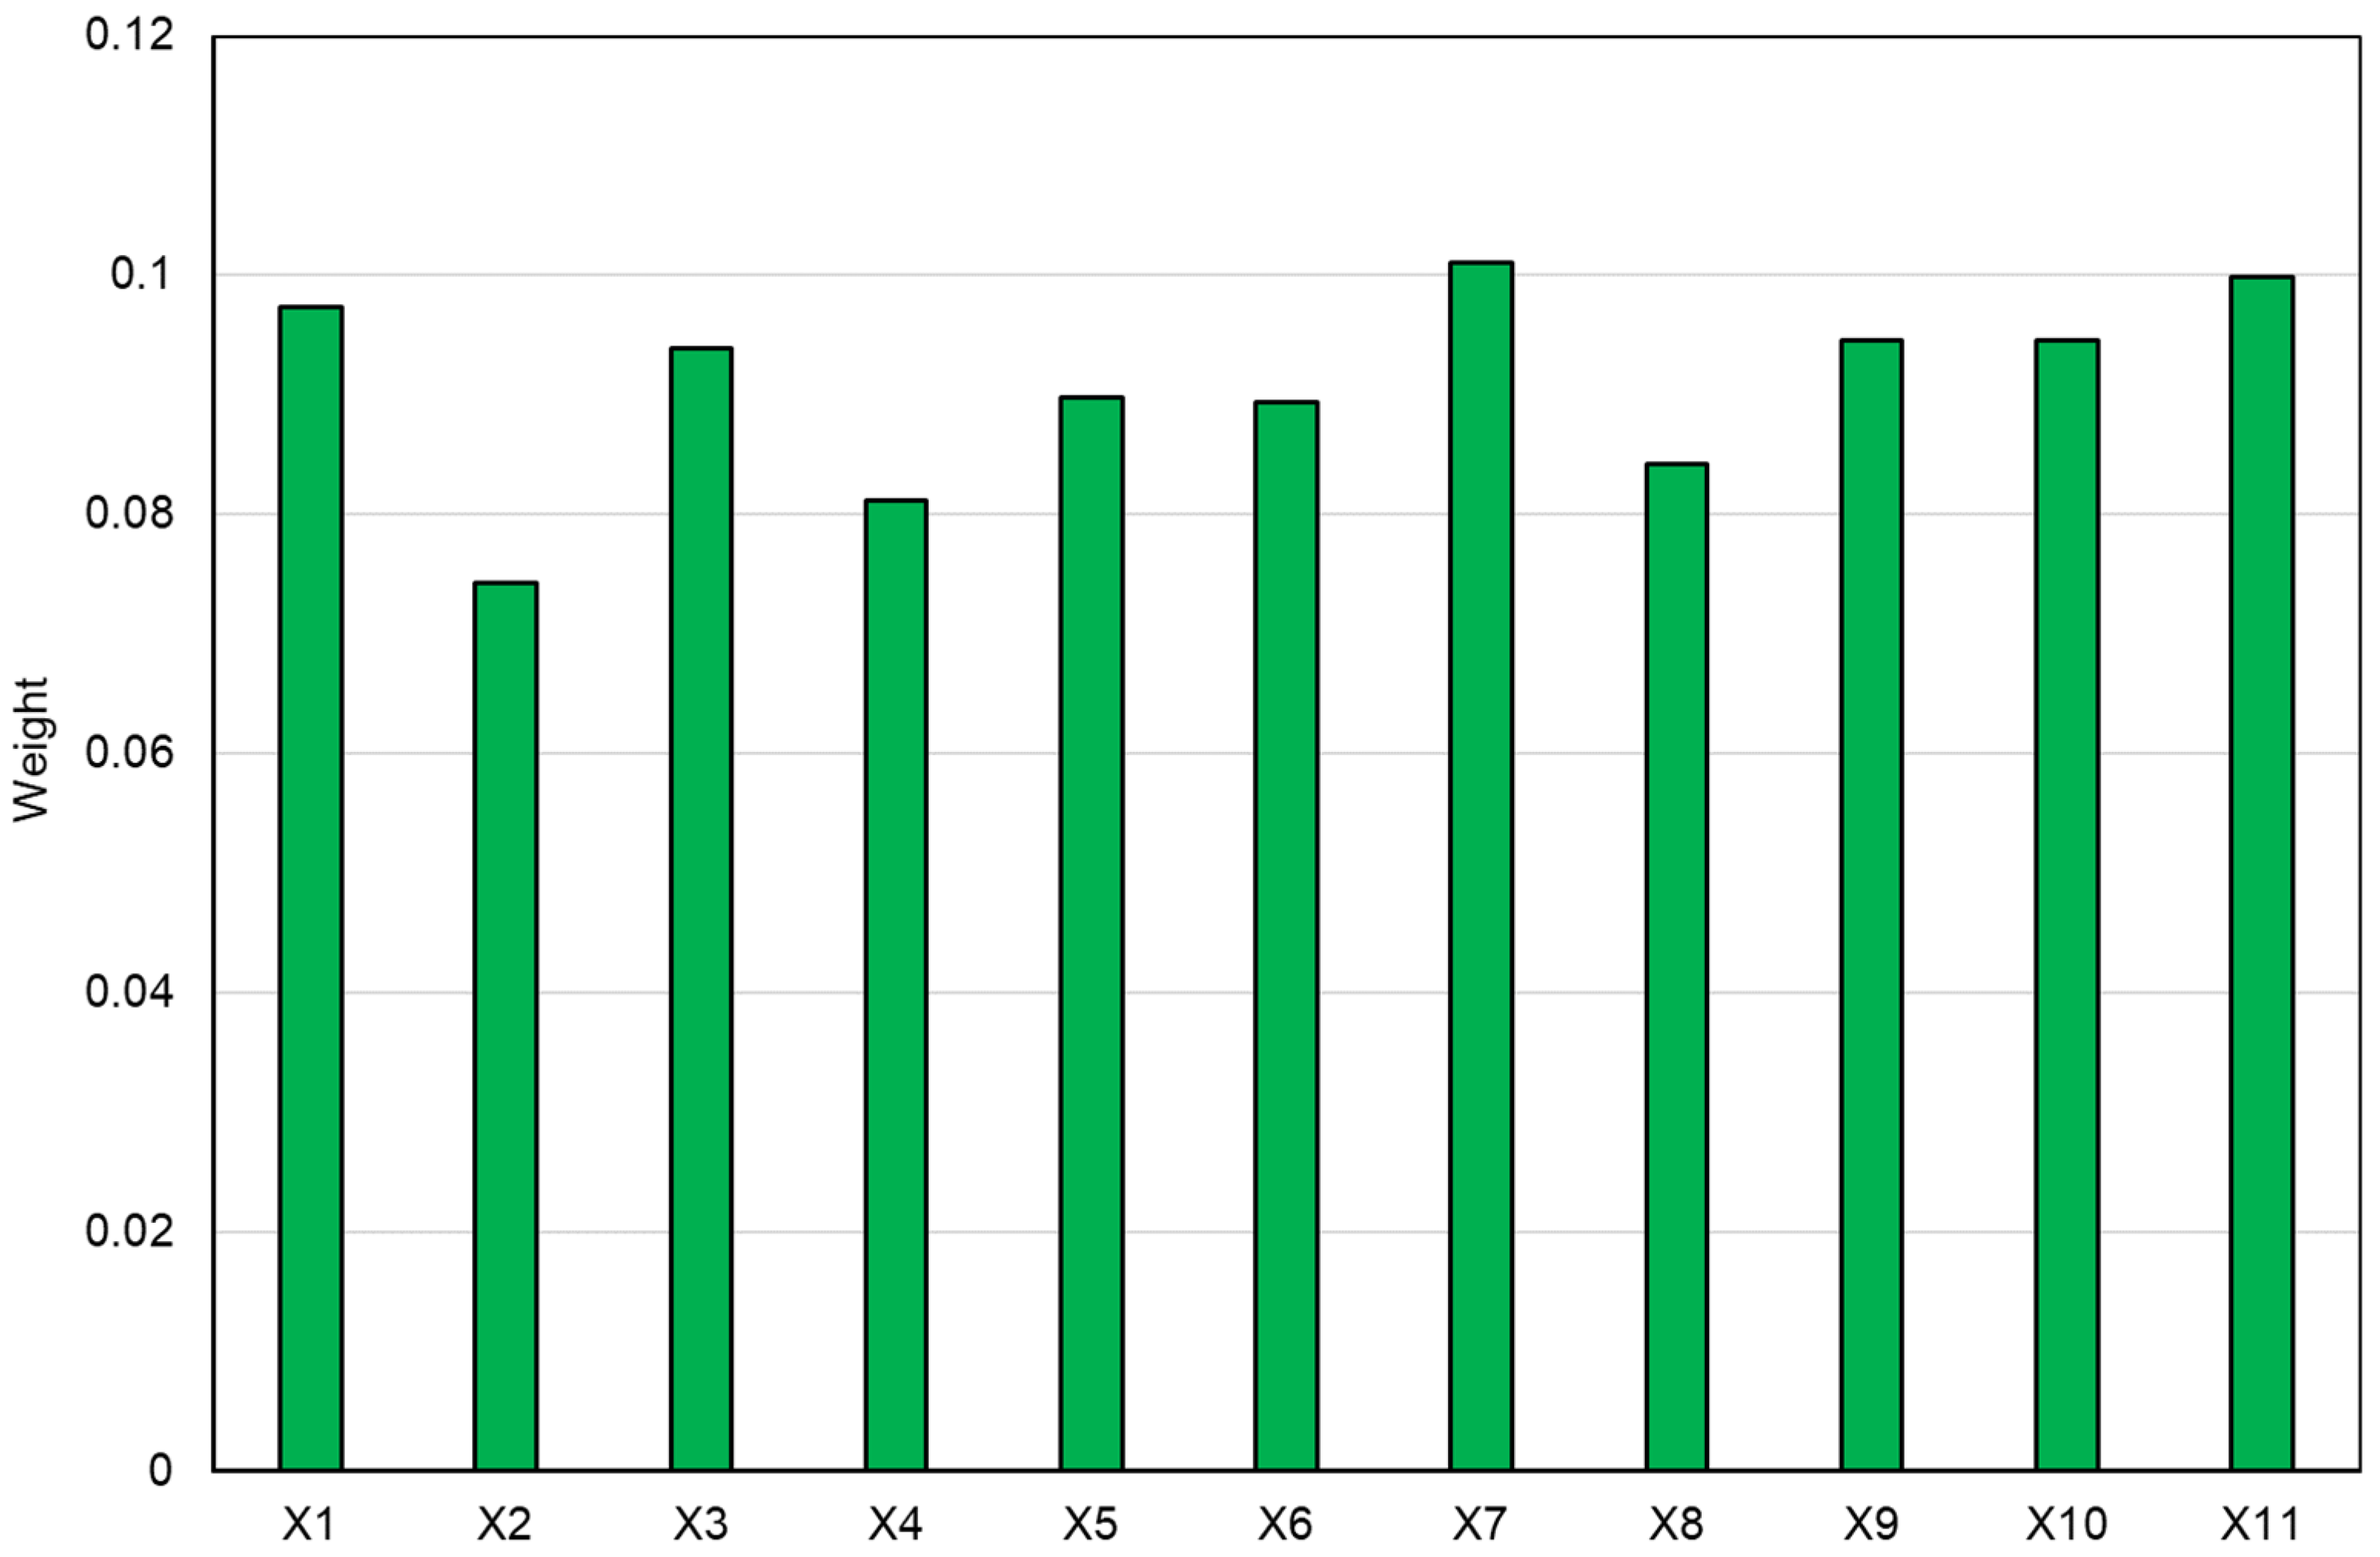
  • To determine the weighted sums of PDA and NDA for each alternative (from Equations (12) and (13)):
    S P i = j = 1 m w j P D A i j
    S N i = j = 1 m w j N D A i j
    where wj is the weight of the j-th criterion determined according to Equation (14):
    w i = 1 E j j = 1 n ( 1 E j )
    where
    E j = k t = 1 m x i j l n ( n i j )
    k = 1 l n ( n )
    where nij is the proportion of samples in time t in the i indicator.
  • To normalize the SP and SN values, according to Equations (17) and (18):
    N S P i = S P i m a x i ( S P i )
    N S N i = 1 S N i m a x i ( S N i )
  • To determine the appraisal score (ASi) index for each alternative:
    A S i = 1 2 ( N S P i + N S N i ) ,   0 A S i 1
  • To rank the ASi values in descending order.
Based on the determined appraisal score (ASi) index values (Equation (19)), the EU-27 countries were evaluated in terms of the level of digital maturity of SMEs from these countries according to the following criterion:
(1)
Expert level:
A S i A S i ¯ + s A S i
(2)
Advanced level:
A S i ¯ + s A S i > A S i A S i ¯
(3)
Intermediate level:
A S i ¯ > A S i A S i ¯ s A S
(4)
Beginner level:
A S i < A S i ¯ s A S i
where A S i ¯ is the mean value of the ASi, and s A S i is the standard deviation of ASi.

4.2.3. Nonparametric Tests

The first nonparametric test was conducted using the Spearman’s rank coefficient. Testing for correlation using this coefficient boils down to ordering the studied variables X and Y into an ascending sequence and then assigning a rank to each object. If there are n objects described by two characteristics under study, the objects must be ordered by the values of each characteristic separately. The objects in each ordering are assigned a rank (number), which determines their location. This negates the negative effect of outliers and non-normality of the distribution of the variables under study. The Spearman’s rank coefficient is determined from Equation (24):
r s = 1 6 i = 1 n d i 2 n ( n 2 1 )
where di is the difference between the ranks of the corresponding values of the feature Xi and Yi, and n is the number of studied objects.
The second nonparametric test was conducted using the Kendall’s tau correlation coefficient. The Kendall’s tau coefficient indicates the strength and direction of the relationship [85] and is determined from
τ = P [ ( x 1 x 2 ) ( y 1 y 2 ) ] > 0 P [ ( x 1 x 2 ) ( y 1 y 2 ) ] < 0

5. Results

Based on the data obtained from the Eurostat database and the developed research methodology based on the methods discussed in Section 4.2, the research was conducted, the results of which are presented in this chapter. According to the adopted methodology, these results were divided into preliminary and fundamental results. For better clarity, the different stages of the main research have also been marked.

5.1. The Preliminary Analysis

The indicators used for the study, characterizing 11 technologies and solutions related to the digitalization process and characterizing the digital maturity of SMEs in the EU countries, were preprocessed and their basic statistical parameters were determined (Table 3).
Based on the results, the presented set of indicators are characterized, first of all, by a large spread of the coefficient of variation (above 10%). Thus, the condition for diagnostic features, which should be marked by significant variation within the studied community, was fulfilled.
The coefficient of variation was found to have the highest value for the indicators enterprises sending eInvoices (X2) and enterprises using the AI technologies (X8), and the lowest value for the indicator enterprises with a website (X11). It is worth noting that the higher the value of the coefficient of variation for a given indicator, the greater its variation. Low values of this indicator, on the other hand, show homogeneity of the population in terms of the use of a given technology in SMEs in EU countries.
When analyzing the average values of these indicators, it was possible to assess which of them is most frequently used by SMEs in the surveyed EU-27 countries. Thus, on this basis, it can be concluded that SMEs, to the greatest extent, use their own websites (X11), cloud services on the Internet (X3), and VPNs in the area of cyber security (X9), while to the least extent, they use 3D printing technology (X5) and industrial or service robots (X6).
The skewness coefficient made it possible to determine the asymmetry of the distribution of studied variables. The values of this coefficient for variables X1 (enterprises that have ERP software), X9 (ICT security measure used: VPN), and X11 (enterprises with a website) were found to be negative, which indicates a left-sided asymmetry of the distribution. This, in turn, showed that in most EU-27 countries, the values of these indicators were reported to be higher than the average determined for the whole EU-27.

5.2. The Fundamental Research

In the first stage of the PCA analysis (fundamental research), it was checked whether and how the indicators that characterize digital maturity taken for the research correlate with one another (Table 4) and whether the correlation matrix is unitary.
The analysis of correlation coefficients between the indicators adopted for the study showed no unitary correlation matrix for the analyzed indicators, which justifies the use of the PCA method. On the other hand, a statistically significant correlation was reported between most of the adopted indicators.
In the next stage of the PCA analysis, the eigenvalues of the correlation matrix were determined (Table 5).
The determined values reflect the significance of the principal components in explaining the information resources of the input indicators used for the study, i.e., their percentage contribution to the variability of the entire dataset.
In order to determine the optimal number of principal components, the Kaiser criterion was used, according to which, if a factor does not extract at least as much as one original variable, it should be discarded [86]. Another criterion, also frequently used, specifies principal components in an amount that explains at least 75% of the variation of the original variables. In the analyzed case, based on the Kaiser’s criterion, the optimal number of principal components was adopted, that is, the number that explains as much variation as at least one original diagnostic variable. Thus, for the indicators under study, there are three principal components that explain 80.26% of the variability of the original data. Figure 4 shows a scatter plot of the exploratory factor analysis, and Table 6 shows the principal component coefficient values.
The analysis conducted showed that the first three principal components were sufficient to explain 80.26% of the cumulative variance. The first principal component carried over 57% of the information contained in the positively correlated indicators (X1; X3; X4; X5; X8; X9; X10; X11). The second component explained 12.97% of the variation in the data included in the indicators: enterprises sending eInvoices (X2) and use of interconnected devices or systems that can be monitored or remotely controlled via the internet (Internet of Things) (X7), and the third explained 10.25% through the variable use of robots (X6).
Figure 5a graphically presents the factor loadings, i.e., the correlations between the primary variables and the principal components for the variables used in the study, and Figure 5b presents the scatter plot of the EU-27 countries in the space defined by the first three principal components. The correlation coefficients take values in the range [−1, 1] and are distributed within the so-called unit circle. The further from the center of the circle a given point is, the higher the correlation of a given variable with a given principal component of the ordination axis. The angles between the vectors depicting the analyzed indicators show their correlation.
By using only scatter plots, it is not possible to assess the relationship between individual indicators and EU-27 countries, but such information can be obtained by analyzing the graphical representation of this analysis in the form of a biplot (Figure 6). By using a biplot with calibrated axes [87] (Figure 6), it is possible to assess the relationships between indicators characterizing the digital readiness of SMEs in individual EU-27 countries. In this form of biplot, these variables are represented by 11 nonorthogonal biplot axes, intersecting at a single coordinate point—the center (0, 0). The closer a given country is to the center of the biplot, the closer the values of variables for that country are to the average value (determined for all EU-27 countries). The further away it is from the center of the biplot, the further away the values are from the EU-27 average for a given technology (i.e., the more they differ).
The countries are represented by points (Figure 6), and the 11 indicators are represented by 11 nonorthogonal biplot axes, intersecting at the center and running through the whole area of the graph. Perpendicular projections of points representing the EU countries on the biplot axes give information about the order of objects in relation to each variable and about approximate values of this variable for a given country. In Figure 6a–c, the marked (small) shaded square (dark blue color), located near the intersection of the biplot axes, indicates the Tukey median. On the other hand, the lighter yellow color indicates the area called the sac, and the darker color indicates the sac surround. When analyzing the results presented in Figure 5, it is possible to notice several objects (countries) significantly outlying from the others. These primarily include Finland, Denmark, Romania, and Bulgaria, as well as Malta, the Netherlands, and Ireland.
The first principal component divides the EU-27 countries into those with the highest use of digital technologies in the SMEs group, such as ERP software package (X1), purchase of cloud computing services used over the internet (X3), analysis of big data from smart devices or sensors (X4), use of 3D printing (X5), enterprises using at least one of the AI technologies (X8), and security measure used: VPN (X9). Additionally, these are the countries where SMEs are most concerned with ICT skills development. This group includes Denmark, Finland, Malta, the Netherlands, Belgium, Germany, Portugal, Sweden, France, and Luxembourg.
The second principal component characterizes those countries that make the most use of enterprises sending eInvoices (X2) and use of interconnected devices or systems that can be monitored or remotely controlled via the internet. These countries include Denmark, Finland, Malta, the Netherlands, Belgium, Germany, the Czech Republic, Austria Sweden, France, and Ireland, among others. On the other hand, the third principal component characterizes the countries with the highest use of robots in SMEs, which include Denmark, Finland, Italy, Spain, and Portugal.
In the next stage, using the EDAS method, a ranking of the studied countries in terms of the digital maturity of their SMEs was made. All diagnostic variables adopted for the study were stimulants. In the determined ranking, the indicators characterizing digital readiness were assigned weights determined by the entropy method. The determined values of the weights for the indicators used in the study are presented in Figure 7, while the results of the calculation of basic parameters, with the EDAS-entropy method, the value of the appraisal score index, and the position in the ranking, are shown in Table 7.
The highest weight value was assigned to indicator X7 (use of interconnected devices or systems that can be monitored or remotely controlled via the internet) and the lowest to indicator X2 (enterprises sending eInvoices).
When analyzing the ranking, it can be noted that the top 10 of the ranking include as many as eight countries (Denmark, Finland, Belgium, the Netherlands, Germany, Italy, and Portugal) from the group of the so-called old EU (EU-14) and only two countries (Malta and Slovakia) from the group of the so-called new EU (EU-13) (Table 8). The most digitally developed SMEs were found to be located in Denmark and Finland (Scandinavian countries), and the least were found in Bulgaria and Romania (former Eastern Bloc countries—new EU).
In the next stage, the ASi index determined by the EDAS method was used to determine the level of digital maturity of SMEs in the EU-27 (according to equations 20–23). The results of this assessment are graphically presented in Figure 8.
The expert level, in terms of SME digital maturity, was achieved by Denmark, Finland, Malta, the Netherlands, and Belgium, and the advanced level by Sweden, Portugal, Germany, Slovenia, Austria, Luxembourg, Italy, Croatia, France, Spain, and Ireland. Countries with an intermediate level according to the classification carried out included the Czech Republic, Estonia, Cyprus, Latvia, Lithuania, Poland, and Slovakia, while countries with the lowest, beginner level of SME digital maturity included Bulgaria, Hungary, Romania, and Greece. Among the countries with the two highest levels of digital maturity were 13 countries (out of 14) from the old EU, and only three countries from the so-called new EU-13. Only one country from the so-called old EU-14 was found to be at the beginner level of digital maturity of SMEs—Greece, which for many years has been ranked one of the last among all EU countries in the Digital Economy and Society Index (DESI) [88] ranking.
The levels of digital maturity of the EU-27 countries unambiguously show how big the disproportion in the implementation of digital technologies (identified with the concept of Industry 4.0) in SMEs is with regard to the countries conventionally included in the EU-14 and EU-13 groups.
In the next stage of the research, the authors checked if and to what extent the economic parameters of the EU-27 countries affected the values of indicators characterizing digital maturity of SMEs in these countries.
Nonparametric tests such as the Kendall’s and Spearman’s tau correlation coefficients were conducted to determine these relationships. The economic parameters adopted for the analysis, characterizing the economy of individual EU-27 countries, were value of GDP, value of GDP per capita, value of business enterprise expenditure on R&D for SMEs, value of business enterprise expenditure on R&D for SMEs per inhabitant, value gross domestic expenditure on R&D, value gross domestic expenditure on R&D per inhabitant, and gross domestic expenditure on R&D as % of GDP.
The values of correlation coefficients were determined for statistical significance level p = 0.05. All statistically significant relationships are marked in Table 8 in bold.
The results showed no statistically significant relationship only between the ASi digital maturity index and GDP value. For the other economic parameters included in the study, such a relationship was confirmed, with the most significant, positive relationship between the values of the ASi index and business enterprise expenditure on R&D (for SMEs) expressed in EUR per inhabitant and the value of GDP per capita (expressed in EUR).
In turn, the smallest but statistically significant relationship was reported between ASi index and business enterprise expenditure on R&D and gross domestic expenditure on R&D. The values of Kendall’s tau correlation coefficients showed similar values to the Spearman rank correlation coefficients, but the strength of the relationship between the studied parameters was higher for the Spearman rank correlation coefficients.
Thus, it can be concluded that only the GDP value did not significantly affect the digital maturity index of SMEs in the studied countries and, consequently, the level of this maturity (Table 8 and Figure 9). This result shows no statistically significant evidence for a thesis that a high level of economic development is a guarantor of a high level of SME digital maturity. Consequently, despite the great expectations, the digitalization of this group of companies to ensure the economic growth of individual countries has not yet been fully exploited. On the other hand, it is optimistic that other economic parameters are significant for the occurrence of such a relationship (Table 8, Figure 10 and Figure 11). Most often, countries characterized by relatively high GDP per capita expenditures simultaneously show a high level of digital maturity, which is evident when looking at the results of this analysis presented in Figure 9.

6. Discussion

6.1. Digitalization of SMEs

One of the priorities of the EU is to digitalize as quickly as possible and in all areas of business and citizens’ lives. SMEs, whose economic and social roles in the EU are very significant, are particularly important for achieving this goal. A serious approach to this process is indicated by a significant number of documents adopted by the European Commission. Their aim is to create conditions for achieving sustainable digital development of all EU-27 countries, which is not an easy task. The problem is, first of all, the large economic and social differentiation of individual countries and groups of companies. Of key importance in the process of digitalization are SMEs, which stimulate development not only at the national level, but mainly at the regional level [89]. Their role and importance are equally important for the economies of both developed and developing countries, which causes great concern and involvement of EU institutions in their digitalization process.
Therefore, the conducted research covered an important area of the EU economic activity due to both its innovativeness (digitalization—Industry 4.0) and the group of enterprises (SMEs) which they concern.
The results confirm the division of the EU countries into two groups of development pace, i.e., developed and developing countries. In the case of digital solutions implemented in SMEs, and, as a result, the level of digital maturity, the best, apart from Malta and Slovenia, are the old EU-14 countries, and much worse—the remaining EU-13 countries (which are shown in the biplot presented in Figure 5). Among the EU-14 countries, the worst performer in this regard was Greece which, as noted by Laitsou et al. [90], in relation to most EU-27 countries, is developing more slowly, especially in implementing new technologies, i.e., digitalization. The results obtained confirm this state of affairs, which places Greece among the countries that face serious challenges in improving the state of digitalization of SMEs.
The research on the assessment of the level of SME digital maturity among the EU-27 countries showed that five countries, namely, Denmark, Finland, Belgium, Malta, and the Netherlands, are characterized by a high level of digital maturity (Figure 8). These are countries that, as shown by the PCA analysis, are also very similar in terms of the number of companies that use such technologies in their SMEs as integration of internal processes in the form of ERP software package, integration with customers/suppliers, cloud computing, 3D printing, IoT, and cybersecurity (in the form of VPN security). In addition, SMEs in these countries are most concerned with the development of employees’ digital skills through training and have websites to showcase their products and services online.
The clear leader in the digital maturity of SMEs in the EU-27 countries was found to be Denmark. This success is the result of a huge commitment of service, commercial, and industrial companies to implement modern technologies and to continuously develop. The percentage of SMEs declaring the use of digital technologies in the country is one of the highest in the EU-27. This applies to advanced technologies such as AI, as well as integration of internal processes. As much as 23% of Danish SMEs use AI technologies in their business. This is 8% higher than the use of AI in SMEs in Finland, which ranked the second among the EU-27 countries. In Finland, SMEs are the most likely, among the EU-27, to use digital technologies for electronic invoicing (83% of SMEs), cloud computing services (75% of SMEs), and monitoring and/or remote control of various devices and systems via the Internet (40% of SMEs).
High digital maturity scores were also found in Belgium and the Netherlands (Table 7). This is due to the extensive use of big data technologies in SMEs (21% and 25%, respectively) [29], and the use of cloud technologies (52% and 64% of SMEs, respectively), among other reasons. The degree of use of industrial or service robots in SMEs in these countries is also higher than the EU average (5.8%), as in Belgium, robots are used by 9% of SMEs and in the Netherlands by 6%.
Among the countries of the so-called “new EU”, only Malta does not differ in the level of digital maturity from the group of EU-14 countries (Table 8). In Malta, SMEs are highly integrating technological solutions in the form of cloud services (38% of SMEs), use of big data (29% of SMEs), or monitoring and/or remote control of devices and systems over the Internet (27% of SMEs). Then, there are also countries that lag behind in terms of the implementation of digital solutions in SMEs. These are Romania, Bulgaria, Hungary, and the previously mentioned Greece. The level of these countries in terms of the studied digital maturity of SMEs is rated as the beginner level (Table 7). This means that they face great challenges in improving the level of digital maturity (application of solutions related to the Industry 4.0 concept) in SMEs. This process requires taking concrete and decisive actions in this area, and first of all, developing an appropriate development strategy and allocating specific resources for its implementation. As shown by Trasca et al. [91], Romania and Bulgaria are among the countries that perform the worst in terms of SME digitalization. In Romania, these companies use digital technologies much less frequently, compared to the EU average.
Even the use of relatively simple technological solutions, such as integration of internal processes in the form of ERP software package to share information between different functional areas, and integration with customers/suppliers, is not widespread in Romanian SMEs. ERP systems are used by only 16% of SMEs and sending eInvoices is used by only 17% of SMEs, while the EU-27 average is 35% and 29%, respectively, for these solutions. Bulgaria, on the other hand, is aware of its situation, as it has adopted as a target, to be achieved for 2030, the increase of the basic indicators of technological maturity and innovation to the EU average level [28]. However, as of today, all indicators included in the research are well below the EU-27 average. This applies to the implementation in SMEs of both simple technological solutions (e.g., integration of internal processes in the form of ERP software package to share information between different functional areas) and more advanced ones (e.g., use of AI technologies).
In addition, the level of digitalization of SMEs in Hungary is well below the EU average, practically in all analyzed areas (Table 3). According to [92], the reasons for this situation are the lack of sufficient (financial) government support and no investments in innovation and training by SMEs.
When analyzing the results, it can be concluded that the juxtaposition of the most and least developed countries, in terms of the level of digital maturity of SMEs in the EU-27, to a large extent coincides with the results of DESI [88]. The differences are due to the scope of the study, which in this paper covered only SMEs, while the DESI index deals with the digitalization of both the economy and society. Nevertheless, this noticeable similarity of results indicates that despite the specificity of this group of companies (SMEs), their degree of digitalization is part of the general trend of this process in the country.
It is also necessary to address the issue of the relationship between the value of the digital maturity index (ASi) and the economic parameters of the economies of the countries studied. The purpose of this stage of the research was to determine the relationship between the economic development of a given country and the state of SME digitalization. The results showed no statistically significant evidence that a high level of economic development characterized by GDP value ensures a high level of digitalization of SMEs in a country (Table 8 and Figure 8). The results of this part of the study can be considered complementary to previous studies in this area [93], which also showed the absence of such a relationship. On the other hand, the extension of the analysis carried out in this paper indicates that there is a statistically significant relationship between parameters such as GDP per capita, business enterprise expenditure on R&D (for SMEs), business enterprise expenditure on R&D, gross domestic expenditure on R&D, and the digital maturity index (ASi) (Table 8, Figure 10 and Figure 11). As shown by one study [94,95], which is also evident from this paper, properly targeted R&D investments in SMEs are necessary to increase their digitalization rate.
The presented discussion includes reference to only some part of the obtained results. The broadness and diversity of the results provide opportunities for further in-depth analysis and a broad discussion on the problem of SME digitalization in the EU-27. Undoubtedly, this problem is current and important for the EU economy as well as for individual countries and other regions that want to build innovative knowledge-based economies. Without the involvement of SMEs in this process, achieving success may be very difficult.

6.2. Digitalization of SMEs and Open Innovation

The digitalization process poses various challenges for SMEs, including those related to the economic situation, staff skills, finances, and ability to invest in new technologies. As indicated by numerous studies and reports, decision-makers in enterprises, especially in manufacturing companies, are fully aware that in order to successfully continue their activities and remain competitive, they need to implement innovative solutions. Therefore, digitalization, based on innovative solutions, becomes a great opportunity for their development. Of great importance in this process, especially for SMEs, is the practical implementation of the OI concept, which gives wide possibilities of using solutions of other entities and sharing their ideas. As Petruzzelli et al. point out [96], there is a positive and significant relationship between the implementation of new technologies and OI in SMEs. Cooperation with different organizations increases the possibilities for these companies to access necessary innovative resources. This is especially true for the implementation of digital technologies that are not yet widely used. As shown by another study [97,98,99], intensive cooperation, especially in high-tech industries, can result in the acquisition of knowledge necessary for the development of the digitalization process in SMEs. On the other hand, the research results presented by Petruzzelli et al. [96] show that apart from the technologies themselves, another important factor is also the competence of the employees and the management. Without properly qualified staff, it is difficult to implement new digital solutions.
When referring to the OI concept, it is worth noting that the industry in which SMEs operate and attempt to digitize their processes is also of great significance [100].
To sum up, in order to remain competitive and attractive on the open market, SMEs need to implement innovative digital technologies. In order for these processes to be successful, they need to apply open business models and cooperate extensively with external partners, including the possibilities provided by the OI concept [101,102,103,104,105,106].

7. Conclusions

The problem of SME digitalization is current and immensely important for the sustainable economic development of the EU. Due to its universality, the presented methodology and obtained results can also be successfully used to study other regions and countries. Such comparative analyses conducted in other regions and countries worldwide, which have their specificity, can be a source of interesting information and knowledge in this area.
From the point of view of the EU, the process of digitalization of companies and society is currently a priority in building a competitive and innovative knowledge-based economy. Digitalization is currently one of the most important trends that change practically our whole civilization. The group of small and medium-sized enterprises is of key importance in this process, both from the global and local point of view. It mainly results from a large number of these enterprises, the number of employees, and their direct contact with society. These enterprises, unlike most large companies, are much closer to society, and thus have a great impact on building economic and technological sovereignty, prosperity, and creating social digital awareness.
Therefore, it is so crucial to know the level of technological advancement of these companies, which is undoubtedly shown by the presented results. They made it possible to assess the degree of digitalization (application of solutions related to the Industry 4.0 concept) of SMEs in the EU-27 countries. These solutions were characterized by a set of indicators, selected on the basis of previous studies and the knowledge and experience of the authors of this paper. In general, these indicators referred to the most important technologies and areas related to the digitalization of enterprises.
The research results showed the following:
  • Digital technologies identified with Industry 4.0 most frequently used by SMEs in the EU-27 are the use of websites, cloud services, and having a VPN as a cybersecurity measure. At the same time, the least used technologies are 3D printing and industrial or service robots.
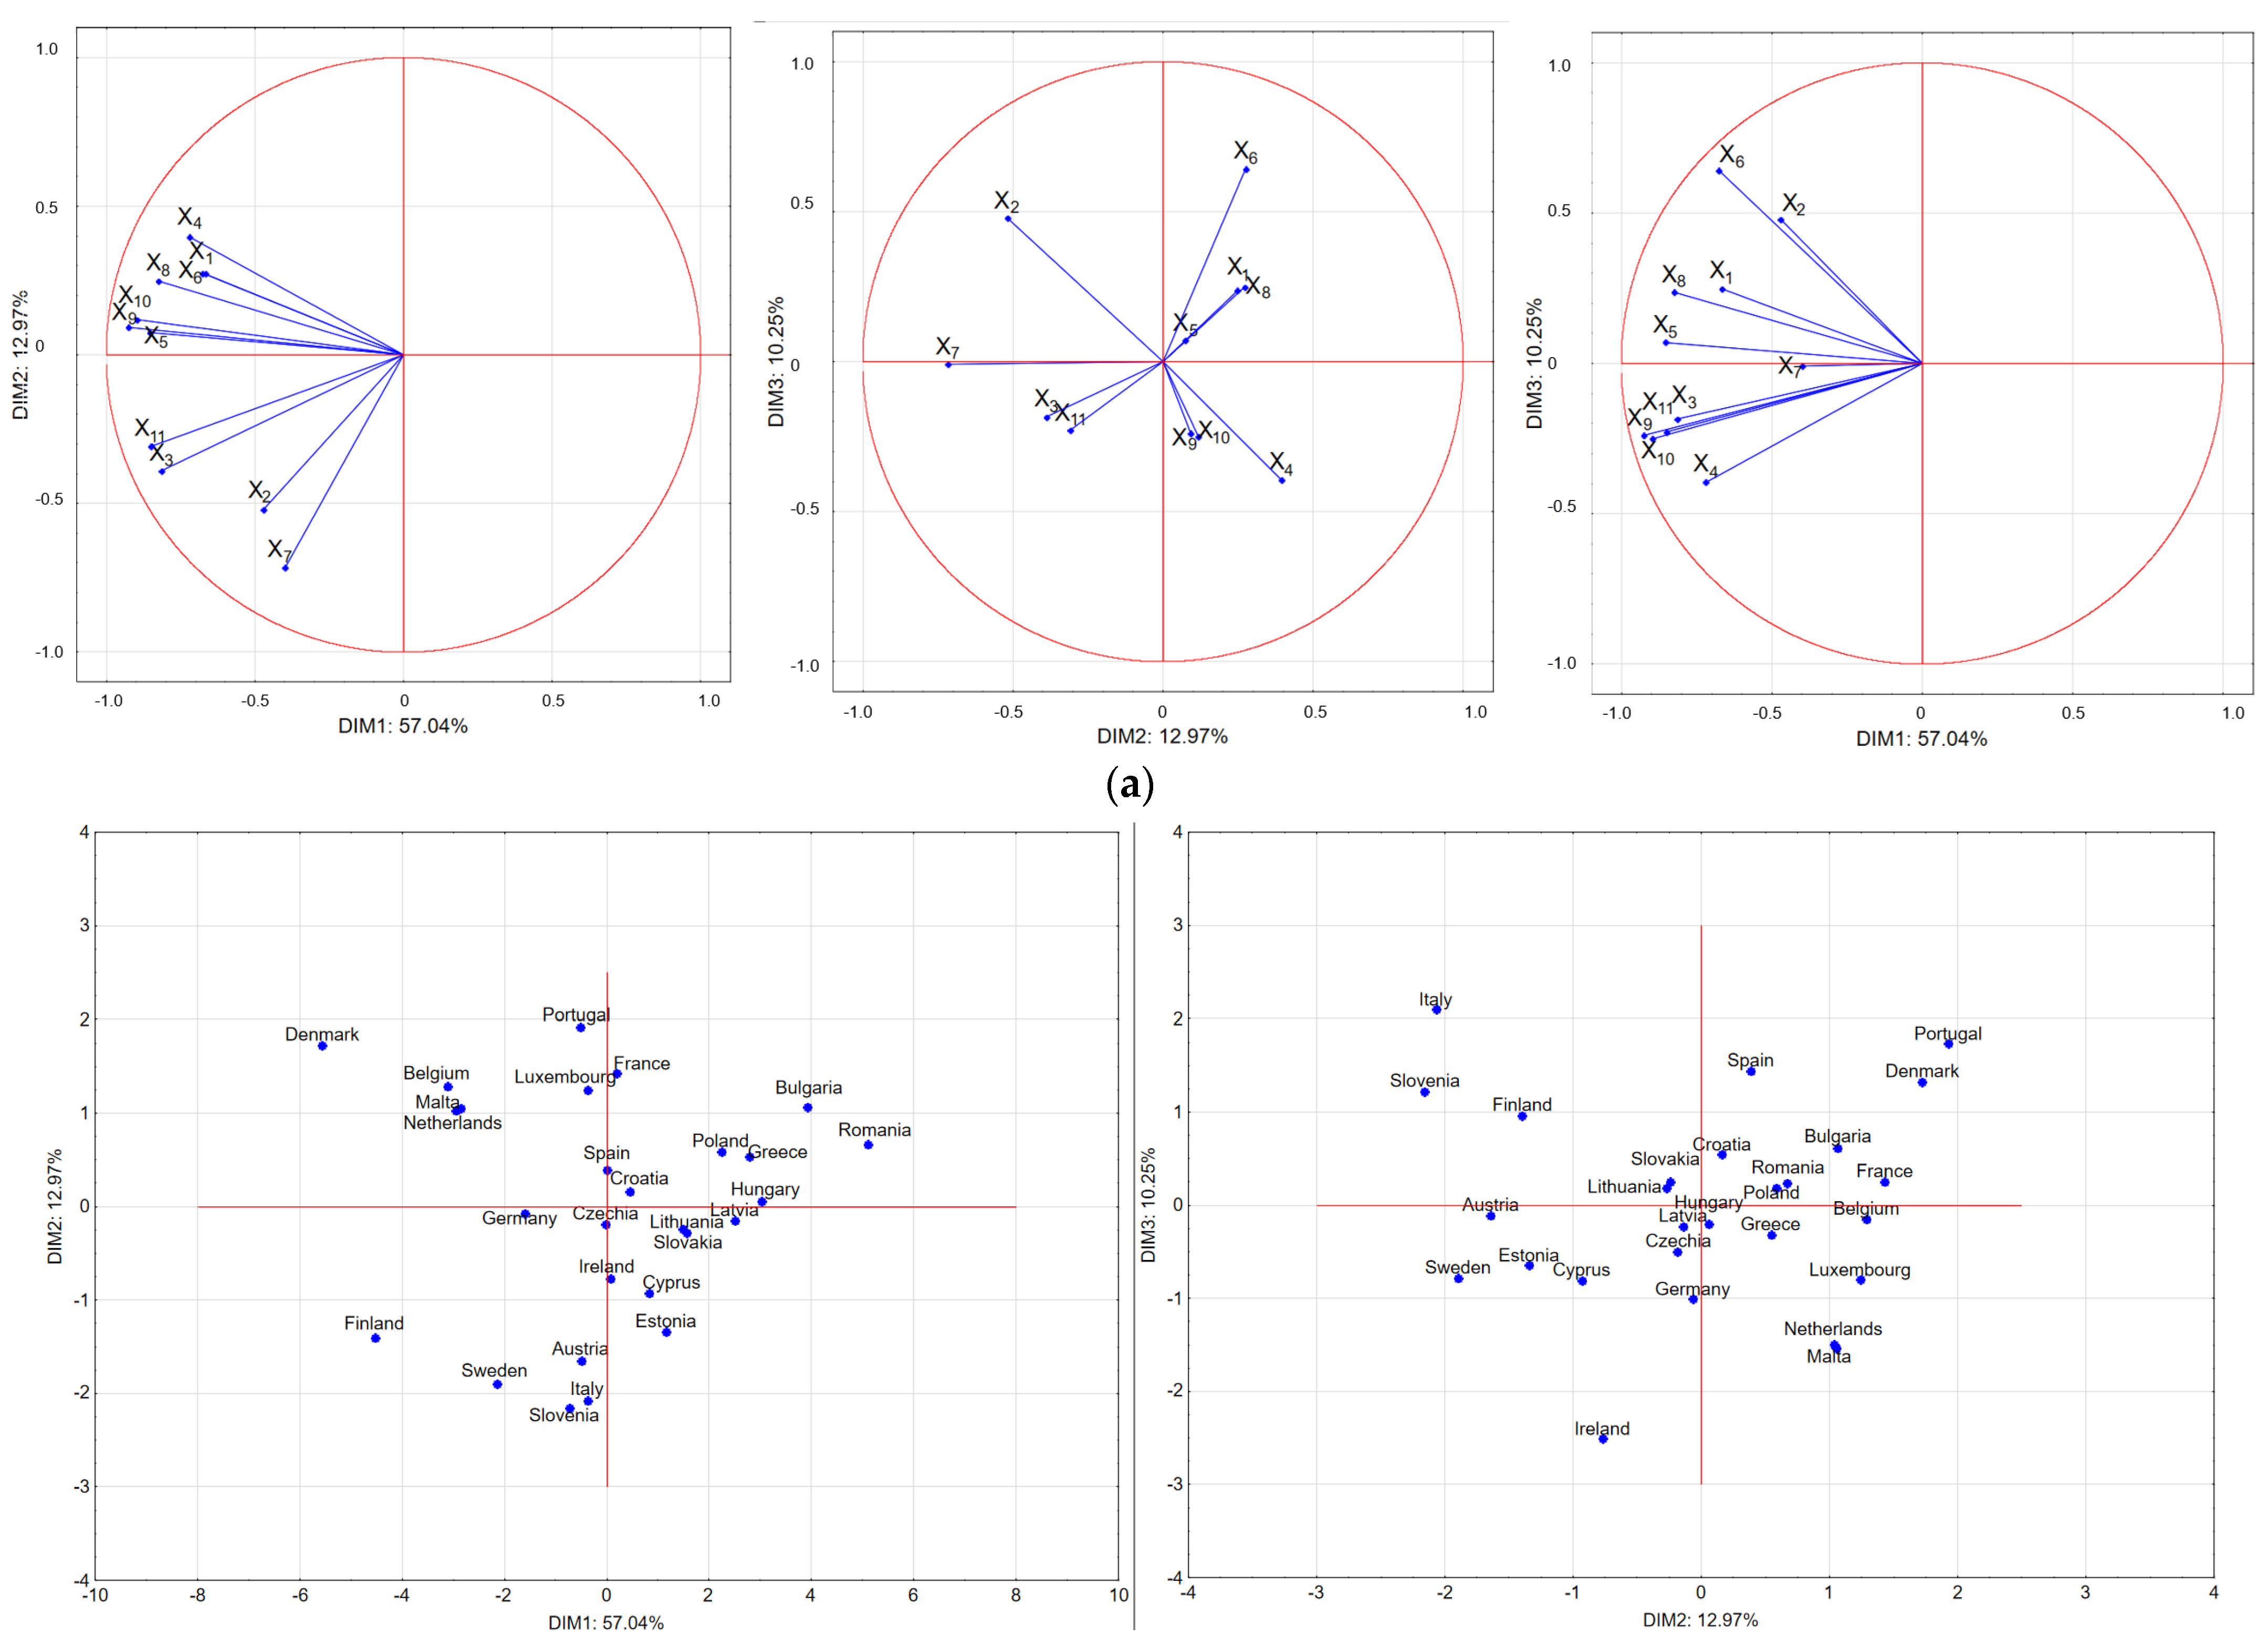
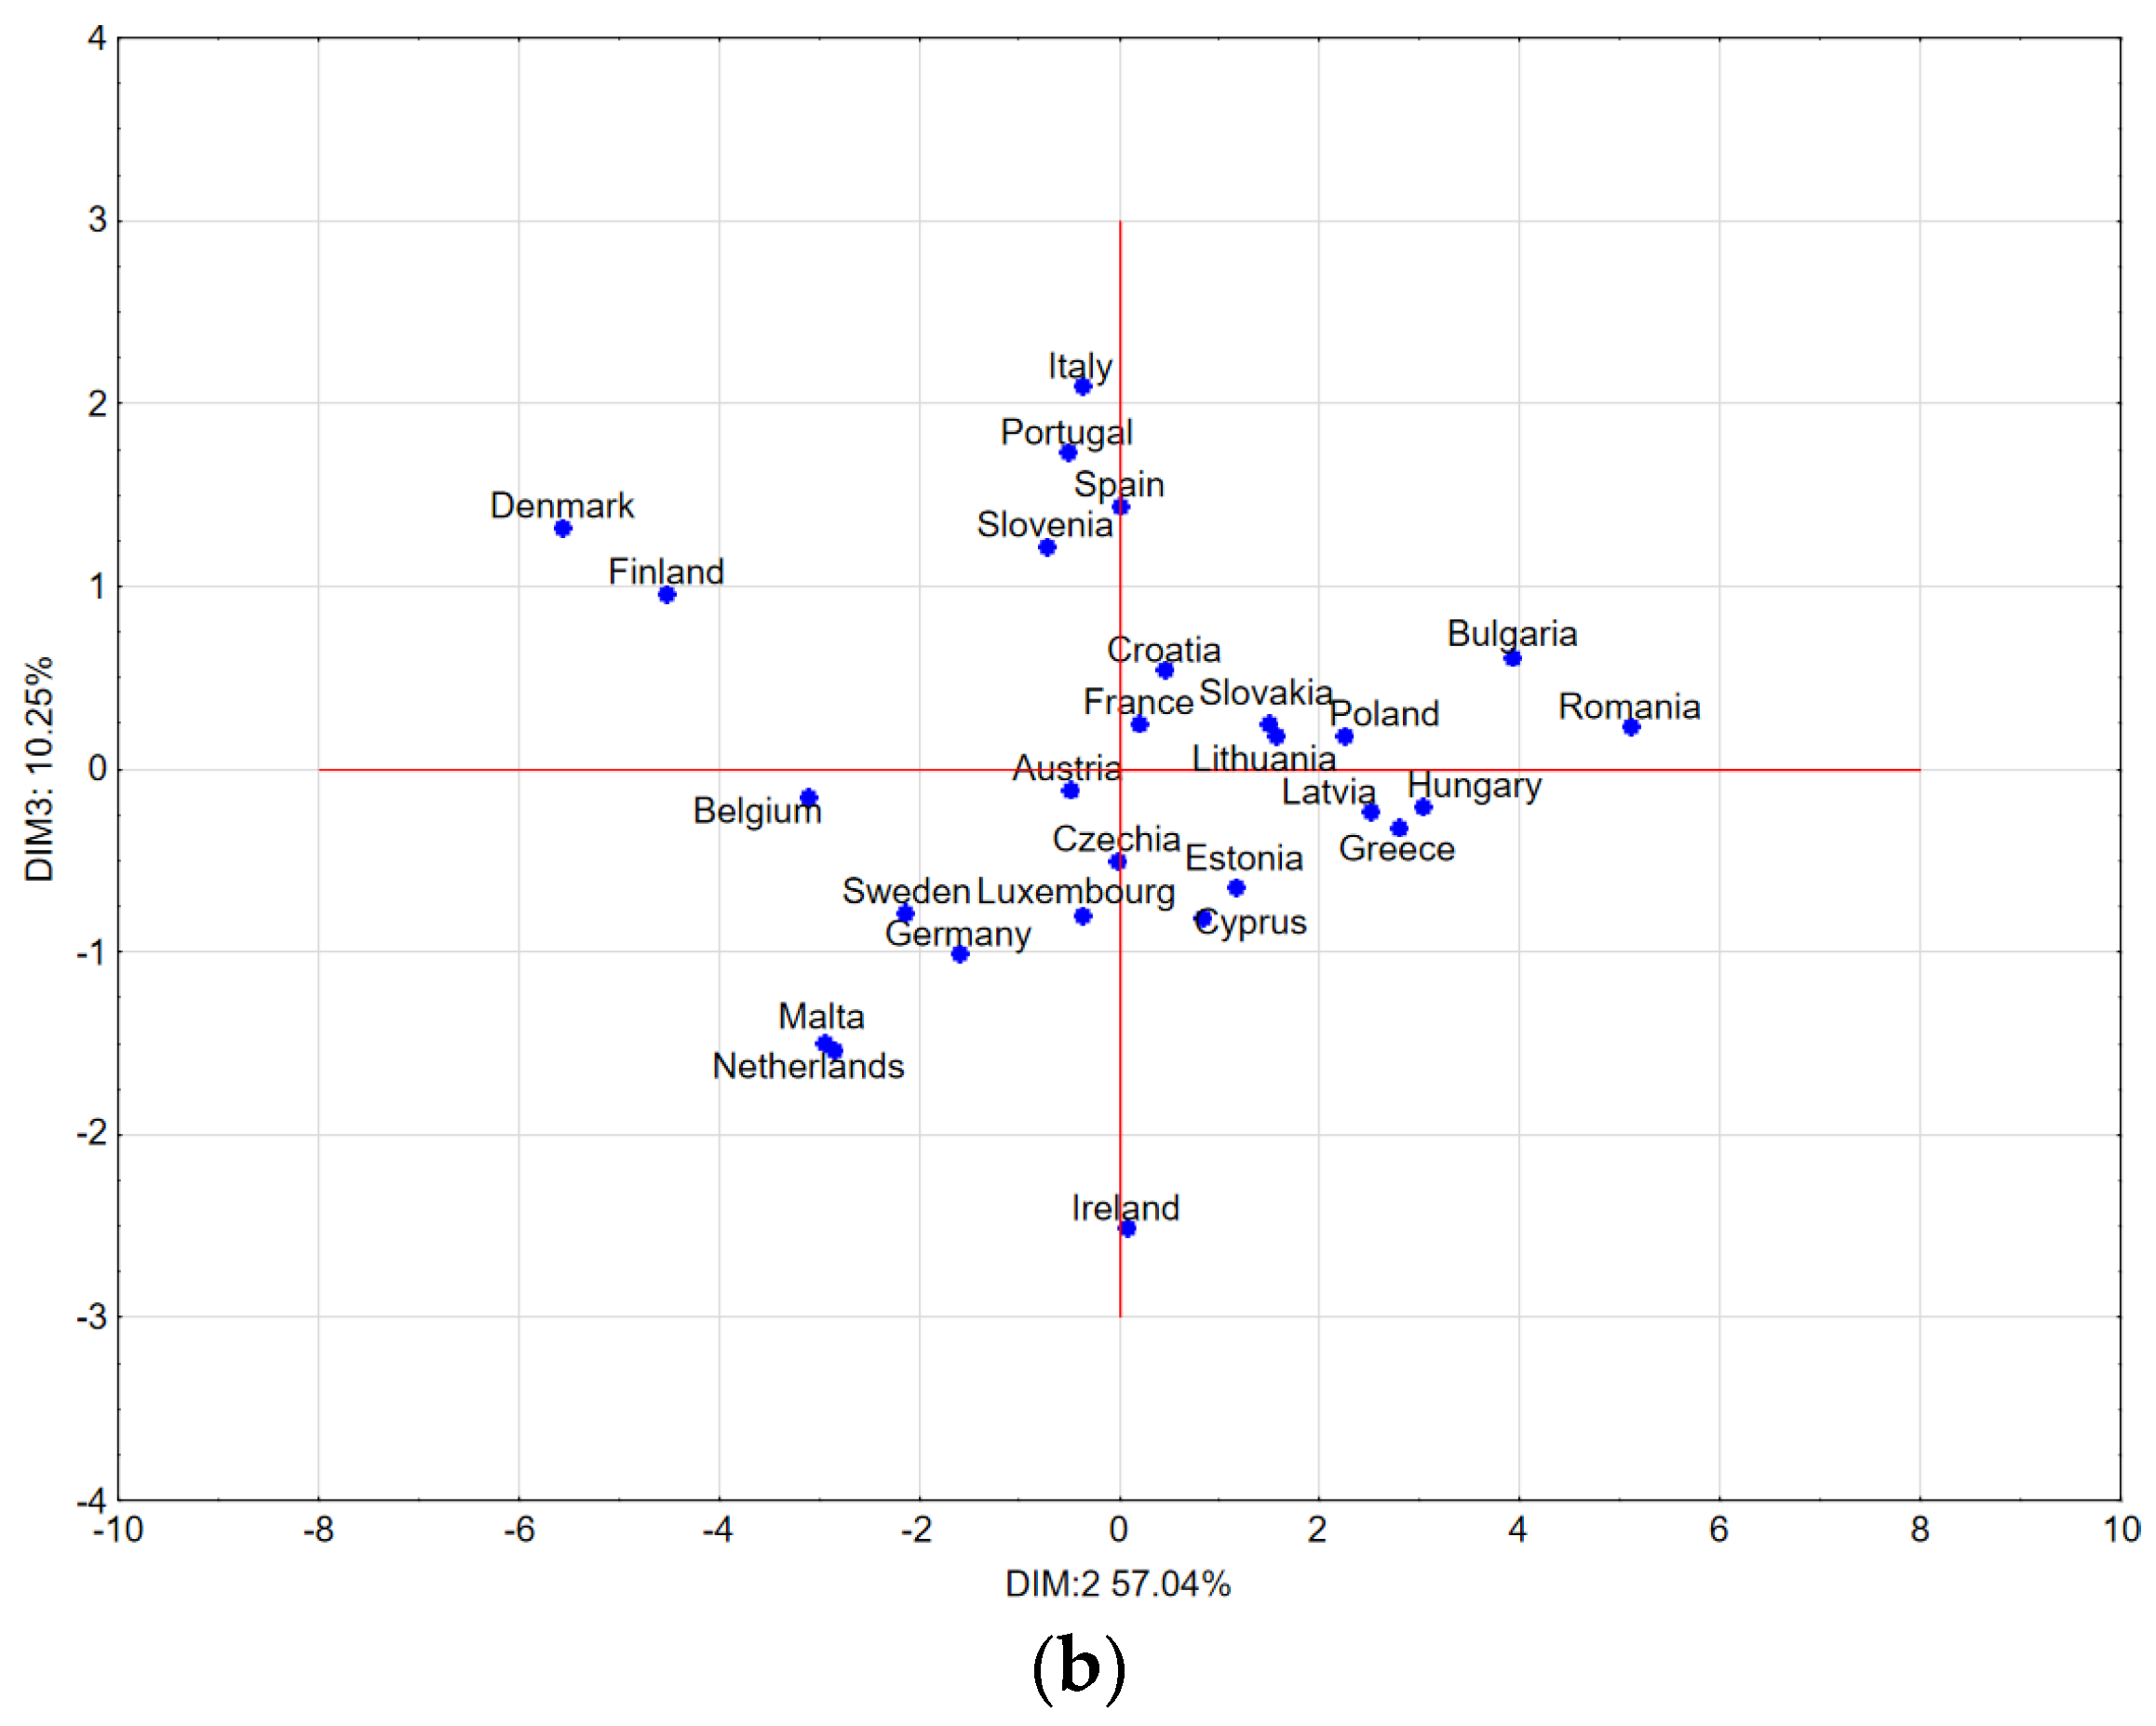
  • The EU-27 countries are very heterogeneous in terms of the sophistication of digital technologies implemented in SMEs. Within the EU-27 as a whole, two groups of countries can be distinguished, with few exceptions, in terms of the digitalization of this group of enterprises. Definitely more advanced in this regard are the countries of the old union (except Greece), and much less—the countries of the new union (except Malta and Slovenia).
  • The expert level of digital maturity of SMEs was achieved by Denmark, Finland, Malta, the Netherlands, and Belgium, and the advanced level by Sweden, Portugal, Germany, Slovenia, Austria, Luxembourg, Italy, Croatia, France, Spain, and Ireland. The intermediate-level countries included the Czech Republic, Estonia, Cyprus, Latvia, Lithuania, Poland, and Slovakia. The group of countries with the lowest, beginner level of digital maturity in SMEs included Bulgaria, Hungary, Romania, and Greece.
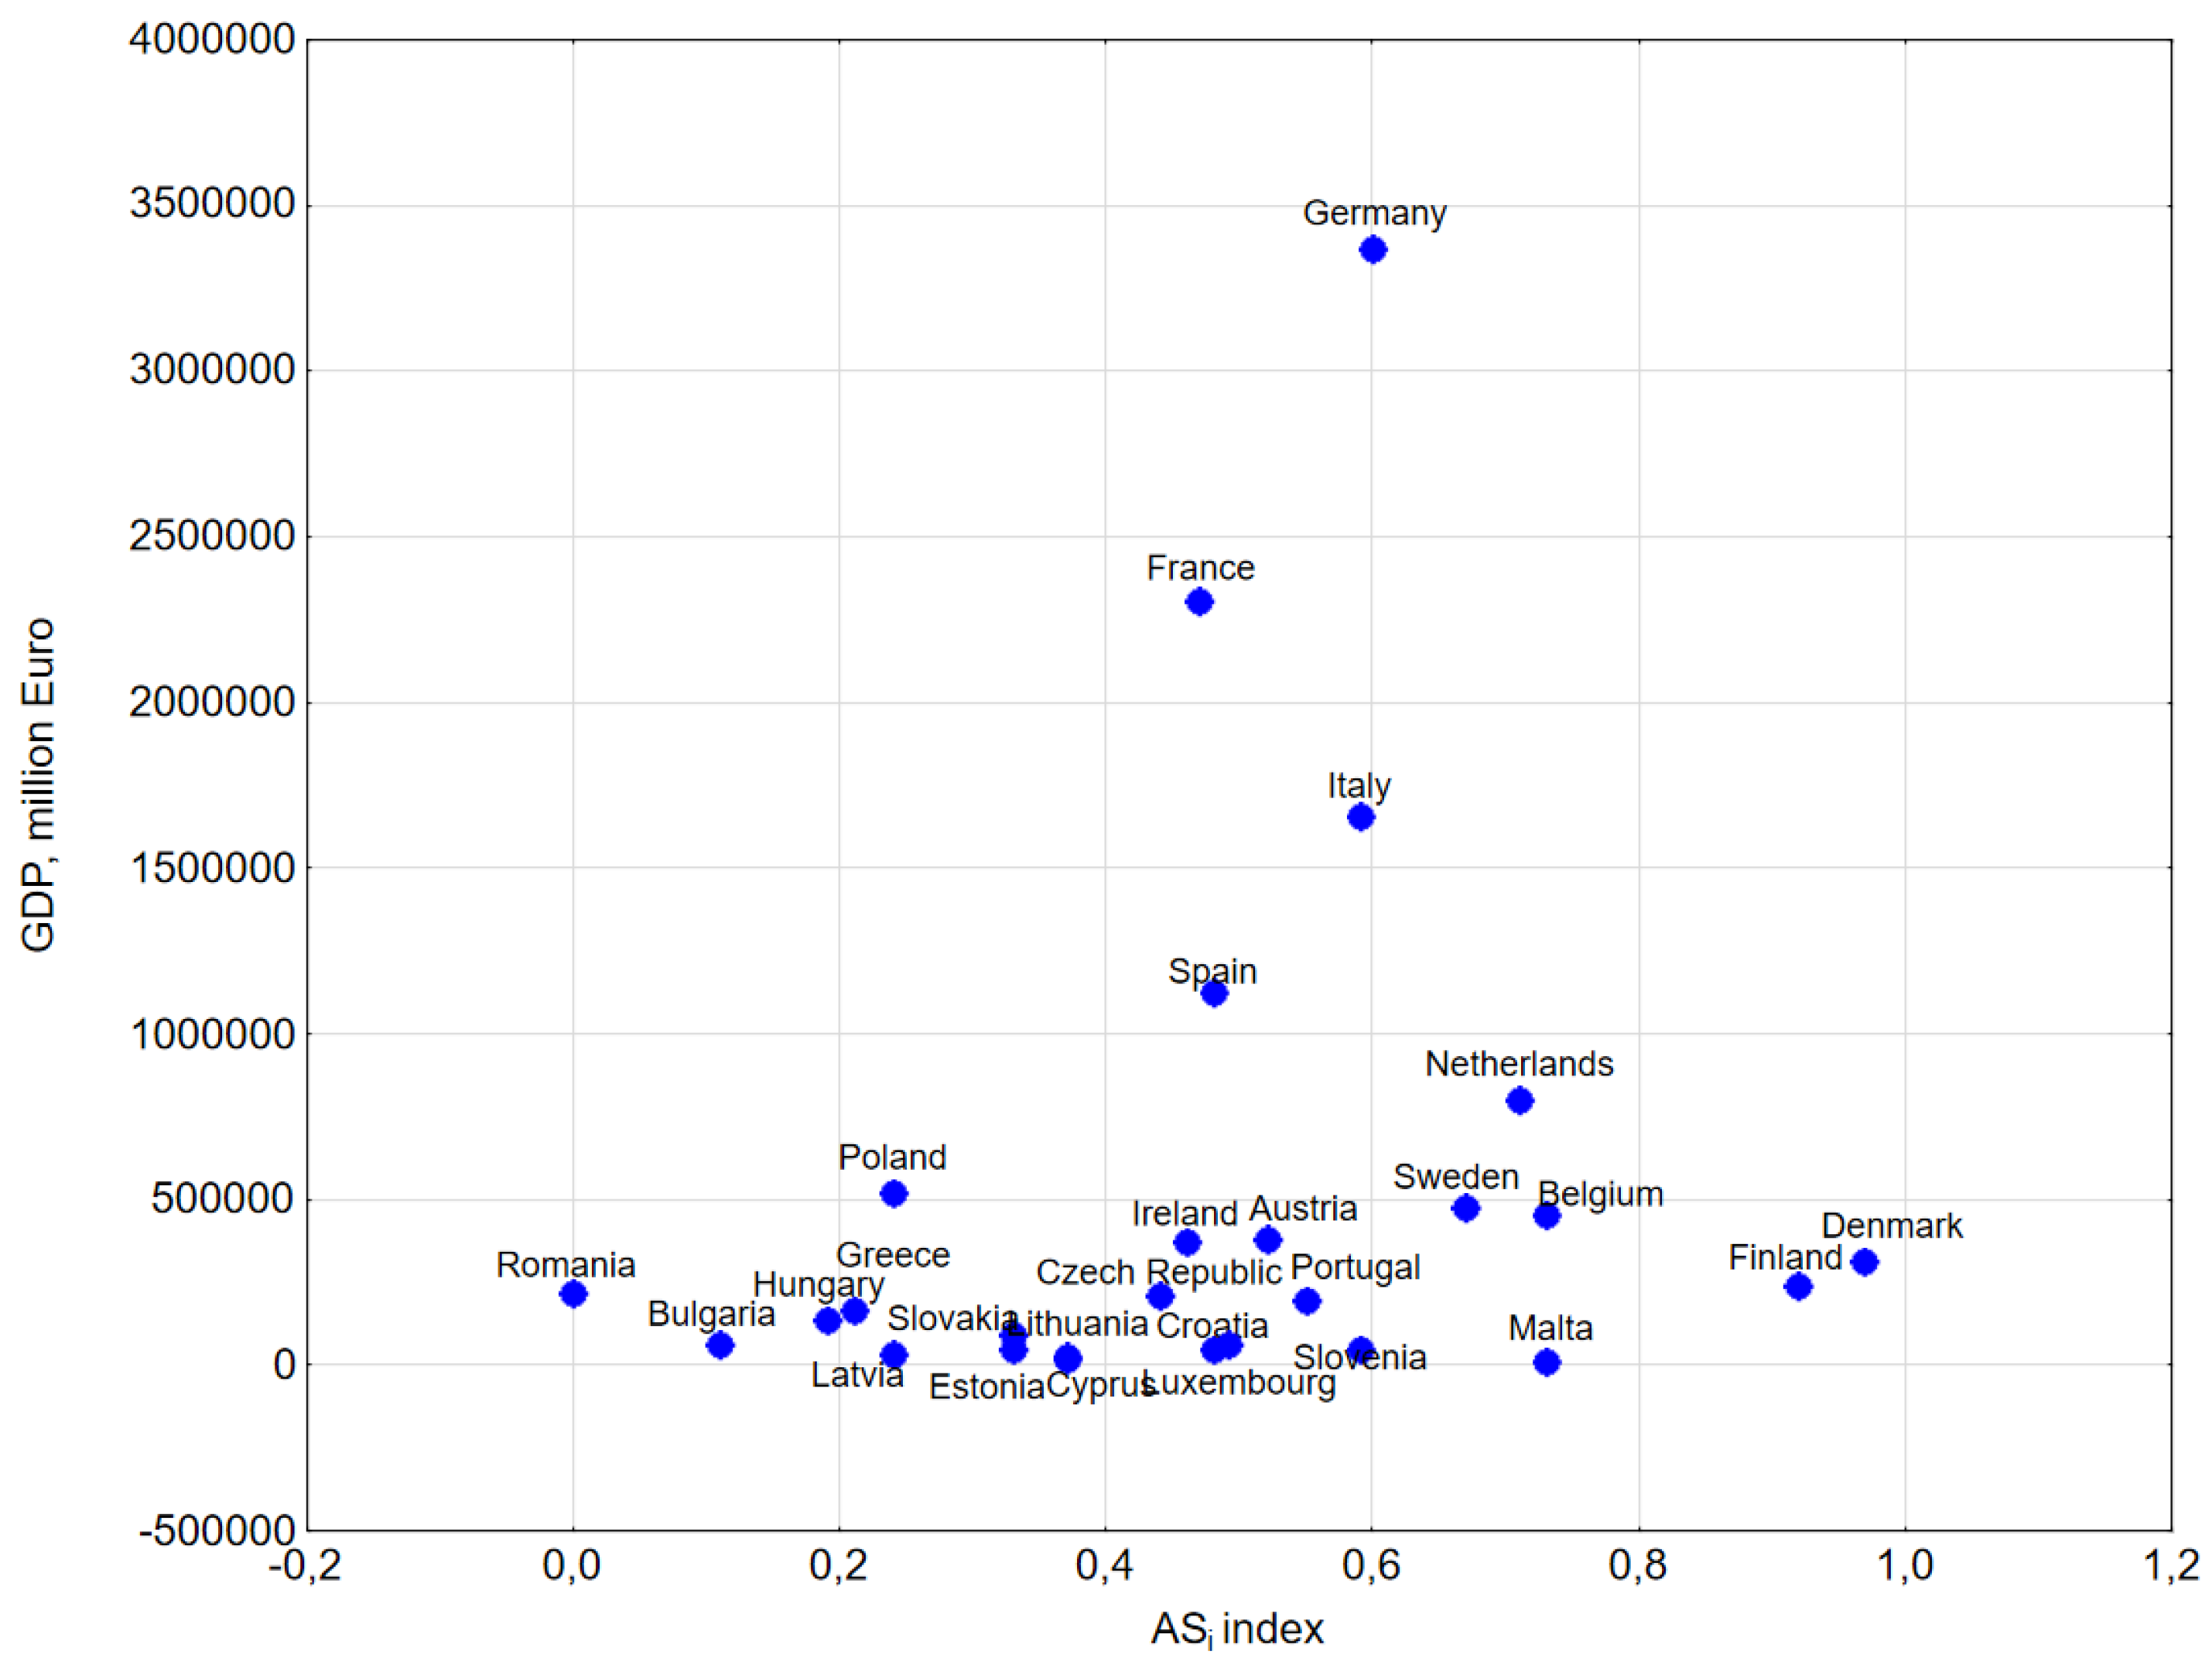
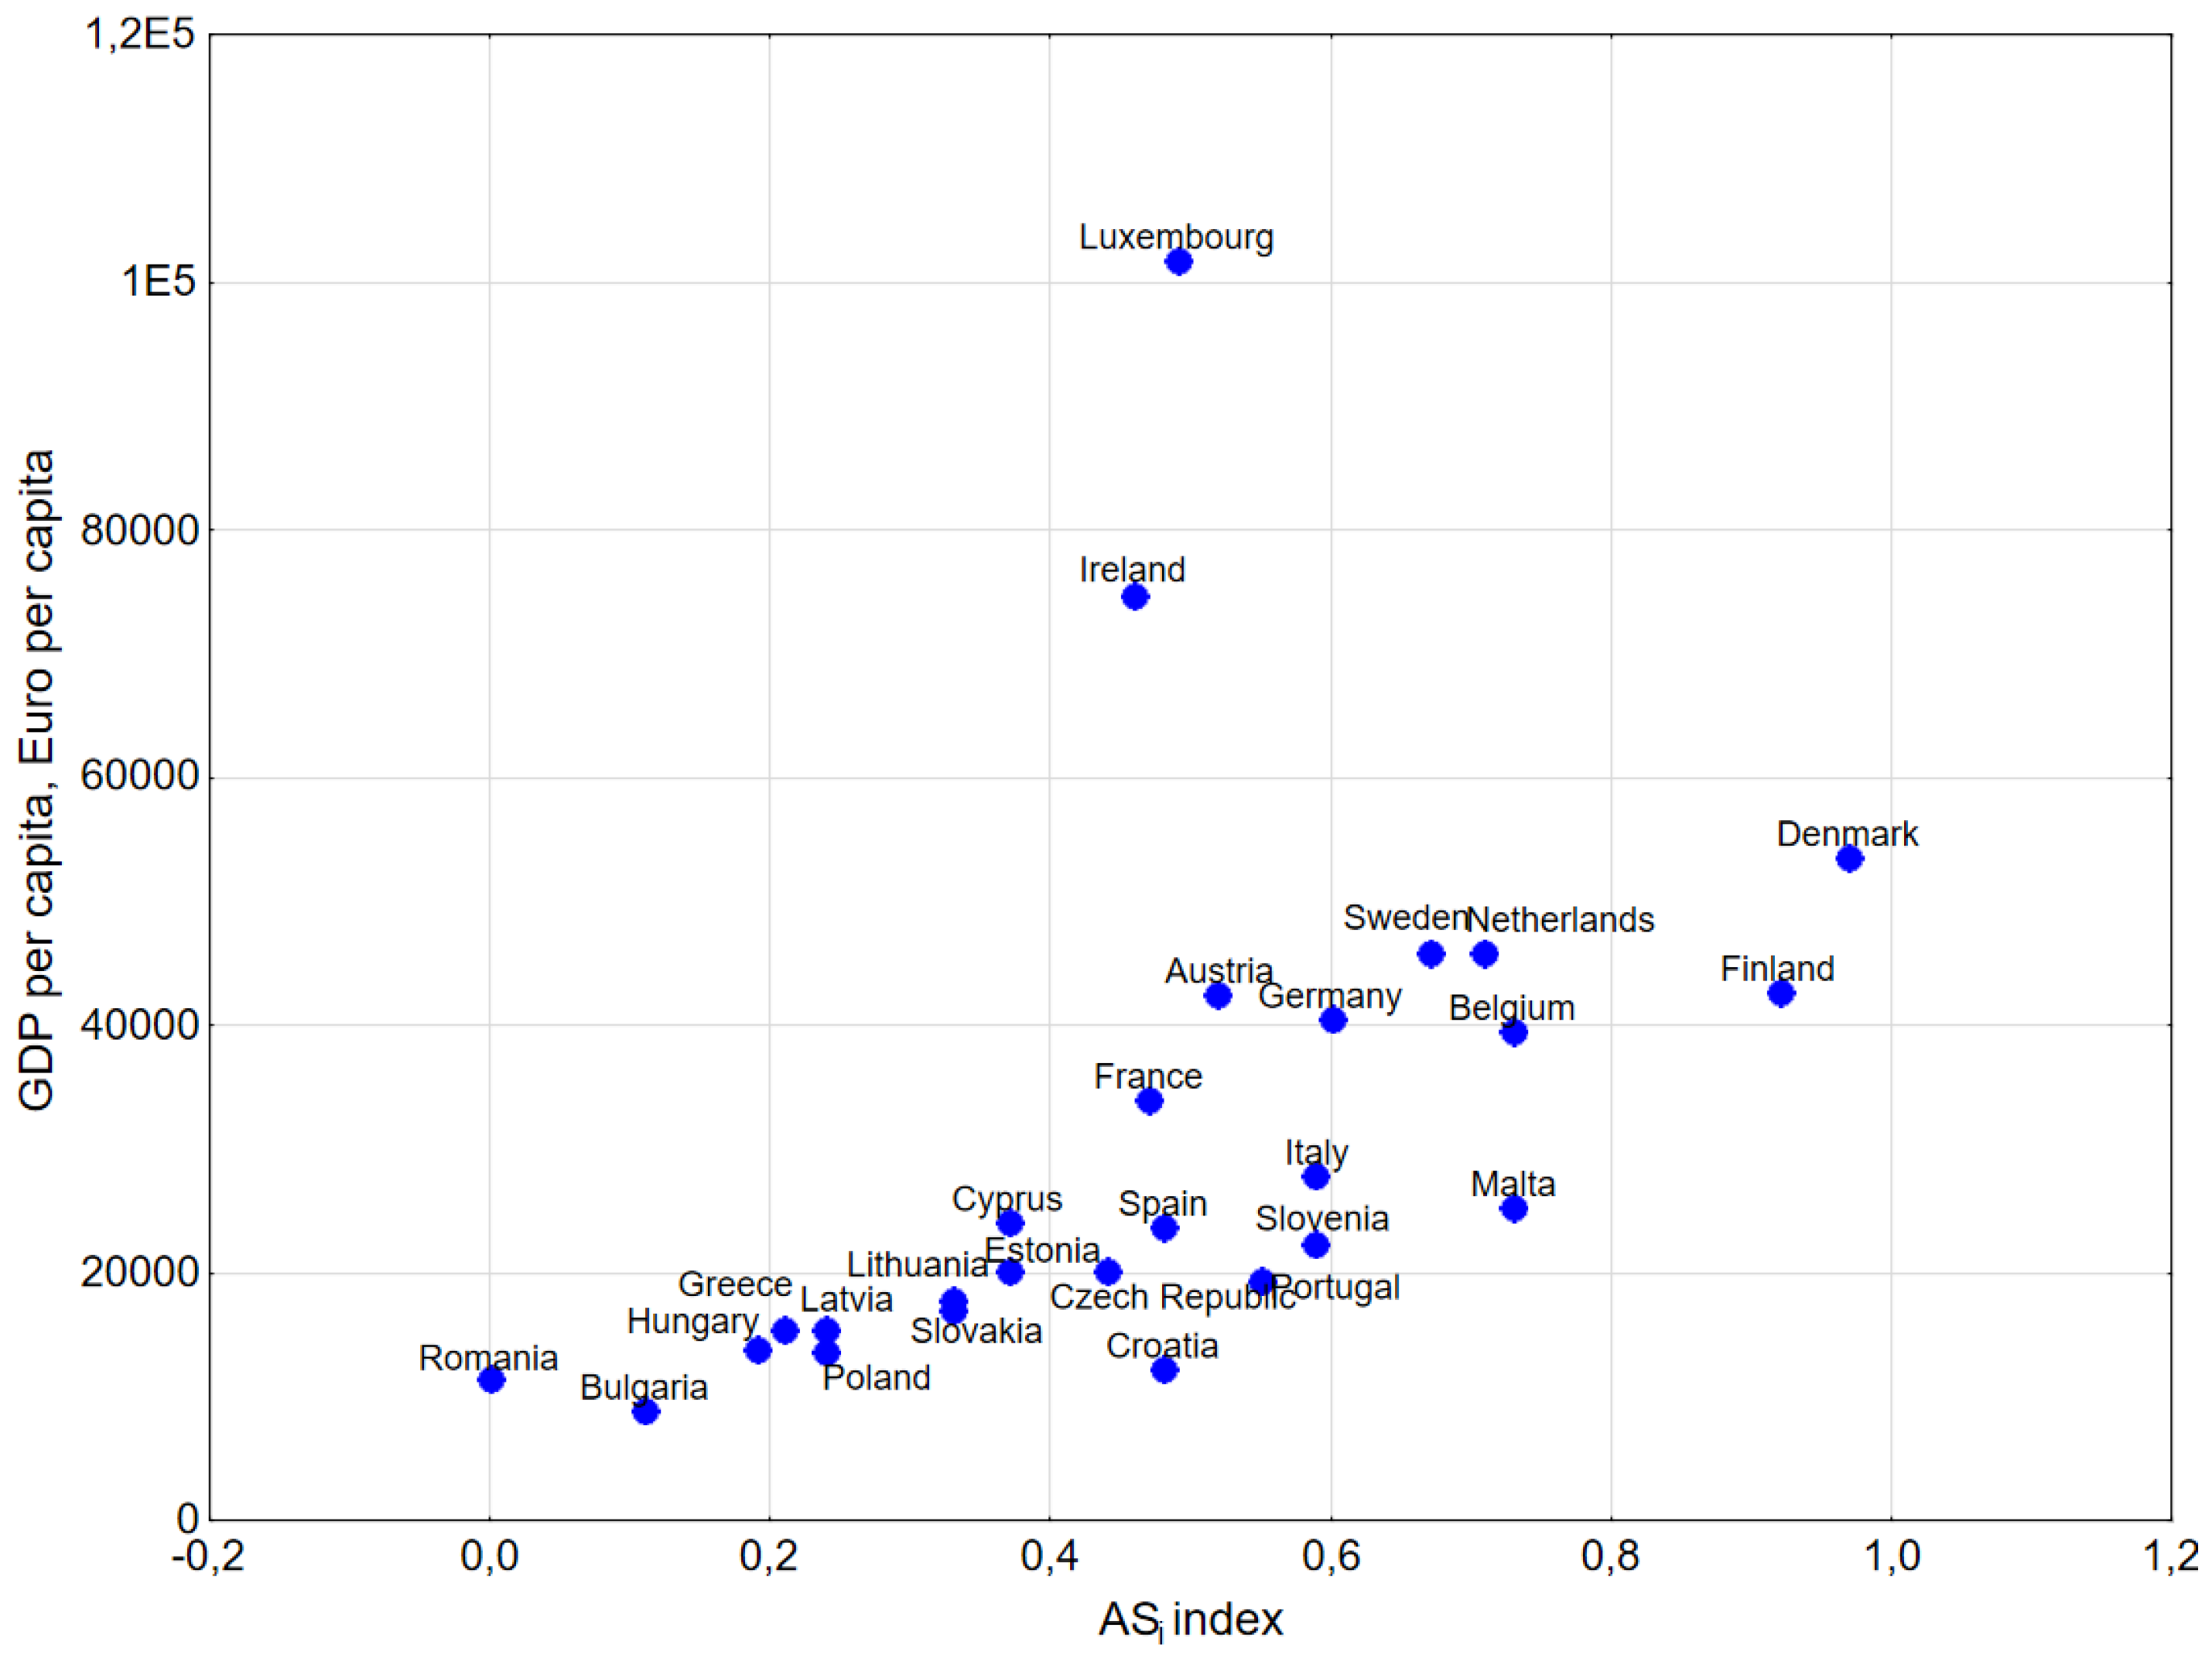
  • A positive, statistically significant relationship was confirmed between economic parameters such as GDP per capita, business enterprise expenditure on R&D (for SMEs), business enterprise expenditure on R&D, and gross domestic expenditure on R&D, and the digital index (ASi) of SMEs for the EU-27 countries. Thus, these parameters were found to be relevant for the digitalization process of SMEs. At the same time, it was confirmed that the GDP value of each country is not more significant for the digital development of SMEs.
The obtained results clearly indicate significant challenges the EU is facing in building a sustainable digital economy. Therefore, it becomes reasonable to take such findings into account when developing a strategy for the development of the region’s digitalization process. In this regard, a key task is to reduce the disproportion in the level of digital maturity of SMEs in different countries. It seems advisable to implement educational and motivational programs to increase knowledge of digital solutions and possibilities of their practical application. Without accelerating the pace of digitization of this group of enterprises, it will be difficult to meet the growing global competition. This is particularly important in the face of recovery from the crisis caused by the SARS-CoV-2 pandemic. This pandemic has significantly altered the optics of the modern economy, which should be a direction for future research in this area. To sum up and generalize the conducted research, it can be said that the results should be used to build a new strategy and improve the process of financing activities related to the digitalization of the entire EU economy, especially SMEs.
The conducted research and the results also led the authors to formulate directions for future research. As part of further work on the digital transformation of SMEs, it is reasonable to conduct a study of their digital maturity in terms of economic sectors, classified according to NACE Rev. 2. Such an analysis will allow for more precise identification of the level of digitalization of SMEs that deal with a specific type of activity, and this in turn should identify industries where these processes require assistance and intervention. Extending and complementing this research with the results of an analysis of digital maturity in selected sectors of the economy (e.g., transport, energy, agro-food industry, environmental protection, telecommunications, engineering, and others) will therefore allow a very accurate diagnosis of the state of progress of digital transformation processes in the EU-27. It is also worthwhile, as already mentioned, to refer to the impact of the SARS-CoV-2 pandemic on the process of SME digitization and the EU-27 economy in general, as well as the changes that have occurred in other regions of the world.
As part of future research, it also seems justified to monitor and investigate the reasons for the large discrepancy in the digitalization of SMEs in the old and new EU countries. The results presented in this paper indicate that the process of integration of the European economy, in terms of its digitalization, shows very large differences in individual countries.
From the point of view of future work, it would also be important to carry out re-search in the EU countries on the barriers and limitations (including knowledge) that entrepreneurs see in the implementation of new technologies. At the same time, it would be very interesting to suggest that they formulate their proposals for necessary actions to effectively implement digital solutions. In this respect, it would also be worth defining the areas, forms, and scope of potential support for SME activity in this field.

Author Contributions

Conceptualization, M.T. and J.B.; methodology, J.B. and M.T.; software, M.T. and J.B.; formal analysis, J.B. and M.T.; investigation, J.B. and M.T.; resources, M.T. and J.B.; data curation, M.T. and J.B.; writing—original draft preparation, M.T. and J.B.; writing—review and editing, J.B. and M.T.; visualization, M.T.; supervision, M.T. and J.B.; project administration, M.T. and J.B.; funding acquisition, M.T. All authors have read and agreed to the published version of the manuscript.

Funding

This publication was funded by the statutory research performed at Silesian University of Technology, Department of Production Engineering, Faculty of Organization and Management and Department of Safety Engineering, Faculty of Mining, Safety Engineering and Industrial Automation.

Institutional Review Board Statement

Not applicable.

Informed Consent Statement

Not applicable.

Data Availability Statement

Not applicable.

Conflicts of Interest

The authors declare no conflict of interest.

References

  1. Adedoyin, F.F.; Bekun, F.V.; Driha, O.M.; Balsalobre-Lorente, D. The effects of air transportation, energy, ICT and FDI on economic growth in the industry 4.0 era: Evidence from the United States. Technol. Forecast. Soc. Chang. 2020, 160, 12029. [Google Scholar] [CrossRef] [PubMed]
  2. Karaman Aksentijević, N.; Ježić, Z.; Zaninović, P.A. The Effects of Information and Communication Technology (ICT) Use on Human Development—A Macroeconomic Approach. Economies 2021, 9, 128. [Google Scholar] [CrossRef]
  3. Lee, J. Industry 4.0 in big data environment. Ger. Harting Mag. 2013, 1, 8–10. [Google Scholar]
  4. Ober, J.; Kochmańska, A. Adaptation of Innovations in the IT Industry in Poland: The Impact of Selected Internal Communication Factors. Sustainability 2022, 14, 140. [Google Scholar] [CrossRef]
  5. Xu, X.; Lu, Y.; Vogel-Heuser, B.; Wang, L. Industry 4.0 and Industry 5.0—Inception, conception and perception. Int. J. Ind. Manuf. Syst. Eng. 2021, 61, 530–535. [Google Scholar] [CrossRef]
  6. Sima, V.; Gheorghe, I.G.; Subić, J.; Nancu, D. Influences of the Industry 4.0 Revolution on the Human Capital Development and Consumer Behavior: A Systematic Review. Sustainability 2020, 12, 4035. [Google Scholar] [CrossRef]
  7. Moeuf, A.; Lamouri, S.; Pellerin, R.; Tamayo-Giraldo, S.; Tobon-Valencia, E.; Eburdy, R. Identification of critical success factors, risks and opportunities of Industry 4.0 in SMEs. Int. J. Prod. Res. 2020, 58, 1384–1400. [Google Scholar] [CrossRef]
  8. Linder, C. Customer orientation and operations: The role of manufacturing capabilities in small- and medium-sized enterprises. Int. J. Prod. Econ. 2019, 216, 105–117. [Google Scholar] [CrossRef]
  9. Amaral, A.; Peças, P. A Framework for Assessing Manufacturing SMEs Industry 4.0 Maturity. Appl. Sci. 2021, 11, 6127. [Google Scholar] [CrossRef]
  10. Gherghina, Ș.C.; Botezatu, M.A.; Hosszu, A.; Simionescu, L.N. Small and Medium-Sized Enterprises (SMEs): The Engine of Economic Growth through Investments and Innovation. Sustainability 2020, 12, 347. [Google Scholar] [CrossRef] [Green Version]
  11. Moeuf, A.; Pellerin, R.; Lamouri, S.; Tamayo-Giraldo, S.; Barbaray, R. The industrial management of SMEs in the era of Industry 4.0. Int. J. Prod. Res. 2018, 56, 1118–1136. [Google Scholar] [CrossRef] [Green Version]
  12. Bag, S.; Gupta, S.; Kumar, S. Industry 4.0 adoption and 10R advance manufacturing capabilities for sustainable development. Int. J. Prod. Econ. 2021, 231, 107844. [Google Scholar] [CrossRef]
  13. Kumar, R.; Singh, R.K.; Dwivedi, Y.K. Application of industry 4.0 technologies in SMEs for ethical and sustainable operations: Analysis of challenges. J. Clean. Prod. 2020, 275, 124063. [Google Scholar] [CrossRef] [PubMed]
  14. Poor, P.; Basl, J. Czech republic and processes of industry 4.0 implementation. Ann. DAAAM Proc. Int. DAAAM Symp. 2018, 29, 454–459. [Google Scholar]
  15. EUR-Lex. A Digital Agenda for Europe. Available online: https://eur-lex.europa.eu/legal-content/EN/TXT/PDF/?uri=CELEX:52010DC0245&from=en (accessed on 20 February 2022).
  16. EUR-Lex. European Broadband: Investing in Digitally Driven Growth. Available online: https://eur-lex.europa.eu/legal-content/EN/TXT/HTML/?uri=LEGISSUM:si0017&from=EN (accessed on 20 February 2022).
  17. EUR-Lex. Towards a Thriving Data-Driven Economy. Available online: http://eur-lex.europa.eu/legal-content/EN/TXT/?uri=COM%3A2014%3A0442%3AFIN (accessed on 20 February 2022).
  18. EUR-Lex. The EU’s New Digital Single Market. Strategy. Available online: http://eur-lex.europa.eu/legal-content/EN/TXT/?uri=legissum:3102_3 (accessed on 20 February 2022).
  19. EUR-Lex. Building a European Data Economy. Available online: https://eur-lex.europa.eu/legal-content/EN/TXT/?qid=1521790097276&uri=CELEX:52017DC0009 (accessed on 20 February 2022).
  20. EUR-Lex. Information Society. Available online: http://eur-lex.europa.eu/summary/chapter/information_society.html?root_default=SUM_1_CODED%3D31&locale=en#s_1244 (accessed on 20 February 2022).
  21. European Commission. The Age of Artificial Intelligence: Towards a European Strategy for Human-Centric Machines. Available online: https://ec.europa.eu/jrc/communities/en/node/1286/document/age-artificial-intelligence-towards-european-strategy-human-centric-machines (accessed on 20 February 2022).
  22. The Digital Europe Programme. Available online: https://digital-strategy.ec.europa.eu/en/activities/digital-programme (accessed on 20 February 2022).
  23. Bouwman, H.; Nikou, S. Digitalization, business models, and SMEs: How do business model innovation practices improve performance of digitalizing SMEs? Telecommun. Policy 2019, 43, 101828. [Google Scholar] [CrossRef]
  24. Ghobakhloo, M.; Ching, N.T. Adoption of digital technologies of smart manufacturing in smes. J. Ind. Inf. Integr. 2019, 16, 100107. [Google Scholar] [CrossRef]
  25. Gillani, F.; Chatha, K.A.; Sadiq Jajja, M.S.; Farooq, S. Implementation of digital manufacturing technologies: Antecedents and consequences. Int. J. Prod. Econ. 2020, 229, 107748. [Google Scholar] [CrossRef]
  26. Türkeș, M.C.; Oncioiu, I.; Aslam, H.D.; Marin-Pantelescu, A.; Topor, D.I.; Căpușneanu, S. Drivers and Barriers in Using Industry 4.0: A Perspective of SMEs in Romania. Processes 2019, 7, 153. [Google Scholar] [CrossRef] [Green Version]
  27. Basl, J. Pilot study of readiness of Czech companies to implement the principles of industry 4.0. Manag. Prod. Eng. Rev. 2017, 8, 3–8. [Google Scholar] [CrossRef] [Green Version]
  28. Nikolova-Alexieva, V.; Bogdanova Mihova, T. Measuring the level of digital maturity of Bulgarian industrial enterprises. Int. Sci. J. Ind. 4.0 2019, 4, 258–264. [Google Scholar]
  29. Castelo-Branco, I.; Cruz-Jesus, F.; Oliveira, T. Assessing industry 4.0 readiness in manufacturing: Evidence for the European union. Comput. Ind. 2019, 107, 22–32. [Google Scholar] [CrossRef]
  30. Commission Recommendation of 6 May 2003 Concerning the Definition of Micro, Small and Medium-Sized Enterprises (Notified under Document Number C(2003) 1422) (OJ L 124, 20.5.2003). 2003. Available online: https://eur-lex.europa.eu/legal-content/EN/TXT/?uri=CELEX:32003H0361 (accessed on 3 March 2022).
  31. Glossary of Summaries—Small and Medium-Sized Enterprises. Available online: https://eur-lex.europa.eu/summary/glossary/sme.html (accessed on 20 February 2022).
  32. Annual Report on European SMEs 2020/2021. Available online: https://www.ggb.gr/sites/default/files/basic-page-files/SME%20Annual%20Report%20-%202021.pdf (accessed on 20 February 2022).
  33. An SME Strategy for a Sustainable and Digital Europe. Available online: https://ec.europa.eu/info/sites/default/files/communication-sme-strategy-march-2020_en.pdf (accessed on 20 February 2022).
  34. Booth, A.; Papaioannou, D.; Sutton, A. Systematic Approaches to a Successful Literature Review; Sage Publications: London, UK, 2012. [Google Scholar]
  35. Herkommer, O.; Kauffmann, M.; Hieble, K. Erfolg der Produktion von morgen: Transparenz, Durchgängigkeit und die Integration aller Ebenen. Succes of the production of tomorrow. ZWF Z. Fuer Wirtsch. Fabr. 2014, 109, 153–158. [Google Scholar]
  36. Cotrino, A.; Sebastián, M.A.; González-Gaya, C. Industry 4.0 Roadmap: Implementation for Small and Medium-Sized Enterprises. Appl. Sci. 2020, 10, 8566. [Google Scholar] [CrossRef]
  37. Frank, A.G.; Dalenogare, L.S.; Ayala, N.F. Industry 4.0 technologies: Implementation patterns in manufacturing companies. Int. J. Prod. Econ. 2019, 210, 15–26. [Google Scholar] [CrossRef]
  38. Liebrecht, C.; Kandler, M.; Lang, M.; Schaumann, S.; Stricker, N.; Wuest, T.; Lanza, G. Decision support for the implementation of Industry 4.0 methods: Toolbox, Assessment and Implementation Sequences for Industry 4.0. J. Manuf. Syst. 2021, 58, 412–430. [Google Scholar] [CrossRef]
  39. Müller, J.M.; Voigt, K.I. Sustainable Industrial Value Creation in SMEs: A Comparison between Industry 4.0 and Made in China 2025. Int. J. Precis. Eng. Manuf.-Green Tech. 2018, 5, 659–670. [Google Scholar] [CrossRef] [Green Version]
  40. Hamidi, S.R.; Aziz, A.A.; Shuhidan, S.M.; Aziz, A.A.; Mokhsin, M. SMEs Maturity Model Assessment of IR4.0 Digital Transformation. In Proceedings of the 7th International Conference on Kansei Engineering and Emotion Research 2018. KEER 2018; Lokman, A., Yamanaka, T., Lévy, P., Chen, K., Koyama, S., Eds.; Advances in Intelligent Systems and Computing; Springer: Singapore, 2018; Volume 739. [Google Scholar]
  41. Mittal, S.; Khan, M.A.; Romero, D.; Wuest, T. A critical review of smart manufacturing & Industry 4.0 maturity models: Implications for small and medium-sized enterprises (SMEs). J. Manuf. Syst. 2018, 49, 194–214. [Google Scholar]
  42. Mittal, S.; Romero, D.; Wuest, T. Towards a Smart Manufacturing Maturity Model for SMEs (SM3E). Advances in Production. Manag. Syst. Smart Manuf. Ind. 2018, 4, 155–163. [Google Scholar]
  43. Orzes, G.; Rauch, E.; Bednar, S.; Poklemba, R. Industry 4.0 implementation barriers in small and medium sized enterprises: A focus group study. In Proceedings of the 2018 IEEE International Conference on Industrial Engineering and Engineering Management (IEEM), Bangkok, Thailand, 16–19 December 2018; pp. 1348–1352. [Google Scholar]
  44. Rauch, E.; Matt, D.T.; Brown, C.A.; Towner, W.; Vickery, A.; Santiteerakul, S. Transfer of industry 4.0 to small and medium sized enterprises. Adv. Transdisc. Eng. 2018, 7, 63–71. [Google Scholar]
  45. Sevinç, A.; Gür, Ş.; Eren, T. Analysis of the Difficulties of SMEs in Industry 4.0 Applications by Analytical Hierarchy Process and Analytical Network Process. Processes 2018, 6, 264. [Google Scholar] [CrossRef] [Green Version]
  46. Brozzi, R.; Riedl, M.; Matta, D. Key Readiness Indicators To Assess The Digital Level of Manufacturing SMEs. Procedia CIRP 2021, 96, 201–206. [Google Scholar] [CrossRef]
  47. Genest, M.C.; Gamache, S. Prerequisites for the implementation of Industry 4.0 in manufacturing SMEs. Procedia Manuf. 2020, 51, 1215–1220. [Google Scholar] [CrossRef]
  48. Lassnig, M.; Müller, J.M.; Klieber, K.; Zeislerand, A.; Schirl, M. A digital readiness check for the evaluation of supply chain aspects and company size for Industry 4.0. J. Manuf. Technol. Manag. 2021, 33, 1–18. [Google Scholar] [CrossRef]
  49. Pirola, F.; Cimini, C.; Pinto, R. Digital readiness assessment of Italian SMEs: A case-study research. J. Manuf. Technol. Manag. 2020, 31, 1045–1083. [Google Scholar] [CrossRef]
  50. Azevedo, A.; Almeida, A.H. Grasp the Challenge of Digital Transition in SMEs—A Training Course Geared towards. Decis.-Mak. Educ. Sci. 2021, 11, 151. [Google Scholar]
  51. Christensen, C.; Schmitt, M.K.; Larsen, M.S.S.; Heidemann Lassen, A. The Effect of Digital Maturity on Strategic Approaches to Digital Transformation. In Towards Sustainable Customization: Bridging Smart Products and Manufacturing Systems. CARV 2021, MCPC 2021; Andersen, A.L., Andersen, R., Brunoe, T.D., Larsen, M.S.S., Nielsen, K., Napoleone, A., Kjeldgaard, S., Eds.; Lecture Notes in Mechanical Engineering; Springer: Cham, Switzerland, 2022. [Google Scholar]
  52. Cognet, B.; Pernot, J.P.; Rivest, L.; Danjou, C.; Wuest, T.; Kärkkäinen, H.; Lafleur, M. Towards a Novel Comparison Framework of Digital Maturity Assessment Models. In Product Lifecycle Management in the Digital Twin Era. PLM 2019; Fortin, C., Rivest, L., Bernard, A., Bouras, A., Eds.; IFIP Advances in Information and Communication Technology; Springer: Berlin, Germany, 2019; Volume 565. [Google Scholar]
  53. Garzoni, A.; De TuriSecundo, G.I.; Del Vecchio, P. Fostering digital transformation of SMEs: A four levels approach. Manag. Decis. 2020, 58, 1543–1562. [Google Scholar] [CrossRef]
  54. Sassanelli, C.; Panetto, H.; Guédria, W.; Terzi, S.; Doumeingts, G. Towards a reference model for configuring services portfolio of digital innovation hubs: The ETBSD model. In Proceedings of the 21st IFIP/SOCOLNET Working Conference on Virtual Enterprises, PRO-VE 2020, Valencia, Spain, 23–25 November 2020; pp. 597–607. [Google Scholar]
  55. Verhovnik, J.; Duh, E.S. The importance of industry 4.0 and digital transformation for SMEs. Elektroteh. Vestn. 2021, 88, 147–149. [Google Scholar]
  56. Cunha, L.; Sousa, C. A Model for Designing SMES’ Digital Transformation Roadmap. In Trends and Applications in Information Systems and Technologies. WorldCIST 2021; Rocha, Á., Adeli, H., Dzemyda, G., Moreira, F., Ramalho Correia, A.M., Eds.; Advances in Intelligent Systems and Computing; Springer: Cham, Switzerland, 2021. [Google Scholar]
  57. Schumacher, A.; Erol, S.; Sihn, W. A maturity approach for assessing Industry 4.0 readiness and maturity of manufacturing enterprises. Procedia Cirp. 2016, 52, 161–166. [Google Scholar] [CrossRef]
  58. Pacchini, A.P.T.; Lucatoa, W.C.; Facchini, F.; Mummolo, G. The degree of readiness for the implementation of Industry 4.0. Comput. Ind. 2019, 113, 103125. [Google Scholar] [CrossRef]
  59. Kljajić Borštnar, M.; Pucihar, A. Multi-Attribute Assessment of Digital Maturity of SMEs. Electronics 2021, 10, 885. [Google Scholar] [CrossRef]
  60. Jung, K.; Kulvatunyou, B.; Choi, S.; Brundage, M.P. An Overview of a Smart Manufacturing System Readiness Assessment. IFIP-Adv. Inf. Commun. Technol. 2016, 488, 705–712. [Google Scholar]
  61. Rockwellautomation: The Connected Enterprise Maturity Model. 2014. Available online: https://literature.rockwellautomation.com/idc/groups/literature/documents/wp/cie-wp002_-en-p.pdf (accessed on 20 February 2022).
  62. Lichtblau, K.; Stich, V.; Bertenrath, R.; Blum, M.; Bleider, M.; Millack, A.; Schmitt, K.; Schmitz, E.; Schröter, M. IMPULS-Industrie 4.0-Readiness; Impuls-Stiftung des VDMA: Stuttgart, Germany, 2015. [Google Scholar]
  63. PwC. Price Water House Coopers: The Industry 4.0/Digital Operations Self Assessment. 2016. Available online: https://i40-self-assessment.pwc.de/i40/landing/ (accessed on 20 February 2022).
  64. Leyh, C.; Schäffer, T.; Bley, K.; Forstenhäusler, S. SIMMI 4.0—A Maturity Model for Classifying the Enterprise-wide IT and Software. Landscape Focusing on Industry 4.0. Proc. Fed. Conf. Comput. Sci. Inf. Syst. 2016, 8, 1297–1302. [Google Scholar]
  65. Oleśków-Szłapka, J.; Stachowiak, A. The Framework of Logistics 4.0 Maturity Model. In Intelligent Systems in Production Engineering and Maintenance. ISPEM 2018; Burduk, A., Chlebus, E., Nowakowski, T., Tubis, A., Eds.; Advances in Intelligent Systems and Computing; Springer: Cham, Switzerland, 2019; Volume 835. [Google Scholar]
  66. Lee, J.; Jun, S.; Chang, T.-W.; Park, J. A Smartness Assessment Framework for Smart Factories Using Analytic Network Process. Sustainability 2017, 9, 794. [Google Scholar] [CrossRef] [Green Version]
  67. Veza, I.; Crnjac, M.; Mladineo, M. The Croatian model of Innovative smart Enterprise for Different Sizes of Enterprise. 18th International Conference on Applied Mechanics and Mechanical Engineering. Available online: https://amme.journals.ekb.eg/article_34996_11ed4bd537135288df5f25089c1147e2.pdf (accessed on 20 February 2022).
  68. Akdil, K.Y.; Ustundag, A.; Cevikcan, E. Maturity and Readiness Model for Industry 4.0 Strategy. In Industry 4.0: Managing The Digital Transformation; Springer Series in Advanced Manufacturing; Springer: Cham, Switzerland, 2018. [Google Scholar]
  69. Scremin, L.; Armellini, F.; Brun, A.; Solar-Pelletier, L.; Beaudry, C. Towards a framework for assessing the maturity of manufacturing companies in industry 4.0 adoption. In Analyzing the Impacts of Industry 4.0 in Modern Business Environments; IGI Global: Hershey, PA, USA, 2018; pp. 224–254. [Google Scholar]
  70. Ganzarain, J.; Errasti, N. Three Stage Maturity Model in SME’s towards Industry 4.0. J. Ind. Eng. Manag. 2016, 9, 1119–1128. [Google Scholar] [CrossRef]
  71. Schneider, P. Managerial challenges of Industry 4.0: An empirically backed research agenda for a nascent field. Rev. Manag. Sci. 2018, 12, 3, 803–848. [Google Scholar] [CrossRef]
  72. West, J.; Lakhani, K.R. Getting clear about communities in open innovation. Ind. Innov. 2008, 15, 223–231. [Google Scholar] [CrossRef]
  73. Dahlander, L.; Gann, D.M. How open is innovation? Res. Policy 2010, 39, 699–709. [Google Scholar] [CrossRef]
  74. Narula, R. R&D collaboration by SMEs: New opportunities and limitations in the face of globalisation. Technovation 2004, 25, 153–161. [Google Scholar]
  75. Ingaldi, M.; Ulewicz, R. Problems with the Implementation of Industry 4.0 in Enterprises from the SME Sector. Sustainability 2020, 12, 217. [Google Scholar] [CrossRef] [Green Version]
  76. Horváth, D.; Szabó, R.Z. Driving forces and barriers of Industry 4.0: Do multinational and small and medium-sized companies have equal opportunities? Technol. Forecast. Soc. Chang. 2019, 146, 119–132. [Google Scholar] [CrossRef]
  77. Müller, J.M.; Buliga, O.; Voigt, K.I. Fortune favors the prepared: How SMEs approach business model innovations in Industry 4.0. Technol. Forecast. Soc. Chang. 2018, 132, 2–17. [Google Scholar] [CrossRef]
  78. Tortorella, G.L.; Fettermann, D. Implementation of Industry 4.0 and lean production in Brazilian manufacturing companies. Int. J. Prod. Res. 2017, 56, 8, 2975–2987. [Google Scholar] [CrossRef]
  79. Leiponen, A.; Helfat, C.E. Innovation objectives, knowledge sources, and the bene-fits of breadth. Strateg. Manag. J. 2010, 31, 224–236. [Google Scholar] [CrossRef] [Green Version]
  80. Nguyen, T.H.; Newby, M.; Macaulay, M.J. Information technology adoption in small business: Confirmation of a proposed framework. J. Small Bus. Manag. 2015, 53, 207–227. [Google Scholar] [CrossRef]
  81. Agostini, L.; Filippini, R. Organizational and managerial challenges in the path toward Industry 4.0. Eur. J. Innov. Manag. 2019, 22, 406–421. [Google Scholar] [CrossRef]
  82. Eurostat Database. Available online: https://ec.europa.eu/eurostat/web/main/data/database (accessed on 10 January 2022).
  83. Daszykowski, M.; Walczak, B. Analiza czynników głównych i inne metody eksploracji danych. In Chemometria w Analityce; Zuba, D., Parczewski, A., Eds.; IES: Kraków, Poland, 2008. [Google Scholar]
  84. Keshavarz Ghorabaee, M.; Amiri, M.; Zavadskas, E.K.; Turskis, Z.; Antucheviciene, J. Stochastic EDAS method for multi-criteria decision-making with normally distributed data. J. Intell. Fuzzy Syst. 2017, 33, 1627–1638. [Google Scholar] [CrossRef]
  85. Abdi, H. Kendall rank correlation. In Encyclopedia of Measurement and Statistics; Salkind, W.N.J., Ed.; Sage: Thousand Oaks, CA, USA, 2007. [Google Scholar]
  86. Kaiser, H.F. The application of electronic computers to factor analysis. Educ. Psychol. Meas. 1960, 20, 141–151. [Google Scholar] [CrossRef]
  87. Gower, J.C.; Le Roux, N.C.; Gardner-Lubbe, S. Understanding Biplots; John Wiley&Sons, Ltd.: Hoboken, NJ, USA, 2011. [Google Scholar]
  88. DESI. The Digital Economy and Society Index. 2021. Available online: https://digital-strategy.ec.europa.eu/en/policies/desi (accessed on 20 February 2022).
  89. Ozekicioglu, S.; Yetiz, F. Financial Supports Provided to SMEs Within the Context of the European Union’s Budget. In Handbook of Research on Social and Economic Development in the European Union; 2020; Available online: https://www.igi-global.com/chapter/financial-supports-provided-to-smes-within-the-context-of-the-european-unions-budget/242879 (accessed on 20 February 2022).
  90. Laitsou, E.; Kargas, A.; Varoutas, D. Digital Competitiveness in the European Union Era: The Greek Case. Economies 2020, 8, 85. [Google Scholar] [CrossRef]
  91. Trașcă, D.L.; Ștefan, G.M.; Sahlian, D.N.; Hoinaru, R.; Șerban-Oprescu, G.-L. Digitalization and Business Activity. The Struggle to Catch Up in CEE Countries. Sustainability 2019, 11, 2204. [Google Scholar] [CrossRef] [Green Version]
  92. Endrődi-Kovács, V.; Stukovszky, T. The adoption of industry 4.0 and digitalisation of Hungarian SMEs. Soc. Econ. 2021, 44, 138–158. [Google Scholar] [CrossRef]
  93. Mićić, L. Digital transformation and its influence on GDP. Economics 2017, 5, 135–147. [Google Scholar] [CrossRef] [Green Version]
  94. Demirkan, I.; Srinivasan, R.; Nand, A.A. Innovation in SMEs: The role of employee training in German SMEs. J. Small Bus. Enterp. Dev. 2021. [Google Scholar] [CrossRef]
  95. Yu, F.; Shi, Y.; Wang, T. R&D investment and Chinese manufacturing SMEs’ corporate social responsibility: The moderating role of regional innovative milieu. J. Clean. Prod. 2020, 258, 120840. [Google Scholar]
  96. Petruzzelli, A.M.; Murgia, G.; Parmentola, A. How can open innovation support SMEs in the adoption of I4.0 technologies? An empirical analysis. R&D Manag. 2021. [Google Scholar] [CrossRef]
  97. Santoro, G.; Vrontis, D.; Thrassou, A.; Dezi, L. The Internet of Things: Building a knowledge management system for open innovation and knowledge management capacity. Technol. Forecast. Soc. Chang. 2018, 136, 347–354. [Google Scholar] [CrossRef]
  98. Draghici, A.; Baban, C.-F.; Gogan, M.-L.; Ivascu, L.-V. A Knowledge Management Approach for The University-industry Collaboration in Open Innovation. Procedia Econ. Financ. 2015, 23, 23–32. [Google Scholar] [CrossRef] [Green Version]
  99. Urbinati, A.; Chiaroni, D.; Chiesa, V.; Frattini, F. The role of digital technologies in open innovation processes: An exploratory multiple case study analysis. R&D Manag. 2020, 50, 136–160. [Google Scholar] [CrossRef]
  100. Peltier, J.W.; Zhao, Y.; Schibrowsky, J.A. Technology adoption by small businesses: An exploratory study of the interrelationships of owner and environmental factors. Int. Small Bus. J. 2012, 30, 406–431. [Google Scholar] [CrossRef]
  101. Albats, E.; Podmetina, D.; Vanhaverbeke, W. Open innovation in SMEs: A process view towards business model innovation. J. Small Bus. Manag. 2021. [Google Scholar] [CrossRef]
  102. Valdez-Juárez, L.E.; Castillo-Vergara, M. Technological Capabilities, Open Innovation, and Eco-Innovation: Dynamic Capabilities to Increase Corporate Performance of SMEs. J. Open Innov. Technol. Mark. Complex. 2021, 7, 8. [Google Scholar] [CrossRef]
  103. Ryu, D.; Baek, K.H.; Yoon, J. Open Innovation with Relational Capital, Technological Innovation Capital, and International Performance in SMEs. Sustainability 2021, 13, 3418. [Google Scholar] [CrossRef]
  104. Yoon, B.; Shin, J.; Lee, S. Open Innovation Projects in SMEs as an Engine for Sustainable Growth. Sustainability 2016, 8, 146. [Google Scholar] [CrossRef] [Green Version]
  105. Colombo, M.G.; Piva, E.; Rossi-Lamastra, C. Open innovation and within-industry diversification in small and medium enterprises: The case of open source software firms. Res. Policy 2014, 43, 891–902. [Google Scholar] [CrossRef]
  106. Stanisławski, R. Open Innovation as a Value Chain for Small and Medium-Sized Enterprises: Determinants of the Use of Open Innovation. Sustainability 2020, 12, 3290. [Google Scholar] [CrossRef] [Green Version]
Figure 1. Number of SMEs in EU-27 countries (in 2021).
Joitmc 08 00067 g001
Figure 2. Annual scientific production in the field of Industry 4.0 and SMEs (as of 12 January 2022).
Joitmc 08 00067 g002
Figure 3. The cloud of keywords most frequently cited by the authors of the presented studies.
Joitmc 08 00067 g003
Figure 4. A scatter plot in exploratory factor analysis.
Joitmc 08 00067 g004
Figure 5. The scatter plot of factor loadings of variables for the first three principal components (a) and the scatter plots of countries in the space of three principal components (b).
Joitmc 08 00067 g005aJoitmc 08 00067 g005b
Figure 6. The standardized biplot for indicators characterizing the digital maturity of SMEs in the EU-27 for the first two principal components (a), for the second and third principal components (b), and for the first and third principal components (c).
Joitmc 08 00067 g006aJoitmc 08 00067 g006b
Figure 7. The weight values of SME digital maturity indicators determined by the entropy method.
Joitmc 08 00067 g007
Figure 8. The level of the EU countries in terms of digital maturity of SMEs (own elaboration).
Joitmc 08 00067 g008
Figure 9. The relationship between the GDP of the EU-27 countries and the value of digital maturity index of their SMEs.
Joitmc 08 00067 g009
Figure 10. The relationship between GDP per capita of the EU-27 countries and the value of digital maturity index of their SMEs.
Joitmc 08 00067 g010
Figure 11. The relationship between selected economic parameters of the EU-27 economies and the value of the digital maturity index of their SMEs ((a)—gross domestic expenditure on R&D, million EUR; (b)—gross domestic expenditure on R&D, EUR per inhabitant).
Joitmc 08 00067 g011
Table 1. Summary of models to determine the digital maturity of enterprises.
Maturity/Readiness ModelsSource
A maturity model for Industry 4.0 Readiness[57]
The Degree of readiness for the implementation of Industry 4.0[58]
The multi-attribute mode[59]
An Overview of a Smart Manufacturing System Readiness Assessment[60]
The Connected Enterprise Maturity Model[61]
IMPULS—Industry 4.0 readiness[62]
Digital readiness for Industry 4.0[63]
SIMMI 4.0[64]
Towards a Smart Manufacturing Maturity Model for SMEs[41]
The Logistics 4.0 Maturity Model[65]
A Smartness Assessment Framework for Smart Factories Using Analytic Network Process[66]
Croatian Model of Innovative Smart Enterprise (HR-ISE model)[67]
Maturity and Readiness Model for Industry 4.0[68]
AMM (Adoption Maturity Model)[69]
Three Stage Maturity Model in SME’s[70]
Table 2. The list of indicators characterizing the level of SME digitalization in the EU-27 countries.
AreaIndicatorMarking
Integration of internal processesEnterprises that have ERP software package to share information between different functional areasX1
Integration with customers/suppliersEnterprises sending eInvoices, suitable for automated processingX2
Cloud computingPurchase of cloud computing services used over the internetX3
Big data analysisAnalysis of big data from smart devices or sensorsX4
3D printingUse of 3D printingX5
RoboticsUse of robots (industrial/service)X6
Internet of ThingsUse of interconnected devices or systems that can be monitored or remotely controlled via the internetX7
Artificial intelligence (AI)Enterprises using the AI technologiesX8
CybersecurityICT security measure used: Virtual Private Network (VPN)X9
Digital skills (ICT training)Enterprises that provide training to develop/upgrade ICT skills of their personnelX10
WebsiteEnterprises with a websiteX11
Table 3. Basic static parameters of studied variables.
IndicatorAverageMedianMinMaxVarianceStandard DeviationCoefficient of VariationSkewnessKurtosis
X135.4135.0016.0056.00110.1010.4929.63−0.05−0.66
X229.4121.009.0095.00527.4022.9778.091.601.87
X342.0039.0012.0075.00300.5417.3441.280.29−0.71
X411.568.002.0029.0056.647.5365.130.84−0.47
X54.374.001.009.004.092.0246.270.47−0.38
X65.786.002.0012.005.642.3841.110.600.28
X727.2627.0010.0050.0092.359.6135.250.770.55
X87.527.001.0023.0026.875.1868.951.201.72
X939.0438.0014.0061.00158.5812.5932.26−0.05−0.85
X109.339.003.0016.0012.003.4637.120.41−0.35
X1176.2677.0050.0096.00154.3512.4216.29−0.41−0.42
Table 4. Correlation matrix (for significance level p < 0.005).
IndicatorX1X2X3X4X5X6X7X8X9X10X11
X11.000.100.290.400.530.630.280.610.560.560.51
X2 1.000.630.100.350.470.300.350.250.260.40
X3 1.000.540.650.330.430.510.760.740.79
X4 1.000.570.35−0.060.600.760.760.55
X5 1.000.660.290.660.790.750.63
X6 1.000.060.740.520.470.36
X7 1.000.200.300.260.58
X8 1.000.730.710.56
X9 1.000.860.83
X10 1.000.75
X11 1.00
Table 5. Eigenvalues of correlation matrix.
IndicatorEigenvalue% of Total VarianceCumulative EigenvalueCumulative %
X16.2757.046.2757.04
X21.4312.977.7070.01
X31.1310.258.8380.26
X40.928.369.7588.62
X50.373.3310.1191.95
X60.302.7010.4194.65
X70.181.6610.5996.31
X80.171.5910.7797.90
X90.100.9510.8798.86
X100.080.7410.9699.60
X110.040.4011.00100.00
Table 6. The value of the coefficients for the principal components.
IndicatorComponent 1Component 2Component 3
X10.668−0.2650.231
X20.4710.5130.495
X30.8140.386−0.174
X40.719−0.397−0.389
X50.855−0.0750.070
X60.642−0.2760.677
X70.3980.724−0.025
X80.827−0.2490.235
X90.928−0.091−0.241
X100.899−0.117−0.250
X110.8510.310−0.232
Table 7. The results of calculating the basic parameters by the entropy-EDAS method and the value of appraisal score along with a given country’s ranking in terms of SEM digital maturity.
CountriesSPiSNiNSPiNSNiASiRankOld (EU-14)/New (EU-13) Union
Belgium0.360.010.480.980.733UE-14
Bulgaria0.000.470.000.230.1126UE-13
Czech Republic0.060.120.070.810.4417UE-13
Denmark0.740.031.000.950.971UE-14
Germany0.210.050.280.930.607UE-14
Estonia0.120.260.160.570.3718UE-13
Ireland0.160.180.220.710.4616UE-14
Greece0.000.350.000.420.2124UE-14
Spain0.090.090.120.850.4813UE-14
France0.110.130.140.790.4715UE-14
Croatia0.070.080.100.870.4814UE-13
Italy0.270.110.360.820.598UE-14
Cyprus0.090.240.120.610.3719UE-13
Latvia0.010.320.010.470.2423UE-13
Lithuania0.020.220.030.640.3320UE-13
Luxembourg0.140.130.180.790.4912UE-14
Hungary0.000.380.000.380.1925UE-13
Malta0.370.020.490.970.734UE-13
Netherlands0.360.040.480.930.715UE-14
Austria0.130.090.180.850.5211UE-14
Poland0.000.310.000.480.2422UE-13
Portugal0.200.110.270.820.5510UE-14
Romania0.000.610.000.000.0027UE-13
Slovenia0.230.070.300.880.599UE-13
Slovakia0.000.210.000.650.3321UE-13
Finland0.630.000.841.000.922UE-14
Sweden0.280.020.370.970.676UE-14
Table 8. The Kendall’s and Spearman’s tau correlation coefficients.
Tested ParametersTAU KENpSpearman Rankp
GDP, million EUR0.1930.1590.3190.105
GDP per capita, EUR per capita0.6010.0010.7600.001
Business enterprise expenditure on R&D (SMEs), million EUR0.3190.0200.4770.012
Business enterprise expenditure on R&D (SMEs), EUR per inhabitant0.6240.0010.7910.001
Gross domestic expenditure on R&D, million EUR0.3130.0220.4580.016
Gross domestic expenditure on R&D, EUR per inhabitant0.5950.0010.7430.001
Gross domestic expenditure on R&D, % of GDP0.4570.0010.6030.001
Publisher’s Note: MDPI stays neutral with regard to jurisdictional claims in published maps and institutional affiliations.

