Abstract
Given that the ultimate goal of business is performance enhancement, this study approaches the phenomenon by drawing on resource-advantage (R-A) theory to conceptualize a model with the aim of investigating the links among composite operant resources (CORs), namely customer orientation, basic operant resources (BORs), innovative capability, and financial performance across Miles and Snow’s five business strategy types, including prospectors, differentiated defenders, low-cost (LC) defenders, analyzers, and reactors. The scope of this study is firms based in the emerging market of Thailand. A final sample of 395 Thai firms participated in the self-administered survey. Multiple-group structural equation modeling and multivariate analysis of variance (MANOVA) were utilized to test the hypotheses. The results revealed insightful findings that advance the strategy and innovation literature. While business strategy types moderate the proposed relationships, the only one that is uniform across all five types of firms is the positive, strong, and significant customer orientation–innovation capability link. Moreover, customer orientation and innovative capability contribute significantly to financial performance among prospectors and LC defenders. However, only the former is essential to differentiated defenders, analyzers, and reactors. Overall, the findings suggest that managers must pay attention to connections between their chosen business-level strategy, customer-focused resources, and innovation capabilities to generate the best financial performance outcomes for their firms.
1. Introduction
Understanding customers is a key potential input of the “front end of innovation” [1]. Information about buyers can be acquired by firms that adopt a customer orientation, which refers to collecting, processing, and disseminating information regarding customers’ present and future needs and behaviors [2,3]. As such, recent applications of neuroscientific approaches in diagnosing consumers’ behaviors through the emerging research field of neuromarketing have been strongly advocated since they provide major theoretical advancements in understanding consumers [4]. For instance, neuroscience has been used to study consumers’ online buying behaviors [5], to study website designs [6], and to craft marketing strategies such as advertising campaigns [7]. Essentially, customer orientation entails a comprehensive collection of market feedback in order for firms to better serve their customers [8]. To ensure that firms really understand customers’ needs and behaviors, firms are likely to invest in processes that enable customer orientation. These processes also help firms improve relationships with customers and develop pools of both informational and relational assets, which will eventually lead to a competitive advantage. It is believed that through learning and innovation processes, firms can achieve competitive advantages, which ultimately lead to the enhancement of firm performance. Attaining better performance is critical to the survival of firms. Therefore, this study focuses on how firms of different strategy types can improve performance through innovation and customer orientation.
Prior studies have reported that the customer orientation–innovation–performance relationship varies under different organizational and environmental contexts [9,10], thus refuting claims of customer orientation’s ‘universal’ performance-enhancing effects. Furthermore, customer orientation helps strengthen the sequential mediating relationships between agility and innovativeness through helping behavior and knowledge sharing [11]. Matsuno and Mentzer [12] also suggest that the organizational results that a firm realizes by implementing a customer orientation depend on the firm’s implemented business strategy type since the configuration of a particular product-market strategy resource’s deployment and that of customer orientation must be aligned to enhance performance. Despite these findings, the performance implications of customer-oriented and innovation resources of firms pursuing different business-level product-market strategies remain inadequately explored, particularly in emerging market contexts.
Recent extant literature on strategy suggests that improved performance is attained when firms execute resource configurations that match their marketing abilities with the demands of their business strategy [9,13]. Empirical analysis from earlier studies of business strategy and marketing resources and abilities has generally found complementary impacts of product-market strategy and marketing strategy on firm processes and firm performance [14]. Miles and Snow [15] develop a framework of business strategies based on how firms attempt to compete and achieve competitive advantage in their product-market domains, including: (1) prospectors, who continuously identify opportunities for new products and/or markets to develop and exploit; (2) defenders, which tend to secure premium niches in their industries and can be further categorized either as low-cost defenders, who compete by emphasizing cost-efficiency, or as differentiated defenders, who focus on delivering superior product quality and/or service; (3) analyzers, who defend their core markets and products by providing slightly improved and cheaper lines of their newly launched products; and (4) reactors, who lack a consistent strategic outlay, and tend to only respond to environmental pressures when necessary. Thus, the firm’s complex set of resources must be effectively configured in order for marketing capabilities to complement the implementation of the firm’s business strategy [16,17,18].
This study responds to the call for more research that examines new intervening and moderating variables in the link between customer orientation and performance, particularly within dynamic marketing environments [19]. Since there is no prior study that investigates whether the patterns among the customer orientation–innovation capability–firm performance relationships are consistent among firms pursuing different business strategy types, we postulate that the business strategy type moderates the effects among customer orientation, innovation capability, and financial performance. Firstly, we hypothesize and empirically investigate how customer orientation, innovation capability, and firm performance are related across five product-market strategy types, namely prospector, low-cost defender, differentiated defender, analyzer, and reactor, which have been investigated in prior literature (e.g., [20,21]). Secondly, we extend the application of resource-advantage theory to investigate such relationships in a sample of firms operating in an emerging market, namely Thailand. While extensive research regarding firm strategic type, customer orientation, and innovation can be found in the context of Western and developed economies, little is known about firms from emerging economies. Given that Thailand represents one of the major emerging economies in Asia [22], it presents a meaningful research context for this study.
This paper is organized as follows. Section 1 introduces the research, demonstrates the research gap, and highlights the research’s significance. Section 2 discusses the theoretical underpinnings and hypotheses. Section 3 elaborates the research methodologies. Section 4 presents the data analyses and results. Section 5 provides a discussion of the results. Section 6 presents conclusions, research contributions, implications, and future research directions.
2. Theoretical Underpinning and Conceptual Framework
This study adopts resource-advantage (R-A) theory and builds on the extant literature in strategy orientations and marketing strategy to propose a conceptual model and hypotheses about the performance of five product-market strategy types as derived from customer orientation and innovation capability. According to R-A theory, basic resources have properties that are either tangible, such as buildings and machinery, cash, and legal trademarks and licenses; or intangible—including human knowledge and skills, organizational policies and culture, relationships with upstream and downstream partners, and acquired or newly generated information. Some of the tangible resources are considered ‘operand,’ as they are “those on which an act of operation is performed,” whereas resources that are intangible are mostly operant in nature, as they are “those that act on other resources” ([23], p. 67). According to R-A theory, resources can be classified hierarchically. Lower-order resources, such as basic operant resources (BORs), usually result from the configuration and deployment of unique bundles of basic resources. Higher-order resources, such as composite operant resources (CORs), emerge from the integration of various BORs. These CORs are regarded as organizational capabilities or competencies that provide firms with the ability to drive down the costs and/or propose products with superior values [24,25]. Moreover, R-A theory also explicates that capabilities and competencies are derivatives of the complex organizational processes and interactions of basic resources, both tangible and intangible types, over time in order to develop superior market propositions [25]. As such, the terms ‘resources’ and ‘capabilities’ are often used interchangeably [23,26]. In this paper, capabilities refer to operant resources since several ‘operant resources’ are pervasive in an organization but at different hierarchical levels [23,26].
We draw on R-A theory to propose that customer orientation is a higher-order resource, derived from complex interactions among several CORs, instead of a simple composition of different CORs or BORs. Specifically, customer orientation, in this study, is developed as a second-order construct reflected by three first-order constructs that represent: (1) market intelligence (market-sensing capability); (2) customer knowledge development (customer-relating capability); and (3) customer management (customer-response capability) [27].
2.1. Customer Orientation and Innovation Capability
Innovation capability refers to the firm’s capacity to continuously convert knowledge resources and ideas into new products/services and organizational processes for the betterment of the firm [28]. Such innovation is considered a critical element among firms aiming to provide superior value propositions to the markets; therefore, these firms strive to understand customers through acquiring market information so that they can anticipate changes in customers’ needs and behaviors. While an overemphasis on information by being customer-focused or market-driven could lead to merely “me-too”-type incremental innovations, a dual focus on customers, on the one hand, and research and development (i.e., being market-driving), on the other, may enable firms to achieve radical innovations [29]. Being responsive to customers thorough customer-response capability helps firms develop innovations that enhance customer value. Yet, superior customer value creation may encompass not only product innovations, but also business system innovations [30]. Although customer orientation has been found to positively affect administrative and technical innovations [31], the link between customer orientation and innovation is rather complex. For instance, a positive customer orientation–R&D effectiveness relationship is contingent upon the existence of firms with a high knowledge integration level [3]. In this study, we expect that customer-oriented firms tend to be equipped with better market knowledge through capabilities in market sensing, customer relating, and customer response, which will enable them to attain higher levels of innovation capability [11,32].
2.2. Customer Orientation and Business Strategy Configurations
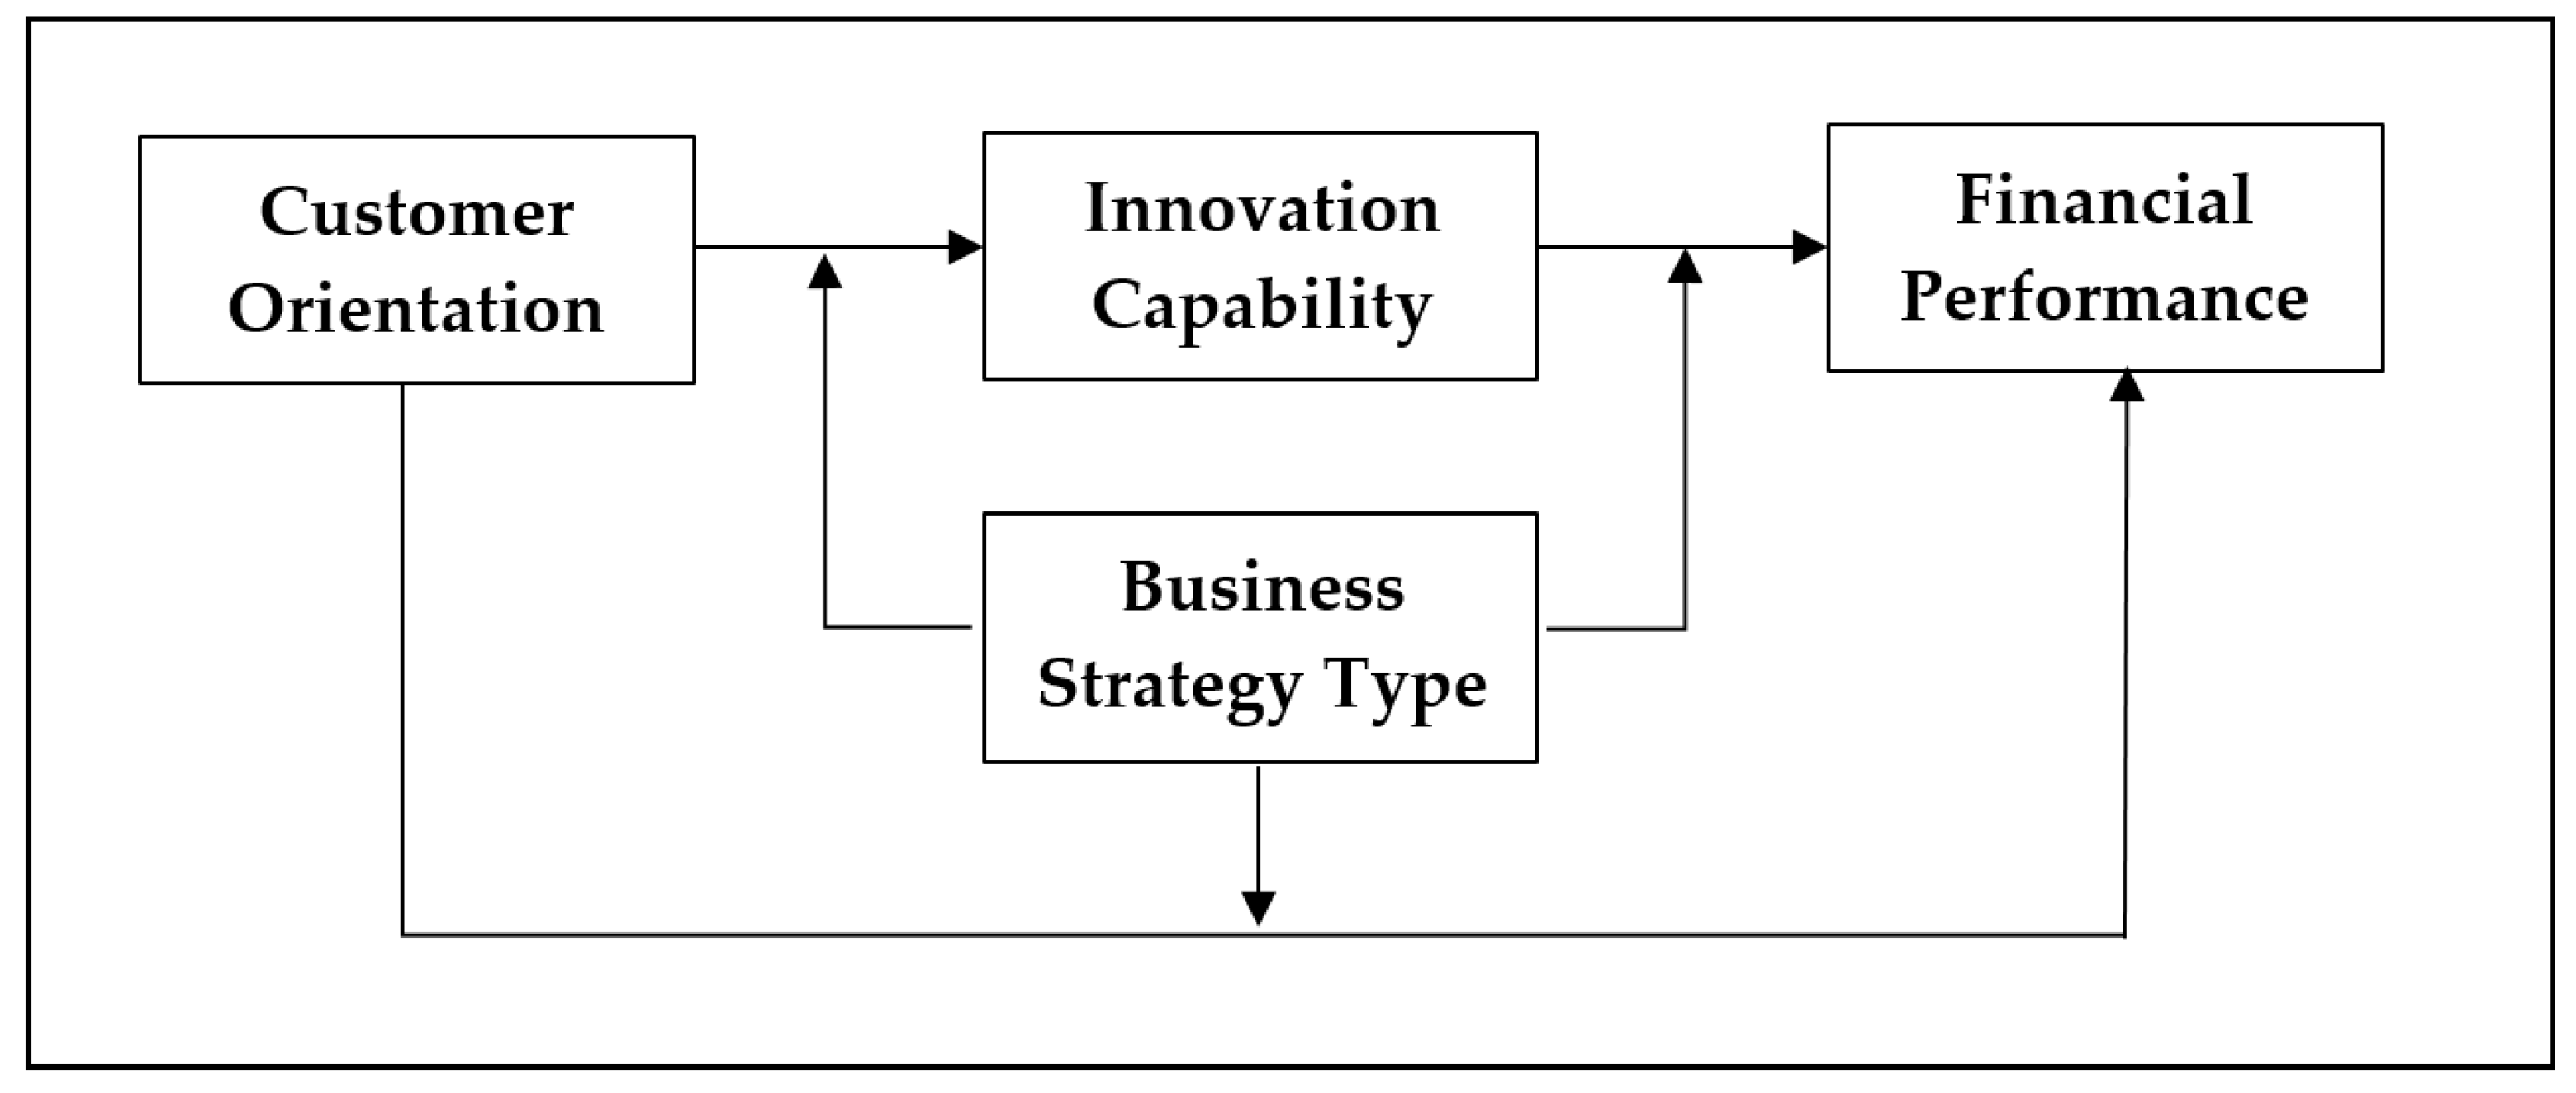
A review of the extant literature suggests strategy types as contingency factors because strategic implementation is a function of how an organization adapts to the business environment [33]. Since Miles and Snow’s five business strategy types are usually led by performance goals, firms pursuing each strategy type seem to follow a planned pattern to adapt to the environment. Therefore, the influence of customer orientation to enhance innovation capabilities and firm performance may also differ based on the business strategy type. This presumption is based on the strategy type literature, which indicates that (1) a firm chooses to pursue a product-market strategy based on its perception of the surrounding business environment, (2) the selected strategy serves as a guide by which the firm allocates its resources, and (3) the firm attempts to excel in specific performance targets [12]. Within this setting, customer-oriented firms tend to be selective in information acquisition and information dissemination in order to attain specific types of performance outcomes. As such, we hypothesize that business strategy type moderates the effects among customer orientation, innovation capability, and financial performance (refer to the conceptual model in Figure 1).
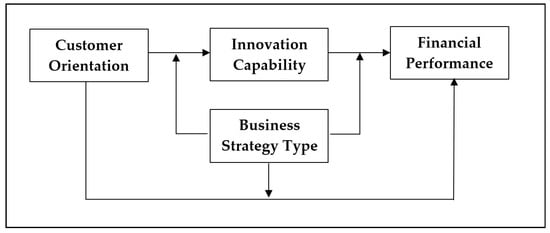
Figure 1.
Conceptual model of the moderating effect of business strategy type on customer orientation–innovation capability–financial performance relationships.
Hypothesis 1.
The relationships among customer orientation, innovation capability, and financial performance are moderated by business strategy type.
2.3. Prospectors, Customer Orientation, Innovation Capability, and Performance
Prospector types are persistent in their quest for market opportunities. New opportunities are recognized through exploration, which may transpire through “outside-in” customer-oriented processes [34] and/or “inside-out” R&D-driven innovation processes [3]. Prospectors experiment with alternative responses to emerging environmental trends [35].
To keep up with environment changes, prospectors must possess an advanced learning capability and marketing capability in order to deploy the market knowledge they have acquired. For the development of new products, prospectors engage in customer learning by observing customers’ use of products and/or services within standard contexts and by collaborating closely with lead users for insights, inspiration, models, and expertise [20]. Therefore, it is anticipated that prospectors possess higher levels of both customer orientation and innovative capability in order to stay at the forefront of competitive terrain.
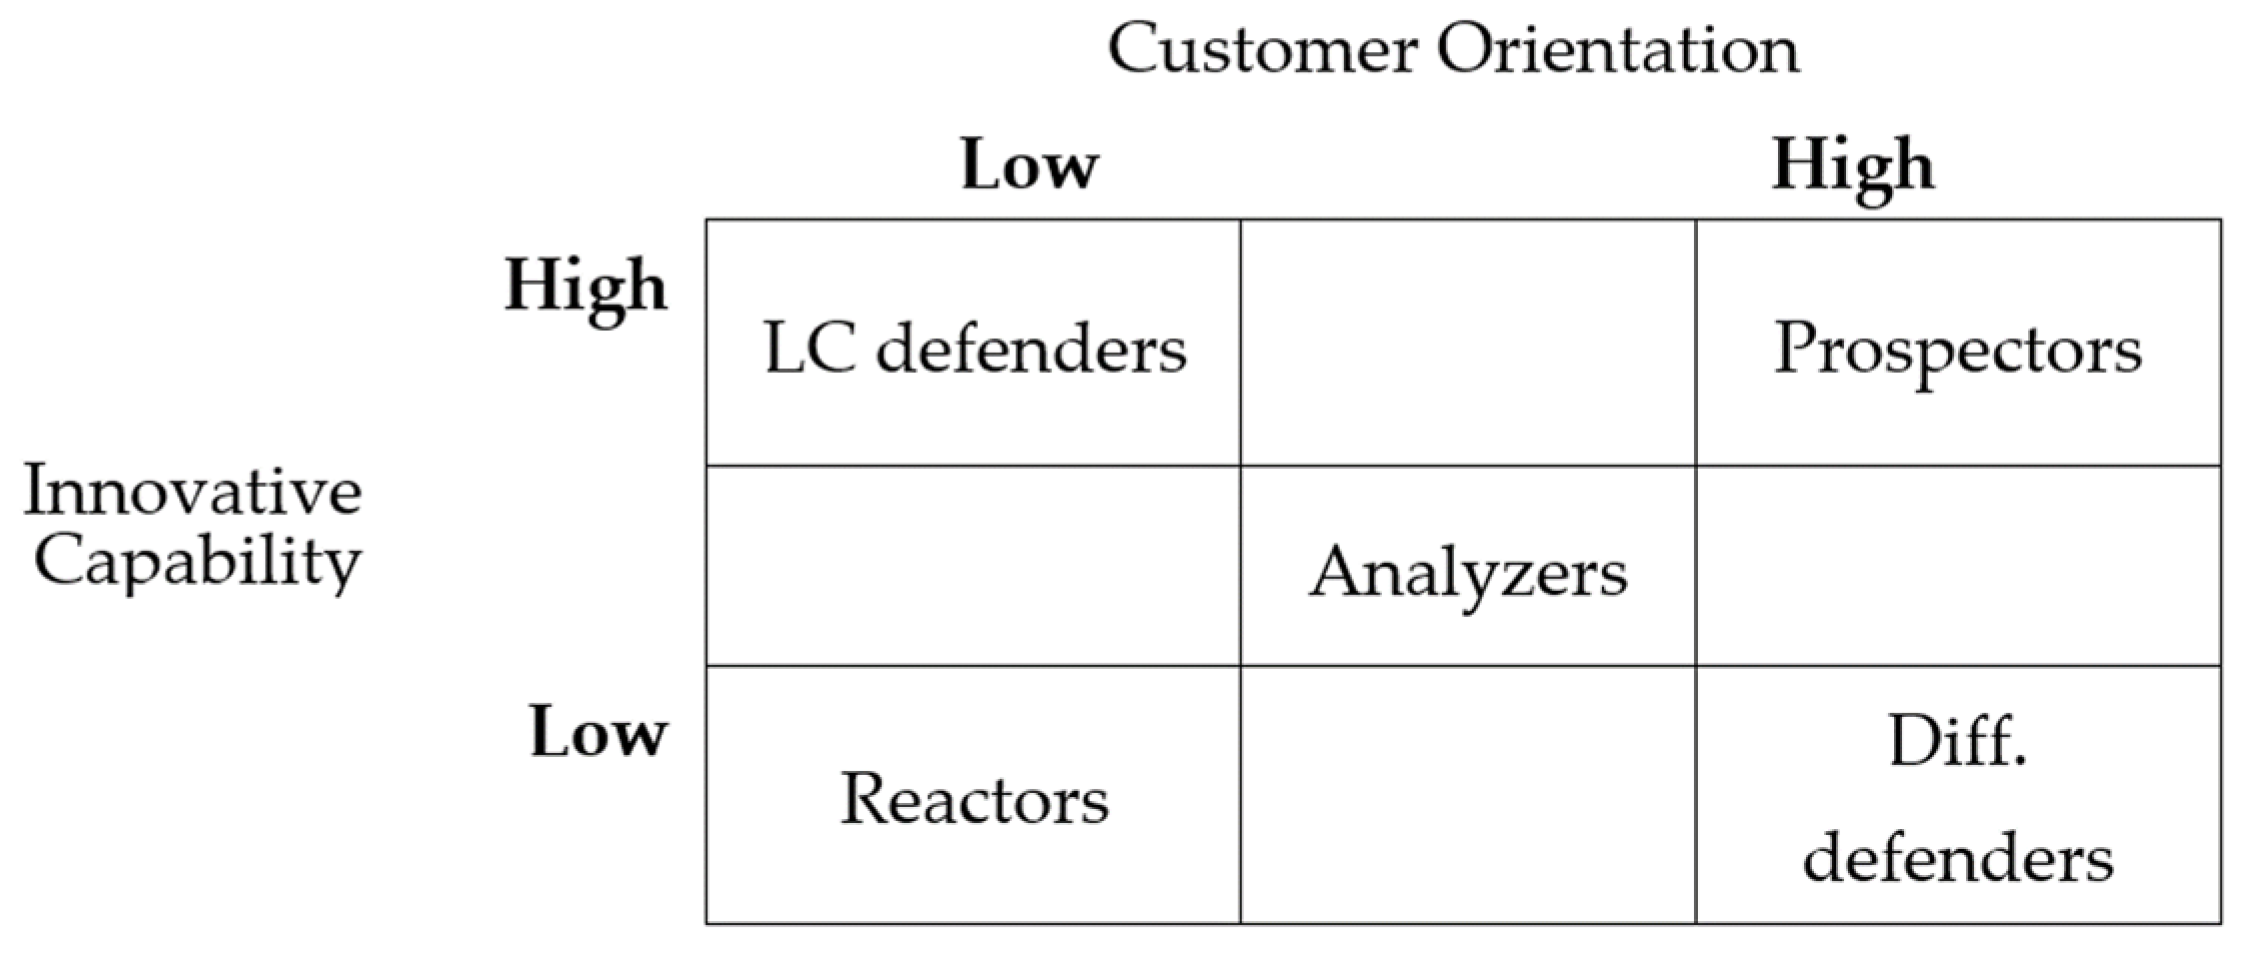
Figure 2 depicts a matrix, combining two types of capabilities along a continuum of low-to-high levels, with the proposed business strategy type. Prospectors should be placed at the bottom-right corner of this grid. Given the aforementioned discussion, our second set of hypotheses can be expressed as follows:

Figure 2.
Customer orientation, innovative capability, business strategy type grid.
Hypothesis 2.
Prospectors will exhibit high levels of customer orientation and innovative capability.
Hypothesis 3.
The relationships among customer orientation, innovative capability, and financial performance will be more pronounced in prospectors, compared to LC defenders, differentiated defenders, analyzers, and reactors.
2.4. Defenders, Customer Orientation, Innovation, and Performance
Views of the capabilities of defender types are not consistent in the literature. For instance, Miles et al. [33] contend that the failure of defenders to sense, relate, and respond to market changes may lead them to rather maintain the organizational status quo amid changes in the surrounding business environment. However, Conant, et al. [36] state that such market-linking capabilities are particularly critical for defenders because such capabilities allow them to detect changes in customers’ needs and prepare necessary responses to thrive and survive in their market territory. Empirical evidence from prior studies is also indicative of the inconsistent capabilities of defender-type firms. For instance, Song, et al. [37] found that defender-type firms in the U.S. and in China have high market-linking and marketing capabilities relative to analyzer, reactor, and prospector types, whereas defenders in Japan do not. With regard to customer orientation, Olson, Slater and Hult [20] report that prosperous defenders, both low-cost and differentiated, exhibit relatively low customer orientation compared to prospectors and analyzers, and compared to other behaviors including internal/cost orientation, innovation orientation, and competitor orientation.
These differences in the findings may lie in the broad range of firms within this defender categorization, which focuses mainly on the SBU’s intended growth rate and neglects other aspects of strategy. For example, low-cost defenders (LC defenders) demonstrate an internal focus on costs, which supersedes their external orientation on the external environment, whereas differentiated defenders compete by offering superior products and/or services [35]. The differences in these two competitive strategies tend to demand different sets of resource utilizations, processes, and programs.
2.4.1. Differentiated Defenders, Customer Orientation, Innovation, and Performance
Differentiated defenders also choose to serve narrow niches that prevail in more stable product or service areas and demonstrate a keen understanding of their customers [35]. The differentiated defender emphasizes customer-oriented behaviors to maintain close relationships with its customers and track changes in customer needs and competitor behaviors in order to satisfy unique needs that only the firm has identified [38], while product or service innovation may not be key activities [9]. Thus, we postulate that:
Hypothesis 4.
Differentiated defenders will exhibit a high level of customer orientation but low level of innovative capability.
2.4.2. Low-Cost Defenders, Customer Orientation, Innovation, and Performance
Low-cost defenders (LC defenders) choose to compete in narrow and stable market domains, with an internal focus on cost control as a means to attract and retain customers by offering prices substantially below those of rival firms. The dominant functions of LC defenders include process engineering, production, distribution, and finance [35]. LC defenders have a limited number of product lines, which are not as technically sophisticated as those of firms pursuing other business strategies. They are also less likely to set high advertising and sales promotion budgets compared to firms of other business strategy types.
Relative to firms of other business strategy types, LC defenders do not invest much in marketing activities [39]. Nevertheless, even a slight allocation of marketing expenditures is still required for survival and performance outcomes. LC defender firms’ primarily focus is on cost reduction; therefore, market or customer orientations may not exert much influence on this type of firms. Moreover, LC defenders tend to pay attention to competitors because they rely on competitors’ pricing strategies as guidelines for their cost-reduction motives and activities [20]. By choosing to compete in a narrow and stable market domain, the LC defender becomes efficient in understanding customer needs, which facilitates market penetration and growth in revenue. Since the primary target customers of LC defenders are price-sensitive, firms of this type tend to rely less on customer-learning or linking capabilities [14]. Unlike firms of other business strategy types, LC defenders’ efficiencies likely stem from process innovations rather than product innovations driven by technological advancements [35]. Hence, it is likely that minimal resources are committed to customer orientation, which will not be influential in the development of LC defenders’ innovation capability and ultimate performance.
Hypothesis 5.
LC defenders will possess a low level of customer orientation but a high level of innovative capability.
2.5. Analyzers, Customer Orientation, Innovation, and Performance
Analyzers are considered the most complex product-market strategy type because they have pursued a dual focus to defend their positions against other types of firms. To compete with prospectors for early adopters, analyzers need to understand the customers in order to preempt the markets. To compete with defender types and other analyzers in a mass market, analyzers attempt to defend the core products and markets that contribute to their entrepreneurial endeavors in generating essential resources [14]. Consequently, analyzers pursue an external focus on competitors as well as on customers to ensure that they convert their understanding of customers into better value propositions at competitive prices and with comparable offerings to outcompete competitors [20]. To learn about competitors and customers, analyzers must have arduous processes for market scanning in order to enhance their market mobility to compete with prospectors when they plan to launch a product innovation or to enter a new market. With their dual focus, analyzers generally have a greater ability to scan the environment, identify new opportunities, and evaluate viable options to compete with prospectors and defend their positions against other analyzers and defenders [36].
Developing marketing and process innovations is essential for analyzers to ensure that the identified opportunities can be successfully captured [15,17]. Hence, the emphases are on both cost reduction and process adaptation capabilities [15,40]. To effectively compete with prospectors, analyzers put priority on organizational effectiveness to ensure that their new product and market developments are parallel to those of prospectors. To efficiently defend against other analyzers and defenders, analyzers focus on productivity and efficiency to ensure the pre-emption of the markets and maintain their competitive positions. Hence, analyzers balance efficiency and effectiveness in developing and implementing strategies. Specifically, innovations at all levels of business are important for analyzers.
Recent empirical studies reveal that analyzers commit to the development of innovation resources more so than prospectors and defenders. For instance, [41] found, from a sample of French manufacturing firms, that analyzers exhibit higher intensities of innovation than do differentiated defenders and prospectors. Given the complex nature of analyzer-type firms, it is postulated that these firms possess both customer orientation and innovative capability at mediocre levels when compared with firms of other business strategy types.
Hypothesis 6.
Analyzers will possess mediocre levels of customer orientation and innovative capability.
Since analyzer-type firms tend to pursue a dual focus to compete with prospectors, defenders, and other analyzers, it is expected that the relationships among customer orientation, innovative capability, and financial performance of analyzers are stronger than those of differentiated and LC defenders. Hence,
Hypothesis 7.
The relationships among customer orientation, innovation capability, and financial performance of analyzers will be stronger than those of differentiated defenders and LC defenders.
2.6. Reactors, Customer Orientation, Innovation Capability, and Performance
Reactor-type firms do not implement a viable or consistent product-market strategy, and instead show a pattern of ad hoc adaptation when they are compelled to respond to environmental changes and pressures [15]. Whether this pursuit is due to reactor unawareness to environmental changes or due to their limited resources and capacity to adapt remains unclear. Nevertheless, due to the fact that reactors typically do not seem to commit to an enduring product-market strategy, some researchers who have examined the relationship between strategy type and organizational processes and/or firm performance have opted to exclude reactor strategy types in their studies [9,20]. Some researchers contend that reactor-type firms are merely identified as the residual groups of the other product-market types (e.g., [42]). There seems to be a general consensus that among the four business strategy types, reactors are the poorest performers, because prospectors, defenders, and analyzers demonstrate consistent behaviors that enable them to build their critical requisite capabilities [43]. Reactors fail to develop the proper mechanisms and processes that are necessary to identify and to react to changes in the environment, and therefore lack adequate adaptive capability [44]. For this reason, we propose that:
Hypothesis 8.
Reactors will possess the lowest levels of customer orientation and innovative capability.
3. Methodology
3.1. Sampling Procedure and Data Collection
Our sample was drawn from a list of firms in the Business Directory of Thailand Chamber of Commerce. A total of 1500 firms were randomly selected and contacted to identify key informants who are responsible for the company’s customers, strategies, and operations. Self-administered questionnaires were utilized to collect responses. The respondents were reminded with two subsequent phone calls after the initial surveys were sent to them. The final number of usable completed questionnaires is 395 (response rate of 26.33%), representing firms from various industries. Table 1 illustrates the distribution of firms in our sample, both total and classified into different strategic types. The average number of years firms operated is 27.2. The number of permanent employees indicated firm size. Firms were classified to either small, medium, or large, based on ASEAN’s (Association of Southeast Asian Nations) definition.

Table 1.
Sample profile.
Given the self-selection nature of survey-based methodology, non-response is inevitable and must be examined. Non-response bias was checked using two approaches [28]. First, we compared the demographic characteristics of response versus non-response firms. Second, we split completed surveys into early- and late-response groups and compared the means of major constructs in this study. Since no significant differences were detected in response and non-response groups or early- and late-response groups, there is no non-response bias. Since all data were collected from a single informant—one of the conditions prone to common-method variance (CMV)—both ex ante and ex post procedures were used to ensure that the CMV could be minimized. As suggested by Podsakoff et al. [45] various scaling techniques were used to obtain data to minimize the potential of CMV, ex ante. After obtaining this data, we used Harman’s one-factor approach to check CMV, ex post. No single factor emerged from the exploratory factor analysis; therefore, CMV is not a concern here.
3.2. Measures
All survey items were based on scales used in prior literature and are reported in Table 2. To measure business strategy type, five descriptions corresponding to each business type were provided to the key informants, who were asked to select the description that best fit their firm. The descriptions were based on the seminal conceptualizations of Miles et al. [33] and Slater and Olson [39]. For customer orientation, we adopted the operationalization of customer orientation (COCAP) from Racela and Thoumrungroje [46], which regards COCAP as a higher-order dynamic capability consisting of the three lower-order capabilities of market-sensing (MKTSENS), customer-relating (CUSTREL), and customer-response (CUSTRES) capabilities. To measure customer orientation (COCAP) and innovation capability (INNOVCAP), we followed the scales developed by Racela and Thoumrungroje [46]. Financial performance (FPERF) was measured on six items based on the operationalization of Thoumrungroje and Racela [47] and Zhu and Nakata [48]. Table 2 elaborates the scale type along with scale assessment. Since the original scales are in English, a back-translation technique was used to ascertain translation equivalence in converting them into Thai.
Table 2.
Scale assessment and CFA results.
3.3. Scale Assessment
We assessed the measurement model using confirmatory factor analyses since our scales are based on prior scales used in the literature. The model achieved acceptable fit well, with chi-square (χ2) of 526.28 (203). The comparative fit index (CFI) of the model is 0.92, with a Tucker–Lewis coefficient (TLI) of 0.91; standardized root mean square residual (SRMR) of 0.06; and root mean square error of approximation (RMSEA) of 0.06, indicating that the model fit the data well [49]. All constructs established reliability and validity since all coefficient alphas are above 0.70, the minimum threshold recommended by Nunnally and Bernstein [50], with all significant standardized factor loadings (p < 0.00) over 0.60. To assess construct reliability, we used composite reliabilities (CR) and average variance extracted (AVE). With CRs above 0.70, and most AVEs above 0.50, all constructs are reliable [49]. Despite the fact that some AVEs are below 0.50, the minimum level recommended by Fornell and Larcker [51], the item-to-total correlations of these constructs are greater than 0.40 and CRs are over 0.70. These are acceptable conditions for scale reliability [52].
We assessed convergent validity through confirmatory factor analyses. With all items significantly loaded to their designated construct (p < 0.00), and the standardized factor loadings (λ’s) above 0.6, convergent validity of every construct was achieved [53]. To check discriminant validity, the square roots of the AVEs were compared to the corresponding correlations with other constructs. Since all square roots are larger than the correlations, except for those between the first-order constructs (MKTSENS, CUSTREL, CUSTRES) and their respective second-order construct of COCAP, the scales established discriminant validity [51]. The higher correlations between COCAP and its first-order components are expected because the first-order constructs should converge into the second-order construct as postulated by the theory; therefore, this does not consider the violation of discriminant validity. In addition, the main construct of interest in this study is COCAP, with the remaining constructs of INNOVCAP and FPERF. The correlations among these main constructs are less than the square roots of their AVEs; hence, all scales achieved discriminant validity [46]. Table 3 reports means, standard deviations (SD), correlations, and square roots of AVEs used for assessing discriminant validity. Overall, all scales are reliable and valid.
Table 3.
Descriptive statistics, correlations, and discriminant validity.
3.4. Control Variables in the Model
In order to minimize endogeneity problems, which could result from potential omission of variables for model estimation, we included control variables as suggested by Bernerth and Aguinis [54]. Moreover, prior studies (e.g., [55]) indicate that firm age and size influence the level of innovation of firms; as such, the inclusion of these two firm characteristics is deemed appropriate. From our results, as reported in Table 4, both firm age and size have no impact across firms.
Table 4.
Unstandardized parameter estimates (with standard errors) of multiple-group analyses.
4. Data Analyses and Results
To test our hypotheses, our data analyses were conducted in two stages: multiple-group path analysis and multivariate analysis of variance (MANOVA). Since our business type is a categorical variable, we used a multiple-group path analysis to test hypotheses 1, 3, and 7, which propose comparing the parameter estimates among customer orientation, innovation capability, and financial performance across different business strategy types. The mediating effect of innovation capability illustrated in the model was tested by the bias-corrected bootstrapping technique. Table 4 reports the results of the study with the total sample of 395 firms (i.e., 122 prospectors; 123 differentiated defenders; 77 LC defenders; 37 analyzers, and 36 reactors). According to the thresholds suggested by Bagozzi and Yi [49], the model provides good fit with a non-significant χ2 of 16.652 (12); goodness of fit index (GFI) of 0.992; confirmatory fit index (CFI) of 0.992; root means square error of estimation (RMSEA) of 0.022; and standardized RMR (SRMR) of 0.024.
Our first hypothesis postulates the moderating role of business type on customer orientation–innovation capability–financial performance relationships. To compare the effect sizes of the hypothesized relationships shown in Figure 1 across multiple business strategy types, unstandardized coefficients are used (see Table 4). From our findings, the link between customer orientation and innovation capability is significant across all business strategy types with the highest-to-lowest effect sizes among reactors ( = 0.77, p < 0.001), analyzers (= 0.68, p < 0.001), differentiated defenders ( = 0.63, p < 0.001), prospectors ( = 0.52 p < 0.001), and LC defenders ( = 0.49, p < 0.001), respectively. However, the relationship between innovation capability and financial performance is only significant in prospectors ( = 0.37, p < 0.01) and LC defenders ( = 0.36, p < 0.001), but not in differentiated defenders ( = 0.03, p > 0.10), analyzers ( = 0.17, p > 0.10), and reactors ( = 0.33, p > 0.10). As such, the direct path between customer orientation and financial performance is also significant across business strategy types, with the highest-to-lowest effect sizes in reactors ( = 0.71, p < 0.01), analyzers ( = 0.69, p < 0.01), differentiated defenders ( = 0.47, p < 0.001), prospectors ( = 0.38, p < 0.01), and LC defenders ( = 0.27, p < 0.01), respectively. The indirect effect (through innovation capability) between customer orientation and firm performance only exists in prospectors ( = 0.19, p < 0.05) and LC defenders ( = 0.18, p < 0.05), but not in differentiated defenders ( = 0.02, p > 0.10), analyzers ( = 0.11, p > 0.10), and reactors ( = 0.29, p > 0.10). With these aforementioned differences in the effect sizes in the proposed relationships across five business strategy types, Hypothesis 1 is supported.
Our third hypothesis postulates that the links among customer orientation, innovation capability, and financial performance are more pronounced in prospectors than the other four business strategy types. Since the unstandardized estimates of (1) the innovation capability–financial performance ( = 0.37, p < 0.01) and (2) the customer orientation–innovation capability–financial performance ( = 0.19, p < 0.01) paths in prospectors are highest across the five business strategy types but not the highest in the remaining paths, we gain only partial support for Hypothesis 3.
Hypothesis 7 expects that relationships among customer orientation, innovation capability, and financial performance to be stronger in analyzers than differentiated defenders and LC defenders. Since the unstandardized estimates of (1) the customer orientation–innovation capability path ( = 0.68, p < 0.001), (2) the direct path between customer orientation and financial performance ( = 0.69, p < 0.01), and (3) the total impact of customer orientation on financial performance ( = 0.80, p < 0.01) of analyzers are higher than those of differentiated defenders and low-cost defender business types, while the other paths are insignificant, Hypothesis 7 is partially supported.
To test the remaining hypotheses, we applied multivariate analysis of variance (MANOVA) to compare the means of customer orientation and innovation capability across five business strategy types. The results indicate significant differences in customer orientation (F-statistics = 4.96, p < 0.01) and innovation orientation (F-statistics = 9.384, p < 0.001) across business strategy types. Therefore, pair-wise comparisons were conducted to identify significant differences between each pair of business strategy types. Table 5 reports the mean comparisons.
Table 5.
Mean comparisons.
Regarding Hypothesis 2, which proposes that prospectors exhibit high levels of both customer orientation and innovation capability, results reveal that the level of customer orientation of prospectors is highest ( = 4.91) but only significantly different from those of analyzers (= 4.51, p < 0.05) and reactors ( = 4.37, p < 0.01). When we scrutinized the components of customer orientation, the only significant differences existed in the degree of market-sensing capability between prospectors (= 4.63) and analyzers ( = 4.02), and between prospectors ( = 4.63) and reactors ( = 3.76). For the level of innovation capability, prospectors reported the highest level (= 4.86), and this is significantly different from those of differentiated defenders (= 4.43, p < 0.01), LC defenders (= 4.42, p < 0.001), analyzers ( = 4.36, p < 0.01), and reactors ( = 4.11, p < 0.01). Therefore, Hypothesis 2 is fully supported.
Hypothesis 4 postulates that differentiated defenders would have a high level of customer orientation and low level of innovative capability, while Hypothesis 5 proposes that LC defenders would possess a low level of customer orientation but a high level of innovative capability. Our findings indicate no significant difference between both types of defenders because they seem to have the same levels of customer orientation (= 4.66;= 4.66) and innovative capability (= 4.43;= 4.42). Since in both types, the level of customer orientation is higher than the level of innovation capability, we gain support for Hypothesis 4 but not for Hypothesis 5.
Hypothesis 6 expects analyzers to have mediocre levels of customer orientation and innovative capability, and Hypothesis 8 proposes that reactors possess the lowest levels of customer orientation and innovative capability. Consistent with our hypotheses, reactors reported the lowest level of customer orientation ( = 4.37) and innovative capability ( = 4.11) across the five types of firms, and these levels are significantly different from those of prospectors (p < 0.01). Analyzers seem to have higher levels of customer orientation (= 4.51) and innovative capability (= 4.36) than reactors, but lower than differentiated defenders and LC defenders. The levels of customer orientation and innovation capability of analyzers are significantly lower than those of prospectors (p < 0.01). Thus, Hypothesis 6 is partially supported, and Hypothesis 8 is supported. A summary of the hypotheses test results is reported in Table 6.
Table 6.
Summary of hypotheses testing results.
5. Discussion
Our first set of hypotheses (1, 3, and 7) address the moderating role of business strategy types on the customer orientation–innovation capability–financial performance relationships. Although the results did not support all three of these hypotheses, they revealed insights regarding the moderating role of business strategy types. As postulated in Hypothesis 1, linkages among customer orientation, innovation capability, and financial performance are moderated by business strategy type, which are consistent with the findings reported by Slater and Narver [56] in their study of manufacturing companies and service firms in the USA, and those found by Olson et al. [20] from their diverse sample of USA-based companies. With various degrees of effect sizes from multiple-group structural equation analyses, it is evident that the extent to which customer orientation and innovation capability affect financial performance of firms pursuing different business strategy types varies. Moreover, the results of Hypothesis 3 further highlight the significant role of innovation capability in the prospector type of firms, as only the paths involving innovation capability are more pronounced than others. This is consistent with the nature of the prospectors, who are always active in identifying market opportunities and preempting their competitors. Therefore, it is unsurprising that prospectors would rely on innovation as a means to enhance financial performance. In contrast, Slater and Narver [56] found that the customer orientation–financial performance link is greatest in the analyzer group, whereas Olson et al. [20] report that it is greatest among the differentiated defender group. For Hypothesis 7, which postulates that the proposed relationships in the model would be stronger amongst analyzers when compared to defenders, our findings showed that customer orientation exerts more influence on innovation capability and financial performance both directly and indirectly through innovation capability. However, the impacts of innovation capability on financial performance, both directly and as a mediator between customer orientation and firm financial performance, is stronger amongst LC defenders compared to differentiated defenders and analyzers. Since analyzers have been documented in the literature as the most complex business strategy type due to their tendency for dual emphases on both competitors and customers [14], it is not surprising that this hypothesis is partially supported. With the multiple foci, analyzers may shift resources between being innovative to preempt competitors and being customer-oriented to satisfy them at different points of time. Our mixed results could be attributed to the temporal factor. Specifically, the market environment during our data collection period may be more conducive for the prospectors to focus more on being innovative, emphasizing winning over competitors, and the analyzers to focus more on customers rather than on competitors. Temporal factors may also explain why Olson et al. [20] found that the innovation capacity–financial performance link is significantly negative among analyzer, prospector, and low-cost defender groups, and contributes positively to financial performance for differentiated defenders. Therefore, future research may investigate this phenomenon longitudinally in order to monitor the relationships under different market environments over time.
Our second set of hypotheses aims to distinguish the levels of customer orientation and innovation capability across five business strategy types. Consistent with our postulations, Hypotheses 2 and 8 are fully supported. Prospectors revealed the highest levels of customer orientation and innovative capability, which are consistent with the findings reported by Olsen et al. [20], from their broad sample of USA-based manufacturing companies and service firms, and are similar with the findings of Slater and Narver [57], who found from their diversified sample of USA-based firms that prospectors have the highest levels of market focus and new product innovation emphasis, while reactors reported the lowest levels of both. Therefore, this confirms the distinctive natures of both prospectors and reactors. Based on Figure 2, analyzers should possess mediocre levels of customer orientation and innovation capability when compared to the other four business strategy types. We expected the level of customer orientation of analyzers to be lower than that of prospectors, but higher than that of LC defenders and reactors. We also expected the level of innovative capability of analyzers to be lower than that of prospectors but higher than that of differentiated defenders and reactors. From our results, Hypothesis 4 is supported, which is consistent with the results reported in Olson and Slater [20]; however, Hypothesis 5 is not supported, and Hypothesis 6 is only partially supported. In contradiction to Hypothesis 5, the level of customer orientation of LC defenders is higher than that of analyzers. Moreover, analyzers revealed a lower level of customer orientation than LC defenders and a lower level of innovative capability than differentiated defenders; therefore, Hypothesis 6 is only partially supported. As discussed in the previous section, analyzers may opt for a different focus depending on how they analyze the current situation.
Contrary to Hypothesis 3, the results indicate that the link between customer orientation and innovation capability, in addition to the direct effect and total effects of customer orientation, on the financial performance of reactors are more pronounced than those of other business strategy types. Such findings shed new light on the strategy and innovation literature because they pinpoint a critical role of customer orientation in enhancing innovative capability and financial performance amongst the reactor type of firms. While reactors may possess the lowest levels of customer orientation and innovative capability, either due to their limited resources or their unawareness to environmental changes, our findings unveil that even with a minimal level of a higher-order capability such as customer orientation, which constitutes salient dimensions including market-sensing, customer-relating, and customer-response capabilities—regarded as composite operant resources (CORs)—its contributions to performance outcomes are very significant despite a relatively small sample. Hence, future research may delve into how firms, including reactor-types, should cultivate these higher-order capabilities from several basic operant resources (BORs) to advance theoretical development. Our findings also suggest that while CORs (e.g., customer orientation) play a crucial role among differentiated defenders, analyzers, and reactors, both CORs (i.e., customer orientation) and BORs (e.g., innovative capability) are important to prospectors and LC defenders. These insights further distinguish prospectors and LC defenders from other types of firms by suggesting that these firms possess characteristics that may enable them to exploit both BORs and CORs in enhancing their performance. Firms pursuing other business strategy types may focus more on the development of CORs, as it is this type of capability that is critical to their success.
6. Conclusions
6.1. Theoretical Contributions
This study further advances resource-advantage (R-A) theory [24,58] to explain the varying roles of customer orientation and innovative capability across firms of different business strategy types [33]. Despite the seemingly small sub-samples of LC defenders, analyzers, and reactors, this current study discovered significant relationships in the proposed model. Particularly, this paper extends R-A theory by identifying how types of capabilities—BORs and CORs—may contribute to the financial performance of firms of different business strategy types. While innovative capability is considered a BOR or lower-order capability, customer orientation is regarded as a COR, or a higher-order capability that constitutes several BORs. With the strong and significant relationship between customer orientation and innovative capability across five types of firms, this highlights the crucial role of CORs such as customer orientation in building BORs such as innovation capability. Through the R-A lens, we also observe and distinguish the differential roles that each type of resource plays in enabling firms to attain better financial performance.
6.2. Managerial Implications
For managers, understanding the type of business strategy pursued by their firm and re-allocating resources to develop essential capabilities (i.e., BORs, CORs, or both) that enhance performance will ensure efficient management practices. Realizing the more important role of higher-order capabilities, such as customer orientation, allows them to emphasize the cultivation of such capabilities. While innovation capability is important to prospectors and LC defenders, it may not be as important to differentiated defenders, analyzers, and reactors. Overemphasizing innovation over understanding customers may not really contribute to a better financial performance of differentiated defenders, analyzers, and reactors. For prospectors and LC defenders, developing abilities to relate and respond to dynamic market environments and to integrate these activities together with the ability to be innovative will improve financial performance.
6.3. Limitations and Future Research Directions
Future studies may explore how firms can develop these higher-order capabilities. Our findings also reveal that these five business strategy types, despite their resource configurations elaborated in the literature, tend to change their focus. For instance, although the literature may suggest that analyzers possess mediocre levels of both customer orientation and innovative capability, this is still contingent upon how the firms analyze and interpret the situation. Therefore, it is possible that during a particular period, analyzers will focus on customers rather than innovations to preempt competitors, and vice versa. Given a small subset of analyzer-type firms in the present study, future research may expand the sample size and obtain longitudinal data. This presents another venue for future studies to explore the contingent factors that may influence different emphases and resource allocations of firms. By including more firms from various industries and incorporating a temporal factor through a longitudinal research design, future research can substantiate the generalizability of the research findings and explore the probability of success. Given the self-report method applied in this study, complementary research using secondary and tertiary data would further validate our findings. Furthermore, researchers may attempt to identify BORs and CORs, and investigate these capabilities across firms of different business strategy types, industries, and nationalities.
Author Contributions
Conceptualization, A.T. and O.C.R.; methodology, A.T. and O.C.R.; software, A.T.; validation, A.T. and O.C.R.; formal analysis, A.T.; investigation, A.T. and O.C.R.; resources, A.T. and O.C.R.; data curation, A.T. and O.C.R.; writing—original draft preparation, O.C.R.; writing—review and editing, A.T. and O.C.R.; visualization, A.T.; supervision, O.C.R.; project administration, A.T. and O.C.R.; funding acquisition, A.T. and O.C.R. All authors have read and agreed to the published version of the manuscript.
Funding
This research received no external funding.
Institutional Review Board Statement
The study was conducted in accordance with the Declaration of Helsinki and approved by the Institutional Review Board of Assumption University (14 September 2018) for studies involving humans.
Informed Consent Statement
Informed consent was obtained from all subjects involved in the study.
Data Availability Statement
Data may be available upon reasonable request to the corresponding author.
Acknowledgments
The authors are grateful to the anonymous reviewers for their constructive comments.
Conflicts of Interest
The authors declare no conflict of interest.
References
- Schweitzer, F.; Tidd, J. Innovation Heroes: Understanding Customers as a Valuable Innovation Resource; World Scientific Publishing Co., Pte. Ltd.: Hackensack, NJ, USA, 2018. [Google Scholar]
- Atuahene-Gima, K. Resolving the Capability: Rigidity Paradox in New Product Innovation. J. Mark. 2005, 69, 61–83. [Google Scholar] [CrossRef]
- De Luca, L.M.; Verona, G.; Vicari, S. Market Orientation and R&D Effectiveness in High-Technology Firms: An Empirical Investigation in the Biotechnology Industry. J. Prod. Innov. Manag. 2010, 27, 299–320. [Google Scholar] [CrossRef]
- Alsharif, A.H.; Salleh, N.Z.M.; Baharun, R.; Abuhassna, H.; Hashem, A.R.E. Tendencias Globales De Investigación En Neuromarketing: 2015–2020. Rev. Comun. 2022, 21, 15–32. [Google Scholar] [CrossRef]
- Chiang, M.-C.; Yen, C.; Chen, H.-L. Does Age Matter? Using Neuroscience Approaches to Understand Consumers’ Behavior Towards Purchasing the Sustainable Product, Online. Sustainability 2022, 14, 11352. [Google Scholar] [CrossRef]
- González-Mena, G.; Del-Valle-Soto, C.; Corona, V.; Rodríguez, J. Neuromarketing in the Digital Age: The Direct Relation between Facial Expressions and Website, Design. Appl. Sci. 2022, 12, 8186. [Google Scholar] [CrossRef]
- Ahmed, R.R.; Streimikiene, D.; Channar, Z.A.; Soomro, H.A.; Streimikis, J.; Kyriakopoulos, G.L. The Neuromarketing Concept in Artificial Neural Networks: A Case of Forecasting and Simulation from the Advertising Industry. Sustainability 2022, 14, 8546. [Google Scholar] [CrossRef]
- Auh, S.; Menguc, B. Top Management Team Diversity and Innovativeness: The Moderating Role of Interfunctional Coordination. Ind. Mark. Manag. 2005, 34, 249–261. [Google Scholar] [CrossRef]
- Frambach, R.T.; Fiss, P.C.; Ingenbleek, P.T.M. How Important Is Customer Orientation for Firm Performance? A Fuzzy Set Analysis of Orientations, Strategies, and Environments. J. Bus. Res. 2016, 69, 1428–1436. [Google Scholar] [CrossRef]
- Wang, Q.; Zhao, X.; Voss, C. Customer Orientation and Innovation: A Comparative Study of Manufacturing and Service Firms. Int. J. Prod. Econ. 2016, 171, 221–230. [Google Scholar] [CrossRef]
- Park, S.; Cho, K. Agility and Innovativeness: The Serial Mediating Role of Helping Behavior and Knowledge Sharing and Moderating Role of Customer, Orientation. Behav. Sci. 2022, 12, 274. [Google Scholar] [CrossRef]
- Matsuno, K.; Mentzer, J.T. The Effects of Strategy Type on the Market Orientation–Performance Relationship. J. Mark. 2000, 64, 1–16. [Google Scholar] [CrossRef]
- Yarbrough, L.; Morgan, N.A.; Vorhies, D.W. The Impact of Product Market Strategy-Organizational Culture Fit on Business Performance. J. Acad. Mark. Sci. 2011, 39, 555–573. [Google Scholar] [CrossRef]
- Slater, S.F.; Hult, G.T.M.; Olson, E.M. On the Importance of Matching Strategic Behavior and Target Market Selection to Business Strategy in High-Tech Markets. J. Acad. Mark. Sci. 2007, 35, 5–17. [Google Scholar] [CrossRef]
- Miles, R.E.; Snow, C.C. Organizational Strategy, Structure, and Process; Stanford University Press: Stanford, CA, USA, 2003. [Google Scholar]
- Hughes, P.; Morgan, R.E. Fitting Strategic Resources with Product-Market Strategy: Performance Implications. J. Bus. Res. 2008, 61, 323–331. [Google Scholar] [CrossRef]
- Vorhies, D.W.; Morgan, R.E.; Autry, C.W. Product-Market Strategy and the Marketing Capabilities of the Firm: Impact on Market Effectiveness and Cash Flow Performance. Strateg. Manag. J. 2009, 30, 1310–1334. [Google Scholar] [CrossRef]
- Alnoor, A.; Khaw, K.W.; Al-Abrrow, H.; Alharbi, R.K. The Hybrid Strategy on the Basis of Miles and Snow and Porter’s Strategies: An Overview of the Current State-of-the-Art of Research. Int. J. Eng. Bus. Manag. 2022, 14, 18479790221080214. [Google Scholar] [CrossRef]
- Zhao, X. Customer Orientation: A Literature Review Based on Bibliometric Analysis. SAGE Open 2022, 12, 21582440221079804. [Google Scholar] [CrossRef]
- Olson, E.M.; Slater, S.F.; Hult, G.T.M. The Performance Implications of Fit among Business Strategy, Marketing Organization Structure, and Strategic Behavior. J. Mark. 2005, 69, 49–65. [Google Scholar] [CrossRef]
- Anwar, J.; Hasnu, S.A.F. Business Strategy and Firm Performance: A Multi-Industry Analysis. J. Strategy Manag. 2016, 9, 361–382. [Google Scholar] [CrossRef]
- OCED. Business Insights on Emerging Markets 2019. Available online: https://www.oecd.org/dev/BI_2019.pdf (accessed on 20 February 2020).
- Madhavaram, S.; Hunt, S.D. The Service-Dominant Logic and a Hierarchy of Operant Resources: Developing Masterful Operant Resources and Implications for Marketing Strategy. J. Acad. Mark. Sci. 2008, 36, 67–82. [Google Scholar] [CrossRef]
- Hunt, S.D.; Lambe, C.J. Marketing’s Contribution to Business Strategy: Market Orientation, Relationship Marketing and Resource-Advantage Theory. Int. J. Manag. Rev. 2000, 2, 17–43. [Google Scholar] [CrossRef]
- Hunt, S.D. A General Theory of Competition: Resources, Competences, Productivity, Economic Growth; SAGE Publications, Inc.: Thousand Oaks, CA, USA, 2000. [Google Scholar] [CrossRef]
- Day, G.S. The Capabilities of Market-Driven Organizations. J. Mark. 1994, 58, 37–52. [Google Scholar] [CrossRef]
- Dierickx, I.; Cool, K. Asset Stock Accumulation and Sustainability of Competitive Advantage. Manag. Sci. 1989, 35, 1504–1511. [Google Scholar] [CrossRef]
- Zastempowski, M. What Shapes Innovation Capability in Micro-Enterprises New-to-the-Market Product and Process Perspective. J. Open Innov. Technol. Mark. Complex. 2022, 8, 59. [Google Scholar] [CrossRef]
- Arnold, T.J.; Fang, E.; Palmatier, R.W. The Effects of Customer Acquisition and Retention Orientations on a Firm’s Radical and Incremental Innovation Performance. J. Acad. Mark. Sci. 2011, 39, 234–251. [Google Scholar] [CrossRef]
- Parsons, A.J. Building Innovativeness in Large U.S. Corporations. J. Serv. Mark. 1991, 5, 5–20. [Google Scholar] [CrossRef]
- Han, J.K.; Kim, N.; Srivastava, R.K. Market Orientation and Organizational Performance: Is Innovation a Missing Link? J. Mark. 1998, 62, 30–45. [Google Scholar] [CrossRef]
- Trainor, K.J.; Krush, M.T.; Agnihotri, R. Effects of Relational Proclivity and Marketing Intelligence on New Product Development. Mark. Intell. Plan. 2013, 31, 788–806. [Google Scholar] [CrossRef]
- Miles, R.E.; Snow, C.C.; Meyer, A.D.; Coleman, H.C. Organizational Strategy, Structure and Process. Acad. Manag. Rev. 1978, 3, 546–562. [Google Scholar] [CrossRef]
- Coviello, N.E.; Joseph, R.M. Creating Major Innovations with Customers: Insights from Small and Young Technology Firms. J. Mark. 2012, 76, 87–104. [Google Scholar] [CrossRef]
- Walker, J.O.C.; Ruekert, R.W. Marketing’s Role in the Implementation of Business Strategies: A Critical Review and Conceptual Framework. J. Mark. 1987, 51, 15–33. [Google Scholar] [CrossRef]
- Conant, J.S.; Mokwa, M.P.; Varadarajan, P.R. Strategic Types, Distinctive Marketing Competencies and Organizational Performance: A Multiple Measures-Based Study. Strateg. Manag. J. 1990, 11, 365–383. [Google Scholar] [CrossRef]
- Song, M.; Nason, R.W.; Di Benedetto, C.A. Distinctive Marketing and Information Technology Capabilities and Strategic Types: A Cross-National Investigation. J. Int. Mark. 2008, 16, 4–38. [Google Scholar] [CrossRef]
- Mohr, J.; Sengupta, S.; Stanley, S. Marketing High-Technology Products and Innovations, 3rd ed.; Pearson: Upper Saddle River, NJ, USA, 2009. [Google Scholar]
- Slater, S.F.; Olson, E.M. Marketing’s Contribution to the Implementation of Business Strategy: An Empirical Analysis. Strateg. Manag. J. 2001, 22, 1055–1067. [Google Scholar] [CrossRef]
- Miles, R.E.; Snow, C.C. Fit, Failure and the Hall of Fame; The Free Press: New York, NY, USA, 1994. [Google Scholar]
- Ammar, O.; Chereau, P. Business Model Innovation from the Strategic Posture Perspective. Eur. Bus. Rev. 2018, 30, 38–65. [Google Scholar] [CrossRef]
- Cadez, S.; Guilding, C. An Exploratory Investigation of an Integrated Contingency Model of Strategic Management Accounting. Account. Organ. Soc. 2008, 33, 836–863. [Google Scholar] [CrossRef]
- DeSarbo, W.S.; Anthony Di Benedetto, C.; Michael, S.; Sinha, I. Revisiting the Miles and Snow Strategic Framework: Uncovering Interrelationships between Strategic Types, Capabilities, Environmental Uncertainty, and Firm Performance. Strateg. Manag. J. 2005, 26, 47–74. [Google Scholar] [CrossRef]
- Nwankwo, S.; Gbadamosi, A. Entrepreneurship Marketing: Principles and Practice of SME Marketing; Routledge: New York, NY, USA, 2020. [Google Scholar]
- Podsakoff, P.M.; MacKenzie, S.B.; Lee, J.-Y.; Podsakoff, N.P. Common Method Biases in Behavioral Research: A Critical Review of the Literature and Recommended Remedies. J. Appl. Psychol. 2003, 88, 879–903. [Google Scholar] [CrossRef]
- Racela, O.; Thoumrungroje, A. When Do Customer Orientation and Innovation Capabilities Matter? An Investigation of Contextual Impacts. Asia Pac. J. Mark. Logist. 2020, 32, 445–472. [Google Scholar] [CrossRef]
- Thoumrungroje, A.; Racela, O. The Contingent Role of Customer Orientation and Entrepreneurial Orientation on Product Innovation and Performance. J. Strateg. Mark. 2013, 21, 140–159. [Google Scholar] [CrossRef]
- Zhu, Z.; Nakata, C. Reexamining the Link between Customer Orientation and Business Performance: The Role of Information Systems. J. Mark. Theory Pract. 2007, 15, 187–203. [Google Scholar] [CrossRef]
- Bagozzi, R.; Yi, Y. Specification, Evaluation, and Interpretation of Structural Equation Models. J. Acad. Mark. Sci. 2012, 40, 8–34. [Google Scholar] [CrossRef]
- Nunnally, J.C.; Bernstein, I.H. Psychometric Theory; McGraw-Hill: New York, NY, USA, 1994. [Google Scholar]
- Fornell, C.; Larcker, D.F. Evaluating Structural Equation Models with Unobservable Variables and Measurement Error. J. Mark. Res. 1981, 18, 39–50. [Google Scholar] [CrossRef]
- Bettencourt, L.A. Change-Oriented Organizational Citizenship Behaviors: The Direct and Moderating Influence of Goal Orientation. J. Retail. 2004, 80, 165–180. [Google Scholar] [CrossRef]
- Diamantopoulos, A.; Siguaw, J.A. Introducing Lisrel; SAGE: Thousand Oaks, CA, USA, 2000. [Google Scholar]
- Bernerth, J.B.; Aguinis, H. A Critical Review and Best-Practice Recommendations for Control Variable Usage. Pers. Psychol. 2016, 69, 229–283. [Google Scholar] [CrossRef]
- Hansen, J.A. Innovation, Firm Size, and Firm Age. Small Bus. Econ. 1992, 4, 37–44. [Google Scholar]
- Slater, S.F.; Narver, J.C. Market Orientation and the Learning Organization. J. Mark. 1995, 59, 63–74. [Google Scholar] [CrossRef]
- Slater, S.F.; Narver, J.C. Product-Market Strategy and Performance: An Analysis of the Miles and Snow Strategy Types. Eur. J. Mark. 1993, 27, 33–51. [Google Scholar] [CrossRef]
- Hunt, S.D. Resource-Advantage Theory: An Evolutionary Theory of Competitive Firm Behavior? J. Econ. Issues 1997, 31, 59–78. [Google Scholar] [CrossRef]
Publisher’s Note: MDPI stays neutral with regard to jurisdictional claims in published maps and institutional affiliations. |
© 2022 by the authors. Licensee MDPI, Basel, Switzerland. This article is an open access article distributed under the terms and conditions of the Creative Commons Attribution (CC BY) license (https://creativecommons.org/licenses/by/4.0/).