Abstract
The present work originates from a previous study in which a low-cost Real-Time Locating System (RTLS) based on Ultra-Wideband signals was developed and tested both in a laboratory and in a real industrial environment for assessing its performance and determining the best configuration, according to some selected KPIs. Starting from the future research directions depicted, the evolution herein presented is twofold. First, tests performed in the laboratory are refined and deepened in terms of (i) different anchors’ arrangements and orientation; (ii) the increased number of tested tags; and (iii) the tags’ battery capacity test. Second, the development and deployment of the industrial solution as well is improved by means of a case for hosting tags to be positioned on the asset to be tracked, realized through 3D printing, in line with the industrial context requirements. Finally, an economic analysis is performed so as to demonstrate the convenience of the investment and the feasibility of the solution. Results are positive and promising in terms of both economic sustainability and implementation of the system in a real industrial environment and may constitute guidelines for practitioners and managers.
1. Introduction
Given the success from the managerial side of the commissioning company of the low-cost Ultra-Wideband (UWB) based indoor Real-Time Locating System (RTLS) developed in [1], this paper presents the evolution of the abovementioned solution and the deepening of its testing and analyses, so as to make it effectively operational in an industrial environment and, why not, marketable.
Taking a step back, as its name suggests, an indoor RTLS is a system allowing real-time tracking objects within an indoor environment (e.g., an industrial context or a warehouse), overcoming the problems deriving from its being in a close area in which walls, machinery, or other barriers exist and may obstacle the connection; for these reasons, in fact, other systems such as the famous global positioning system (GPS) are not suitable [2], since satellite radio signals cannot penetrate.
The RTLS in question is based on a commercial radio indoor positioning system called Qorvo MDEK1001 (www.qorvo.com; accessed on 15 May 2023), which leverages UWB radio frequency (RF) technology to communicate the exact position of RF tags posed on the item which has to be tracked; the environment in which these items are moved is covered by fixed antennas, called “anchors”, aimed at boosting the signal. The choice has fallen on UWB given the fact that, from previous studies, it turned out to be the best technology in terms of efficiency [3] and accuracy in determining the exact position of indoor objects [4].
For literature regarding RTLSs, the use of the Qorvo MDEK1001 system, and of the UWB for these purposes, readers can refer to [1] since, in the meantime, no other studies are proposed by the scientific community as emerged from the main database (i.e., Scopus and Web of Knowledge). However, for completeness, the following background is recalled: RTLS systems in general, also known as indoor positioning systems (IPS), [5] and [6] carried out two literature reviews respectively on implementations and enabling technologies; specifically, [5] dealt with UWB. As far as the usage of the Qorvo MDEK1001, instead, the authors recall the study by [7], proposing an IPS using this specific solution. However, the authors stress the fact that literature on these topics is scarce, dated, and poorly debated; in this sense, this paper also constitutes a call for more research and tries to partially close the gap.
The ratio behind the first development of this system was economic in nature; indeed, all the studies dealing with RTLSs stressed the fact that, in most cases, the enormous cost of implementing solutions of this kind acts as a barrier to the solution itself (e.g., [8] or [9]); according to that, the aim was that of proposing a low-cost solution, at the same time reliable and effective. This project was supported and carried out by a research group of the University of Parma (Department of Engineering and Architecture) in partnership with a company based in the same city whose management was interested in this solution and has made available its warehouse for testing sessions in a real industrial context. Specifically, the company in question is a leader in the production of machinery for filling, packaging, and palletizing in several industrial fields, such as the food, beverage, home and personal care, and other automation sectors. Note that the company in question is anonymous for the sake of privacy.
In greater detail, the previous manuscript tests were carried out from June to November 2022, both in the university laboratory and in the real warehouse; as far as lab tests are concerned, the following issues were investigated and evaluated on the bases of specific key performance indicators (KPIs):
- Static accuracy, to assess the accuracy of the system in determining the tag’s position under stationary conditions;
- Response time (dynamic accuracy), to determine the accuracy of the system in determining the tag’s position, this time in motion;
- Sensitivity to relative orientation to determine the influence of tag-anchor antennas orientation;
- Start-up time to evaluate whether the item position’s accuracy increases in time after a reset of the tag.
As far as static accuracy is concerned, results from the experiments returned positive and promising results, and the same goes for dynamic accuracy; the tag’s orientation (i.e., perpendicular versus parallel) turned out to be neglectable, while the start-up time error as well returned satisfying results. According to that, once the system was preliminary positively evaluated and validated, the tests moved to the physical warehouse, where the best position and number of the anchors were determined; clearly, the resulting configuration is suitable for that specific case study and for the warehouse of the company under investigation. For the detail of these test campaigns and their results, see, once again, [1].
Overall, these first outcomes confirmed the potential adoption of this technology at the industrial level and its economic feasibility as well; according to that, a second set of deeper tests was planned and carried out and is discussed in the present manuscript.
These tests were performed in the same laboratory of the Department of Engineering and Architecture of the University of Parma, and the following new issues related to the development of a real industrial solution are investigated:
- Anchors’ arrangement and its effect on the performance of the RTLS in question;
- Up to 18 close tags were tested, namely a multi-tag configuration, in order to assess whether more tags close to each other may influence the tracking and the system accuracy;
- Battery capacity test to assess the anchors’ battery performance in terms of lifespan.
With reference to the first issue, note that in the previous manuscript, it was only determined for the case study in question, while here, it is investigated at the lab level, and furthermore, it is also deepened in terms of the more suitable orientation (parallel versus perpendicular); this aspect was neglected in the first campaign. The second issue, instead, represents one of the main contributions of this paper since, to the best of the knowledge of the authors, there are no previous studies dealing with a multi-tag scenario and the effects that may derive.
With regard to the industrial application, moreover, a case for hosting tags to be positioned on the device to be tracked was developed, suitable for an industrial context. To comply with this last requirement, first of all, the use cases of these tags were to be preliminarily defined: for instance, pallet or container application or on metallic asset (since, in this last case, the RF communication may present problems). According to the destination of the case, its technical specifications were defined as well, such as fixing mode, impact resistance, weight, or dimensions. This optimized case was prototyped and realized through 3D printing and then tested in the real industrial context. An economic analysis is finally performed, with reference to the development of this case according to industrial production.
The contribution of this study is to be intended practical in nature; indeed, it may act as a guideline for those practitioners who are interested in a solution of this kind and could benefit from the “lessons learned” or get inspired from the tests carried out.
The remainder of the manuscript is organized as follows: Section 2 details the methodology followed for the tests in the laboratory, properly divided according to the three addressed issues listed above. Following the same organization, Section 3 proposes the results. Section 4 is dedicated to the case prototype development; the economic assessment follows (Section 5). Finally, conclusions and future research directions are depicted in the last section, i.e., Section 6.
2. Materials and Methods
First of all, to avoid redundancies and to streamline the present manuscript, for the technical details of the Qorvo kit (https://store.qorvo.com/datasheets/qorvo/mdek1001systemusermanual-1.1.pdf; accessed on 15 May 2023), readers are again invited to refer to [1]. The subsections that follow, instead, detail the methodology followed for the three investigated issues, preceded by a general subsection in which the lab preparation is illustrated. Note that tests were again carried out in FabLab, a fabrication laboratory located in the Department of Engineering and Architecture of the local university.
The first campaign’s aim was that of assessing the best strategy to position the anchors on the perimetral walls (this time, super partes) and not related to a case study as it happened in the first manuscript; specifically, this optimal configuration was evaluated in terms of positioning accuracy under static condition. The second campaign was designed in order to assess how the system’s performance is affected by a multi-tag scenario at different ranging frequencies (specifically, 18 tags are simultaneously involved at three different ranging rates). At last, the third session aimed at measuring the battery lifetime by means of a discharge test.
For completeness and for the sake of clarity, the flowchart depicted in Figure 1 resumes the involved steps. Note that the first two research stages were presented in [1].
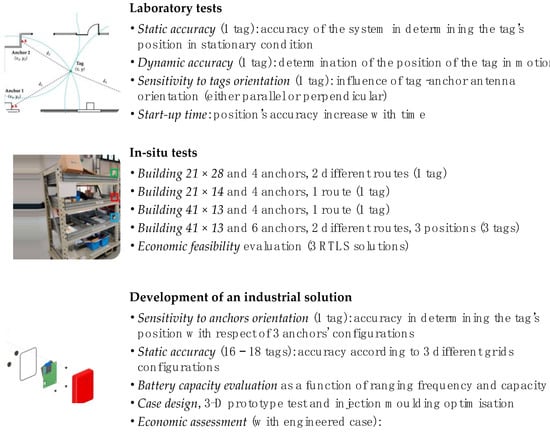
Figure 1.
Flowchart proposing the steps involved in the research.
2.1. Preliminary Laboratory Preparation
FabLab facility, whose dimensions are 11.3 × 5.7 m, is large enough to host the experiments, and its shape factor is approximately the same as a common industrial building, making it a suitable environment for testing. The lab consists of a couple of rooms and a corridor separating them.
A regular 2 × 2 m grid has been traced on the floor all over the lab area using paper tape as marker; 39 measuring points were marked: 26 of them positioned in the main room, and the remaining in the smaller one (including the corridor). The position of the measurement points was determined using professional tools such as a 7.5 m metal tape measure and a self-tuning crossline laser level. The tag was mounted on a tripod at 1 m height, using a plumbline as vertical reference line and exact positioning above the marked points of measurement. Figure 2 proposes the plan of the area, showing the measuring points. Note that as happened in the tests carried out last year, since the main goal is to assess the best anchors configuration, the second room was intentionally excluded from subsequent experimentations; hence, the testing campaign was limited to the main room (points 1 to 26 for the main room, plus 27–28 for the corridor).
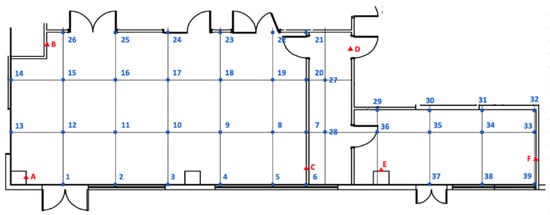
Figure 2.
Map of the area and measurement points.
Once the grid was completed, each point was numbered, and its coordinates were written in a text file to be later imported for analyses. In addition, four further reference points, named A, B, C, and D, were chosen and marked with a red triangle for the installation of the anchors, which can be seen represented in Figure 2 (note that letters E and F are referred to the second room, not involved); their coordinates are known and can be used for determining the location of the tag under examination in the measurement points. The origin of the x- and y-axes was chosen at the bottom left corner of the laboratory, close to the bottom left edge of the room. Anchors are always turned on, and thus, they are externally powered by a micro-USB socket so as to avoid the need for a battery; because of the antenna polarization, the anchors were vertically positioned, facing each other in an elevated position (2.6 m), to avoid or at least limit the interferences of objects placed along the line-of-sight between anchors and tag tested. During the execution of the test, it was decided to neglect the z-coordinate since it is not relevant in industrial environments.
During the measurements, the tag was positioned in the determined points; the tag’s antenna is not kept in a specific orientation; in fact, in real industrial context, optimal conditions are not always met, and this makes tests more reliable.
MATLAB R2022b program was involved in collecting, gathering, and post-processing the data.
For completeness, Table 1 below shows the coordinates of the reference points in the main room.

Table 1.
Coordinates of the reference points (tag positions).
2.2. Anchors’ Arrangements Test
Three different ways of positioning anchors were identified and tested, as detailed below:
- Configuration 1 “Y plane antennas”: in this configuration, the anchors were installed at the 4 edges of the main room. In this case, they were oriented so that the flat antenna inside was aligned to the y plane.
Table 2 below shows the exact coordinates of the four anchors, while Figure 3 graphically illustrates their positioning.
Table 2.
Coordinates of the four anchors of the first tested configuration.
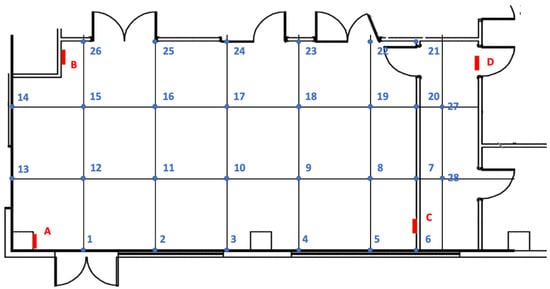
Figure 3.
Positioning of the four anchors of the first tested configuration.
- Configuration 2 “X plane antennas”: again, the anchors were installed at the 4 edges of the main room, as in the above configuration. What differs is that, in this case, they were oriented so that the flat antenna inside was aligned to the x-plane. Table 3 details the coordinates, while Figure 4 shows their layout.
Table 3. Coordinates of the four anchors of the second tested configuration.
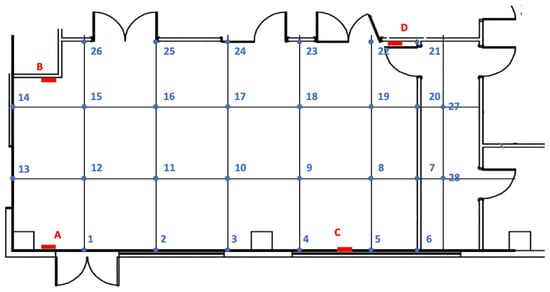 Figure 4. Positioning of the four anchors of the second tested configuration.
- Configuration 3 “Wall centred antennas”: the anchors were installed in the middle of the 4 perimetral walls and aligned accordingly. As a result, two anchors were aligned to the y plane while the other two to the x plane.
Table 4.
Coordinates of the four anchors of the third tested configuration.
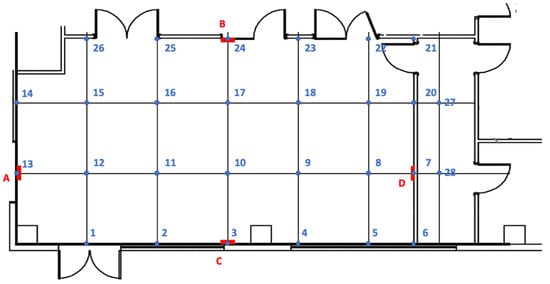
Figure 5.
Positioning of the four anchors of the third tested configuration.
The static accuracy was considered for the same reasons of [1] as the KPI used for the selection of the best configuration among the three presented ones. To this extent, the error between the position detected by the RTLS system and the known true position was calculated; data were collected by placing the RTLS tag in all the measurement points of the main room, acquiring at least 600 position points for each reference point for each of the three described configurations. Although the z-coordinate was ignored, the tag was kept at the same height of 1 m. This experiment was performed at a 10 Hz frequency, and the configuration returning the minimal average position error was considered to be the most satisfying.
2.3. Multi-Tag Test
This second set of experiments was carried out in the same facility and, as already stated, the ratio behind this test is that there is a gap in literature to be filled since there are no previous studies that mention tests with more tags and, thus, considers the influence that their closeness to other tags may have, which instead represents an issue which may have a significant impact. In other words, the focus of this test was on assessing how the system’s position errors are influenced by the proximity with other tags. For completeness and to be as accurate as possible, this test was repeated for three different frequency values, i.e., 5, 1, and 0.5 Hz.
2.3.1. Laboratory Preparation
As already stated, a total of 18 tags were involved in this testing session.
Three tags configurations were analyzed with respect to three different grid structures:
- Grid 1: the same grid of Figure 2 was used with the exception of some points not considered due to the fact that the tested tags were in a lower number than the number of reference points. However, points were identified in such a way as to ensure that relevant positions (e.g., center of the room, wall proximity) were tested.
- Grid 2: 16 tags were spaced 0.66 m from each other, resulting in a regular 2 × 2 m grid traced on the floor. For convenience, the squared shape whose vertexes are reference points 9-10-17-18 from the previous grid was used.
- Grid 3: 16 tags were spaced 0.10 m from each other, resulting in a regular 0.3 × 0.3 m grid traced on the floor. For having an easily located area, one of the vertexes is reference point 17.
Figure 6 below graphically shows the positioning of the tags according to the three different grids.
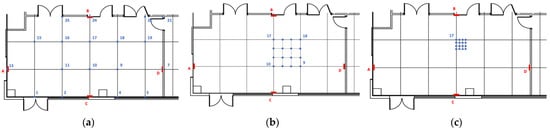
Figure 6.
Maps of the tags. (a) Grid 1; (b) Grid 2; (c) Grid 3.
Note that in Grid 1, all 18 tags were used since it was possible to dispose of them in a fairly symmetrical layout, given the size of the considered area. Instead, to ensure a symmetrical disposition in the other grids, only 16 tags were involved.
2.3.2. Experimental Campaign
In the following sub-paragraphs, the KPIs selected for the evaluation of the performance are detailed.
Static Accuracy
The set of experiments regarding static accuracy followed the same methodology as that of the anchor assessment static accuracy test, but, in this specific case, the tags were positioned on a one-meter-height table instead of on a tripod. Data were collected by placing the RTLS tags in all the measurement points of each of the three described grids, acquiring at least 600 position points for each reference point.
The purpose of the tests is to verify the dependence of the performance of the RTLS system with respect to the tag density across the covered area. The performance of the system is computed as the error between the position detected by the RTLS and the known true position (clearly, the best configuration is the one with the lowest error value).
Sensitivity to Different Frequency
The tag’s frequency was evaluated as a potential parameter influencing the static accuracy. Accordingly, the system’s performances were evaluated at different frequency settings, namely 5 Hz, 1 Hz, and 0.5 Hz.
The aim of this set of experiments was to test and verify the potential correlation between the tag’s ranging frequency and the position error. Note that the use of lower frequency, overall, may lead to better battery life.
2.4. Battery Discharge Test
As already stated, a precis assessment of the battery lifespan was performed; this test was mainly required before designing the prototype of the industrial case for the Qorvo DWM1001 tag, given the fact that this could impact the battery size and capacity, according to the requirements of the specific industrial applications.
To this extent, a dedicated Excel spreadsheet (named Battery Lifetime Estimator) is provided by the DWM1001 manufacturer to help the solutions designer to size the battery and estimate its duration under the proper operative conditions. This tool has been used to predict the battery lifespan under different testing conditions involving different tag configurations and battery types. For completeness, the input form of the Battery Lifetime Estimator provided by Qorvo is shown in Figure 7 and refers to the system diagram reported in Figure 8; the user needs to input the following data:
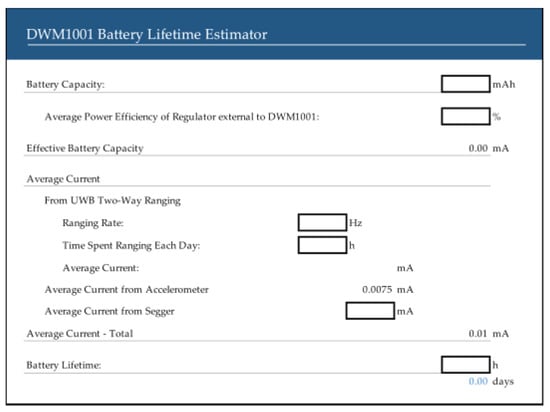
Figure 7.
Input form of the Battery Lifetime Estimator spreadsheet.
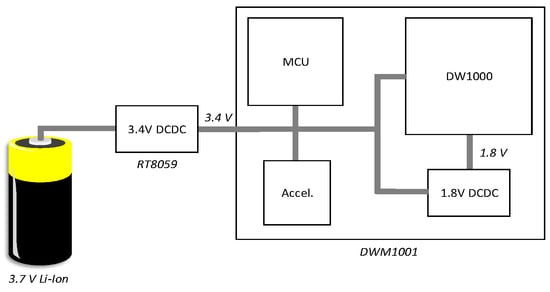
Figure 8.
System diagram of the standard power supply configuration.
- Capacity [mAh] of the connected Li-Ion rechargeable battery;
- Average power efficiency of external power regulator providing 3.4V to DWM1001, as depicted in the system diagram;
- Ranging rate (frequency) [Hz];
- Time spent ranging each day in hours (to save power, the provided ranging rate applies only when tag motion is detected by the onboard accelerometer)
- Average current drained by the STM32 microcontroller mainly acting as a USB-to-serial converter.
In the bottom right box, the tool provides the expected battery lifetime according to the selected settings.
Before starting the testing campaigns, the DWM1001-DEV board schematic (reported in Figure 9 below) has been carefully analyzed in order to optimize the development board according to the specific industrial use case under test (tag for industrial assets). More into detail, the following customizations have been implemented:
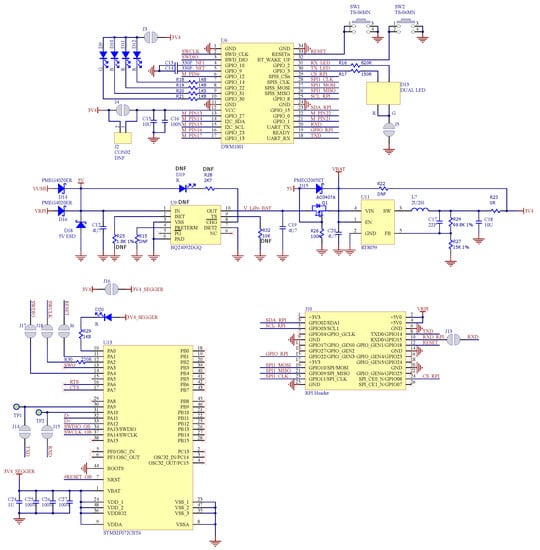
Figure 9.
DWM1001-DEV board schematic (www.qorvo.com/products/d/da007979; accessed on 15 May 2023).
- Deactivation of onboard LEDs (removal of jumpers J3 and J5);
- Deactivation and isolation of the STM32 IC, as the serial communication is not needed when the board acts as a tag (removal of jumpers J6, J13, J14, J15, J16, J17, J18).
In this simplified configuration, only the external power supply U11 (RT8059) and the RTLS module U6 (DWM1001) are active to preserve the maximum battery power.
During the execution of the battery discharge test, the voltage of the battery has been continuously logged in order to determine the cut-off voltage causing the DWM1001 deactivation.
Specifically, 2 different power supply configurations were tested: a Li-Ion rechargeable battery (first test campaign) and two AAA Alkaline batteries (second test session).
3. Results
In this section, the results from the three issues presented in the previous section are detailed and illustrated, recalling the same organization in sub-sections.
3.1. Anchors’ Arrangements Test
The two tables below show the results of the static accuracy test with respect to the main room. It is worth pointing out that for each anchor configuration, the average error is always below 1 m for each point, thus compatible with the specific use case investigated, i.e., location and inventory of industrial assets in a manufacturing facility. The position error and some detailed statistics were analyzed in their x and y components, respectively, detailed in Table 5 and Table 6 below.
Table 5.
Static accuracy results for the x component (anchors’ arrangement test).
Table 6.
Static accuracy results for the y component (anchors’ arrangement test).
In both tables, it can be seen that the average error in both directions is fairly comparable among the three configurations; however, it can also be noted that the average variance is significantly lower, in both directions, in the wall-centered configuration (i.e., the number 3).
For completeness, Figure 10 shows the average positions estimated by the three anchors’ configurations for each of the reference points in a Cartesian diagram.
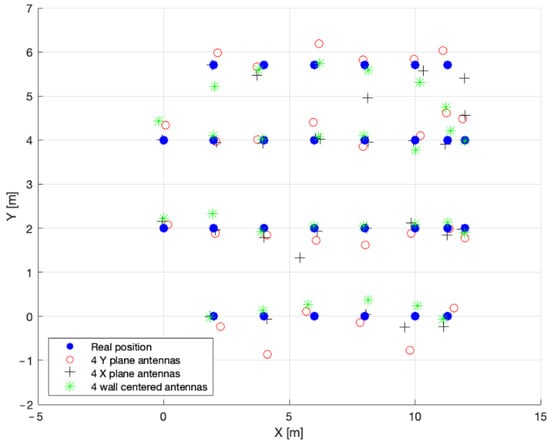
Figure 10.
Average positions estimated by the three anchors’ configurations. The legend is proposed in the bottom left corner of the graph.
The three figures below, instead, show on a dispersion chart the cloud of points measured by the RTLS system during the execution of the tests, providing a qualitative overview of the results. Figures represent, in order, the y-plane antennas cloud chart (Figure 11), x-plane antennas cloud chart (Figure 12), and wall-centered antennas cloud chart (Figure 13).
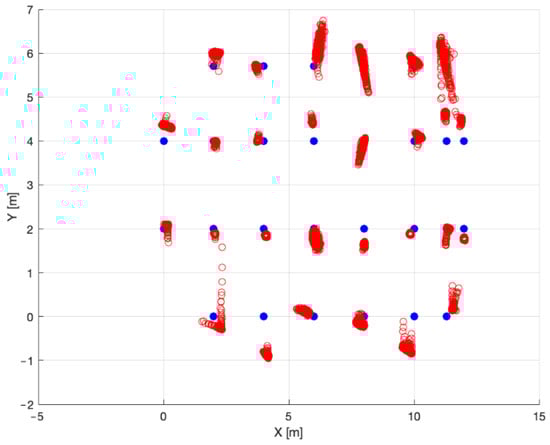
Figure 11.
Points cloud measured for Configuration 1.
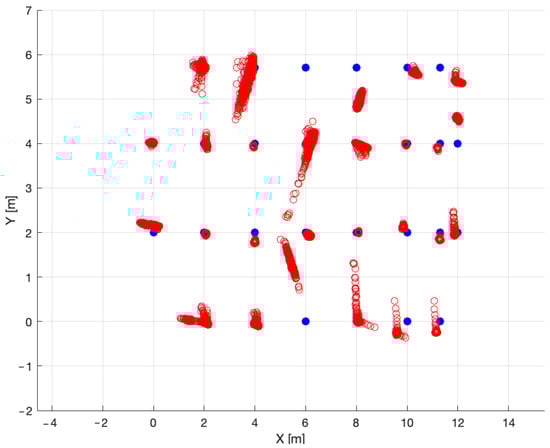
Figure 12.
Points cloud measured for Configuration 2.
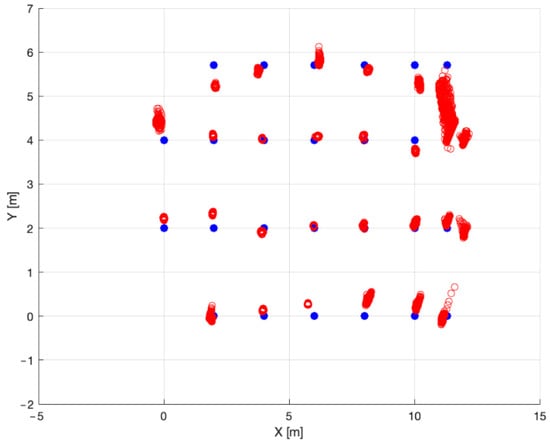
Figure 13.
Points cloud measured for Configuration 3.
As shown in the above figures, the wall-centered antenna configuration (i.e., the third) estimates the overall real reference point’s position with better precision, particularly those in the center of the room. In all three cloud charts, it is possible to note that the reference points on the right side are more dispersed: this phenomenon was investigated, and it was found that the reason is due to the presence of more metal items rather than on other sides of the main room.
Overall, according to the obtained results, the best anchor configuration ensuring the minimum positioning error is the wall-centered one, namely configuration 3. Hence, for the subsequent tests, anchors were positioned according to the wall-centered configuration.
3.2. Multi-Tag Tests
In this sub-section, outcomes from the multi-tag tests are presented as follows: for each grid, a map of the reference points on which the average positions estimated are indicated for each of the three analyzed frequencies is proposed. Furthermore, each grid is presented with a table in which average error, average variance, and some further statistics are indicated. As done for the anchors positioning test, parameters are analyzed in their x and y component separately.
3.2.1. Grid 1
The first grid test involved 1 listener, 4 anchors, and 18 tags. Figure 14 illustrates the average positions estimated by the RTLS for each of the reference points at the three different frequency levels under investigation. Table 7 and Table 8, instead, report, respectively, for the x and y components, the average errors, the average variances, and some positioning statistics according to the used frequency.
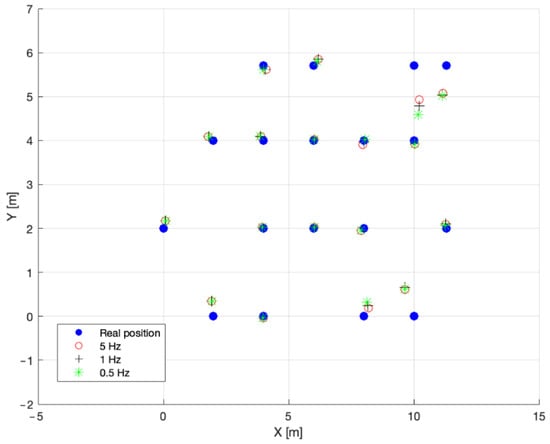
Figure 14.
Average positions estimated, at different levels of frequency, for Grid 1. The legend is proposed in the bottom left corner of the graph.
Table 7.
Results for the x component (multi-tag test); Grid 1.
Table 8.
Results for the y component (anchors’ arrangement test); Grid 1.
Results show that in a distant tag environment as that of Grid 1, the used frequency is not relevant for both the average error and the average variance. Although, it is worth noting that overall, the 0.5 Hz frequency scores slightly better in the positioning statistics.
3.2.2. Grid 2
The second grid test involved 1 listener, 4 anchors, and 16 tags and was performed in a closer tag environment. Figure 15 proposes the average positions estimated by the RTLS for each of the reference points (depending on the frequency level). Table 9 and Table 10 report the average errors, the average variances, and some positioning statistics on the bases of the three different frequencies.
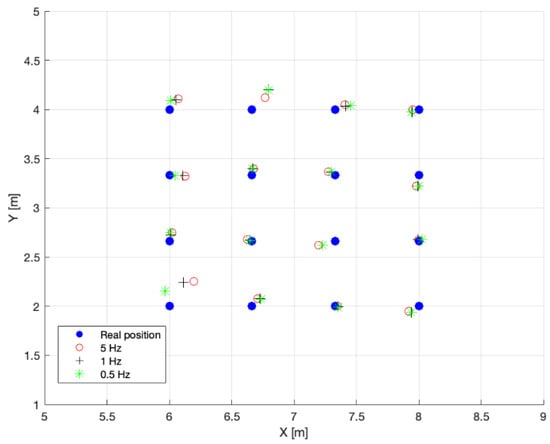
Figure 15.
Average positions estimated, at different levels of frequency, for Grid 2. The legend is proposed in the bottom left corner of the graph.
Table 9.
Results for the x component (multi-tag test); Grid 2.
Table 10.
Results for the y component (multi-tag test); Grid 2.
From the tables, it can be deduced that even in a closer tag area, the RTLS system has a positive performance in estimating the position of the tags, regardless of the frequency used by the tags. In the x direction, the average error is significantly lower in the 0.5 Hz frequency setting, but it is also paired with a slightly higher average variance. Although characterized by this higher average variance, the 0.5 Hz frequency performs better since it presents the minimum average error among the three frequencies analyzed.
3.2.3. Grid 3
The third final grid test as well involved 1 listener, 4 anchors, and 16 tags and was performed in an even closer tag environment than that of Grid 2. As performed for the two previous cases, Figure 16 shows the average positions estimated by the RTLS for each of the reference points. The two following tables, i.e., Table 11 and Table 12, report the average errors, the average variances, and the same positioning statistics.
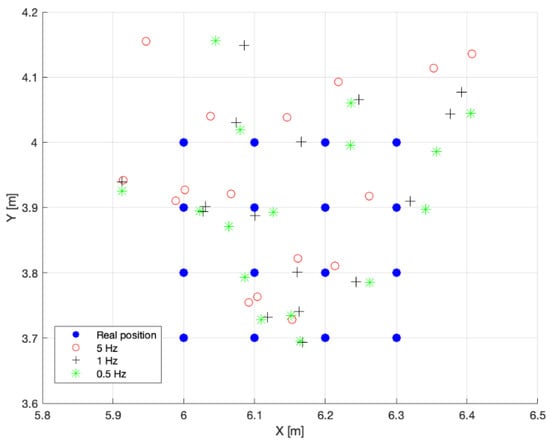
Figure 16.
Average positions estimated, at different levels of frequency, for Grid 3. The legend is proposed in the bottom left corner of the graph.
Table 11.
Results for the x component (multi-tag test); Grid 3.
Table 12.
Results for the y component (multi-tag test); Grid 3.
In this case, results show that the RTLS system is less suitable for a very close tag environment (approximately 10 cm from tag to tag). In fact, as seen in the tables and the map of Figure 16, the average error is about half the distance from tag to tag for the x direction, while it is comparable to the distance for the y direction. Although all the average values present low variances, it is worth noting that no matter the ranging frequencies, the system estimates the tags’ real position with a limited error and variance.
This third experiment helped to understand the minimum distance between tags that allows the RTLS system to correctly estimate the position of tags.
3.3. Battery Discharge Tests
The following subsections propose results from the two tested batteries; a final summary is also proposed.
3.3.1. First Test
For the execution of the first test, a Li-Ion rechargeable battery was involved to evaluate the accuracy of the Battery Lifetime Estimator tool. The capacity of the battery has been determined by means of a series of five charge/discharge cycles; at the end of each cycle, the effective (measured) battery capacity has been recorded, and an average value of 121 mAh was computed. The abovementioned Qorvo tool implemented in Excel provided an estimated battery life of 37.8 h according to the following input data:
- Capacity of the connected Li-Ion rechargeable battery: 121 mAh (average measured value discharging the battery at 3.0 V)
- Average power efficiency of external RT8059 power regulator: 93% (standard value suggested by Qorvo)
- Ranging rate: 10 Hz (to speed up the battery discharge test)
- Time spent ranging each day: 24 h (the onboard accelerometer and the motion detection have been deactivated, so the tag is always ranging)
- Average current drained by the STM32 microcontroller: 0 mA (STM32 has been deactivated and isolated).
During the test execution, the tag has been positioned on a table with a clear line of sight with four anchors equipping the testing lab; the position computed by the RTLS system has been logged on a PC connected to another Qorvo device configured as Listener.
The DWM1001 tag stopped working when the battery voltage reached the cut-off value of 2.51 V after 9.6 h; the real battery lifetime counted for about 25% of the predicted life of 37.8 h. The battery discharge curve is plotted in Figure 17, which also includes results from the subsequent test number 2.
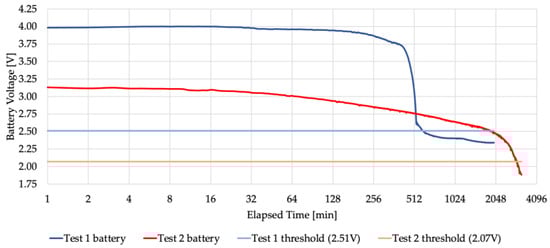
Figure 17.
Resulting battery discharge curve (for both tests).
In order to investigate the reason for the low accuracy provided by the official Qorvo tool, a different configuration has been implemented and then tested. The current setup of the system is very clean and neat, composed of a Li-Ion battery, an external regulator, and a DWM1001 module. The capacity of the battery has been assessed in a previous test, while the efficiency of the external regulator (93%) has been suggested by Qorvo without any further validation. The next test configuration bypasses the external regulator to better understand if the error in the tag power consumption has to be imputed to the DWM1001 module or the RT8059 efficiency.
3.3.2. Second Test
For the execution of the second test, two AAA Alkaline batteries were involved. More into detail, a blister of four batteries has been used for this test; two batteries have been directly connected to the DWM1001 module for the lifetime assessment by passing the RT8059 regulator, as shown in Figure 18, while the remaining two batteries have been discharged to determine the battery capacity as a function of the final discharge voltage.
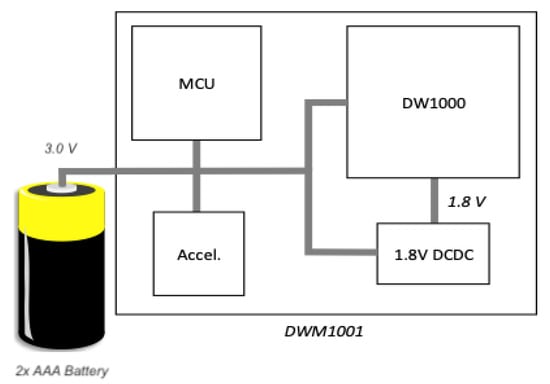
Figure 18.
System diagram of the modified power supply configuration.
The Qorvo tool implemented in Excel provided an estimated battery life of 193.2 h according to the following input data:
- Capacity of the connected two-cell Alkaline battery: 570 mAh (average measured value discharging the battery at 2.1 V);
- Average power efficiency of the external power regulator: 100% (the regulator is bypassed);
- Ranging rate: 10 Hz (to speed up the battery discharge test);
- Time spent ranging each day: 24 h (the onboard accelerometer and the motion detection have been deactivated, so the tag is always ranging);
- Average current drained by the STM32 microcontroller: 0 mA (STM32 has been deactivated and isolated).
Again, during the test execution, the tag was positioned on a table with a clear line of sight with four anchors equipping the testing lab. The position computed by the RTLS system has been logged on a PC connected to another Qorvo device configured as Listener.
The DWM1001 tag stopped working when the battery voltage reached the cut-off value of 2.07 V after 49.1 h; the real battery lifetime counted again for about 25% of the predicted life of 193.2 h. The battery discharge curve was already proposed in the previous Figure 17.
3.3.3. Test Results
The results of the battery lifetime test are summarized in Table 13 below.
Table 13.
Results from the two batteries test.
The results of the two tests are consistent; in particular, in both cases, the real measured battery lifetime counts for about 25% of the predicted life provided by the official Qorvo tool. While in the first test, the external regulator efficiency may have affected the result, in the second test, the two-cell battery was directly connected to the DWM1001 module, thus eliminating any possible source of error. According to these results, it seems reasonable and conservative to apply a correction factor of ¼ to the predicted battery lifetime in order to obtain its realistic duration in practical use cases.
This approach has been used to design the proper battery for the industrial case described in the next section; in particular, a Samsung single-cell Li-Ion battery coded as ICP553450 has been selected for its interesting features in terms of dimensions (53.4 × 34.2 × 6.5 mm), weight (23 g) and capacity (1.100 mAh). The battery lifetime in a real industrial scenario has been estimated using the official Qorvo tool plus the previously-mentioned correction factor, according to the following input data:
- Capacity of the connected Li-Ion rechargeable battery: 1.100 mAh;
- Average power efficiency of external RT8059 power regulator: 93%;
- Ranging rate: 0.2 Hz (asset location every 5 s);
- Time spent ranging each day: 6 h (during asset handling);
- Average current drained by the STM32 microcontroller: 0 mA.
The raw output of the Excel spreadsheet is a battery lifetime of 1.678 days, which becomes 419 days (more than one year) after the application of the correction factor. This battery duration is suitable for many industrial asset tracking applications; in case some specific applications require an increased battery life, it is possible to reduce the ranging rate to increase the battery lifetime. If the ranging rate is set to 0.017 Hz (asset location every minute), the real battery life estimation reaches 890 days (approximately 2.5 years).
4. Prototype Industrialization
Since the RTLS system proved to be suitable for a multi-tag environment similar to an industrial one, the focus then shifted to the design and the subsequent prototyping of an industrial case; the latter is intended to be an object that can provide both protection for the RTLS board and different ways of attachment in order to make the industrialized tag more versatile.
The first step in developing the prototype was to identify standard industrial assets and how the tag could potentially be applied to them. The resulting usages were identified, and the developed case is suitable to satisfy the requirements of all the following:
- Pallet: the tag can be applied by means of a band around the pallet or by being incorporated between the multiple layers of plastic film wrapping the items;
- Container: the tag can be attached on the outside surface through magnets or at the locking mechanism by using a band;
- Forklifts and industrial trucks: the tag can be fixed to a pole with a band or attached to a metal plate with magnets;
- Cardboard boxes: the tag can be attached with a band;
- Asset Inventory (general): the tag can be attached to any object using a band or by securing it with screws;
- People: the tag can be used to keep track of staff movements by wearing it around the neck with a lanyard.
Another requirement for a rugged industrial case is the resistance to environmental factors such as water and dirt. To achieve this level of resistance, it is essential to ensure a good seal by using seals such as O-rings.
As a result, the industrial case needs to be perfectly sealed and have the following attachment capabilities: holes for the screws and the band and cavities for the magnets.
In order to guarantee easy access to its internal components, at the physical level, the case is constituted of two parts kept together by screws named, for convenience, “lower case” and “upper case”. The lower case is the one that presents all the attachment capabilities, while the upper case (cover) is needed in order to seal the whole case.
The lower case was designed as a 95 × 60 mm flat surface (3 mm thickness). In a central position, the RTLS board is placed by means of three plastic supports and relative screws. The outer flanges of the lower case are symmetrical, and both have two mm holes and one 3 × 12 mm hole. Furthermore, two cavities were made underneath the board housing to position two magnets. Lastly, on the coupling surface of each of the two parts, two O-ring grooves were cut to ensure a good seal in the final case.
After an initial design developed in SolidWorks 2022, the case was 3D printed using fused deposition modeling (FDM) technology. The prototype was printed on a PRUSA i3 MK3S (https://www.prusa3d.com/product/original-prusa-i3-mk3s-3d-printer-kit/; accessed on 22 May 2023) using a red FormFutura® EasyFil PLA filament. As this print was a prototype, a 20% fill was used to achieve a fair resistance object without making it too heavy.
After the first prototyping, the focus shifted to the design of an industrial case that was much more suitable for mass production. Injection molding was identified as the best manufacturing process to be involved. To make the case suitable for this process, the following minimal geometric adjustments were made:
- Thickness reduction to 3–4 mm to meet injection molding specifics;
- A more uniform thickness over the entire part to avoid a differential shrinkage that could cause deformations;
- Lighten the material, where possible, to ensure homogeneous cooling;
- Reinforcing the base of the three board’s support to prevent bending fractures;
- Adjustment of the multiple fillet radius to ensure a radius-to-thickness ratio between 0.4 and 0.6;
- To ease the ejection, both parts were designed with draft angles between 0.5–1°.
The figures below (i.e., Figure 19 and Figure 20) show some renderings of the case once the adjustments described above were made.
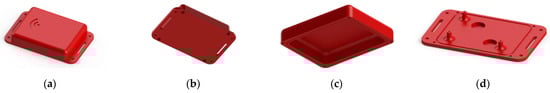
Figure 19.
Printed case for hosting tags. (a,b) whole case; (c) upper case; (d) lower case.
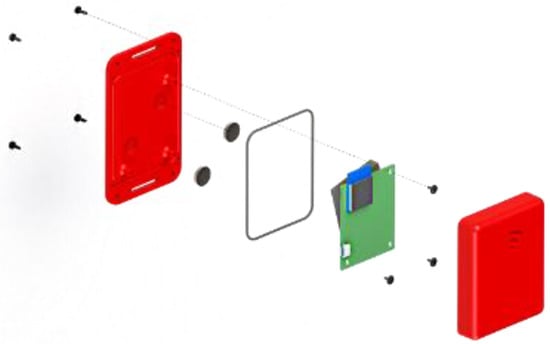
Figure 20.
Assembly sequence for inserting the tag.
5. Economic Assessment
For completeness and to provide an idea of the potential cost of industrialization of this solution, an updated economic assessment was carried out. Updated since other than the added battery and case, an increase in the price of the original kit, compared to the first paper, was recorded: indeed, at the time of the first study dealing with this system in December 2023, the cost for the Qorvo MDEK 1001 kit was approximately 214 EUR, corresponding to a unitary cost for the tag of 17.83 EUR [1]. Currently, the cost for a kit has risen to precisely 322.92 EUR (approximately a 50% increase); accordingly, being a kit constituted of 12 tags, each tag costs 26.91 EUR.
To these 26.91 EUR, other two cost items have to be included, in the light of the evolutions presented in the previous sections:
- -
- The cost for the battery, valued at approximately 6 euros;
- -
- The unitary cost for the case.
With reference to the case, three quotations were requested from three different companies operating in the field of injection molding (the more convenient quotation was then considered); a fixed cost of 7800 EUR corresponds to the mold development, regardless of the number of requested final items; clearly, this cost should be charged to the solution supplier. Moreover, on the assumption of a production lot of 1000 cases, the unitary production cost (injection molding) corresponds to 1.84 EUR.
Table 14 below resumes the cost to be held for one single tag.
Table 14.
Unitary cost for a tag.
According to the above results, depending on the number of assets and accordingly tags, Table 15 shows the cost for a kit.
Table 15.
Cost for a kit according to the number of tags.
It immediately follows that, from the side of the system integrator (solution provider) of the system, having considered a 10.00 EUR markup for each tag, after having sold 780 tags, the mold is amortized, and then gains would come.
6. Conclusions
This paper demonstrates the feasibility, at an affordable price, of the implementation of an RTLS based on UWB signals for different industrial and manufacturing contexts, for tracking purposes. Starting from the promising results proposed in [1], in this paper, four additional issues were investigated for completing the feasibility of industrialization.
The first interesting result is related to the anchors’ arrangement: indeed, compared to what one may think, the best configuration which ensures the best tag positioning identification is the wall centered, and not that corresponding to the corners of the room, as could probably be expected being the most common configuration adopted in RTLS deployments. However, since the differences in performances are very limited, depending on the installation constraints, the solution provider may assume every configuration is suitable with good accuracy. This outcome may be useful for those practitioners who may have to decide where to position anchors.
As far as the multi-tag test, which is a completely new aspect in the scientific literature, as already stressed, its aim was that of understanding the minimum distance among tags allowing tracking them without interference; overall, what emerges is that up to a 0.66 m closeness they do not interfere and the positioning is quite accurate, while at a distance of 0.1 m from tag to tag the system less performing but nonetheless suitable for asset tracking applications.
Regarding the tag’s battery, the two different batteries tested, i.e., a Li-Ion rechargeable battery and two AAA Alkaline batteries, both returned consistent results, which correspond to 25% of the predicted life provided by the official tool involved; starting from this outcome, it is reasonable to assume a correction factor of 0.25 to the predicted battery lifetime. Overall, providing a solution inclusive of its own battery is definitely an added value.
For completing the analysis, also a case for hosting the RTLS board and the battery was designed and conceptualized and even physically 3D printed. This case, designed to be easily attached to the asset to be tracked, is suitable for the different usages recognized within manufacturing companies, and its industrialization was studied.
All of the above is accompanied by an economic analysis whose main outcome is the unitary price of a tag (including its packaging, i.e., the case and the battery). This price can be considered both from the side of a supplier of such systems and from that of a potential company interested in implementing the RTLS solution in its plants.
Surely, in the future, it is in a plan to initialize a marketing strategy so as to advertise the developed industrial solution.
Author Contributions
Conceptualization, A.V., R.M., L.T. and M.M.; methodology, A.V. and M.M.; validation, A.V. and L.T.; formal analysis, A.V. and L.T., investigation, L.T.; resources, R.M.; data curation, A.V. and M.M.; writing—original draft preparation, L.T. and M.M.; writing—review and editing, A.V., L.T. and R.M.; supervision, R.M.; project administration, R.M. All authors have read and agreed to the published version of the manuscript.
Funding
This research received no external funding.
Data Availability Statement
Not applicable.
Conflicts of Interest
The authors declare no conflict of interest.
References
- Volpi, A.; Tebaldi, L.; Matrella, G.; Montanari, R.; Bottani, E. Low-Cost UWB Based Real-Time Locating System: Development, Lab Test, Industrial Implementation and Economic Assessment. Sensors 2023, 23, 1124. [Google Scholar] [CrossRef] [PubMed]
- Alarifi, A.; Al-Salman, A.; Alsaleh, M.; Alnafessah, A.; Al-Hadhrami, S.; Al-Ammar, M.; Al-Khalifa, H. Ultra Wideband Indoor Positioning Technologies: Analysis and Recent Advances. Sensors 2016, 16, 707. [Google Scholar] [CrossRef] [PubMed]
- Halawa, F.; Dauod, H.; Lee, I.; Li, Y.; Yoon, S.; Chung, S. Introduction of a real time location system to enhance the warehouse safety and operational efficiency. Int. J. Prod. Econ. 2020, 224, 107541. [Google Scholar] [CrossRef]
- Dardari, D.; Closas, P.; Djuric, P. Indoor Tracking: Theory, Methods, and Technologies. IEEE Trans. Veh. Technol. 2015, 64, 1263–1278. [Google Scholar] [CrossRef]
- Mazhar, F.; Khan, M.; Sallberg, B. Precise Indoor Positioning Using UWB: A Review of Methods, Algorithms and Implementations. Wirel. Pers. Commun. 2017, 97, 4467–4491. [Google Scholar] [CrossRef]
- Curran, K.; Furey, E.; Lunney, T.; Santos, J.; Woods, D.; McCaughey, A. An evaluation of indoor location determination technologies. J. Locat. Based Serv. 2011, 5, 61–78. [Google Scholar] [CrossRef]
- Simedroni, R.; Puschita, E.; Palade, T.; Dolea, P.; Codau, C.; Buta, R.; Pastrav, A. Indoor positioning using decawave MDEK1001. In Proceedings of the 2020 International Workshop on Antenna Technology (iWAT), Bucharest, Romania, 25–28 February 2020. [Google Scholar]
- Bottani, E.; Montanari, R. RFID and real time localization systems for warehouse management: A model for technical and economic evaluation. Int. J. RF Technol. Res. Appl. 2013, 4, 209–245. [Google Scholar] [CrossRef]
- Huang, S.; Guo, Y.; Zha, S.; Wang, F.; Fang, W. A real-time location system based on RFID and UWB for digital manufacturing workshop. Procedia CIRP 2017, 63, 132–137. [Google Scholar] [CrossRef]


Disclaimer/Publisher’s Note: The statements, opinions and data contained in all publications are solely those of the individual author(s) and contributor(s) and not of MDPI and/or the editor(s). MDPI and/or the editor(s) disclaim responsibility for any injury to people or property resulting from any ideas, methods, instructions or products referred to in the content. |
© 2023 by the authors. Licensee MDPI, Basel, Switzerland. This article is an open access article distributed under the terms and conditions of the Creative Commons Attribution (CC BY) license (https://creativecommons.org/licenses/by/4.0/).