Article

A Proof-of-Concept Study of Stability Monitoring of Implant Structure by Deep Learning of Local Vibrational Characteristics

1
Faculty of Civil Engineering, Ho Chi Minh City University of Technology (HCMUT), 268 Ly Thuong Kiet, District 10, Ho Chi Minh City 700000, Vietnam
2
Vietnam National University Ho Chi Minh City (VNU-HCM), Linh Trung Ward, Thu Duc City, Ho Chi Minh City 700000, Vietnam
3
Institute of Research and Development, Duy Tan University, Da Nang 550000, Vietnam
4
Faculty of Civil Engineering, Duy Tan University, Da Nang 550000, Vietnam
5
Department of Ocean Engineering, Pukyong National University, Busan 48513, Republic of Korea
6
Urban Infrastructure Faculty, Mien Tay Construction University, Vinh Long 890000, Vietnam
*
Authors to whom correspondence should be addressed.
J. Sens. Actuator Netw. 2024, 13(5), 52; https://doi.org/10.3390/jsan13050052
Submission received: 1 June 2024 / Revised: 29 July 2024 / Accepted: 30 July 2024 / Published: 3 September 2024
(This article belongs to the Section Actuators, Sensors and Devices)

Abstract

:
This study develops a structural stability monitoring method for an implant structure (i.e., a single-tooth dental implant) through deep learning of local vibrational modes. Firstly, the local vibrations of the implant structure are identified from the conductance spectrum, achieved by driving the structure using a piezoelectric transducer within a pre-defined high-frequency band. Secondly, deep learning models based on a convolutional neural network (CNN) are designed to process the obtained conductance data of local vibrational modes. Thirdly, the CNN models are trained to autonomously extract optimal vibration features for structural stability assessment of the implant structure. We employ a validated predictive 3D numerical modeling approach to demonstrate the feasibility of the proposed approach. The proposed method achieved promising results for predicting material loss surrounding the implant, with the best CNN model demonstrating training and testing errors of 3.7% and 4.0%, respectively. The implementation of deep learning allows optimal feature extraction in a lower frequency band, facilitating the use of low-cost active sensing devices. This research introduces a novel approach for assessing the implant’s stability, offering promise for developing future radiation-free stability assessment tools.

1. Introduction

Clinical outcomes of implants are intricately tied to the meticulousness of preoperative treatment planning and the carefulness of postoperative follow-up during the convalescent period [1]. Marginal bone loss (MBL) is a principal parameter for evaluating the stability and the postoperative success of implants. According to well-established criteria used to evaluate implant survival and stability, MBL during the first year should be maintained at less than 1.5 mm [2]. After the first year, MBL should be less than 0.2 mm [3]. If over half of the bone surrounding the implant is lost, the implant is classified as a failure [4]. Recent clinical evidence has shown that the failed implants underwent significant early MBL [5].
The quantitative MBL monitoring at the bone–implant interface after implantation is therefore critical in ensuring the success of implants. Detecting potential issues early enables swift intervention and treatment, mitigating the risk of implant failure [6,7]. Researchers have developed several implant stability evaluation methodologies, including radiographs [8], the Dental Mobility Checker (DMC) [9], the Periotest [10,11], and resonance frequency analysis (RFA) [12]. Radiographic analysis offers a noninvasive method for evaluating implant stability at various healing stages. It provides quantifiable measures of crestal bone levels, essential for assessing implant success. While the radiographic method is effective for bone-loss detection, detecting changes in bone loss at a resolution of 0.1 mm poses challenges for clinicians [9]. Moreover, the method cannot quantify bone quality, density, or changes in bone minerals until significant demineralization has occurred. Furthermore, the reliable measurement of crestal bone changes requires perfect alignment of the X-ray source.
The DMC method gauges tooth mobility using an impact hammer method, converting tooth and alveolar bone rigidity into acoustic signals [9,13]. The response signal, analyzed through Fast Fourier Transform (FFT) with a microphone, detects the impact’s first wave duration. Despite suitability for molar regions and stable osseointegrated implant measurements, DMC encounters challenges such as double-tapping difficulties and constant excitation issues [9]. Further, applying a small force post-implant placement may impact osseointegration. The Periotest method employs an electromagnetically driven metallic rod and accelerometer to evaluate implant stability, converting signals into the Periotest value (PTV) based on tissue damping characteristics [10,11]. While effective in assessing bone-implant anchorage stability in some studies, the Periotest faces challenges in modeling the periodontal ligament’s behavior and lacks sensitivity for implant mobility, given its wide dynamic range designed for natural teeth. The method’s effectiveness is impacted by excitation conditions, making it challenging to use in the molar region. Another drawback includes difficulties in interpreting borderline implants and potential inaccuracies due to uncontrollable influential factors [9,14,15].
The RFA technique involves assessing the natural frequency or resonance of an implant through the induction of mechanical vibrations [16,17]. Typically, a transducer is affixed to the implant and vibrations are applied, with a subsequent analysis of the resulting frequencies to ascertain the implant’s stability. The resonance frequency values, falling within the range of 3.5 to 8.5 kHz, are then transformed into an ISQ (Implant Stability Quotient) scale ranging from 0 to 100 [9]. Higher resonance frequencies generally correlate with increased stability [18]. RFA is widely employed as a non-invasive technique for evaluating implant stability, ensuring patient-friendliness and minimizing additional discomfort. Additionally, it offers real-time feedback during surgery, aiding immediate decision-making. Despite its widespread use, a universally accepted threshold for stability has yet to be established, and practitioners view values below 45–50 as posing a risk to stability [19]. Additionally, there is a lack of consensus regarding the appropriate interpretation of the ISQ value [20].
Recognizing that pursuing an ideal biomechanical technique transcends mere enhancements of existing commercial systems or methodologies, researchers have introduced alternative strategies grounded in the PZT-based conductance technique [7,20,21]. This novel approach uses a diminutive and noninvasive piezoelectric transducer, such as PZT patches, to induce excitation in the implant structure across multiple directions within a high-frequency band, while measuring the conductance response, specifically the real component of the admittance, which is closely linked to the structural and functional state of the implant [7]. This approach offers notable advantages, including cost-effectiveness, heightened sensitivity, precision, and the capacity for real-time monitoring [22,23]. Its operational principle involves utilizing short-wavelength waves within a high-frequency range, enabling the early detection of structural impairments [24]. While PZT-enabled conductance sensing has been widely used across a variety of physics applications, notably in structural integrity monitoring and progress [25,26,27,28,29], its integration within dentistry remains somewhat restricted.
A pioneering work reported the potential of the PZT-enabled conductance sensing technique in evaluating the stability of implants [20]. The admittance signature of the implant was monitored under simulated inverse bone healing conditions [30]. The results revealed a discernible frequency shift in the admittance spectrum, effectively establishing a clear correlation between the changing conductivity and the subsequent degradation process. In another study [21], PZT-enabled conductance sensing was modeled for monitoring bone regeneration surrounding implants post-surgery. A finite element (FE) model, which incorporated variations in the bone–implant interface’s stiffness, was established to emulate the bone healing process. The FE results unequivocally revealed that alterations in the conductance response of the implant paralleled variations in Young’s modulus at the bone–implant interface. The experimental findings advocated for using statistical parameters to assess the stages of healing, positing this as a more reasonable approach than direct comparisons of conductance values or peak frequencies [7]. Despite these notable endeavors, it is worth highlighting that the application of the PZT-enabled conductance sensing technique for monitoring MBL surrounding implants has, to date, remained unexplored. Moreover, the local dynamic characteristics of a PZT–implant–bone system have been not reported in the literature. Identifying the local vibrational modes of the implant constrained by the bone while excited by the PZT can aid in understanding the mechanism of the electromechanical interactions and the interpretation of the collected conductance data. It further allows researchers and practitioners to preliminarily identify changes in implant stability or other conditions.
As a high-performance deep learning algorithm, the convolutional neural network (CNN) has attracted significant attention in health monitoring and structural condition assessment [31,32,33,34,35]. The CNN algorithm was used to predict prestress levels in a concrete girder by harnessing the raw electro-mechanical impedance response (i.e., an inverse of the admittance) [36]. It was also implemented to assess cement mortar’s hydration and solidification processes [37]. Furthermore, its feasibility for the automated detection of bolt looseness was reported in [38]. Its distinctive architecture, which combines feature extraction and prediction functionalities, sets the CNN algorithm apart from traditional machine learning methods. This unique characteristic empowers the algorithm to autonomously process and discern optimal features directly from raw data inputs [31,38,39]. Among the various CNN models, the 1D CNN has emerged as a particularly compelling choice within the academic community, owing to its computational efficiency and applicability in real-time scenarios [36,40,41,42,43,44]. Considering that the conductance response inherently constitutes a 1D signal, the 1D CNN algorithm is an analytical tool well suited for direct processing, eliminating data transformation, and accelerating prediction. Despite this inherent potential, it is noteworthy that, so far, the 1D CNN algorithm has not been utilized to autonomously process conductance data in the context of dental MBL assessments. Moreover, the application of deep learning could reduce the need for high-performance impedance analyzers. As reported in a previous study, the suitable frequency band for stability assessment is 500–1000 kHz [21], which is much higher than the measurable range of inexpensive impedance measurement devices [45,46]. By optimizing the local vibration features of low-frequency resonances, the implementation of deep learning could enhance the robustness of stability assessment in a lower-frequency band.
In the current study, we develop a novel MBL monitoring approach for single-tooth implant structures that combines the PZT-enabled conductance sensing technique with deep 1D CNNs. We design four 1D CNN-based models, which automate the processing of raw conductance signals acquired through PZT-enabled sensing for MBL estimation. We employ predictive FE modeling to evaluate the feasibility and efficacy of our proposed method. Initially, we develop a PZT–commercial implant–bone model employing a well-validated FE modeling methodology. Our next endeavor involves identifying local vibrational modes within the implant corresponding to resonant conductance peaks. This exploration provides valuable insights into the interactions between the PZT transducer and the implant’s host structure. Subsequently, we derive the conductance response of the implant under various MBL scenarios from the FE modeling. We introduce Gaussian white noise into the raw conductance signals to emulate realistic conditions and augment the training data. Following this, we train and test our 1D CNN-based MBL estimation models using the noise-contaminated conductance data. Consequently, the performance of the trained 1D CNN models is compared to determine the best 1D CNN architecture for bone loss monitoring. Our most proficient 1D CNN model exhibited low training and testing errors of 3.7% and 4.0%, respectively. Our method, which directly extracts optimal features from raw conductance signals without the need for preprocessing, holds considerable potential for practical MBL monitoring and implant stability assessment in the field of dentistry.

2. Stability Monitoring Method for Implant Structure

2.1. Overview of the Methodology

The proposed approach for automated bone loss monitoring and assessment, which integrates the cost-effective PZT-enabled conductance sensing technique with the 1D CNN algorithm, is depicted in Figure 1. This amalgamation of feature extraction and classification/prediction functions within a unified framework represents a significant breakthrough in the 1D CNN algorithm [31]. The significance of the proposed method lies in its capability to directly process and autonomously acquire optimal features from the raw conductance signal, therefore enabling automated MBL monitoring and estimation at the bone–implant interface. Hence, the proposed method exhibits substantial promise for facilitating autonomous monitoring and evaluation of implant stability [27].
The framework of the proposed method comprises the following sequential steps: (a) a PZT transducer is attached to the superstructure’s surface of the implant; (b) a portable conductance analyzer facilitates a harmonic voltage in a higher frequency range to the PZT transducer [46,47,48]; (c) the conductance analyzer records the raw conductance response under bone loss occurrence; (d) the acquired conductance data are fed into a pre-trained 1D CNN-based model to predict MBL; and (e) the MBL and the implant’s stability are assessed based on the output of the 1D CNN model.

2.2. PZT-Based Conductance Measurement Approach

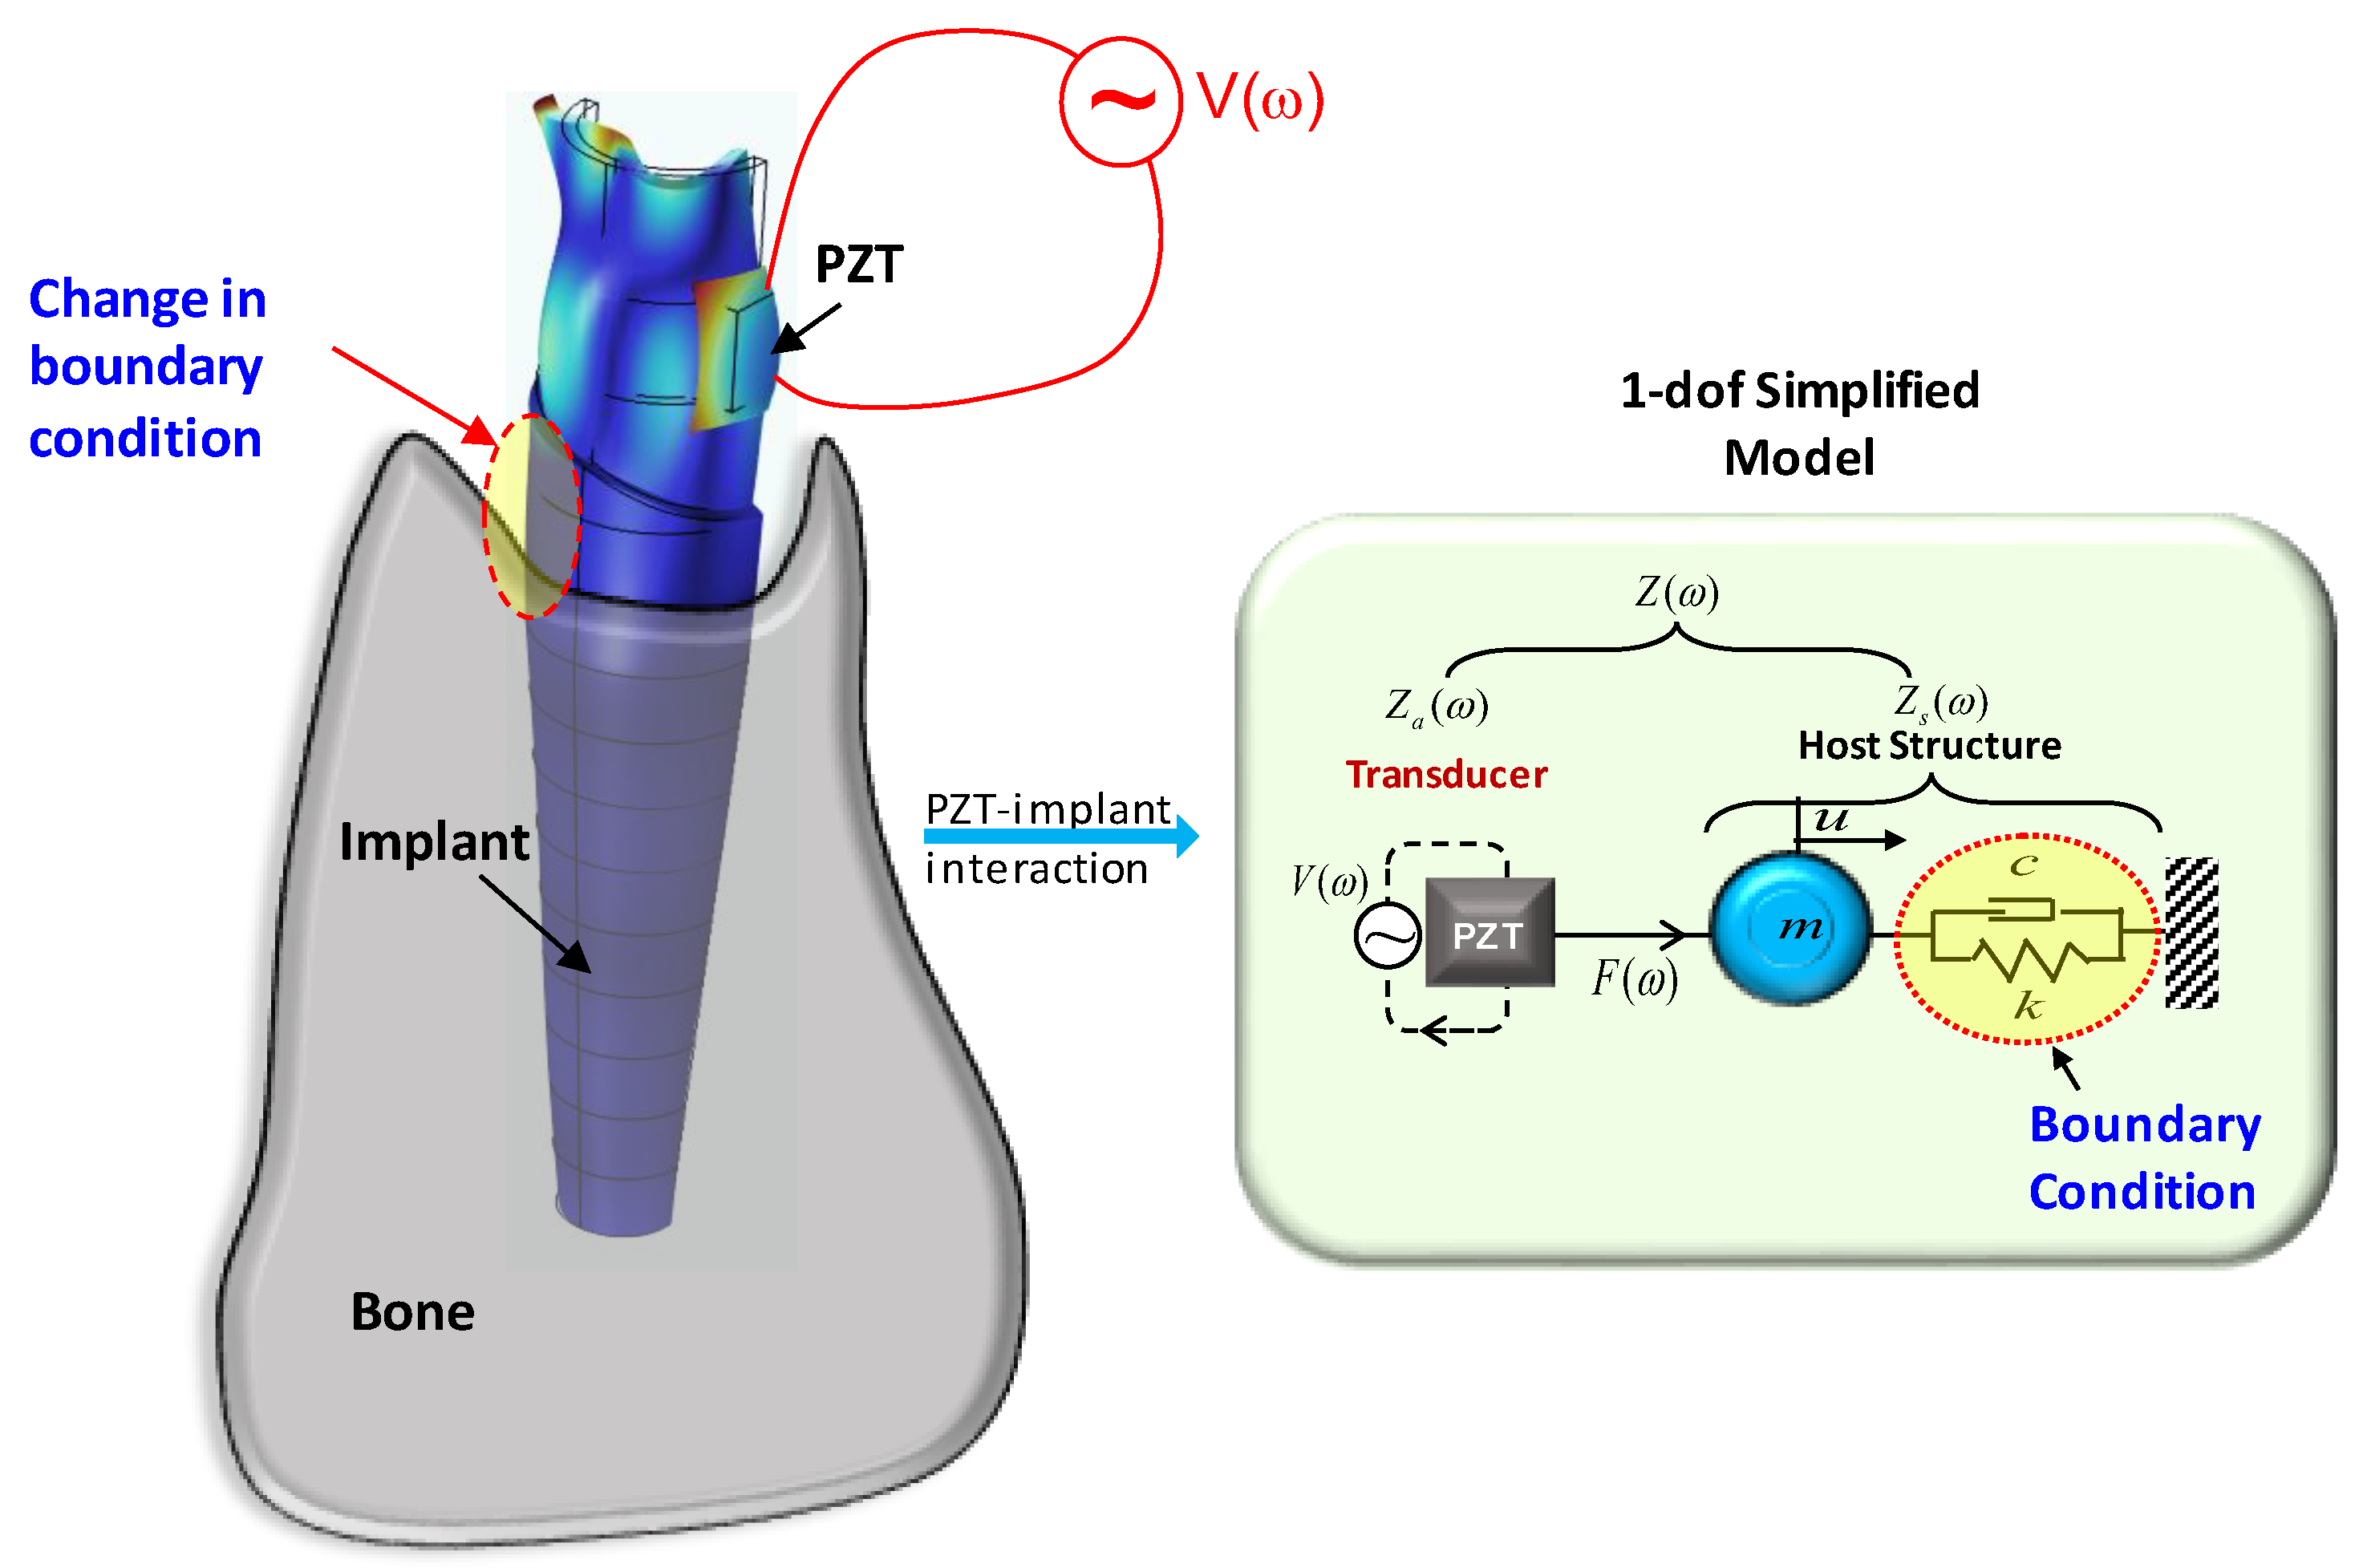
The active sensing technique that utilizes piezoelectric elements (such as PZT) to characterize structures and materials was introduced in reference [49]. In this approach, a PZT patch is attached to the host structure, such as an implant, to capture the admittance response, as shown in Figure 2. This response is equivalent to the inverse of impedance and reflects the electro-mechanical coupling between the transducer and the host structure. Since this coupling is closely connected to its structural and functional condition, the implant’s stability can be assessed by monitoring the conductance response (i.e., the real part of admittance) [7]. To enable the early detection of structural impairments, this technique involves the use of short-wavelength waves within a high-frequency range [24].
As visually depicted in Figure 2, when subjected to a harmonic voltage, denoted as V(ω), the transducer undergoes harmonic deformation owing to the inherent effects of piezoelectricity. This deformation of the transducer, at its point of actuation, instigates vibrations within the host structure through the medium of piezoelectric interaction [50]. Consequently, the transducer establishes a coupling mechanism with the host structure across a predefined frequency band, thereby facilitating the system’s ability to monitor the implant’s structural characteristics and detect any alterations in its structural properties. As illustrated in Figure 2, the coupling vibration of the PZT–implant system can be simplified by a 1-dof mass–spring–damper model according to reference [49]. The piezoelectric expansion of the PZT transducer generates an excitation force denoted as F, acting upon the host structure (i.e., the implant). Assuming that the host structure can be characterized by specific parameters, including mass (m), stiffness (k), and damping (c), its mechanical impedance (Zs) can be mathematically expressed as follows:
Z s ( ω ) = c + m ω 2 ω n 2 ω i
In Equation (1), ω represents the scanning frequency, ωn denotes the natural frequency of the host structure (i.e., the implant), and i represents the imaginary unit.
The mechanical impedance of the PZT transducer can be determined using the following equation [49,51]:
Z a = w a t a Y ^ x x E i ω l a
In Equation (2), the PZT transducer has a width wa, a length la, and a thickness ta, as well as a complex Young’s modulus in the x-orientation under zero-stress conditions ( Y ^ x x E ).
The admittance response (Y) of the PZT–host structure system can be derived from the simplified 1-dof simplified model, which is a combined function of the mechanical impedance of the host structure (Zs) and that of the PZT (Za), as follows [49]:
Y = i ω w a l a t a ε ^ x x T 1 Z a ( ω ) / Z s ( ω ) + 1 d 3 x 2 Y ^ x x E
In Equation (3), ε ^ x x T represents the complex dielectric constant when under zero-stress conditions and d3x denotes the piezoelectric coupling coefficient in the x-orientation under zero-stress conditions.
By considering Equations (1) and (3), it becomes evident that the resulting admittance response encapsulates valuable information about the host structure’s dynamical characteristics (i.e., m, c, and k). Consequently, any shifts in the dynamical attributes of the host structure over time will inevitably lead to alterations in the resulting admittance response. In practice, the conductance response (i.e., the real part of the admittance) is often used for structural monitoring and assessment since it contains more structural information than the susceptance (i.e., the imaginary part of the admittance).
The occurrence of bone loss around the implant leads to a modification in the boundary conditions of the implant, as seen in Figure 2. Consequently, the modal stiffness of the bone–implant system changes, inducing a shift in the conductance response. In practical applications, this conductance response is monitored across a high-frequency range of up to 1 megahertz. The short wavelengths of these high frequencies enable the PZT-enabled conductance sensing technique to detect the initial MBL around the implant. Traditionally, for condition monitoring and assessment, such a high-frequency band is selected through a manual process [52,53]. However, within a frequency band, the conductance response at each frequency point often displays varying trends, potentially leading to nonlinear correlations between the conductance features and implant stability [7,20,21]. Consequently, developing an alternative approach to analyzing the conductance response, which can automatically select frequency points directly from the raw data, holds significant importance.

2.3. 1D CNN-Based Prediction Models

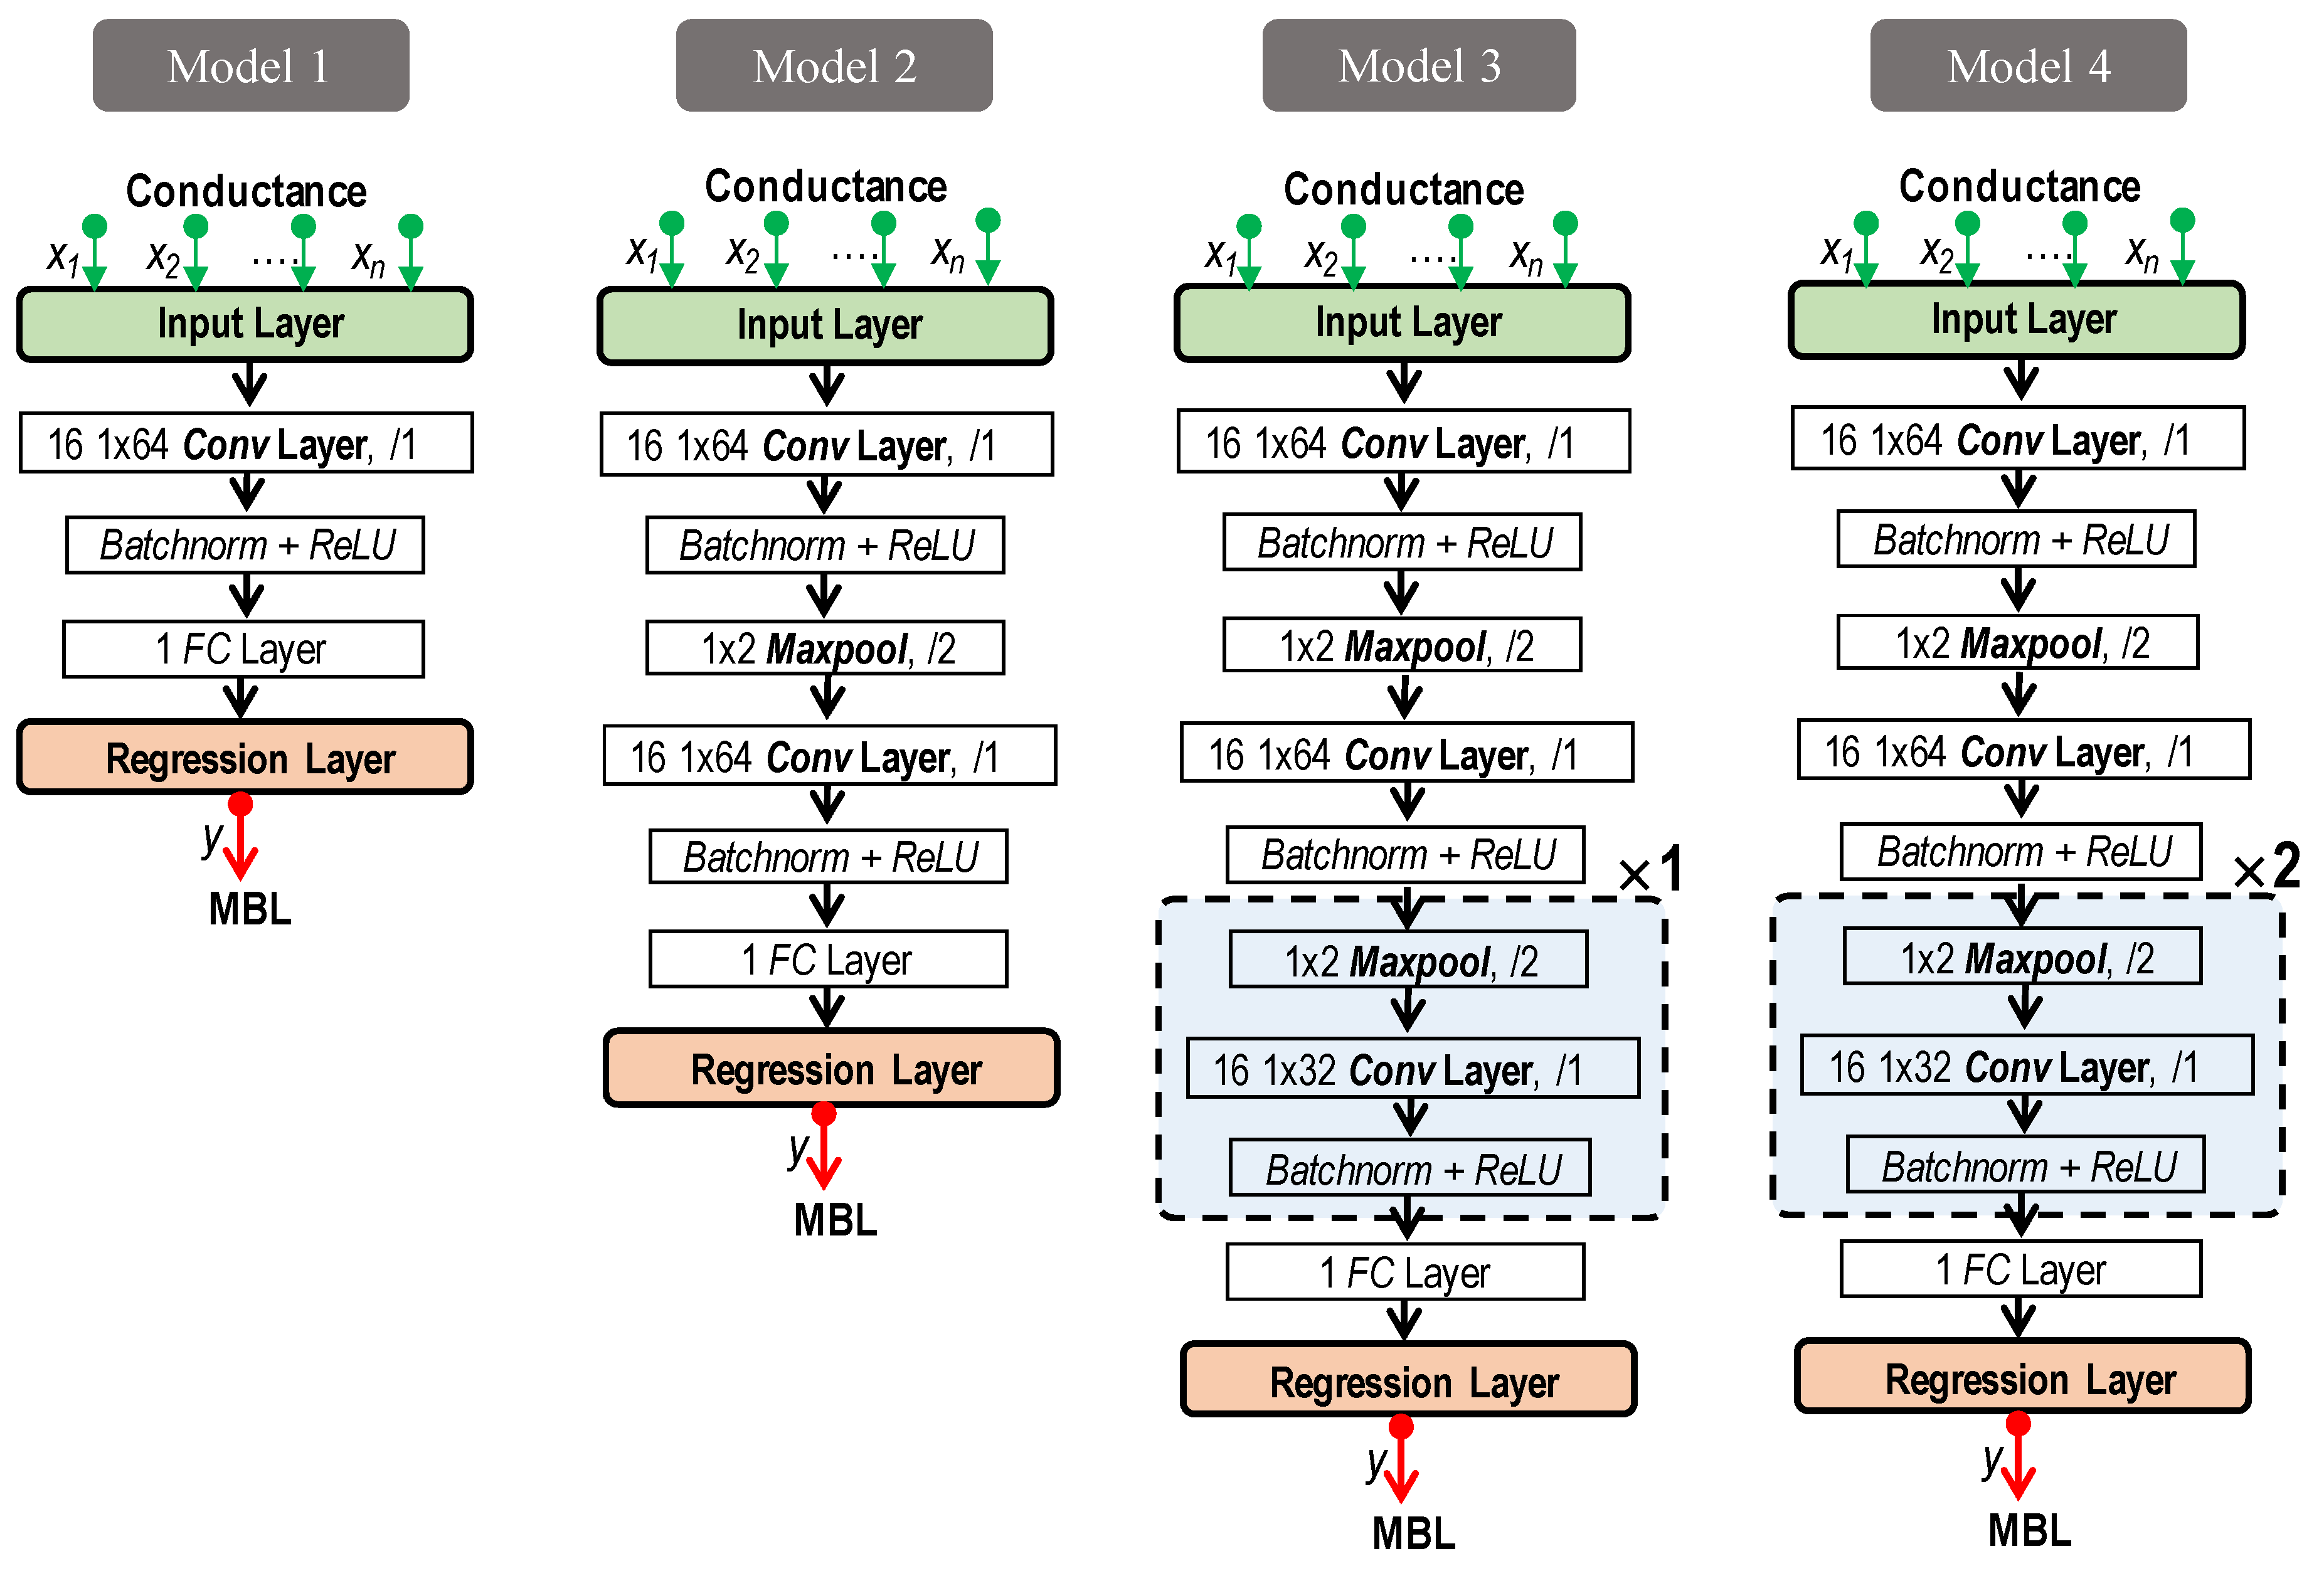
We formulate four 1D CNN models of varying depths tailored to the regression task, predicting MBL in an implant structure from raw conductance responses, as shown in Figure 3. These models take the raw conductance signal as input, implicitly navigate an autonomous feature extraction process, and subsequently yield MBL levels for the target implant. By seamlessly integrating feature extraction and prediction within a unified network architecture, these 1D CNN models autonomously extract and learn optimal features from raw conductance signals, ensuring the robustness and efficacy of the MBL assessment [36,37]. The 1D CNN algorithm showcases superiority over conventional neural networks concerning accuracy and speed [31,36,40,41,42]. In specific scenarios, the 1D CNN is advantageous in handling 1D signals like conductance responses due to its low computational intricacy, straightforward implementation steps, compatibility with standard computers for training, and suitability for cost-effective autonomous monitoring [43].
The architecture of the four 1D CNN models is depicted in Figure 3, with the complexity of the network increased from Model 1 to Model 4. Each model is built using primary CNN layers, including an input layer, convolutional layers (conv), batch normalization (batchnorm) layers, rectified linear unit (ReLU) layers, maxpooling layers (maxpool), a fully connected (FC) layer, and a regression output layer. The input layer x of the models takes the 1D conductance signal xi (where i ranges from 1 to n, with n being the amount of swept frequencies) while the regression layer estimates the MBL in percentage y (0 ≤ y ≤ 100%). It is noted that a set of batchnorm + ReLU layers is designed after each conv layer to expedite the training speed and mitigate the sensitivity to model initialization [54].
As depicted in Figure 3, Model 1 sequentially consists of an input layer, a conv layer with a kernel size of 1 × 128 × 16 (height × width × depth), batchnorm + ReLU layers, an FC layer with an output size of 1, and a regression layer. Model 2 is built by sequentially inserting a set consisting of a maxpool layer (a kernel size of 1 × 2 × 16, a stride of 2), a conv layer (a kernel size of 1 × 64 × 16), and batchnorm + ReLU layers before the FC layer of Model 1. To build Model 3, a set consisting of a maxpool layer (a kernel size of 1 × 2 × 16, a stride of 2), a conv layer (a kernel size of 1 × 32 × 16), and batchnorm + ReLU layers (i.e., Set X as highlighted in light blue in Figure 3) is inserted before the FC layer of Model 2. Model 4 is constructed by adding another Set X to Model 3. Detailed explanations of the layers’ functionalities and mathematical principles can be found in prior studies [55,56,57].
The prediction model’s training process entails minimizing the loss function. In this regard, the output layer utilizes the half-mean-squared-error loss function, which is represented as follows:
loss = 1 2 k = 1 R ( t k y k ) 2
To evaluate the prediction error of the trained model, we employ the root mean square error (RMSE), calculated as follows:
R M S E = k = 1 R ( t k y k ) 2 R
In Equations (4) and (5), R represents the number of responses, tk denotes the desired output, and yk signifies the predicted outcome for k.
In summary, the 1D CNN models play a pivotal role in autonomously processing raw conductance responses obtained from PZT-enabled conductance sensing. The underlying processes within these neural networks involve the following steps: (1) Step 1 is feature extraction, where relevant information is distilled from the raw conductance responses. This step is critical for capturing intricate patterns and characteristics associated with subtle changes indicative of MBL and structural stability variations. (2) Step 2 is pattern recognition, which entails learning to discern and interpret the extracted features. The network dynamically adjusts its internal parameters during the training phase to optimize its ability to recognize patterns related to different conditions, such as variations in the MBL of implants. (3) Step 3 is regression prediction. The final layer of the network is responsible for generating quantitative predictions for MBL, informed by the patterns and features acquired during the training phase.

2.4. Classification Criteria

Outlier analysis is employed to identify the occurrence of bone loss at the implant–bone interface. The MBL in a percentage, as the output of the 1D CNN model, is compared with a predetermined upper control limit (UCL) threshold. Supposing that the MBL values in the reference case follow a normal distribution, the UCL threshold can be established as 2.5 standard deviations away from the mean, corresponding to a confidence level of 99.38%, expressed as follows:
UCL = μ + 2.5 σ
where μ is the mean of the MBL values of the reference case and σ is the corresponding standard deviation. If the MBL value exceeds the UCL threshold, it is identified as a case of bone loss. Otherwise, the implant is considered to be in a healthy condition.

3. Local Vibrational Characteristics of PZT–Implant–Bone

The FE method has been widely used to evaluate the implant’s performance in dentistry. In this investigation, FE modeling of PZT-enabled conductance sensing for an implant subjected to MBL is conducted [58,59,60]. We employ multiphysics FE modeling for numerical simulations due to its well-established capacity to accurately model the coupling between mechanical and piezoelectric phenomena [61,62,63,64,65]. Our FE modeling involves three key steps. Initially, the FE simulation strategy for PZT-based active sensing is verified by comparing the experimental conductance responses of a PZT-free beam structure with the FE modeling results. Next, a PZT–commercial implant–bone model is simulated using the validated FE modeling. Finally, the implant’s conductance response is extracted under varying MBL scenarios while identifying local vibrational modes corresponding to resonant conductance peaks.

3.1. Finite Element Modelling Strategy

3.1.1. Experiment on a PZT-Beam Model

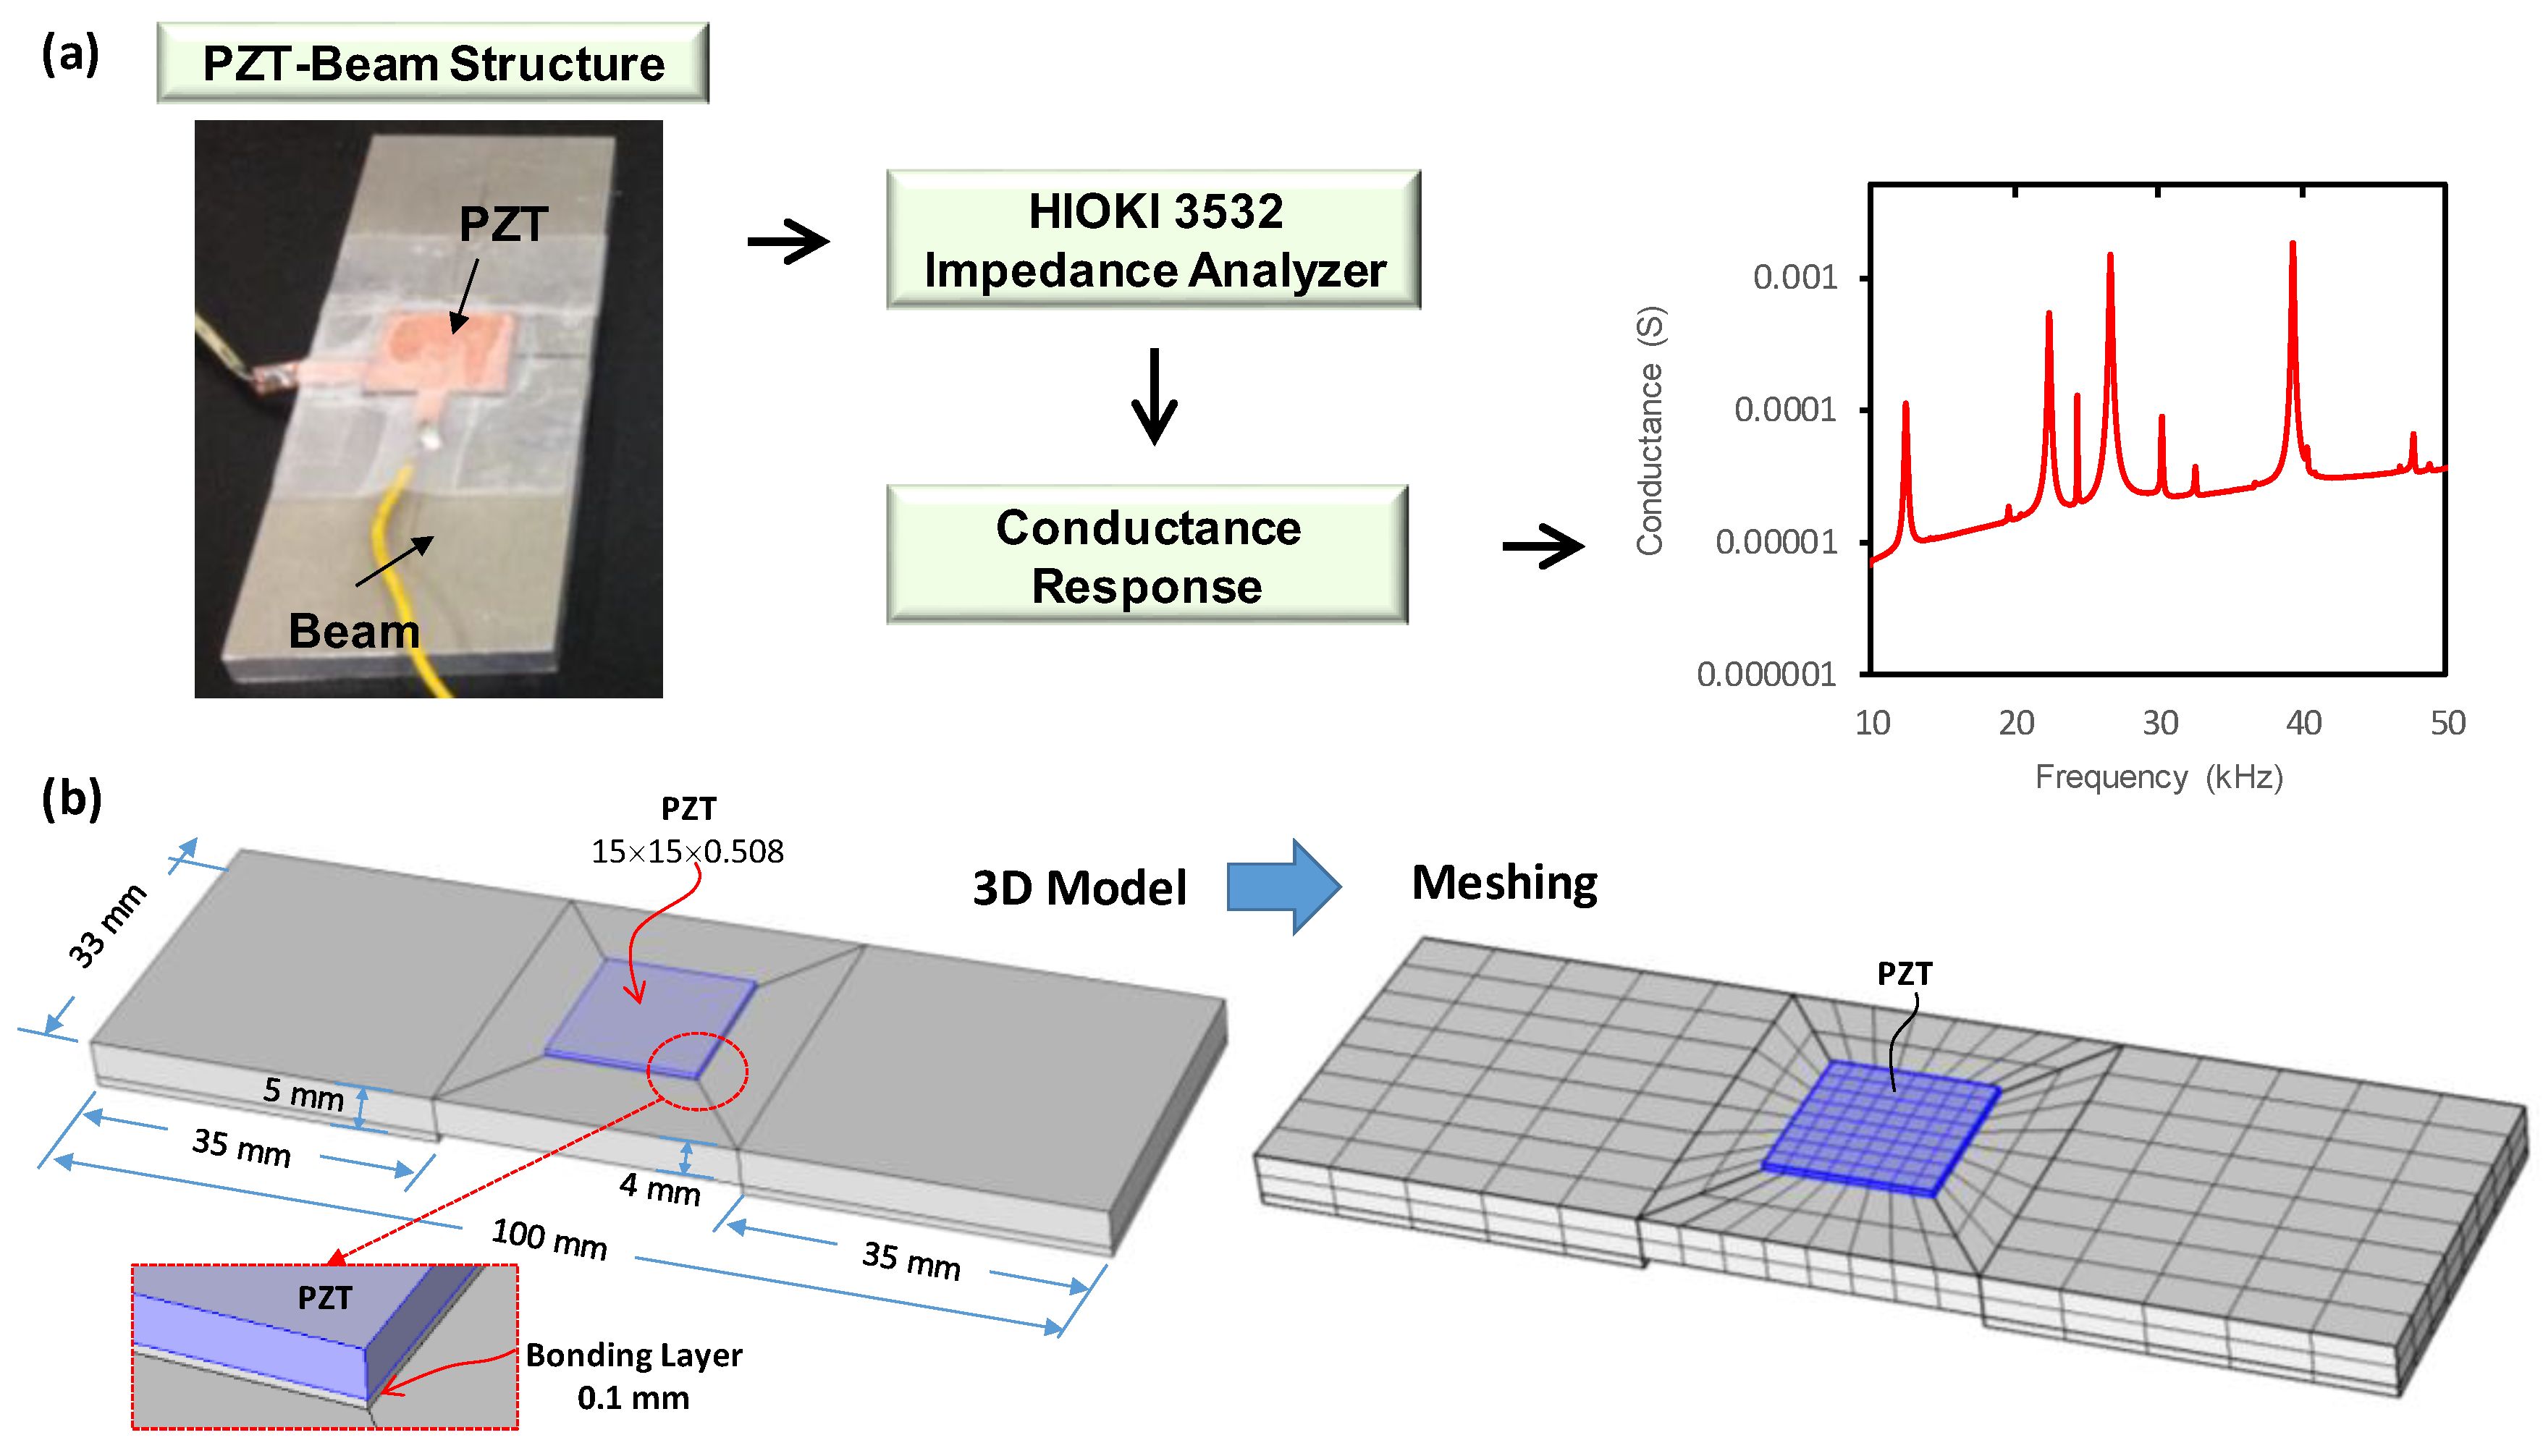
A lab-scaled experimental model was established to perform the PZT-enabled conductance sensing technique. As depicted in Figure 4a, the experimental model consists of an aluminum beam with a PZT-5A patch attached at the middle of the top surface. The beam has a size of 5 mm × 33 mm × 100 mm (height × width × depth) while the PZT transducer has dimensions of 0.508 mm × 15 mm × 15 mm. The transducer was mounted on the beam using an instant adhesive Loctite 401. In the active sensing process, the transducer was stimulated by a 1 V harmonic excitation voltage, facilitated by the HIOKI 3532 LCR hitester, while simultaneously measuring the conductance and susceptance responses of the PZT–beam system. The sweep frequency ranges from 10 kHz to 50 kHz with an interval of 0.05 kHz to investigate the bending vibration modes of the beam. To mitigate any temperature-related effects, we maintained a controlled room temperature of approximately 21 °C using air conditioning throughout the experiment.

3.1.2. FE Modeling of Conductance Response of Experimental PZT–Beam Model

The FE model of the tested PZT–beam model was constructed, as shown in Figure 4b. The dimensions of the PZT transducer and the beam closely followed the parameters of the previous experimental model. Notably, the beam exhibits variable cross-sections: the two outer segments possess a cross-section of 5 mm × 33 mm with a depth of 35 mm, while the middle segment is thinner, featuring a cross-section of 4 mm × 33 mm with a depth of 30 mm. The boundary condition for the beam was set as ‘free’. The PZT transducer was modeled with a bonding layer thickness of 0.1 mm to emulate realistic attachment conditions. The beam’s material is aluminum, characterized by the following mechanical properties: Young’s modulus of 70 × 109 Pa mass density of 2700 kg/m3, Poisson’s ratio of 0.33, and an isotropic structural loss factor of 0.006. The bonding layer possesses a Young’s modulus of 5.1 × 10⁹ Pa, a mass density of 1000 kg/m3, a Poisson’s ratio of 0.4, and a Rayleigh stiffness damping parameter of 6 × 10⁻⁹. The PZT transducer was assigned piezoelectric properties reported in the previous publication [66], while its constitutive relation was defined in the stress-charge form. The transducer exhibits an isotropic structural loss factor of 0.0125, while the isotropic dielectric loss factor related to the electrical permittivity is 0.015.
The model underwent meshing using the program’s user-controlled mesh sequence, with a finer mesh applied to the transducer region to accurately simulate the piezoelectric effect, as visualized in Figure 4b. The meshed FE model consists of 624 hexahedral elements. To simulate the piezoelectric phenomena inherent to PZT-enabled conductance sensing, our numerical FE simulation entailed coupling mechanics and piezoelectric effects [66]. In order to obtain the admittance response, a sinusoidal voltage with a magnitude of 1V was administered to the upper surface of the PZT transducer. In contrast, the lower surface was connected to the ground. Mirroring the previous experimental setup, we conducted a frequency-domain analysis to characterize the conductance response of the PZT–implant system across a frequency range spanning from 10 kHz to 50 kHz, with intervals of 0.05 kHz. For every frequency point within the sweep, we utilized the Generalized Minimum Residual (GMRES) iterative method to solve the governing equations of the problem. We set the convergence threshold for the simulation at 0.001. The admittance response was calculated as the division of the output current recorded from the PZT patch by the applied input voltage.

3.1.3. Accuracy of the FE Modelling Strategy

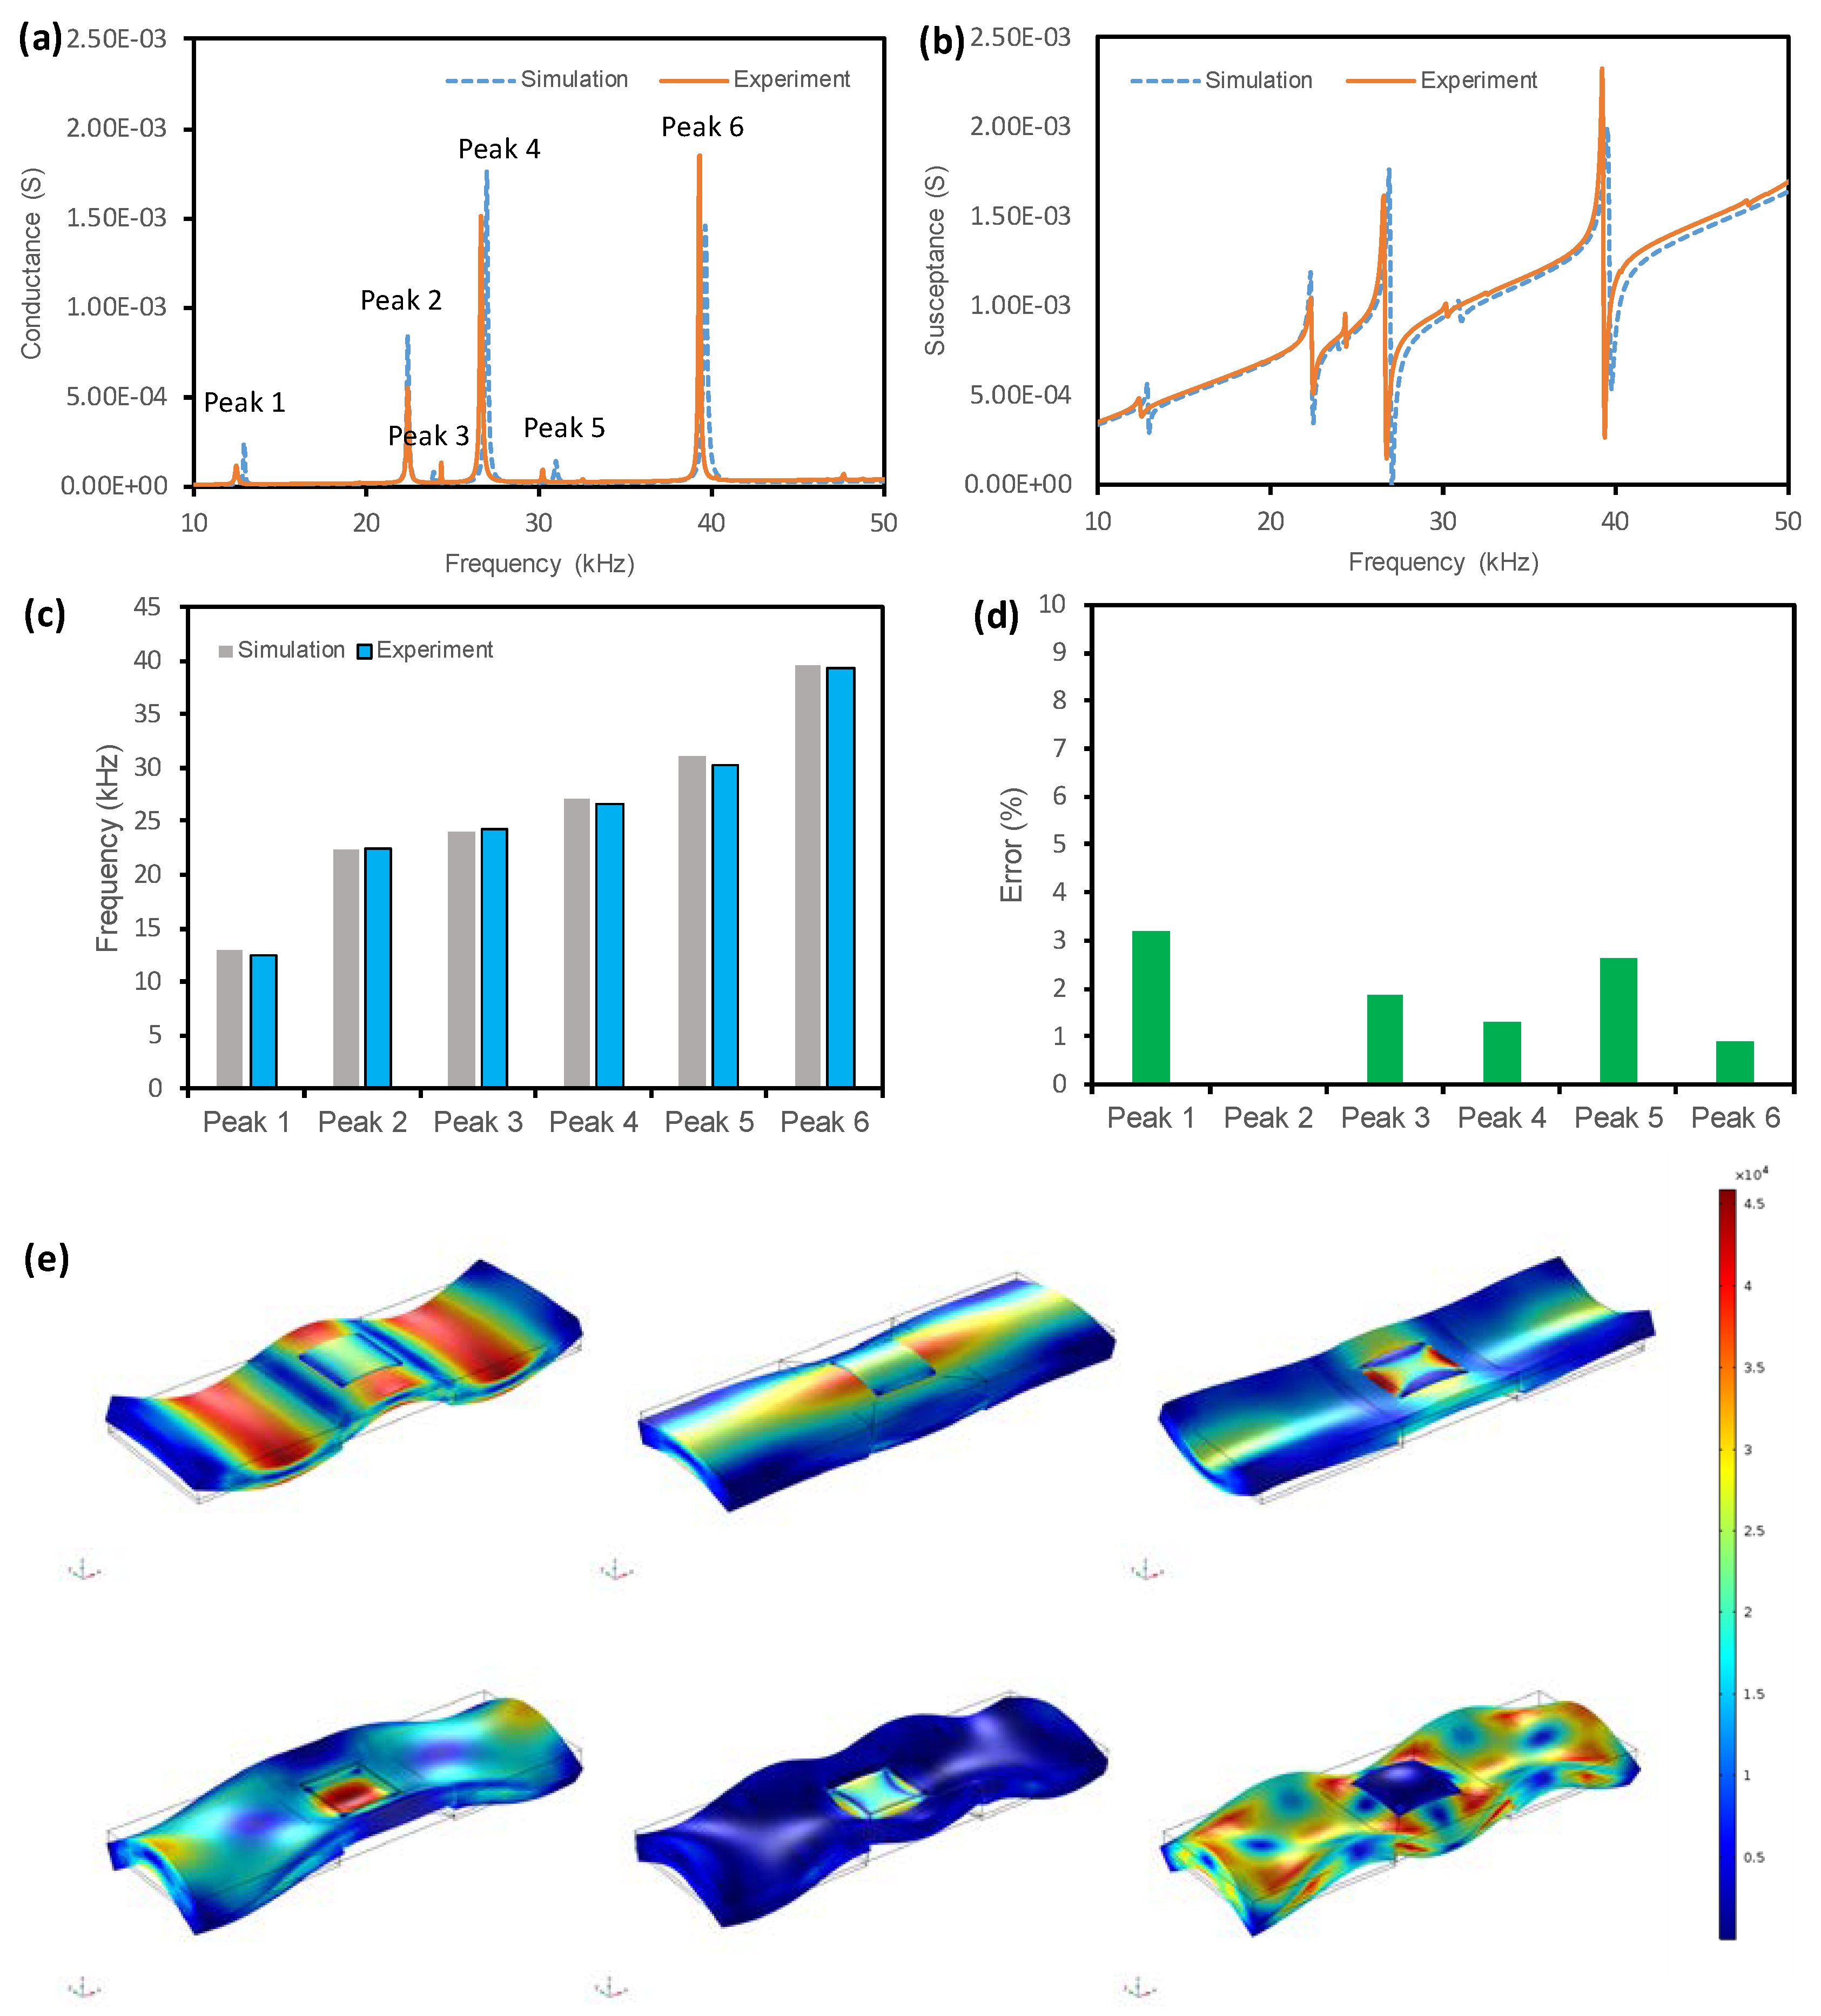
The real part of the numerical admittance signature (i.e., the conductance) is compared with the experimental data in Figure 5a. We observe six strong resonant peaks in the numerical conductance response, which are identical to the peaks of the experimental result. We also observe similar conductance patterns between the simulation and the experiment at non-resonant bands between the peaks. As shown in Figure 5b, the imaginary part of the numerical admittance signature (i.e., the susceptance response) is also found to agree with the experimental result, with identical curves in both resonant and non-resonant bands. It should be noted that the susceptance response mainly contains the information of the PZT patch while the conductance response contains valuable information about the health status of the host structure (i.e., the beam). Therefore, the conductance part is often used to monitor structural health in practice.
The frequencies of the six peaks observed in the numerical impedance signature are compared with the experimental results in Figure 5c. It is seen that the peak frequencies show good agreement between the two models. The frequency error is computed as depicted in Figure 5d. The maximum frequency error is only 3.2% (Peak 1), and the minimum error is zero (Peak 2). Although there are gaps in the magnitude, the conductance resonances and the pattern of the susceptance predicted by the FE model are consistent with the previous experimental results, demonstrating the accuracy of the FE modeling strategy [21].
The vibration modes of the resonances are identified to determine how the transducer activates the beam during the harmonic excitation. Figure 5e shows the PZT-free beam interaction for the six resonant peaks. Peak 1 has a vertical bending motion, Peak 2 and Peak 3 have lateral bending motions, while Peak 4–Peak 6 exhibit combined vertical and lateral bending motions. It should noted that the pair of Peak 2 and Peak 3 as well as the pair of Peak 4 and Peak 5 are twin modes due to the asymmetry of the host beam. The results in Figure 5e demonstrate the strong coupling between the transducer and the beam at different resonances. As the vibrational resonant modes of the beam are changed due to damage or changes in boundary conditions, the conductance peaks will shift accordingly, thereby showing the possibility of using the PZT-enabled conductance sensing technique for structural health monitoring and damage assessment.

3.2. PZT–Commerical Implant–Bone Model

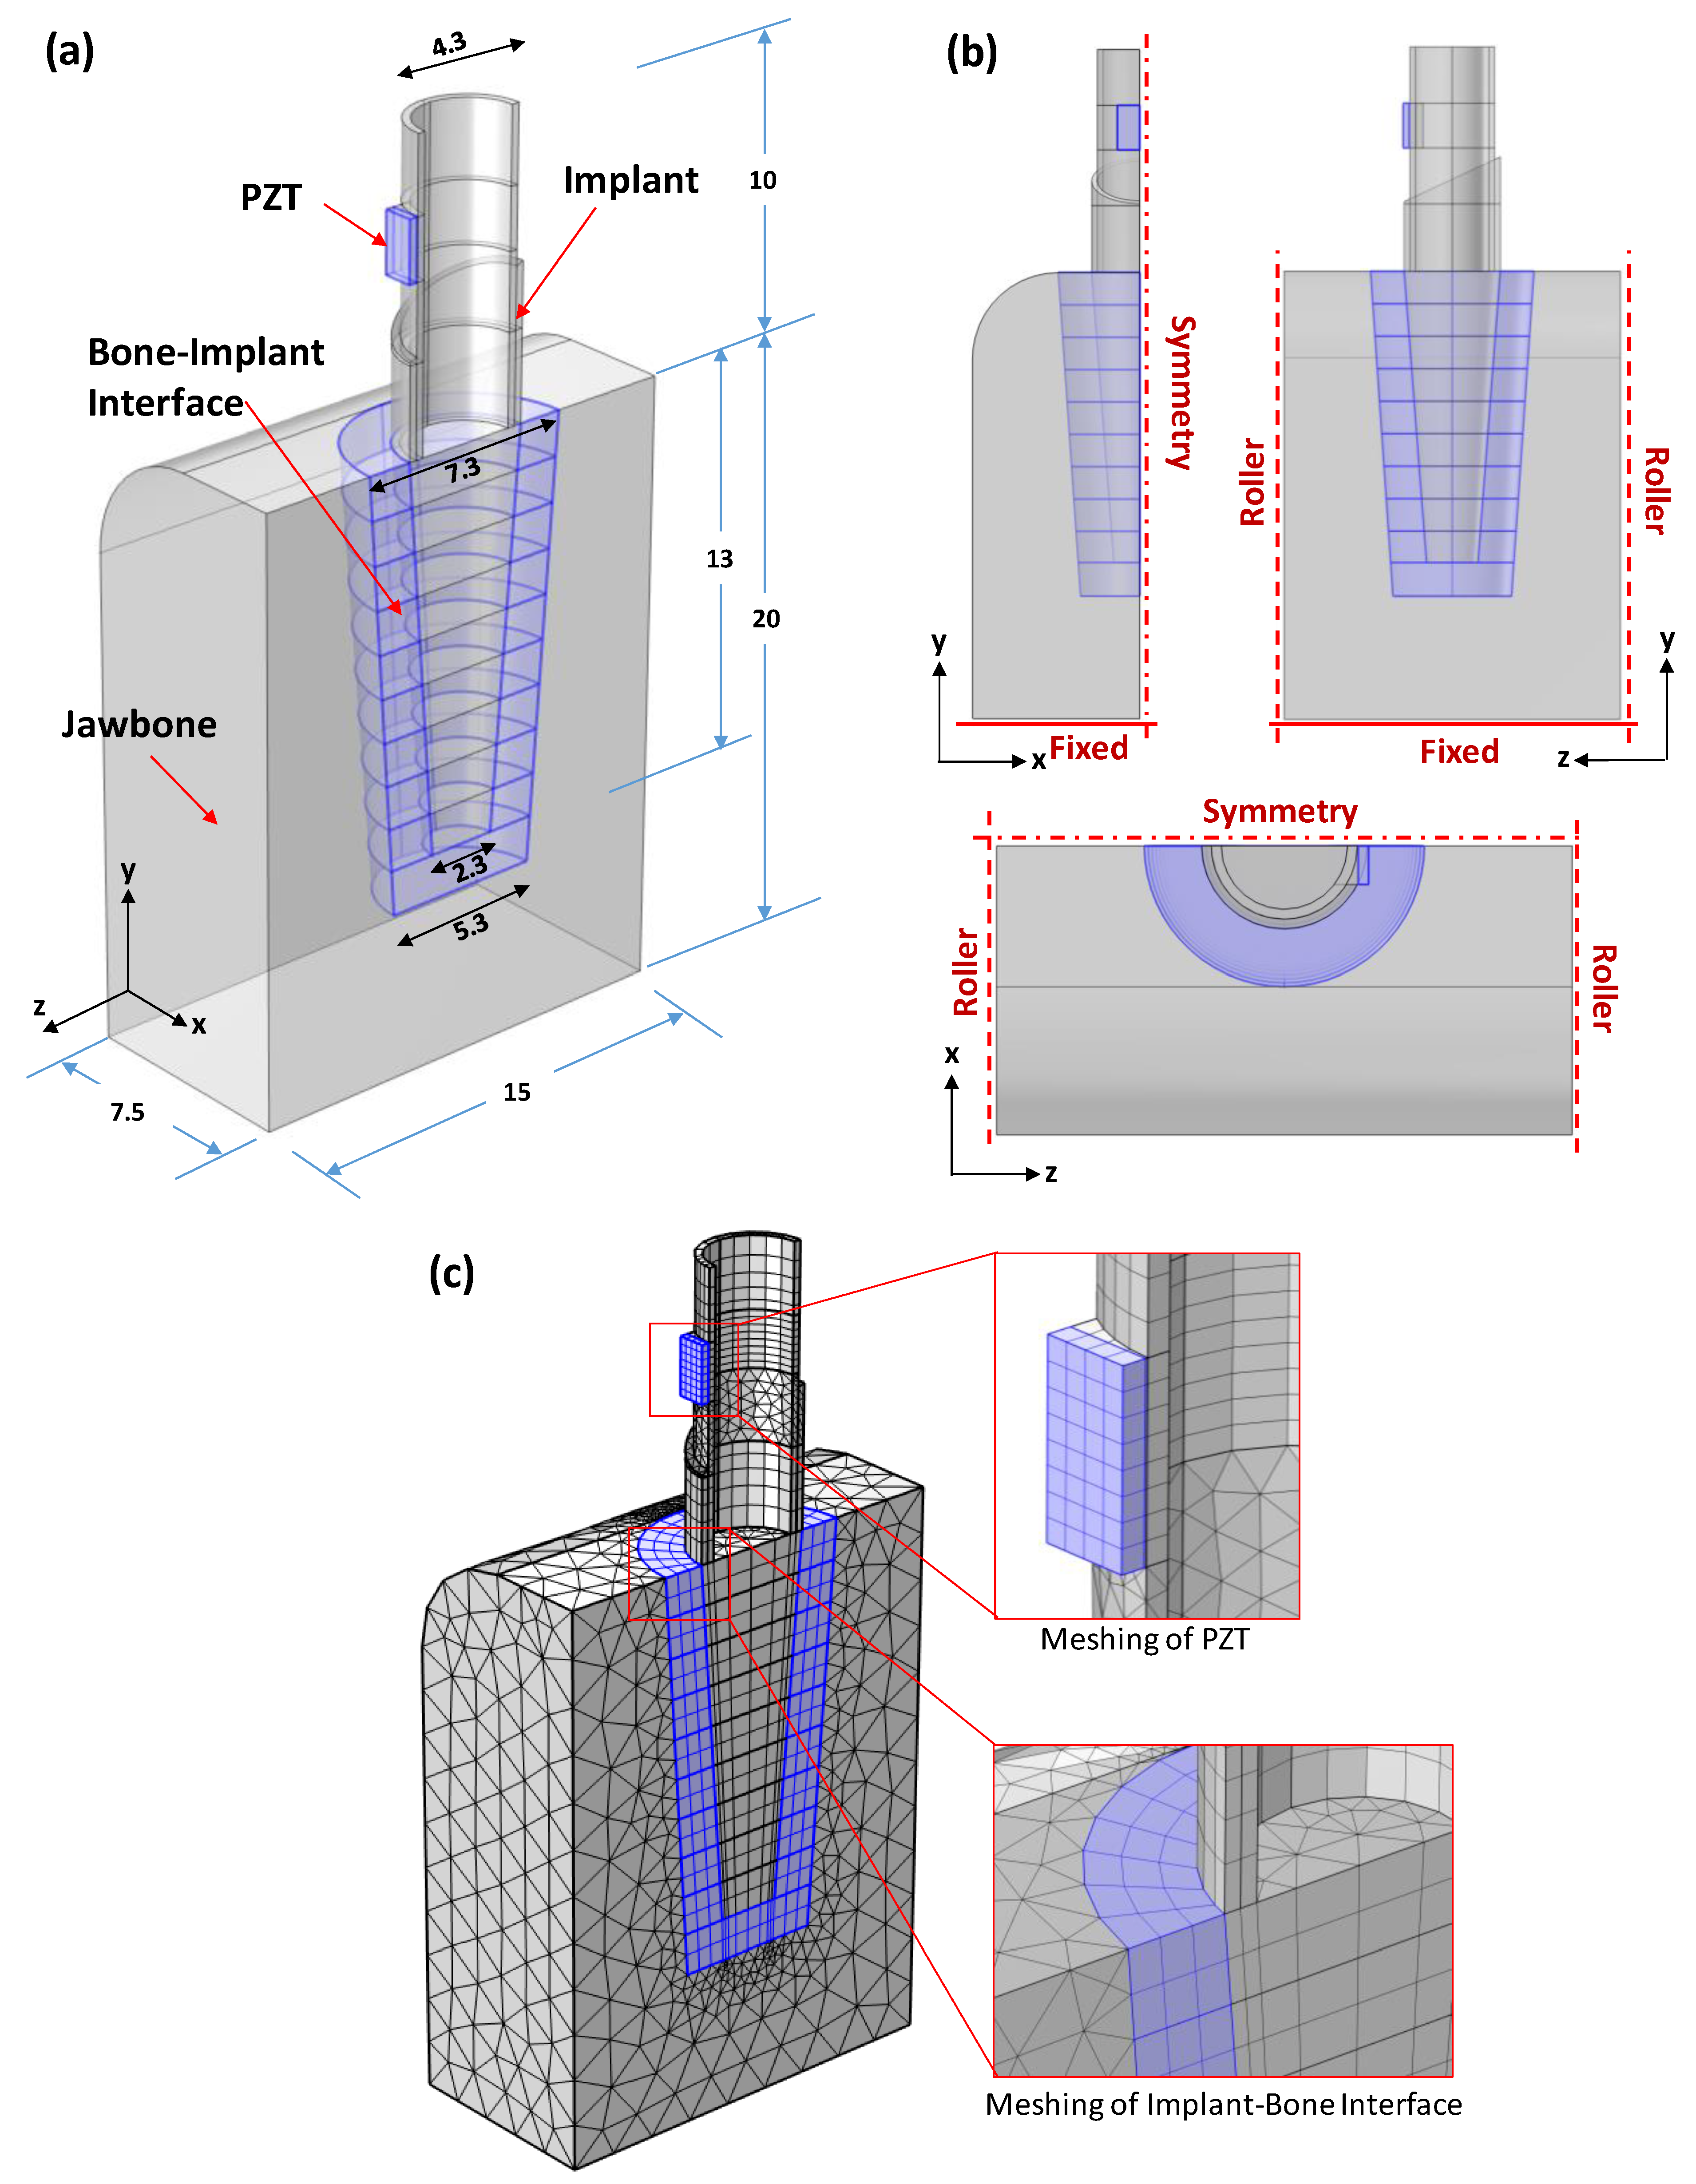
Using the validated FE modeling technique, we established the PZT–commercial implant–bone model for MBL monitoring using the PZT-enabled conductance technique. The 3D FE model is shown in Figure 6. The implant structure was simulated according to the geometric sizes of the commercial NobelReplace Tapered Groovy and NobelBiocare permanent prosthetic abutment [21]. A PZT transducer with a size of 2 mm × 2 mm × 0.267 mm was attached to the abutment. A bonding layer was added to the bottom of the PZT patch to simulate the attaching mechanism of the transducer. The bone part was simplified as a block of 15 × 15 × 20 mm3 with trims. The PZT–implant structure was inserted into the middle of the bone block so that the exposed portion of the implant above the surface measures 10 mm, as depicted in Figure 6a. Afterward, a 1.5 mm thick interface layer was modeled at the contact between the implant and the bone (i.e., the bone–implant interface) to simulate the occurrence of bone loss. The mechanical and piezoelectric properties of the transducer were adopted from a previous study [21].
Due to the model’s symmetry, we simulated only half of the PZT–implant–bone system to reduce the computational cost and simplify the analysis [67,68], as depicted in Figure 6a. In the solid mechanics module, the symmetry condition allows freedom in the plane while fixing behavior in the out-of-plane direction. In the electrostatics module, the symmetric boundary condition sets the normal component of the electric field to zero. The mathematical equations governing the symmetry boundary condition can be found in reference [69]. The FE code automatically computes the solution for the entire domain by presuming that the behavior on one side of the symmetry plane mirrored that on the other side.
The material properties of the implant, the bone part, and the interface layer can be found in [21]. The bone was treated as an isotropic material for computational effectiveness, aligning with recommendations from prior research [21,70,71]. The piezoelectric properties of the transducer (type PSI-5A4E) were assigned by the published data [7,21]. The constitutive relation of the PZT transducer was defined as the stress-charge form. The model’s boundary conditions are shown in Figure 6b. The roller boundary was applied to the x-y plane, while the fixed boundary was assigned to the z-x plane. The symmetry boundary condition was set to the symmetric z-y plane.
Figure 6c presents the meshing of the FE model. The process of mesh refinement involved gradually increasing the number of elements to achieve a finer mesh, and it ceased when the numerical conductance response of the FE model stabilized. As shown in Figure 6c, finer meshes were employed for the bone–implant interface and the PZT transducer to precisely capture the PZT–implant and bone interaction under combined piezoelectric excitation and MBL occurrence. The final mesh of the FE model in a healthy state (no bone loss) consists of 2261 elements for the PZT–implant structure and 14,588 elements for the bone part.
A harmonic voltage with an amplitude of 0.5 V was administered to the upper surface of the PZT transducer while the lower surface was grounded. We conducted a frequency-domain analysis to characterize the conductance response of the PZT–implant system over a frequency band of 50 kHz–200 kHz with intervals of 0.5 kHz. This frequency band was selected to cover the first few local modes of the implant, which are sensitive to the changes in the boundary condition due to bone loss at the implant–bone interface. It should be noted that the physical conductance response of the PZT varies with the frequency and shows a peak when the excitation frequency is identical to the natural frequency of the PZT [21]. An additional analysis showed that the resonant frequency of the PZT used in this simulation is much higher than 200 kHz and the conductance of the PZT is linear with the swept frequency in the examined band of 50–200 kHz.

3.3. Identification of Local Vibrational Modes

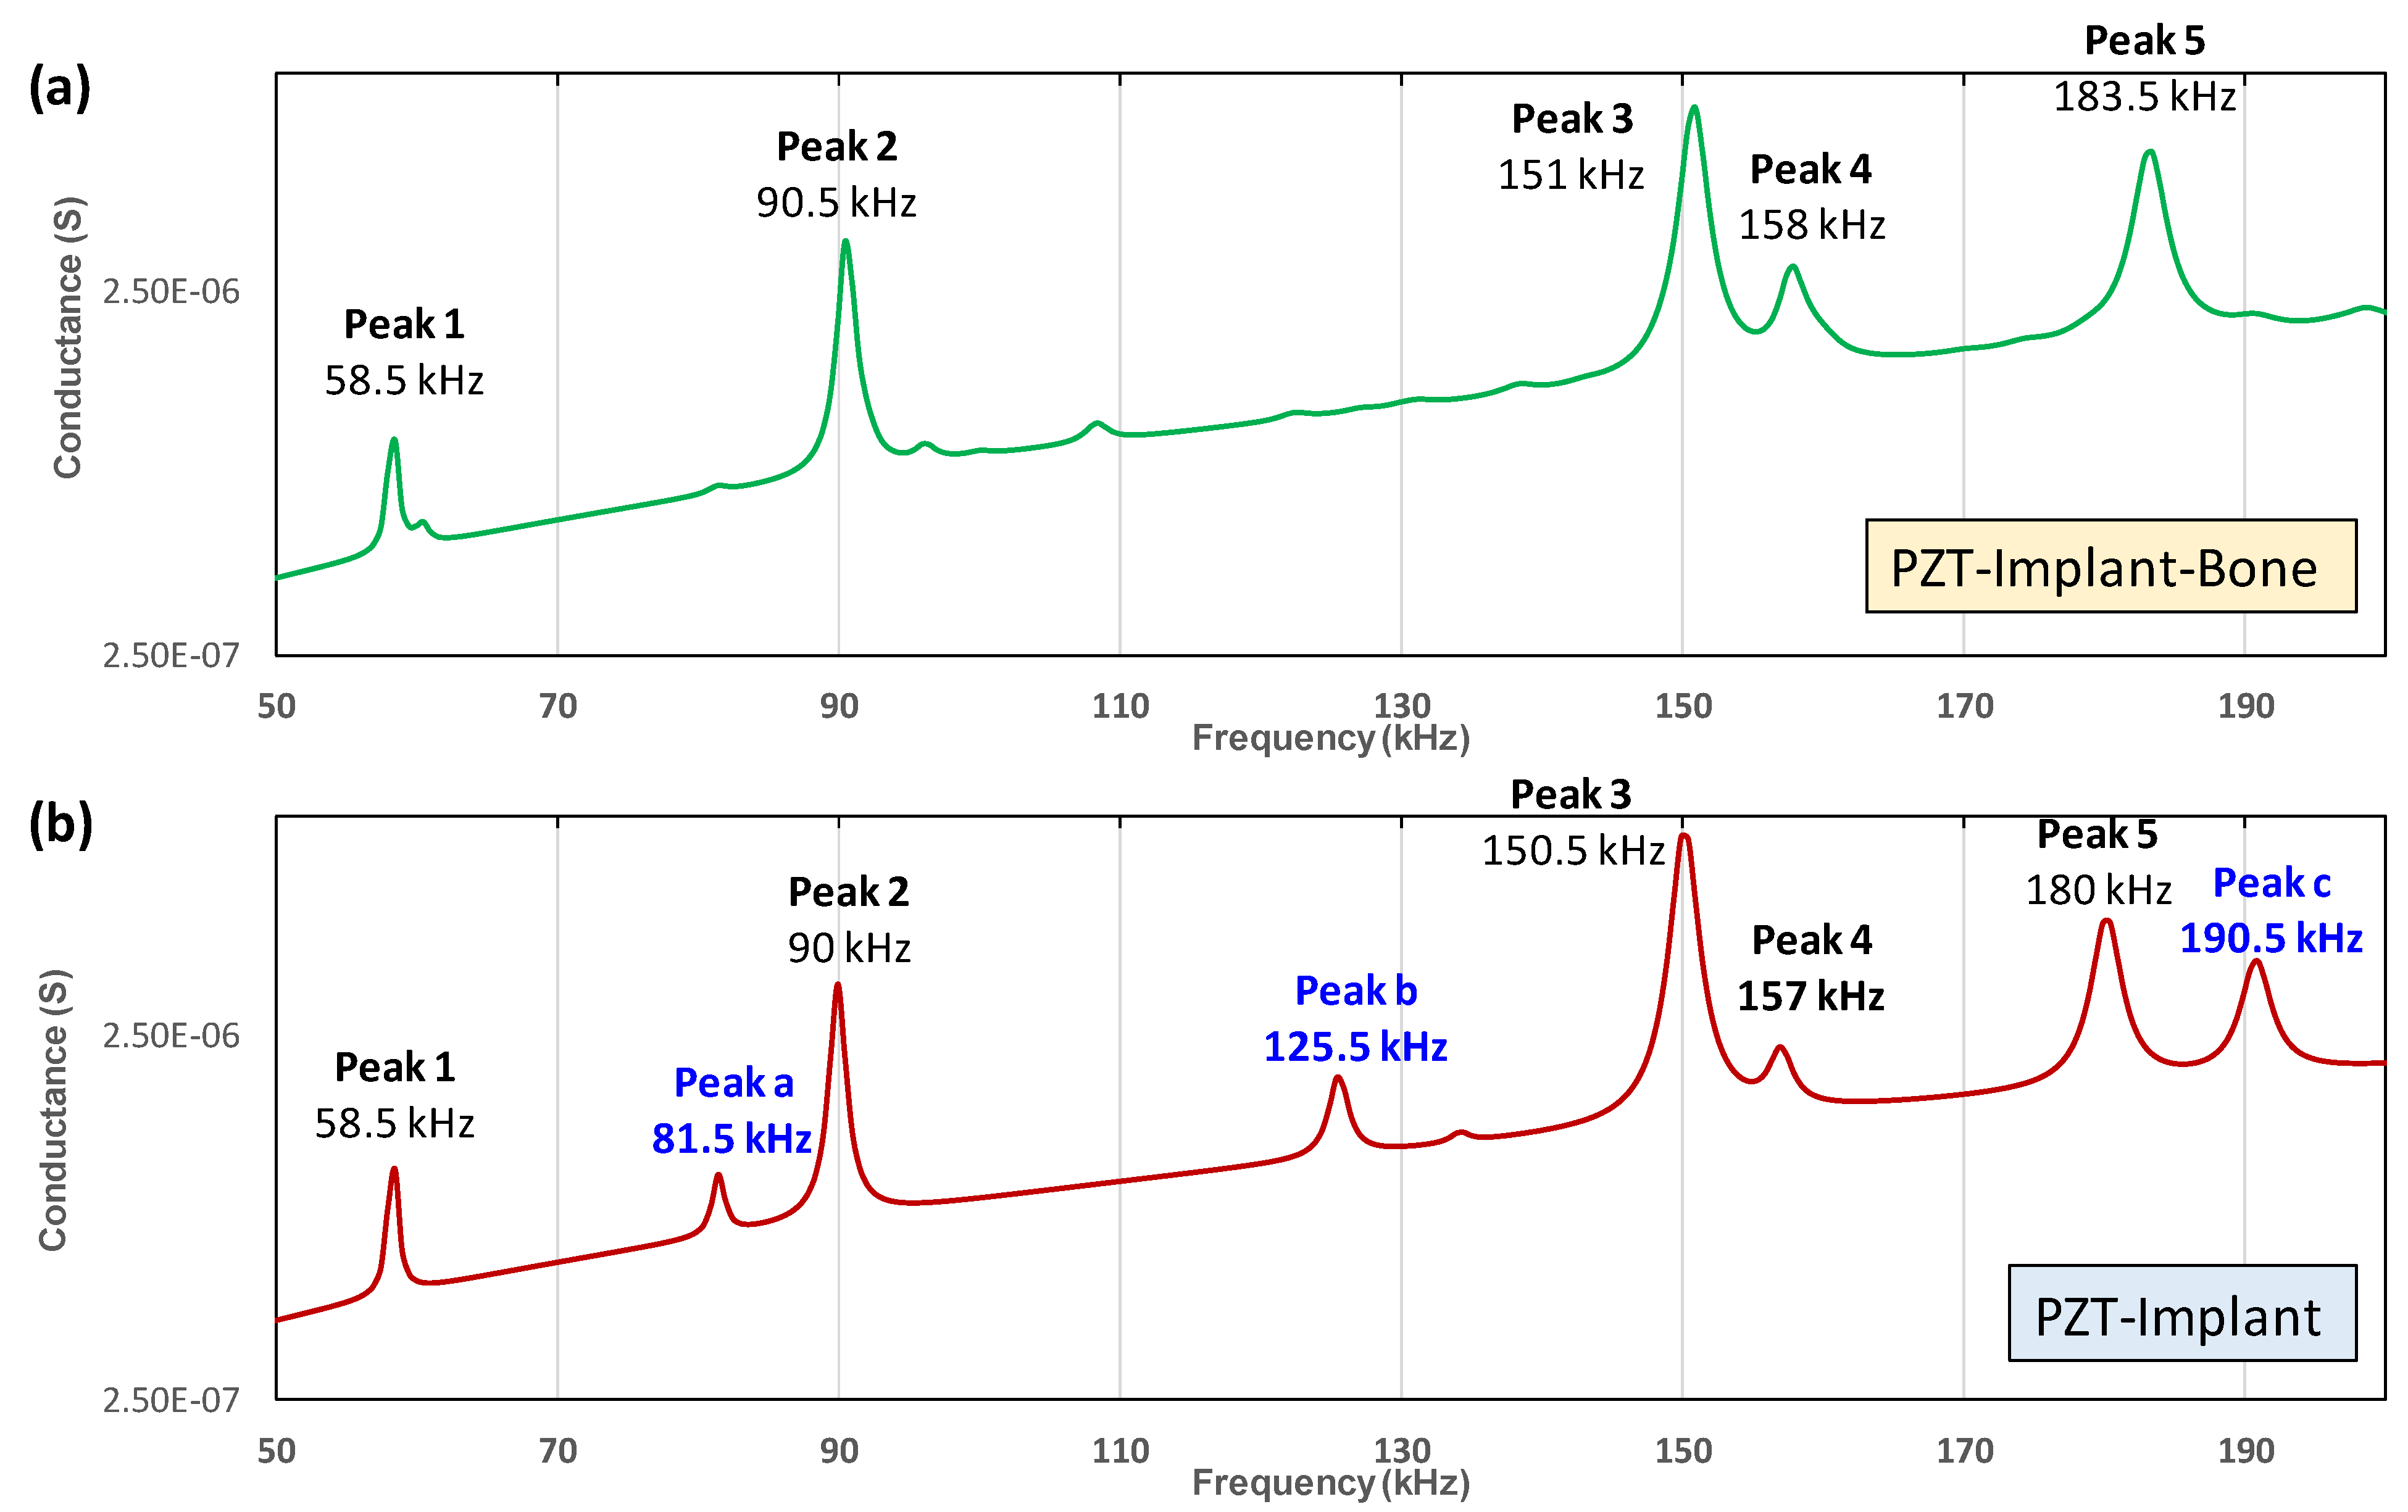
The obtained conductance response of the PZT–implant–bone system (the so-called ‘FEM1’) is shown in Figure 7a. Five strong resonances (i.e., Peak 1–Peak 5) are observed from the conductance spectrum in 50–200 kHz. The peak frequencies are identified as follows: 58.5 kHz (Peak 1), 90.5 kHz (Peak 2), 151 kHz (Peak 3), 158 kHz (Peak 4), and 183.5 kHz (Peak 5), respectively. Next, we simulated the conductance response of the free PZT–implant system (the so-called ‘FEM2’). As depicted in Figure 7b, the conductance spectrum of FEM2 also shows five resonances (i.e., Peak 1–Peak 5) identical to the peaks of FEM1. The peak frequencies of FEM1 are reasonably higher than those of FEM2, indicating an increased modal stiffness when the jawbone is simulated surrounding the implant. In fact, the presence of the jawbone changes the implant’s boundary condition and limits its displacement under the external load (e.g., piezoelectric excitation). Besides the five primary peaks, three additional resonances (Peak a–Peak c) are observed from the conductance spectrum of FEM2 in Figure 7b. Due to the constraint of the jawbone, these vibration modes of the implant become ignorable in the conductance spectrum of FEM1.
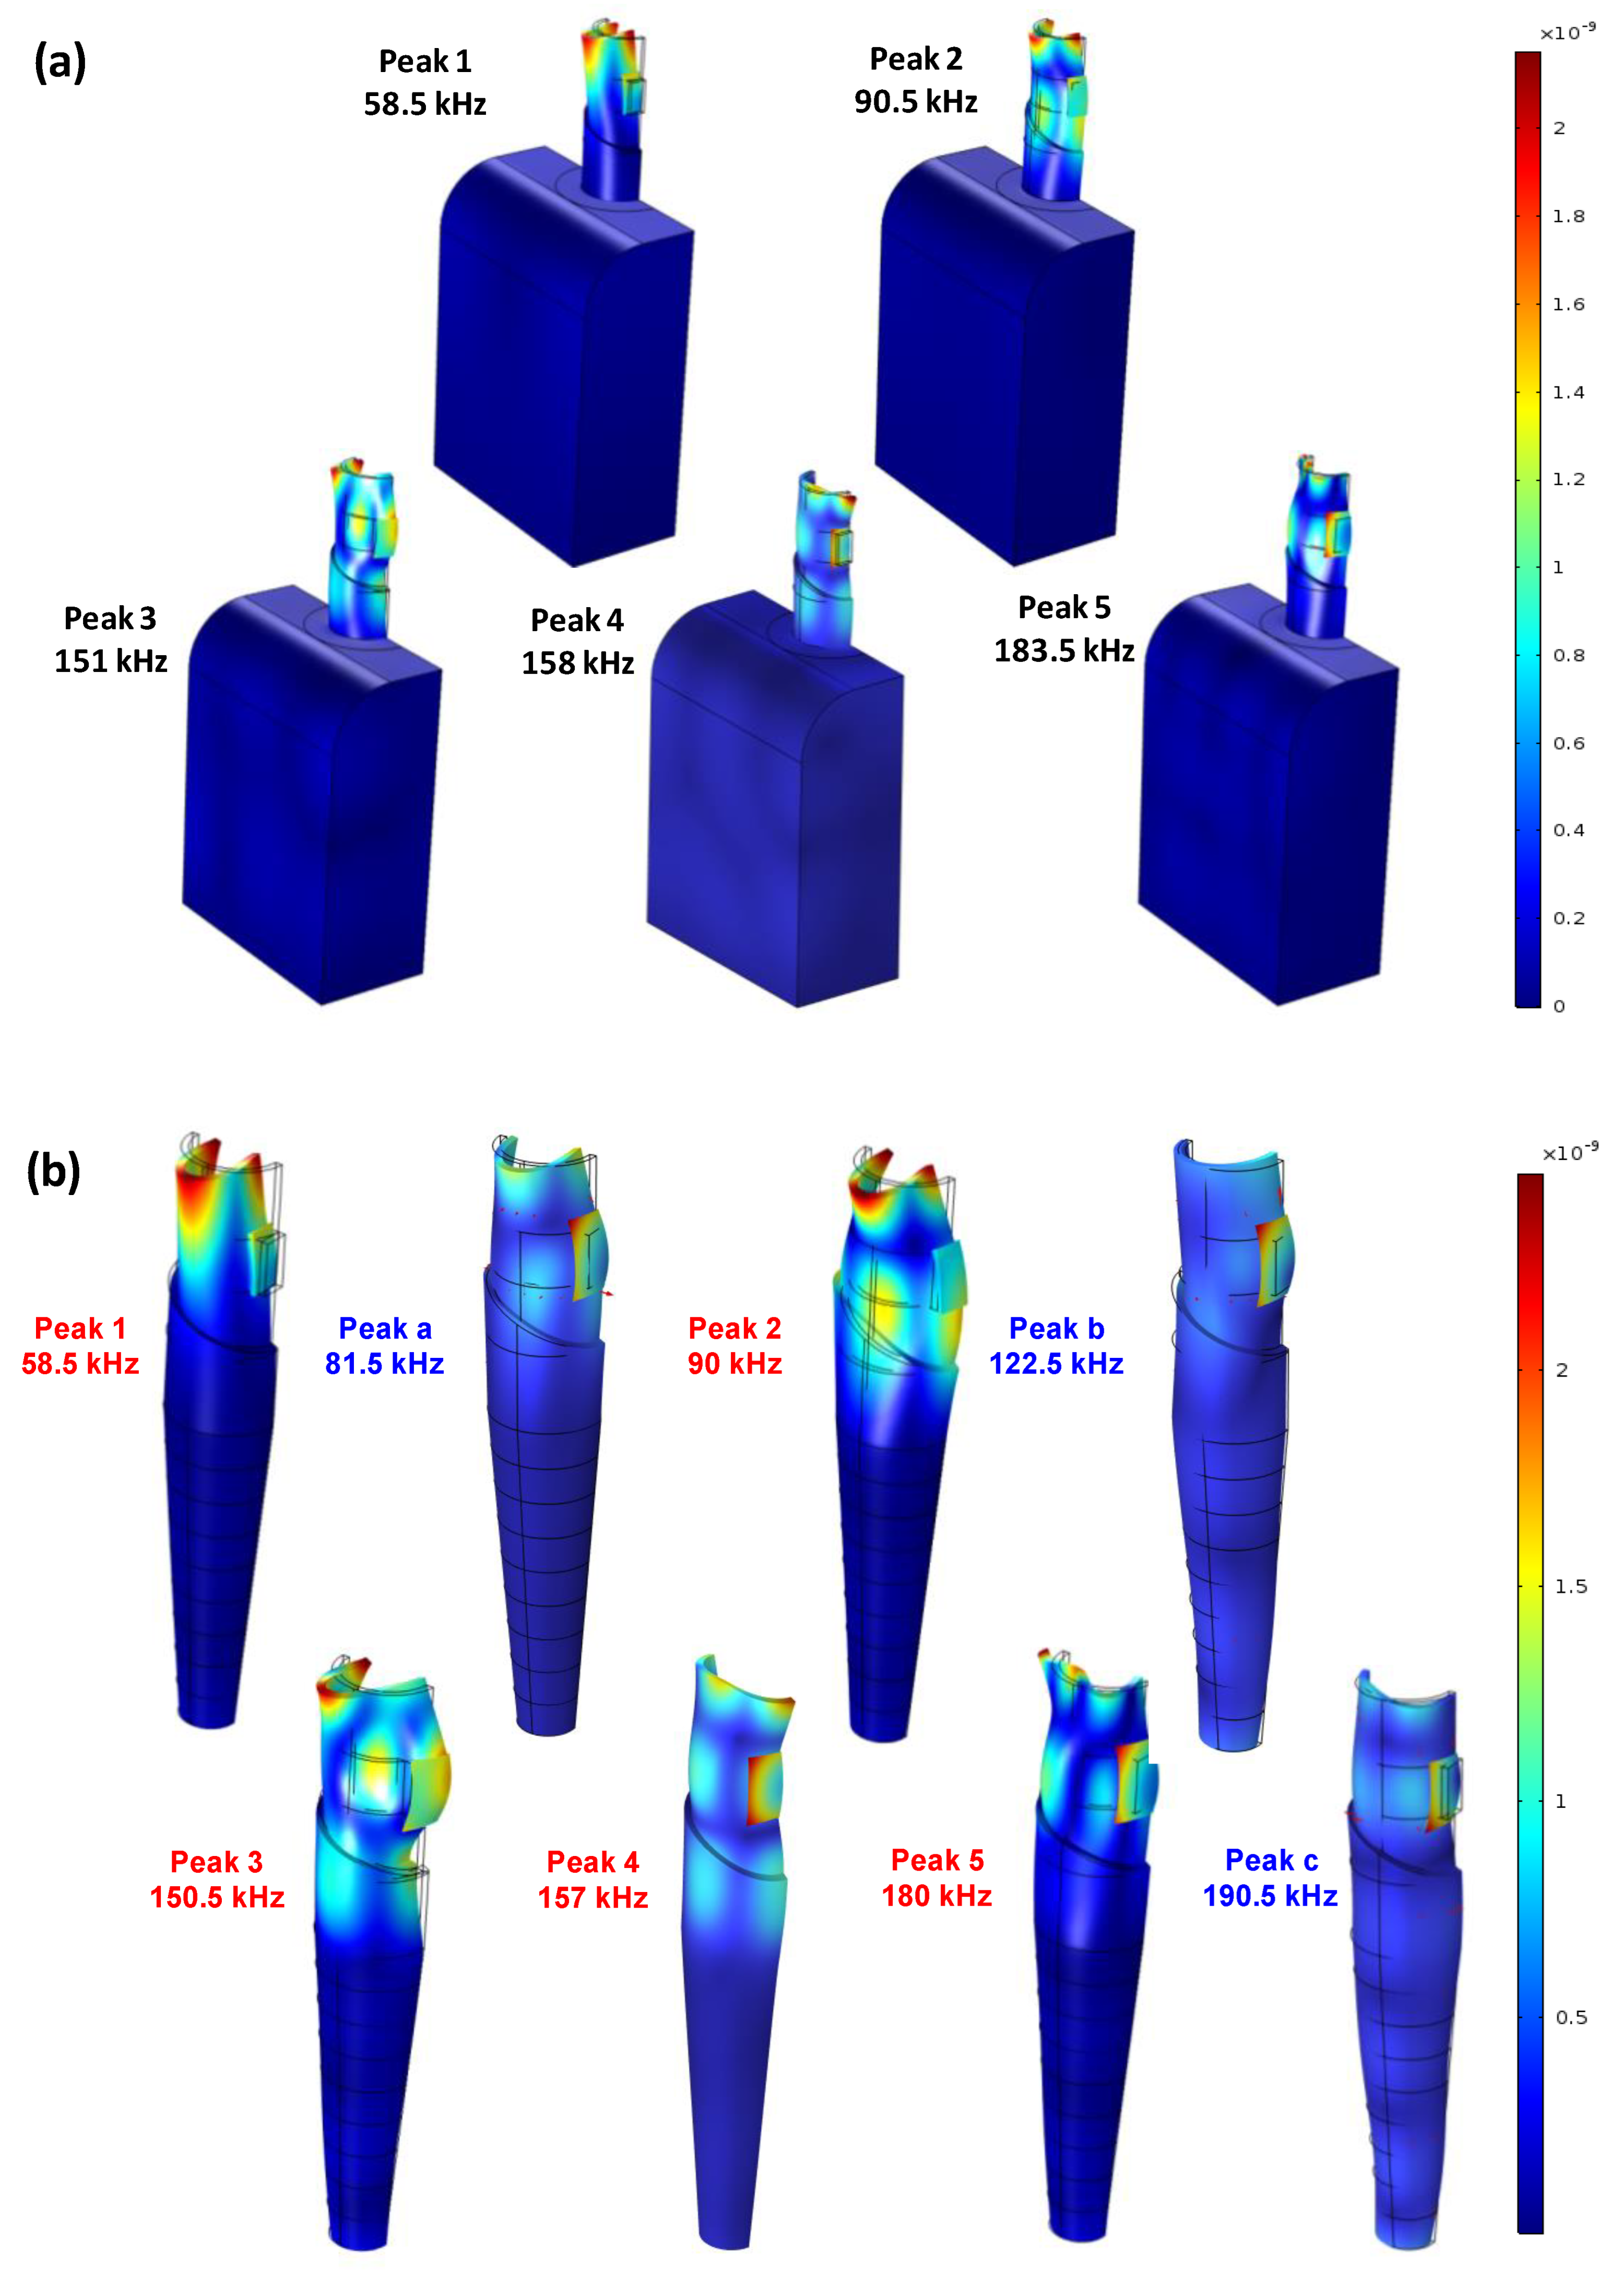
As shown in Figure 8a, the interactions between the PZT and the implant and between the implant and the bone at different resonances (Peak 1–Peak 5) were identified from FEM1. It is shown that the PZT transducer excites circumferential motions of the superstructure, and these vibrations propagate into the bone. The modal displacements of the superstructure are found to be significantly higher than those of the bone. The circumferential motions become more complex and local for higher-order modes.
The eight modes of the PZT–implant interaction (Peak 1–Peak 5 and Peak a–Peak c) were identified from FEM2, as illustrated in Figure 8b. The modal shapes of Peak 1–Peak 5 show good agreement between FEM1 and FEM2, thereby validating the mode identification results of the PZT–implant system depicted in Figure 8. As compared with the primary vibrations (Peak 1–Peak 5), the modal displacement of the additional modes (Peak a–Peak c) is less significant, resulting in less sharp resonant peaks as observed from Figure 8b. These additional motions tend to disappear in the spectrum of FEM1 because the jawbone constrains the implant’s movement. Moreover, the bone also acts as a damping media surrounding the implant, dissipating the implant’s vibration energy. As a result, the resonant peaks of the conductance response become less sharp and even negligible. These simulation results also indicate that the conductance peaks of the PZT–implant system would shift with a change in the bone–implant interface, thereby showing the feasibility of the PZT-enabled conductance sensing technique for MBL monitoring.

4. Feasibility Verification

4.1. Simulation of Conductance Response under Different Bone-Loss Levels

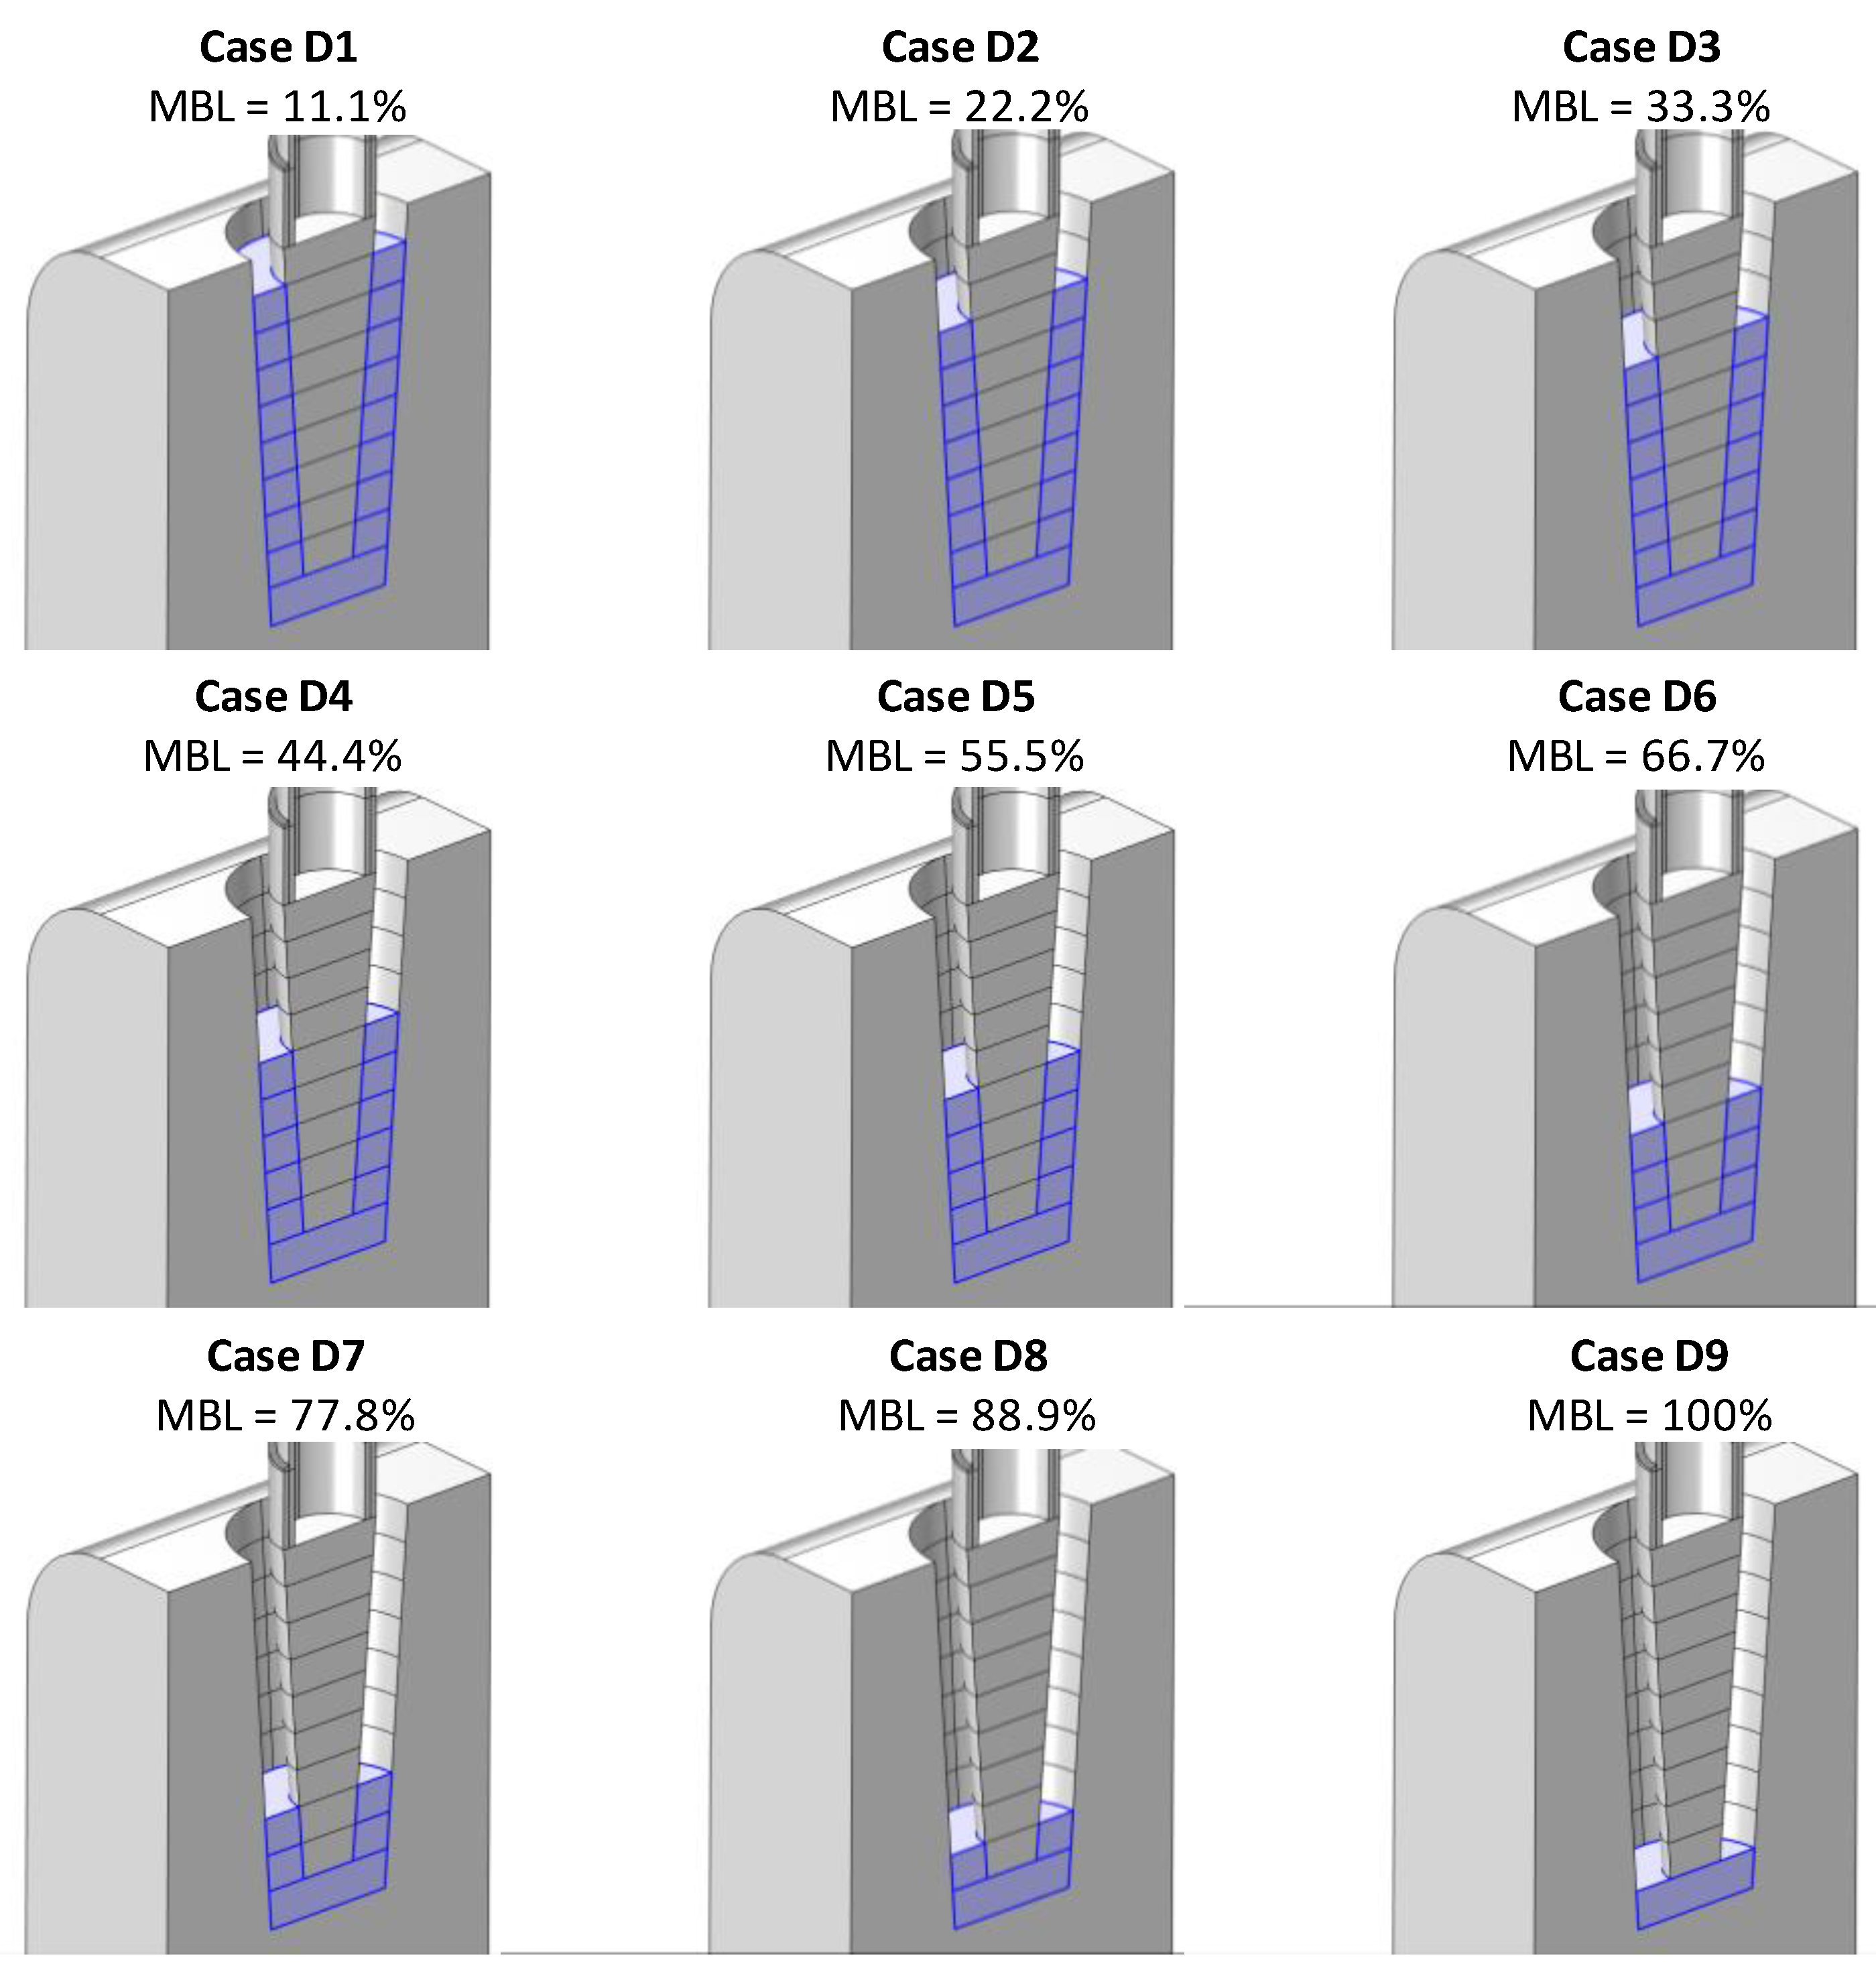
It is presumed that the implant–bone interface will have a constant thickness at which the MBL occurrence is modeled, as shown in Figure 9. It is also presumed that the loss of bone is uniform over the circumference of the implant, and therefore ten MBL levels were investigated, including Case D0 (the intact case) and Case D1–Case D9 (the MBL cases). In Case D1, the MBL is 11.1% and gradually increases to 100% in Case D9 with an increment of 11.1%. In Case D9, the jawbone is only connected to the bottom of the implant, as observed in Figure 9. It should be noted that in reality, the thickness of the tissue between the implant and the bone can vary along with the depth of the implant, and the bone loss may not follow the conical shape from the top to the bottom. In the present study, these assumptions were made to simplify the numerical model to evaluate the proof-of-concept of the proposed method.
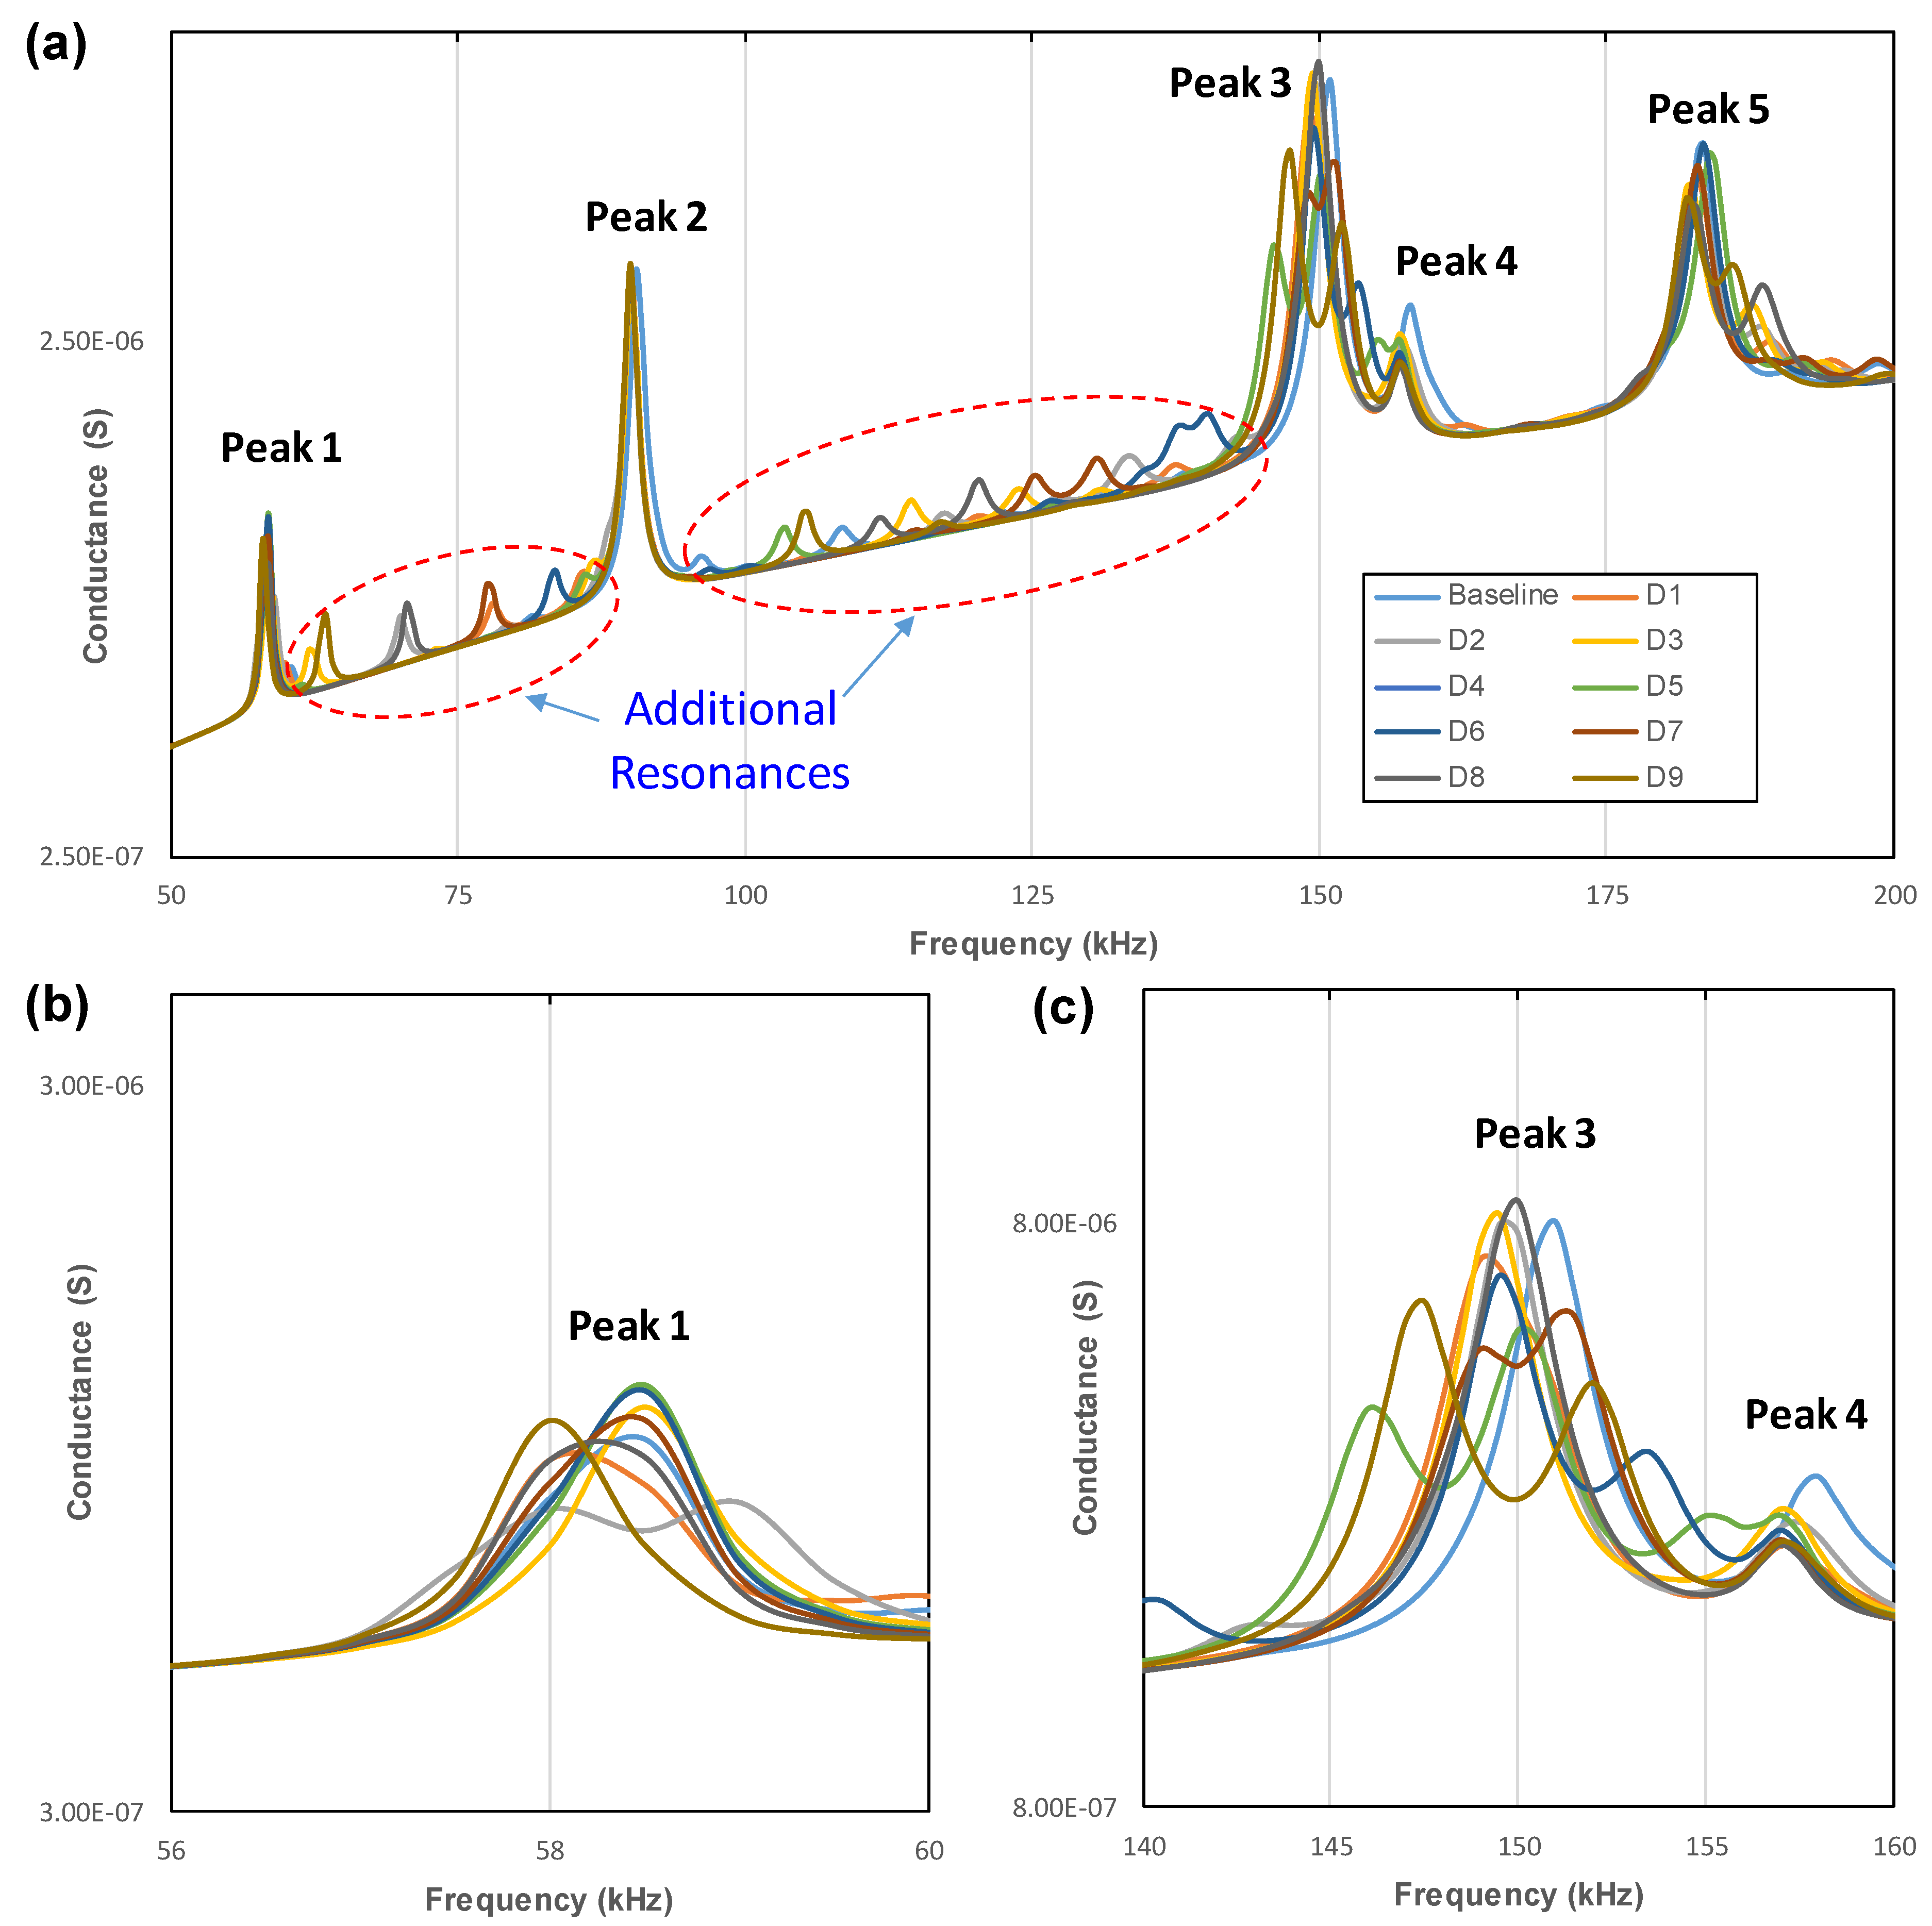
For each of the ten MBL cases, the conductance response was simulated over the frequency band of 50 kHz–200 kHz. The obtained conductance responses are plotted in the log-scale in Figure 10. It is shown that the conductance peaks sensitively shift over the investigated frequency band when MBL occurs. The conductance shifts tend to increase with the MBL extent. As observed in Figure 10b,c, the peaks reasonably shift to the left when the MBL severity increases, suggesting a decreased modal stiffness. Among the five peaks, Peak 3 shows the most variation due to bone loss, as seen in Figure 10a.
Interestingly, additional resonances appear in the conductance spectrum between Peak 1 and Peak 2 and between Peak 2 and Peak 3, as observed in Figure 10a. Those peaks belong to the additional vibrations (Peak a–Peak b as shown in Figure 8b) caused by the change in the boundary condition of the implant structure, as explained in the previous section. When the MBL level increases, the PZT–implant system becomes more free to vibrate, leading to the appearance of additional modes such as those observed in Figure 8b (FEM2: the free PZT–implant model).

4.2. Stability Monitoring Using Statistical Metrics

4.2.1. Conventional Statistical Metrics

Traditionally, the PZT-enabled conductance sensing technique uses statistical metrics, most commonly cross-correlation deviation (CCD) and root mean square deviation (RMSD), to estimate the change in the conductance signatures [24,72]. It is determined that Y(ωi) represents the conductance signal recorded from the intact case (i.e., the healthy state) at the ith swept frequency, Y*(ωi) represents the conductance signal obtained under an unknown state (i.e., the damage state), and N denotes the number of frequency points in the sweep. According to reference [24], the RMSD metric is given by:
R M S D = i = 1 N Y * ( ω i ) Y ( ω i ) 2 / Y ( ω i ) 2
Also, the CCD metric is obtained by the following formula [72]:
C C D = 1 1 N 1 i = 1 N Y ( ω i ) Y ¯ Y * ( ω i ) Y ¯ * σ Y σ Y *
In Equations (7) and (8), Y ¯ and Y ¯ * represent the means of the conductance signals, while σ Y and σ Y * are the standard deviations of the conductance signals.
The choice of an appropriate statistical metric depends on the conductance shift trends. Utilizing an improper metric can lead to unreliable results in BML monitoring and estimation [73,74]. While the CCD metric primarily quantifies frequency shifts (horizontal) rather than magnitude shifts (vertical), the RMSD index quantifies both horizontal and vertical changes [75,76]. Furthermore, both RMSD and CCD indices are statistical metrics devoid of physical significance; they only measure how the present conductance signal (representing the unknown state) deviates from the known baseline (representing the intact state). Theoretically, the metrics yield values greater than 0 when existing the structure changes. Nevertheless, due to the nonlinearity in the conductance response, these metrics may experience complex nonlinear trends, leading to quantitative monitoring and estimation difficulties.

4.2.2. Stability Monitoring Result

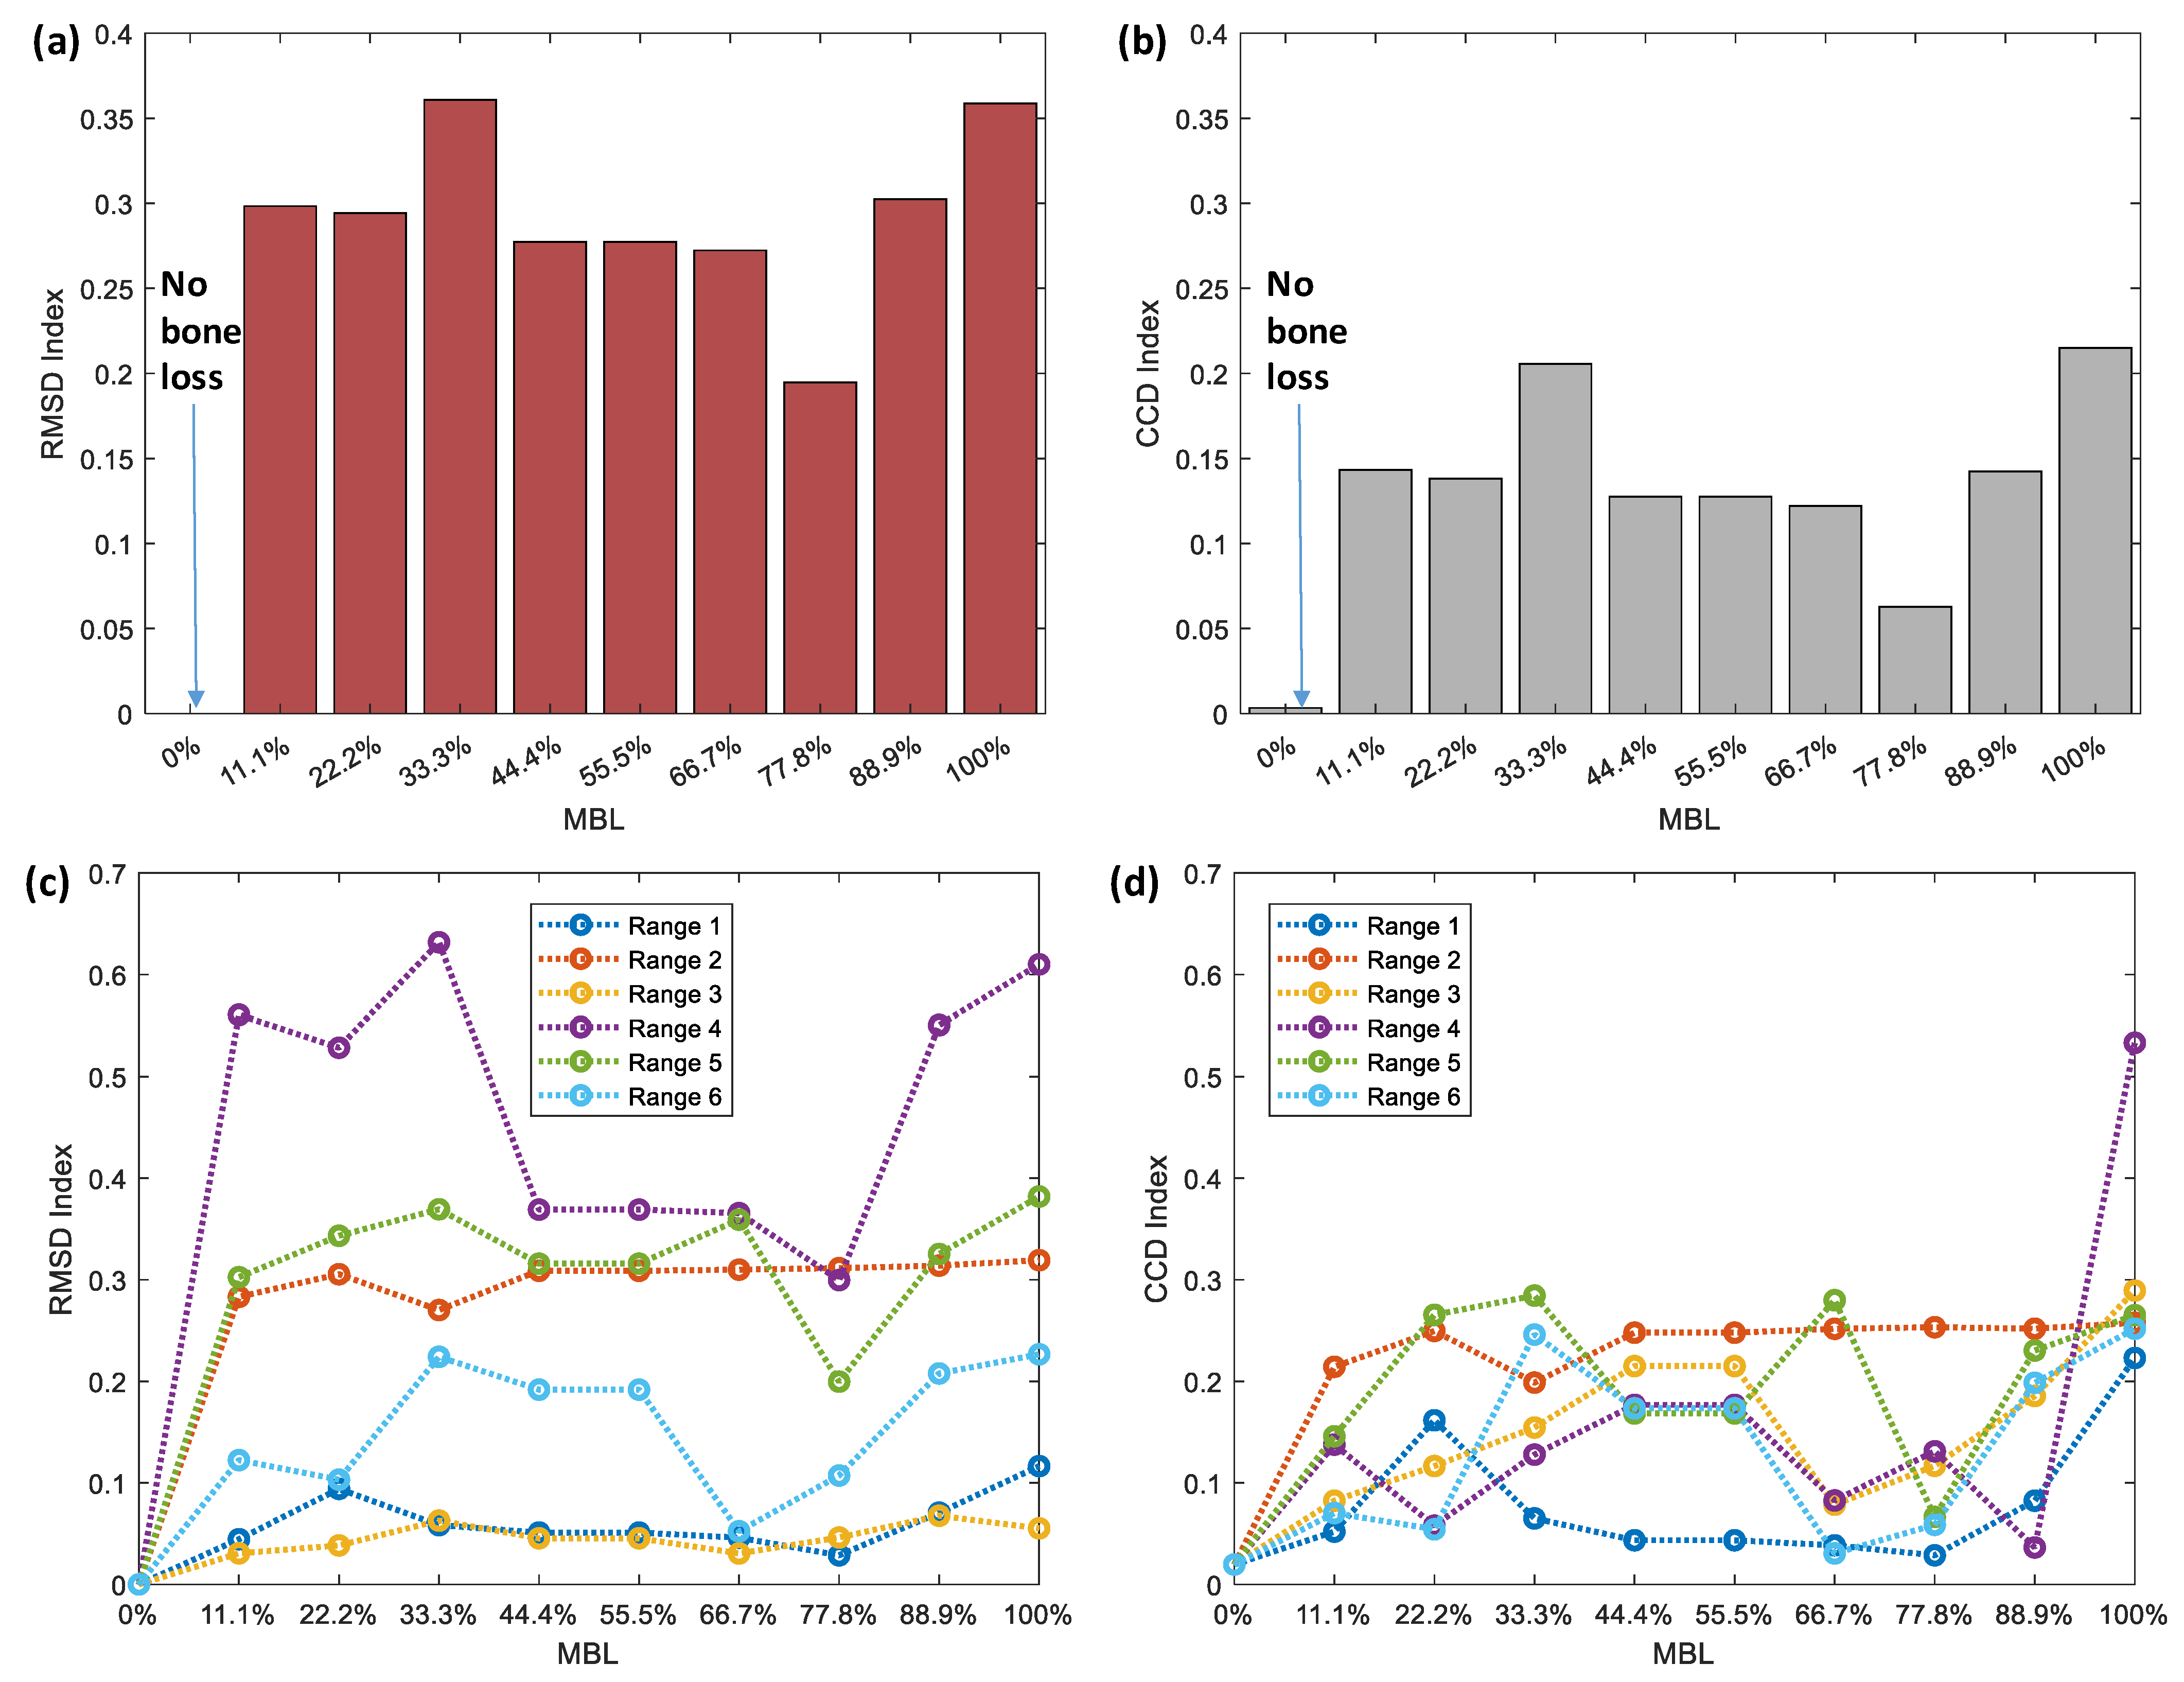
The conductance signal obtained from the intact FE model (i.e., Case D0) was selected as the reference. The MBL monitoring results using the RMSD and CCD metrics are shown in Figure 11a,b, respectively. The results were obtained using the 50 kHz–200 kHz frequency band consisting of multiple resonances. It can be observed that both metrics of MBL cases are significantly higher than the metrics of the baseline, indicating the occurrence of bone loss. However, the two metrics show fluctuations with no apparent relationship with the MBL percentage. Except for the case of 33.3% MBL (Case D3), the magnitude of the metrics tend to reduce with an increased MBL percentage and reach the minimum in the case of 77.8% MBL (Case D7). After that, both metrics increase and reach the maximum in the case of 100% MBL (Case D9).
The nonlinearity in the conductance characteristics causes the nonlinear change trend of these statistical indices. The nonlinear changes in the conductance response of the implant structure were also reported in previous studies [7,20,21]. This nonlinearity can induce challenges in correctly interpreting the MBL severity using the statistical evaluation metrics. For example, the result in Figure 11a shows that the case of 77.8% MBL (Case D7) is less severe than the cases of 33.3% MBL (Case D3) or 11.1% MBL (Case D1).
To search for an appropriate frequency band, the whole band of 50 kHz–200 kHz was segmented into six sub-ranges, including Range 1 (50 kHz–75 kHz), Range 2 (75 kHz–100 kHz), Range 3 (100 kHz–125 kHz), Range 4 (125 kHz–150 kHz), Range 5 (150 kHz–175 kHz), and Range 6 (175 kHz–200 kHz). We computed each range’s RMSD and CCD metrics and plotted the results along with the MBL percentage in Figure 11a,b, respectively. It can be observed that each frequency range exhibits a different tendency with nonlinearities. Since Range 4 exhibits significant vertical and horizontal variations under bone loss (see Figure 10c), its RMSD is more sensitive to the MBL percentage than the other ranges. As compared with the RMSD metric, the magnitude of the CCD metric is lower because the CCD metric mainly quantifies the horizontal shift in the conductance response. Due to the significant nonlinearities of the conductance characteristics, none of the above sub-ranges are appropriate for quantitative MBL severity estimation.

4.3. Stability Assessment Using 1D CNN Models

4.3.1. Datasets and Setup for 1D CNN Models

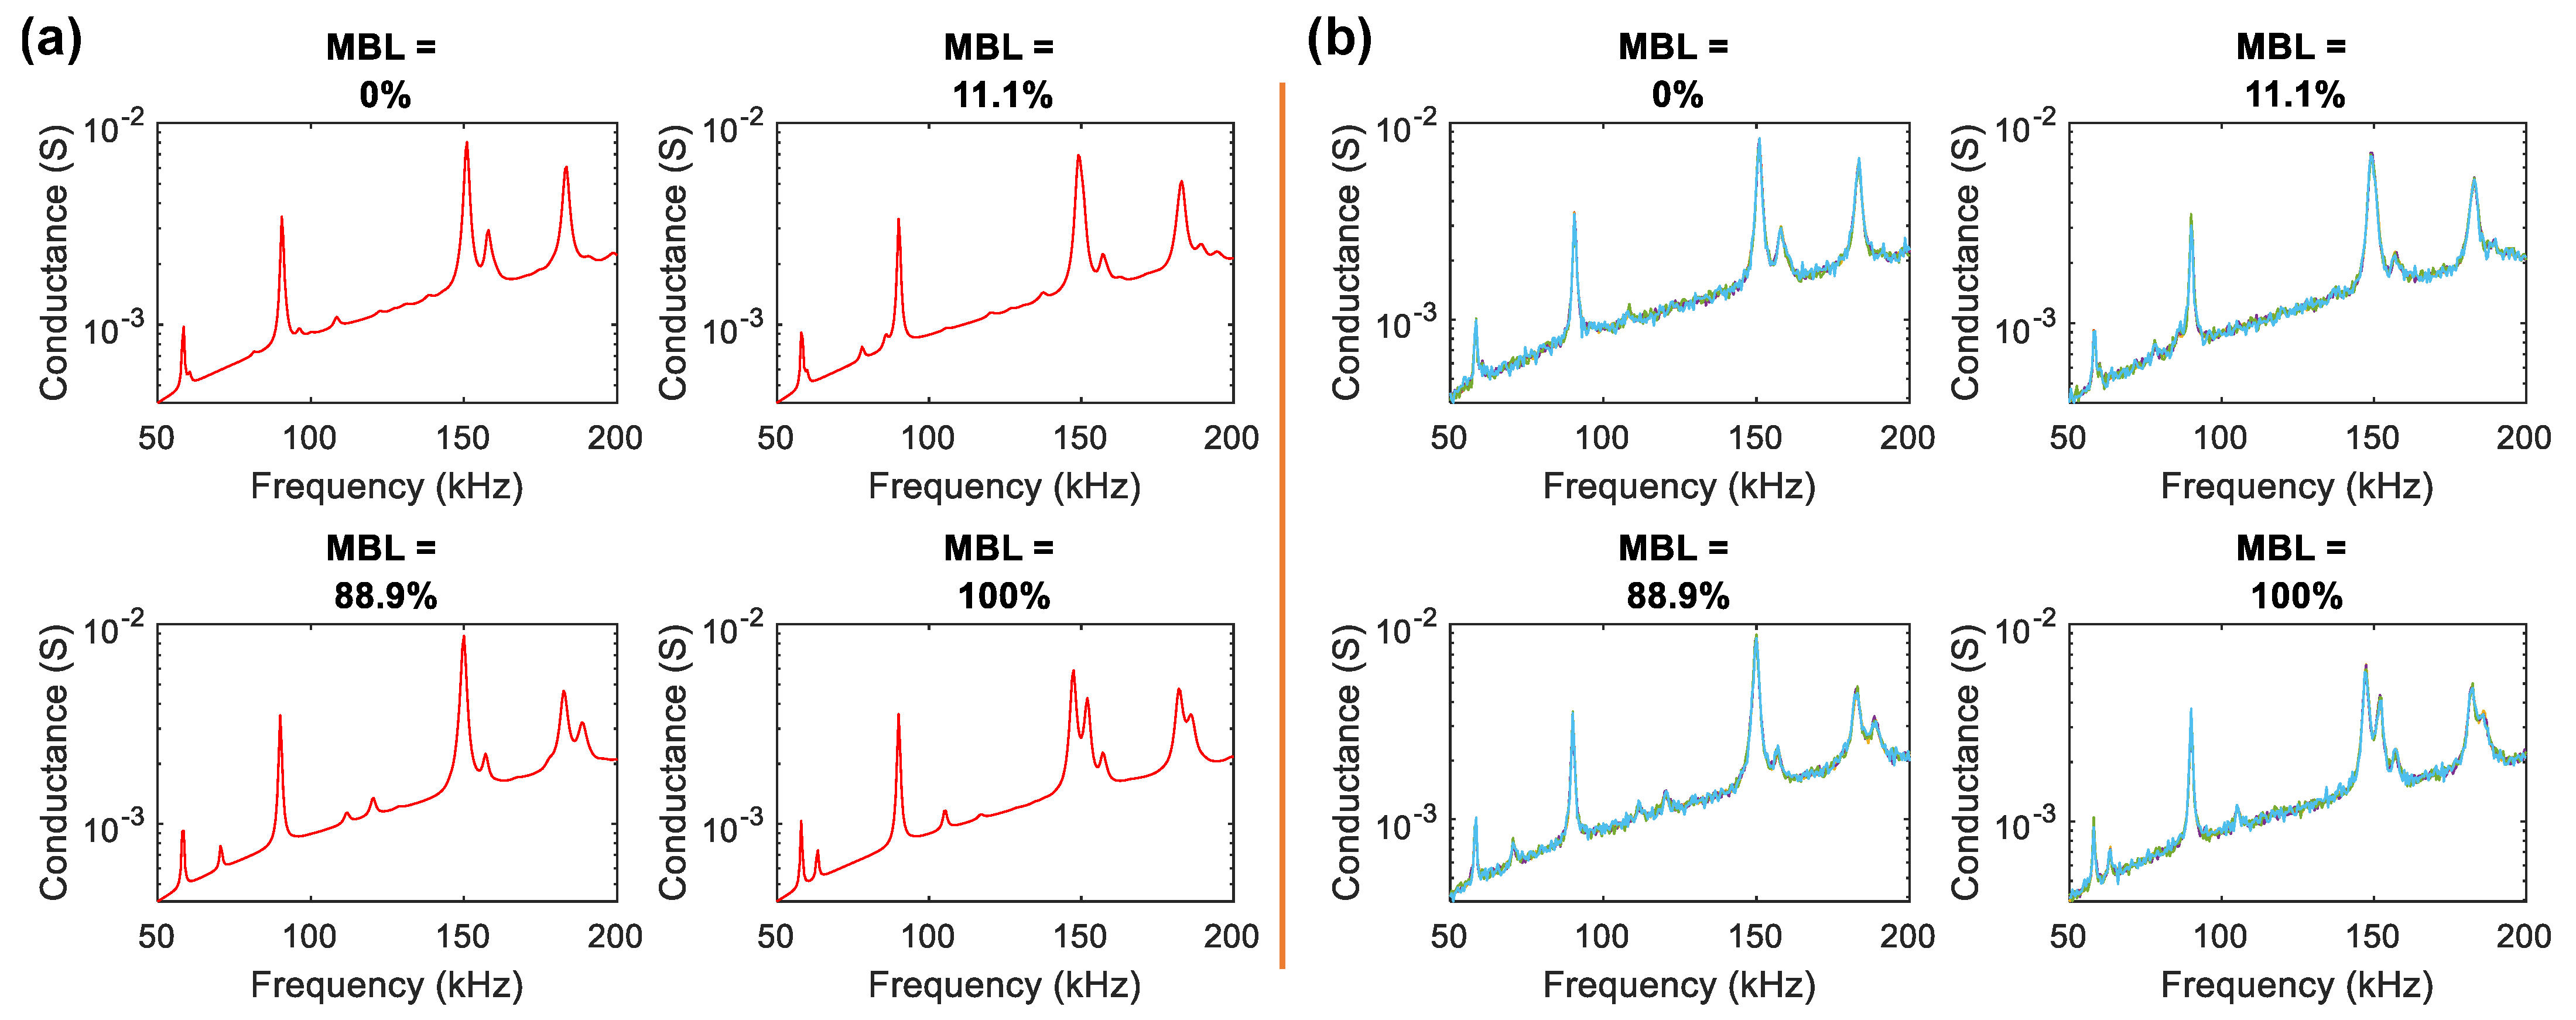
The conductance signals corresponding to the ten MBL levels, i.e., the intact case (D0) and the nine MBL cases (D1–D9) simulated in Section 4.1, were used to create the database for training and testing the 1D CNN models. To account for data augmentation and the inclusion of real-world scenarios, random white noise with a standard deviation of the signal amplitude (0–5% with 1% interval) was added to each conductance signal [36]. We first randomly generated a training dataset of 60 random noise-contaminated conductance signals corresponding to the ten MBL levels (D0–D9: 0–100% with 11.1% intervals). Next, we constructed the testing dataset using the same procedure, consisting of 30 noise-contaminated conductance signals corresponding to five MBL levels (D1, D3, D5, D7, and D9: 11.1–100% with 22.2% intervals). The training–testing sample ratio is 2:1. The added white noise introduced certain modifications to the magnitude of the conductance spectrum, as observed in Figure 12a,b.
The Matlab program was used to construct, train, and evaluate the 1D CNN prediction models (Model 1–Model 4). The input size of the network was set equal to the length of the input conductance signal. Specifically, the input size was 301 × 1 (n = 301), while the output size was 1. The networks were trained by the stochastic gradient descent algorithm with momentum, using the following settings: a mini-batch size of 8, a maximum number of epochs of 200, a speed of 0.9, an initial learning rate of 0.001, a drop factor of 0.1, and a drop period of 20. To ensure the models’ generalization, we shuffled the data in each epoch during training to introduce variety in each batch. All experiments in this study were carried out on a desktop computer with the following specifications: IntelCore i7-8700, DDR4 16 GB, GeForce GT 1030.

4.3.2. Performance Comparison of 1D CNN-Based Bone-Loss Prediction Models

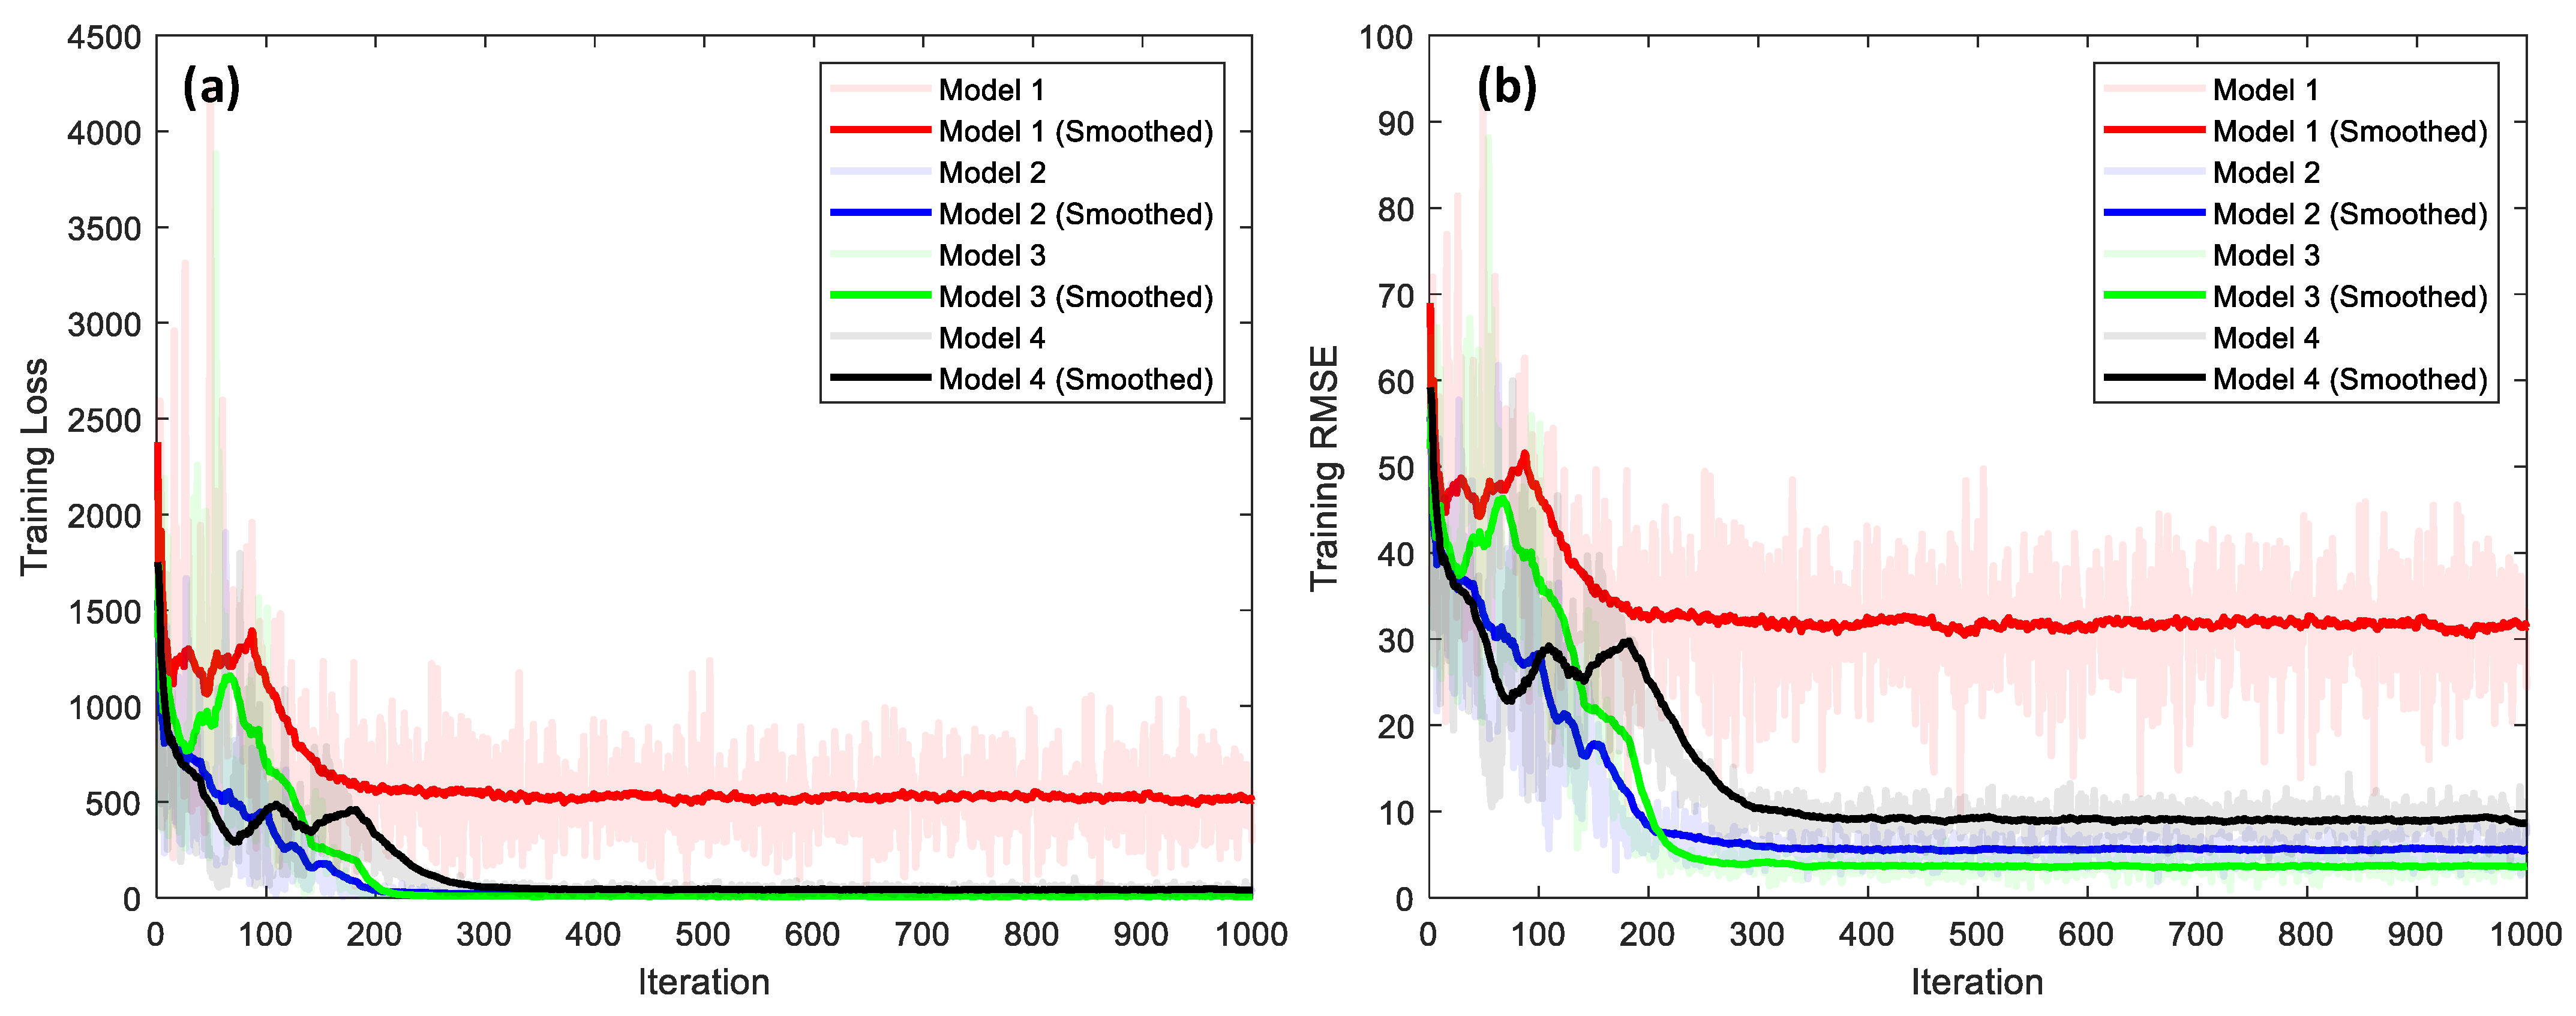
We examined the performance of Model 1–Model 4 for MBL prediction. The training RMSE and loss values are plotted along with the iteration in Figure 13a,b, respectively. For all models, the loss and the RMSE value are significantly deducted over the first 300 iterations and then remain stable until the last iteration. After training, the loss value of Model 1 is still significant while that of the remaining models converges to an ignorable value. As shown in Figure 13b, Model 1 has the highest training error while Model 3 yields the lowest training error.
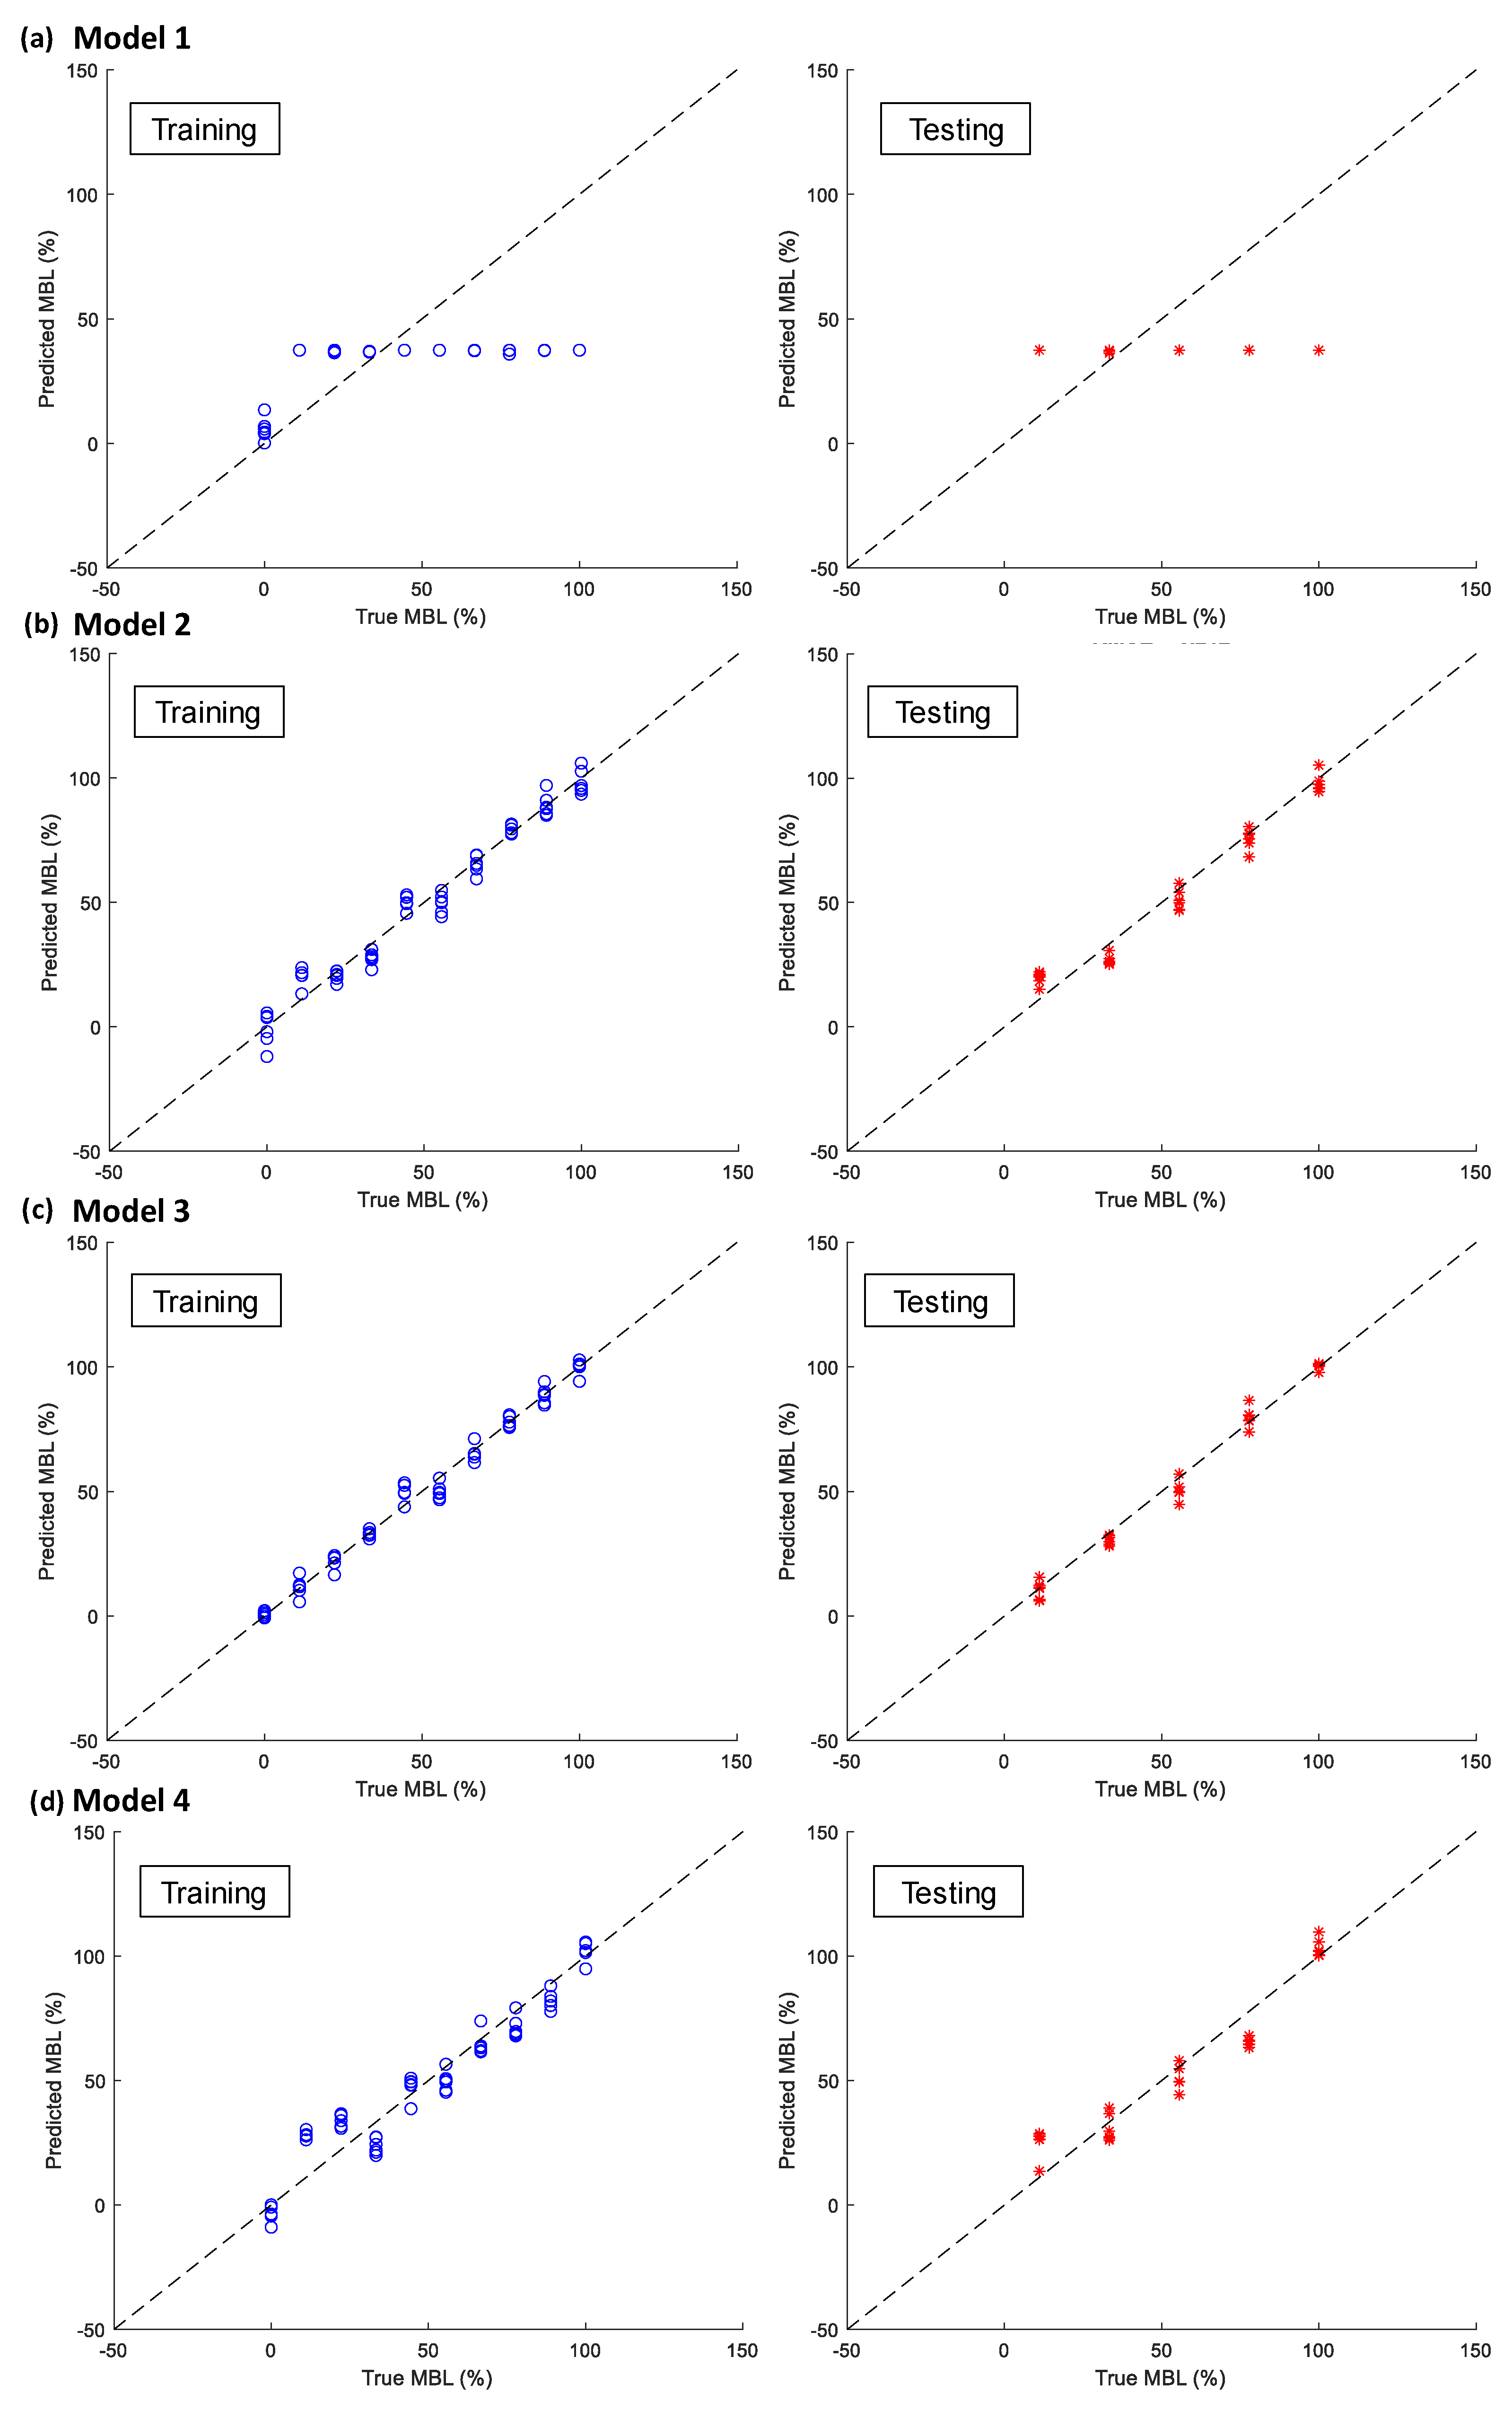
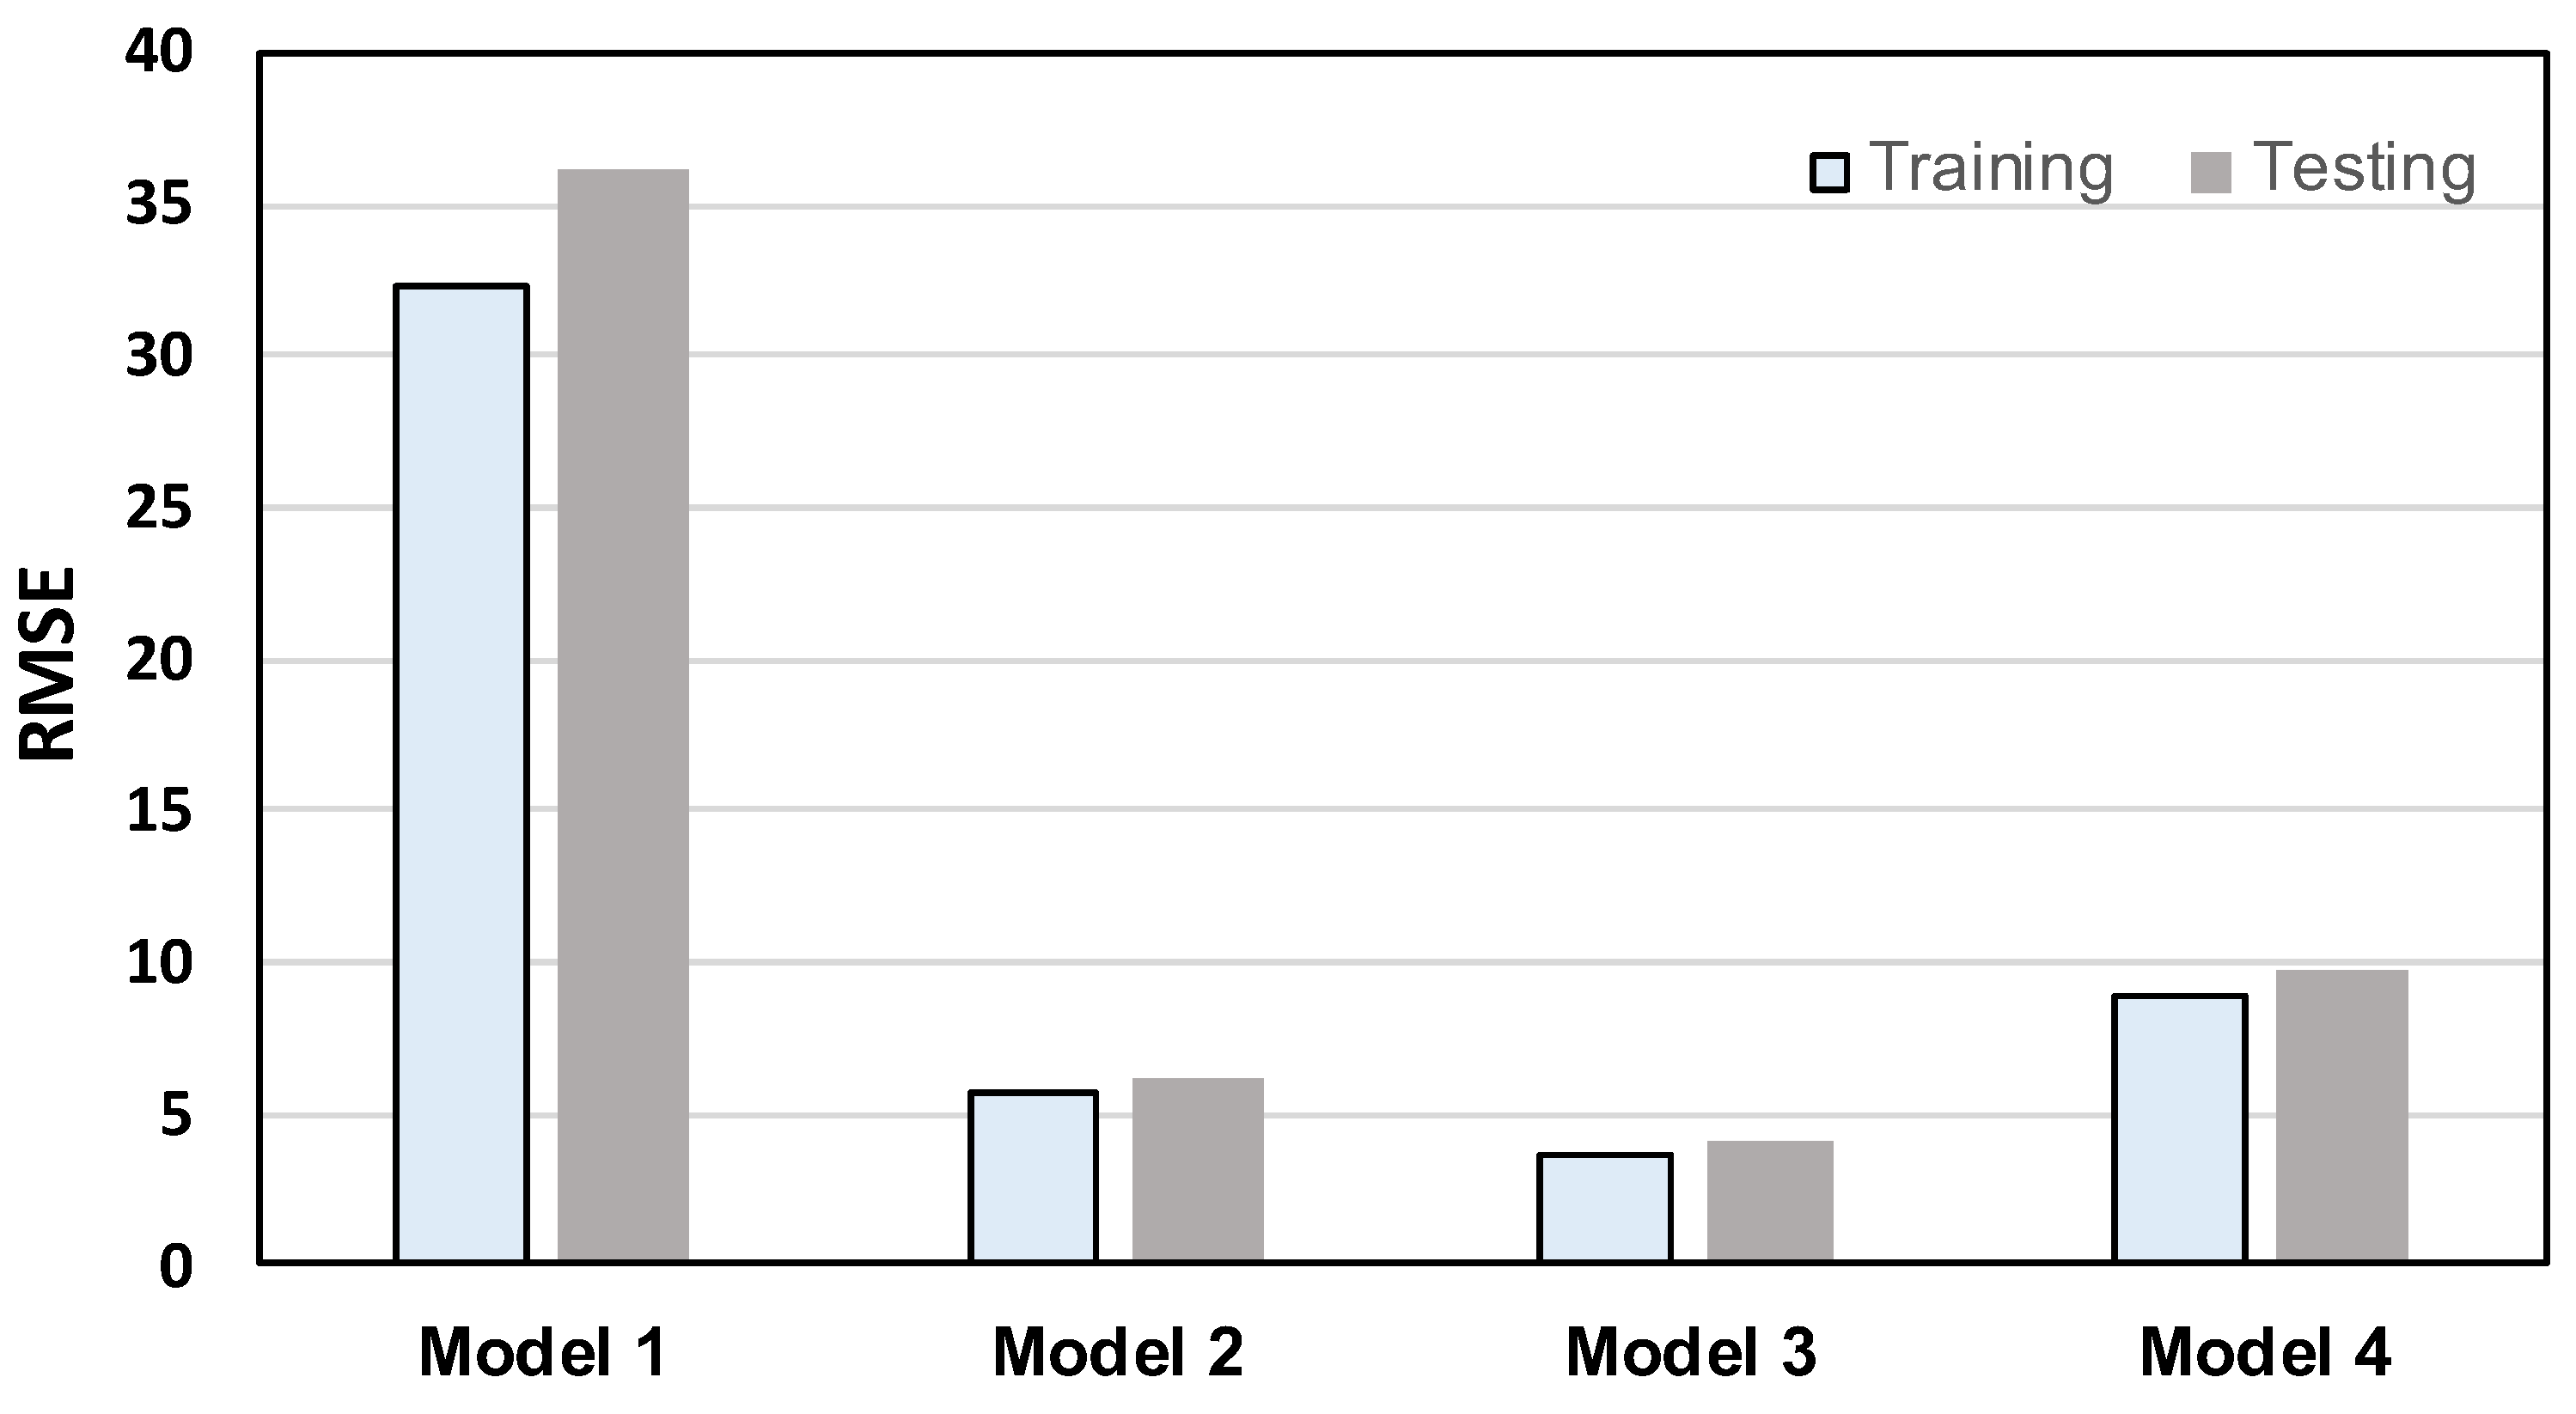
As clearly observed in Figure 14a, Model 1 produces inaccurate MBL prediction results when evaluated on both training and testing datasets. The model struggles to differentiate the MBL cases in both training and testing datasets. The training and testing RMSE values are significant and reached 32.291 and 36.26, respectively. The MBL prediction accuracy was enhanced due to the network’s increased depth. As observed from Figure 14b, the predictions and the actual MBL values showed good agreement for most MBL cases. The training and testing RMSE values of Model 2 are small, reaching 5.67 and 6.212, respectively.
Figure 14c illustrates the results of Model 3. The network’s performance was also improved. It is shown that Model 3 delivers precise forecasts for all the MBL cases with a high level of consistency between the prediction and the groundtruth, yielding an RMSE of only 3.704 for training and 4.021 for validation. The prediction outcomes of Model 4 are depicted in Figure 14d. When the depth of the network continues to increase, the network’s accuracy tends to be reduced. For Model 4, the predictions and the true values are consistent for certain MBL cases. The evaluation of the training and testing datasets yield RMSE values of 8.900 and 9.709, respectively, which are significantly higher than those of Model 3.
Figure 15 compares the training and the testing RMSE values of the four 1D CNN models. As expected, the testing RMSE is slightly higher than the training RMSE. Among the four models, it is evident that Model 3 delivers the most accurate predictions with negligible errors. Consequently, Model 3 should be chosen as an appropriate 1D CNN-based prediction model for bone loss monitoring.

4.3.3. 1D CNN-Based Monitoring Results

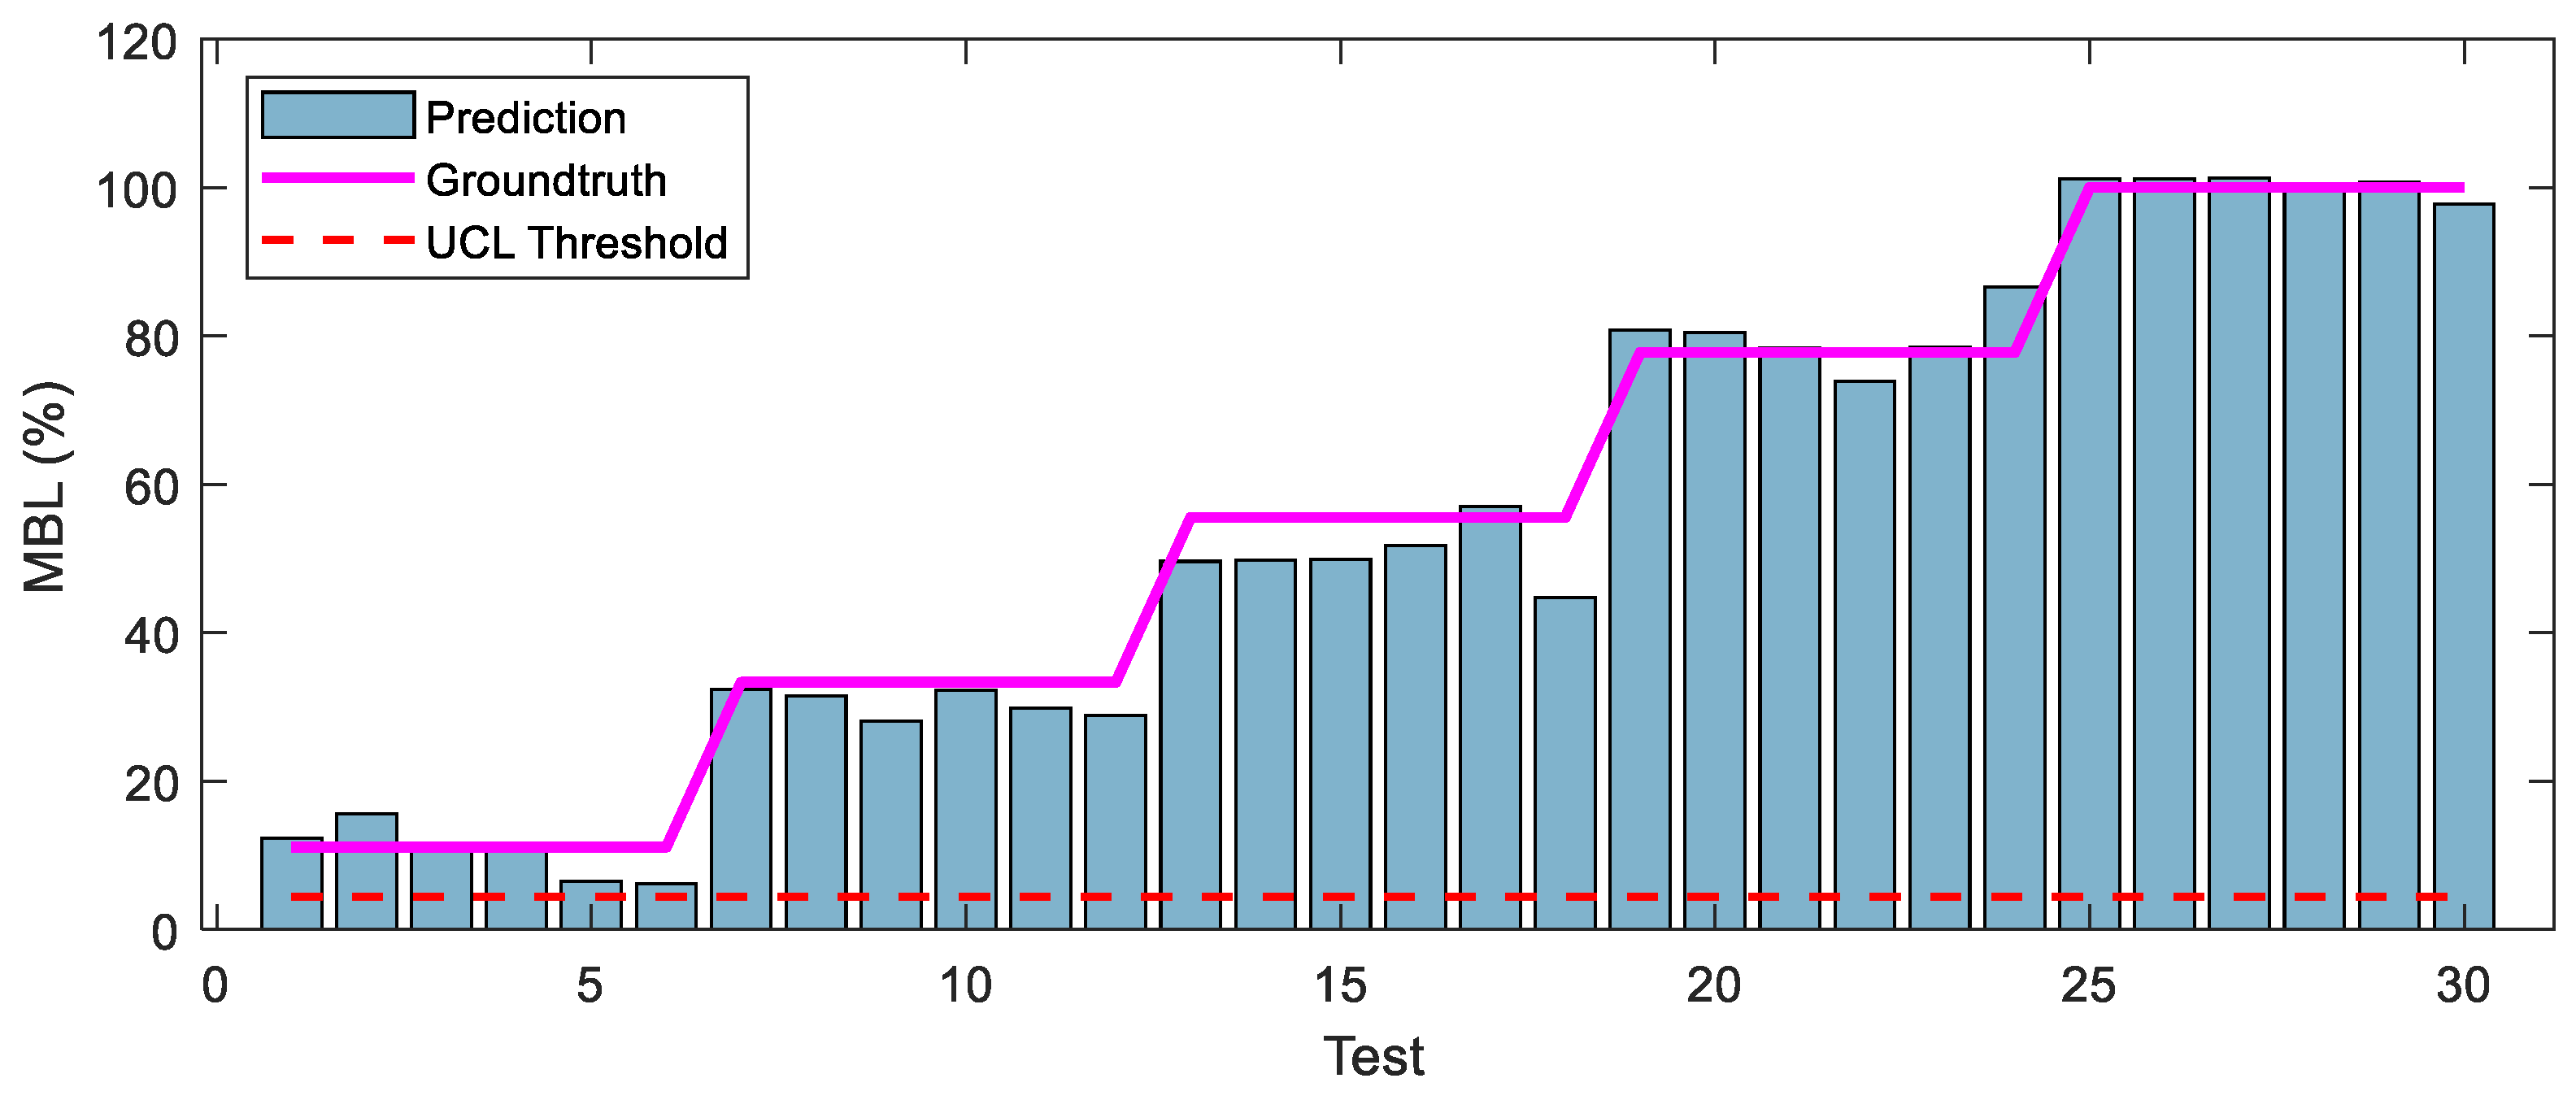
Figure 16 presents the MBL assessment results of Model 3 (the selected 1D CNN model) when evaluated on the testing dataset. The UCL threshold was estimated as 4.407. The number of test cases is 30, corresponding to the five testing cases (Cases D1, D3, D5, D7, and D9). As observed from Figure 16, the predicted MBL values are above the UCL threshold for all testing cases, indicating that all MBL cases are successfully diagnosed. The predicted MBL values are also consistent with the actual values for all testing cases. It should be noted that traditional statistical metrics evaluation methods (i.e., RMSD and CCD metrics) are limited in assessing the MBL around the implant. Due to nonlinear conductance changes, they could detect the presence of bone loss in some cases but could not estimate the MBL severity. In contrast, our proposed method automatically extracted optimal frequency points from the raw conductance data, thereby reducing the impact of nonlinear conductance characteristics and enhancing the accuracy of bone loss prediction.

5. Discussion

Evaluating MBL over an extended duration is imperative for assessing the long-term success of implant structures. While minimal early bone loss is promising, continuous monitoring is essential to ascertain the implant’s enduring stability. Traditionally, the MBL is measured through radiographic assessments, often comparing initial bone levels with those observed over time [5]. However, radiographic assessments involve exposing the patient to ionizing radiation. Although the amount of radiation in dental X-rays is relatively low, repeated or unnecessary X-rays can contribute to cumulative radiation exposure, which is a critical concern for both patients and healthcare providers.
This study presents an alternative promising solution using autonomous deep learning-based prediction of implant MBL, offering promise for future, radiation-free implant stability assessment tools in implantology. The proposed method can overcome the shortcomings of the traditional PZT-enabled conductance sensing technique when dealing with nonlinearities in the damage characteristics and therefore provides a more accurate MBL estimation result. It is noted that a previous study [21] focused on bone healing monitoring at the bone–implant interface using conductance responses, while this study solves a different problem, that is, MBL monitoring after surgery. Moreover, the previous study used traditional PZT-enabled conductance sensing with manual feature extraction. This study proposes an automated signal processing scheme using 1D CNN models that help predict the MBL autonomously. The integration of the PZT-enabled conductance sensing method with deep learning introduces an alternative perspective to this field.
The PZT-enabled conductance sensing method differs from the well-established RFA technique in several aspects. (1) Regarding the principle of operation, the PZT-enabled conductance sensing method capitalizes on exploiting variations in the mechanical properties of materials, utilizing piezoelectric transducers to discern structural alterations. By measuring changes in implant conductance, this approach exhibits exceptional sensitivity to minute modifications in the surrounding bone and tissue structure. (2) Concerning the frequency range, unlike RFA, which typically operates within the frequency range of 3.5–8.5 kHz [9], the PZT-enabled conductance sensing method employs significantly higher frequencies of local vibrations (see Figure 10). In this study, signal frequencies ranging from 50–200 kHz were utilized, showcasing the potential to accurately diagnose minor bone loss or changes in the bone–implant interface. The utilization of high-frequency signals enhances the technique’s potential for precise diagnosis, particularly in identifying minor changes in the bone–implant interface. This attribute positions the method as a promising tool for detecting minor bone loss with enhanced accuracy. (3) Lastly, regarding excitation conditions, this technique precisely stimulates PZT with a consistent excitation voltage value for each test, meticulously controlled through an impedance analyzer. This meticulous control ensures consistent excitation conditions, mitigating experimental errors and ensuring reliability across tests.
The previous study showed that the conductance response of the implant suitable for stability assessment should be measured within a frequency range of 500–1000 kHz [21]. The conductance measurement in such high frequencies requires a high-performance data acquisition system, which is often costly, has a large size, and therefore lacks mobility for real dental applications. In this study, due to the unique architecture and robustness of the 1D CNN model, the optimal frequency points can be autonomously selected from a lower frequency band of 50–200 kHz to produce accurate MBL prediction results. The lower frequency band can facilitate the implementation of low-cost and portable active sensing devices [45,46] to monitor implant stability in the future.
However, there are multifaceted considerations in the application of the proposed method such as patient comfort and safety and the clinical performance of the proposed method. In our research, the reported testing error of 4% corresponds to an estimated bone loss of 0.52 mm within the FE model, assuming the entire bone surrounding the implant is 100%. While these errors are relatively small in percentage terms, it is crucial to interpret them within the context of clinical applications. In dental implantology, for instance, even small discrepancies in bone-loss predictions can impact treatment planning and patient outcomes. To further address the clinical significance, we will perform additional analyses to compare our error margins against established clinical thresholds or guidelines. This will provide a more comprehensive understanding of the practical implications of our findings.
Moreover, the design of the transducer should prioritize patient comfort and minimize any inconvenience. For instance, it is crucial to use natural piezoelectric biomaterials for transducer fabrication [77]. To guarantee the safety and comfort of patients, the testing process should be conducted by skilled professionals with patient wellbeing in mind. Furthermore, the method will undergo a thorough examination through in vivo tests involving a wide variety of experimental samples and implants to evaluate its effectiveness. This study is preliminary, and continuous enhancements and advancements are underway concerning transducers, portable conductance analyzers, and data-processing techniques aimed at transforming the proposed methodology into practical real-world applications.

6. Concluding Remarks and Future Work

In this study, we developed the MBL monitoring method for implant structures by integrating the PZT-enabled conductance sensing technique with the autonomous 1D CNN algorithm. Through numerical simulations and validation, the following key findings have been obtained:
(1)
The FE modeling approach for PZT-enabled conductance sensing was successfully validated by comparing the FE modeling results with experimental data.
(2)
The PZT transducer activated the local circumferential modes of the implant. Some of these vibration modes were ignorable in the conductance spectrum of the implant due to the constraint of the jawbone in FE modeling.
(3)
Traditional statistical approaches showed their unsuitability for estimating the MBL severity at the bone–implant interface due to the nonlinearities in the conductance characteristics.
(4)
Among the four models, Model 3 yielded the best MBL monitoring results. The prediction and the groundtruth were consistent when evaluated on training and testing datasets, with RMSE values of only 3.704 and 4.021, respectively.
(5)
The proposed method offers the unique advantage of directly extracting optimal features from the raw conductance signals without the need for extensive preprocessing, rendering it highly suitable for autonomous MBL monitoring in dentistry.
(6)
The application of deep learning can reduce the need for high-performance impedance analyzers, allowing the use of low-cost devices for impedance-based stability monitoring of implant structures.
Our forthcoming endeavors will prioritize further comprehensive experimental studies, including comparative analyses, to demonstrate the distinct advantages of our method in terms of accuracy, reliability, and clinical applicability. Also, we will focus on improving and updating the numerical model to better represent the realistic behavior and the geometrical parameters of the biological tissues for implant structure analysis. The bone-loss pattern should also mimic realistic clinical situations. Next, since different implant types could have different vibrational modes, yielding different conductance responses, the proposed method will be examined for other types of implants. Furthermore, we will focus on creating mobile transducer devices and conductance analyzers, facilitating convenient monitoring of implants in dentistry. Future investigations should also focus on combining the proposed method with other techniques such as RFA to offer a more comprehensive evaluation.

Author Contributions

Conceptualization, T.-C.H., M.-H.T. and D.-D.H.; methodology, J.-T.K., N.-D.H., T.-C.H., M.-H.T. and D.-D.H.; validation, N.-D.H., T.-C.H., D.-D.H. and M.-H.T.; writing—original draft preparation, T.-C.H., D.-D.H. and M.-H.T.; writing—review and editing, J.-T.K., N.-D.H., T.-C.H., D.-D.H., N.-L.D., N.-T.-V.P., H.-K.L. and M.-H.T. All authors have read and agreed to the published version of the manuscript.

Funding

This research received no external funding.

Data Availability Statement

The data are available upon request.

Acknowledgments

We acknowledge Ho Chi Minh City University of Technology (HCMUT), VNU-HCM for supporting this study.

Conflicts of Interest

The authors declare no conflicts of interest.

References

  1. Nandal, S.; Ghalaut, P.; Shekhawat, H. A radiological evaluation of marginal bone around dental implants: An in-vivo study. Natl. J. Maxillofac. Surg. 2014, 5, 126–137. [Google Scholar] [CrossRef] [PubMed]
  2. Albrektsson, T.; Zarb, G.; Worthington, P.; Eriksson, A. The long-term efficacy of currently used dental implants: A review and proposed criteria of success. Int. J. Oral Maxillofac. Implant. 1986, 1, 11–25. [Google Scholar]
  3. Smith, D.E.; Zarb, G.A. Criteria for success of osseointegrated endosseous implants. J. Prosthet. Dent. 1989, 62, 567–572. [Google Scholar] [CrossRef] [PubMed]
  4. Bergman, B. Evaluation of the results of treatment with osseointegrated implants by the Swedish National Board of Health and Welfare. J. Prosthet. Dent. 1983, 50, 114–115. [Google Scholar] [CrossRef] [PubMed]
  5. Yoo, S.Y.; Kim, S.K.; Heo, S.J.; Koak, J.Y.; Jeon, H.R. New Rehabilitation Concept for Maxillary Edentulism: A Clinical Retrospective Study of Implant Crown Retained Removable Partial Dentures. J. Clin. Med. 2021, 10, 1773. [Google Scholar] [CrossRef] [PubMed]
  6. Kittur, N.; Oak, R.; Dekate, D.; Jadhav, S.; Dhatrak, P. Dental implant stability and its measurements to improve osseointegration at the bone-implant interface: A review. Mater. Today Proc. 2021, 43, 1064–1070. [Google Scholar] [CrossRef]
  7. Ribolla, E.L.M.; Rizzo, P.; Gulizzi, V. On the use of the electromechanical impedance technique for the assessment of dental implant stability: Modeling and experimentation. J. Intell. Mater. Syst. Struct. 2015, 26, 2266–2280. [Google Scholar] [CrossRef]
  8. Blanes, R.J.; Bernard, J.P.; Blanes, Z.M.; Belser, U.C. A 10-year prospective study of ITI dental implants placed in the posterior region. I: Clinical and radiographic results. Clin. Oral Implant. Res. 2007, 18, 699–706. [Google Scholar] [CrossRef] [PubMed]
  9. Atsumi, M.; Park, S.-H.; Wang, H.-L. Methods used to assess implant stability: Current status. Int. J. Oral Maxillofac. Implant. 2007, 22, 743–754. [Google Scholar]
  10. Swain, R.; Faulkner, G.; Raboud, D.; Wolfaardt, J. A Dynamic Analytical Model for Impact Evaluation of Percutaneous Implants. J. Biomech. Eng. 2008, 130, 051013. [Google Scholar] [CrossRef]
  11. Swain, R.; Faulkner, G.; Raboud, D.; Wolfaardt, J. An improved impact technique for monitoring percutaneous implant integrity. Int. J. Oral Maxillofac. Implant. 2008, 23, 263–269. [Google Scholar]
  12. Reuben, R.L. 13—Acoustic emission and ultrasound for monitoring the bone-implant interface. In Bone Response to Dental Implant Materials; Piattelli, A., Ed.; Woodhead Publishing: Sawston, UK, 2017; pp. 247–259. [Google Scholar] [CrossRef]
  13. Aoki, H. The mobility of healthy teeth as measured with the impact hammer method. Kanagawa Shigaku 1987, 22, 13–31. [Google Scholar] [PubMed]
  14. Meredith, N. Assessment of implant stability as a prognostic determinant. Int. J. Prosthodont. 1998, 11, 491–501. [Google Scholar]
  15. Salvi, G.E.; Lang, N.P. Diagnostic parameters for monitoring peri-implant conditions. Int. J. Oral Maxillofac. Implant. 2004, 19, 116–127. [Google Scholar]
  16. Geckili, O.; Bilhan, H.; Cilingir, A.; Bilmenoglu, C.; Ates, G.; Urgun, A.C.; Bural, C. Comparative Ex Vivo Evaluation of Two Electronic Percussive Testing Devices Measuring the Stability of Dental Implants. J. Periodontol. 2014, 85, 1786–1791. [Google Scholar] [CrossRef] [PubMed]
  17. Hériveaux, Y.; Vayron, R.; Fraulob, M.; Albini Lomami, H.; Lenormand, C.; Haiat, G. Assessment of dental implant stability using resonance frequency analysis and quantitative ultrasound methods. J. Prosthodont. Res. 2020, 65, 421–427. [Google Scholar] [CrossRef]
  18. Pattijn, V.; Van Lierde, C.; Van der Perre, G.; Naert, I.; Vander Sloten, J. The resonance frequencies and mode shapes of dental implants: Rigid body behaviour versus bending behaviour. A numerical approach. J. Biomech. 2006, 39, 939–947. [Google Scholar] [CrossRef] [PubMed]
  19. Watzek, G. Implants in qualitatively compromised bone. Br. Dent. J. 2004, 197, 163. [Google Scholar] [CrossRef]
  20. Boemio, G.; Rizzo, P.; Nardo, L.D. Assessment of dental implant stability by means of the electromechanical impedance method. Smart Mater. Struct. 2011, 20, 045008. [Google Scholar] [CrossRef]
  21. Ribolla, E.L.; Rizzo, P. Modeling the electromechanical impedance technique for the assessment of dental implant stability. J. Biomech. 2015, 48, 1713–1720. [Google Scholar] [CrossRef]
  22. Bahl, S.; Nagar, H.; Singh, I.; Sehgal, S. Smart materials types, properties and applications: A review. Mater. Today: Proc. 2020, 28, 1302–1306. [Google Scholar] [CrossRef]
  23. Sony, S.; Laventure, S.; Sadhu, A. A literature review of next-generation smart sensing technology in structural health monitoring. Struct. Control Health Monit. 2019, 26, e2321. [Google Scholar] [CrossRef]
  24. Park, G.; Inman, D.J. Structural health monitoring using piezoelectric impedance measurements. Philos. Trans. A Math. Phys. Eng. Sci. 2007, 365, 373–392. [Google Scholar] [CrossRef] [PubMed]
  25. Jiao, P.; Egbe, K.-J.I.; Xie, Y.; Matin Nazar, A.; Alavi, A.H. Piezoelectric sensing techniques in structural health monitoring: A state-of-the-art review. Sensors 2020, 20, 3730. [Google Scholar] [CrossRef] [PubMed]
  26. Le, T.-C.; Luu, T.-H.-T.; Nguyen, H.-P.; Nguyen, T.-H.; Ho, D.-D.; Huynh, T.-C. Piezoelectric Impedance-Based Structural Health Monitoring of Wind Turbine Structures: Current Status and Future Perspectives. Energies 2022, 15, 5459. [Google Scholar] [CrossRef]
  27. Zhu, J.; Wang, Y.; Qing, X. A real-time electromechanical impedance-based active monitoring for composite patch bonded repair structure. Compos. Struct. 2019, 212, 513–523. [Google Scholar] [CrossRef]
  28. Li, H.; Ai, D.; Zhu, H.; Luo, H. Integrated electromechanical impedance technique with convolutional neural network for concrete structural damage quantification under varied temperatures. Mech. Syst. Signal Process. 2021, 152, 107467. [Google Scholar] [CrossRef]
  29. Nguyen, T.-T.; Hoang, N.-D.; Nguyen, T.-H.; Huynh, T.-C. Analytical impedance model for piezoelectric-based smart Strand and its feasibility for prestress force prediction. Struct. Control Health Monit. 2022, 29, e3061. [Google Scholar] [CrossRef]
  30. Truong, T.-D.-N.; Pradhan, A.M.S.; Nguyen, T.-T.; Tran, M.-H.; Nguyen, C.-K.; Ho, D.-D.; Huynh, T.-C. Bone-Implant Osseointegration Monitoring Using Electro-mechanical Impedance Technique and Convolutional Neural Network: A Numerical Study. J. Nondestruct. Eval. 2024, 43, 10. [Google Scholar] [CrossRef]
  31. Abdeljaber, O.; Avci, O.; Kiranyaz, M.S.; Boashash, B.; Sodano, H.; Inman, D.J. 1-D CNNs for structural damage detection: Verification on a structural health monitoring benchmark data. Neurocomputing 2018, 275, 1308–1317. [Google Scholar] [CrossRef]
  32. Abdeljaber, O.; Avci, O.; Kiranyaz, S.; Gabbouj, M.; Inman, D.J. Real-time vibration-based structural damage detection using one-dimensional convolutional neural networks. J. Sound Vib. 2017, 388, 154–170. [Google Scholar] [CrossRef]
  33. Cha, Y.-J.; Choi, W.; Büyüköztürk, O. Deep Learning-Based Crack Damage Detection Using Convolutional Neural Networks. Comput.-Aided Civ. Infrastruct. Eng. 2017, 32, 361–378. [Google Scholar] [CrossRef]
  34. Azimi, M.; Pekcan, G. Structural health monitoring using extremely compressed data through deep learning. Comput.-Aided Civ. Infrastruct. Eng. 2020, 35, 597–614. [Google Scholar] [CrossRef]
  35. Huynh, T.-C. Vision-based autonomous bolt-looseness detection method for splice connections: Design, lab-scale evaluation, and field application. Autom. Constr. 2021, 124, 103591. [Google Scholar] [CrossRef]
  36. Nguyen, T.-T.; Tuong Vy Phan, T.; Ho, D.-D.; Man Singh Pradhan, A.; Huynh, T.-C. Deep learning-based autonomous damage-sensitive feature extraction for impedance-based prestress monitoring. Eng. Struct. 2022, 259, 114172. [Google Scholar] [CrossRef]
  37. Yan, Q.; Liao, X.; Zhang, C.; Zhang, Y.; Luo, S.; Zhang, D. Intelligent monitoring and assessment on early-age hydration and setting of cement mortar through an EMI-integrated neural network. Measurement 2022, 203, 111984. [Google Scholar] [CrossRef]
  38. Nguyen, T.-T.; Ta, Q.-B.; Ho, D.-D.; Kim, J.-T.; Huynh, T.-C. A method for automated bolt-loosening monitoring and assessment using impedance technique and deep learning. Dev. Built Environ. 2023, 14, 100122. [Google Scholar] [CrossRef]
  39. Nguyen, T.-T.; Kim, J.-T.; Ta, Q.-B.; Ho, D.-D.; Phan, T.T.V.; Huynh, T.-C. Deep learning-based functional assessment of piezoelectric-based smart interface under various degradations. Smart Struct. Syst. Int. J. 2021, 28, 69–87. [Google Scholar]
  40. Ince, T.; Kiranyaz, S.; Eren, L.; Askar, M.; Gabbouj, M. Real-Time Motor Fault Detection by 1-D Convolutional Neural Networks. IEEE Trans. Ind. Electron. 2016, 63, 7067–7075. [Google Scholar] [CrossRef]
  41. Kiranyaz, S.; Ince, T.; Gabbouj, M. Real-Time Patient-Specific ECG Classification by 1-D Convolutional Neural Networks. IEEE Trans. Biomed. Eng. 2016, 63, 664–675. [Google Scholar] [CrossRef] [PubMed]
  42. Acharya, U.R.; Fujita, H.; Oh, S.L.; Hagiwara, Y.; Tan, J.H.; Adam, M. Application of deep convolutional neural network for automated detection of myocardial infarction using ECG signals. Inf. Sci. 2017, 415–416, 190–198. [Google Scholar] [CrossRef]
  43. Kiranyaz, S.; Avci, O.; Abdeljaber, O.; Ince, T.; Gabbouj, M.; Inman, D.J. 1D convolutional neural networks and applications: A survey. Mech. Syst. Signal Process. 2021, 151, 107398. [Google Scholar] [CrossRef]
  44. Le, B.-T.; Le, T.-C.; Luu, T.-H.-T.; Ho, D.-D.; Huynh, T.-C. Fault Assessment in Piezoelectric-Based Smart Strand Using 1D Convolutional Neural Network. Buildings 2022, 12, 1916. [Google Scholar] [CrossRef]
  45. Perera, R.; Pérez, A.; García-Diéguez, M.; Zapico-Valle, J. Active Wireless System for Structural Health Monitoring Applications. Sensors 2017, 17, 2880. [Google Scholar] [CrossRef]
  46. Pham, Q.-Q.; Ta, Q.-B.; Park, J.-H.; Kim, J.-T. Raspberry Pi Platform Wireless Sensor Node for Low-Frequency Impedance Responses of PZT Interface. Sensors 2022, 22, 9592. [Google Scholar] [CrossRef] [PubMed]
  47. Park, S.; Shin, H.-H.; Yun, C.-B. Wireless impedance sensor nodes for functions of structural damage identification and sensor self-diagnosis. Smart Mater. Struct. 2009, 18, 055001. [Google Scholar] [CrossRef]
  48. Min, J.; Park, S.; Yun, C.-B.; Song, B. Development of a low-cost multifunctional wireless impedance sensor node. Smart Struct. Syst. 2010, 6, 689–709. [Google Scholar] [CrossRef]
  49. Liang, C.; Sun, F.P.; Rogers, C.A. Coupled Electro-Mechanical Analysis of Adaptive Material Systems—Determination of the Actuator Power Consumption and System Energy Transfer. J. Intell. Mater. Syst. Struct. 1994, 5, 12–20. [Google Scholar] [CrossRef]
  50. Caliendo, C. Acoustic Wave Conductometric Sensors. In Encyclopedia of Sensors and Biosensors, 1st ed.; Narayan, R., Ed.; Elsevier: Oxford, UK, 2023; pp. 591–616. [Google Scholar] [CrossRef]
  51. Xu, Y.; Liu, G. A modified electro-mechanical impedance model of piezoelectric actuator-sensors for debonding detection of composite patches. J. Intell. Mater. Syst. Struct. 2002, 13, 389–396. [Google Scholar] [CrossRef]
  52. Wang, L.; Yuan, B.; Xu, Z.; Sun, Q. Synchronous detection of bolts looseness position and degree based on fusing electro-mechanical impedance. Mech. Syst. Signal Process. 2022, 174, 109068. [Google Scholar] [CrossRef]
  53. Park, G.; Sohn, H.; Farrar, C.R.; Inman, D.J. Overview of piezoelectric impedance-based health monitoring and path forward. Shock Vib. Dig. 2003, 35, 451–464. [Google Scholar] [CrossRef]
  54. Zhang, Y.; Wallace, B. A Sensitivity Analysis of (and Practitioners’ Guide to) Convolutional Neural Networks for Sentence Classification. arXiv 2015, arXiv:1510.03820. [Google Scholar]
  55. Gu, J.; Wang, Z.; Kuen, J.; Ma, L.; Shahroudy, A.; Shuai, B.; Liu, T.; Wang, X.; Wang, L.; Wang, G. Recent advances in convolutional neural networks. arXiv 2015, arXiv:1512.07108. [Google Scholar] [CrossRef]
  56. LeCun, Y.; Bengio, Y.; Hinton, G. Deep learning. Nature 2015, 521, 436–444. [Google Scholar] [CrossRef] [PubMed]
  57. LeCun, Y.; Boser, B.; Denker, J.S.; Henderson, D.; Howard, R.E.; Hubbard, W.; Jackel, L.D. Backpropagation applied to handwritten zip code recognition. Neural Comput. 1989, 1, 541–551. [Google Scholar] [CrossRef]
  58. Geng, J.-P.; Tan, K.B.C.; Liu, G.-R. Application of finite element analysis in implant dentistry: A review of the literature. J. Prosthet. Dent. 2001, 85, 585–598. [Google Scholar] [CrossRef] [PubMed]
  59. Qiu, P.; Cao, R.; Li, Z.; Fan, Z. A comprehensive biomechanical evaluation of length and diameter of dental implants using finite element analyses: A systematic review. Heliyon 2024, 10, e26876. [Google Scholar] [CrossRef] [PubMed]
  60. Ceddia, M.; Lamberti, L.; Trentadue, B. FEA Comparison of the Mechanical Behavior of Three Dental Crown Materials: Enamel, Ceramic, and Zirconia. Materials 2024, 17, 673. [Google Scholar] [CrossRef] [PubMed]
  61. Nguyen, T.-H.; Phan, T.T.V.; Le, T.-C.; Ho, D.-D.; Huynh, T.-C. Numerical Simulation of Single-Point Mount PZT-Interface for Admittance-Based Anchor Force Monitoring. Buildings 2021, 11, 550. [Google Scholar] [CrossRef]
  62. Huynh, T.-C.; Dang, N.-L.; Kim, J.-T. Preload monitoring in bolted connection using piezoelectric-based smart interface. Sensors 2018, 18, 2766. [Google Scholar] [CrossRef]
  63. Kitts, D.J.; Zagrai, A.N. Finite Element Modeling and Effect of Electrical/Mechanical Parameters on Electromechanical Impedance Damage Detection. In Proceedings of the ASME 2009 Conference on Smart Materials, Adaptive Structures and Intelligent Systems, Oxnard, CA, USA, 21–23 September 2009. [Google Scholar]
  64. Tashakori, S.; Farhangdoust, S.; Baghalian, A.; Tansel, I.N.; Mehrabi, A. Evaluating the performance of the SuRE method for inspection of bonding using the COMSOL finite element analysis package. In Proceedings of the Health Monitoring of Structural and Biological Systems XIII, Denver, CO, USA, 4–7 March 2019; SPIE: Bellingham, WA, USA, 2019. [Google Scholar]
  65. Rugina, C.; Enciu, D.; Tudose, M. Numerical and experimental study of circular disc electromechanical impedance spectroscopy signature changes due to structural damage and sensor degradation. Struct. Health Monit. 2015, 14, 663–681. [Google Scholar] [CrossRef]
  66. Nguyen, T.-T.; Ho, D.-D.; Huynh, T.-C. Electromechanical impedance-based prestress force prediction method using resonant frequency shifts and finite element modelling. Dev. Built Environ. 2022, 12, 100089. [Google Scholar] [CrossRef]
  67. Lobur, M.; Vivchar, D.; Jaworski, N. MEMS pressure sensors design by the COMSOL system. In Proceedings of the 2016 13th International Conference on Modern Problems of Radio Engineering, Telecommunications and Computer Science (TCSET), Lviv, Ukraine, 23–26 February 2016. [Google Scholar]
  68. Massimino, G.; Colombo, A.; Ardito, R.; Quaglia, F.; Foncellino, F.; Corigliano, A. Air-Coupled Array of Pmuts at 100 kHz with PZT Active Layer: Multiphysics Model and Experiments. In Proceedings of the 2019 20th International Conference on Thermal, Mechanical and Multi-Physics Simulation and Experiments in Microelectronics and Microsystems (EuroSimE), Hannover, Germany, 24–27 March 2019. [Google Scholar]
  69. Demkowicz, L. A note on symmetry boundary conditions in finite element methods. Appl. Math. Lett. 1991, 4, 27–30. [Google Scholar] [CrossRef]
  70. Beaupré, G.; Orr, T.; Carter, D. An approach for time-dependent bone modeling and remodeling—Theoretical development. J. Orthop. Res. 1990, 8, 651–661. [Google Scholar] [CrossRef] [PubMed]
  71. Hambli, R. Numerical procedure for multiscale bone adaptation prediction based on neural networks and finite element simulation. Finite Elem. Anal. Des. 2011, 47, 835–842. [Google Scholar] [CrossRef]
  72. Giurgiutiu, V.; Zagrai, A.; Jing Bao, J. Piezoelectric wafer embedded active sensors for aging aircraft structural health monitoring. Struct. Health Monit. 2002, 1, 41–61. [Google Scholar] [CrossRef]
  73. Min, J.; Park, S.; Yun, C.-B. Impedance-based structural health monitoring using neural networks for autonomous frequency range selection. Smart Mater. Struct. 2010, 19, 125011. [Google Scholar] [CrossRef]
  74. Huynh, T.-C.; Kim, J.-T. Compensation of temperature effect on impedance responses of PZT interface for prestress-loss monitoring in PSC girders. Smart Struct. Syst. 2016, 17, 881–901. [Google Scholar] [CrossRef]
  75. Wandowski, T.; Malinowski, P.; Radzienski, M.; Opoka, S.; Ostachowicz, W. Methods for Assessment of Composite Aerospace Structures. In Smart Structures and Materials: Selected Papers from the 7th ECCOMAS Thematic Conference on Smart Structures and Materials; Araujo, A.L., Mota Soares, C.A., Eds.; Springer International Publishing: Cham, Switzerland, 2017; pp. 227–244. [Google Scholar] [CrossRef]
  76. Baptista, F.G.; Budoya, D.E.; Almeida, V.A.D.d.; Ulson, J.A.C. An Experimental Study on the Effect of Temperature on Piezoelectric Sensors for Impedance-Based Structural Health Monitoring. Sensors 2014, 14, 1208–1227. [Google Scholar] [CrossRef]
  77. Wang, R.; Sui, J.; Wang, X. Natural Piezoelectric Biomaterials: A Biocompatible and Sustainable Building Block for Biomedical Devices. ACS Nano 2022, 16, 17708–17728. [Google Scholar] [CrossRef]
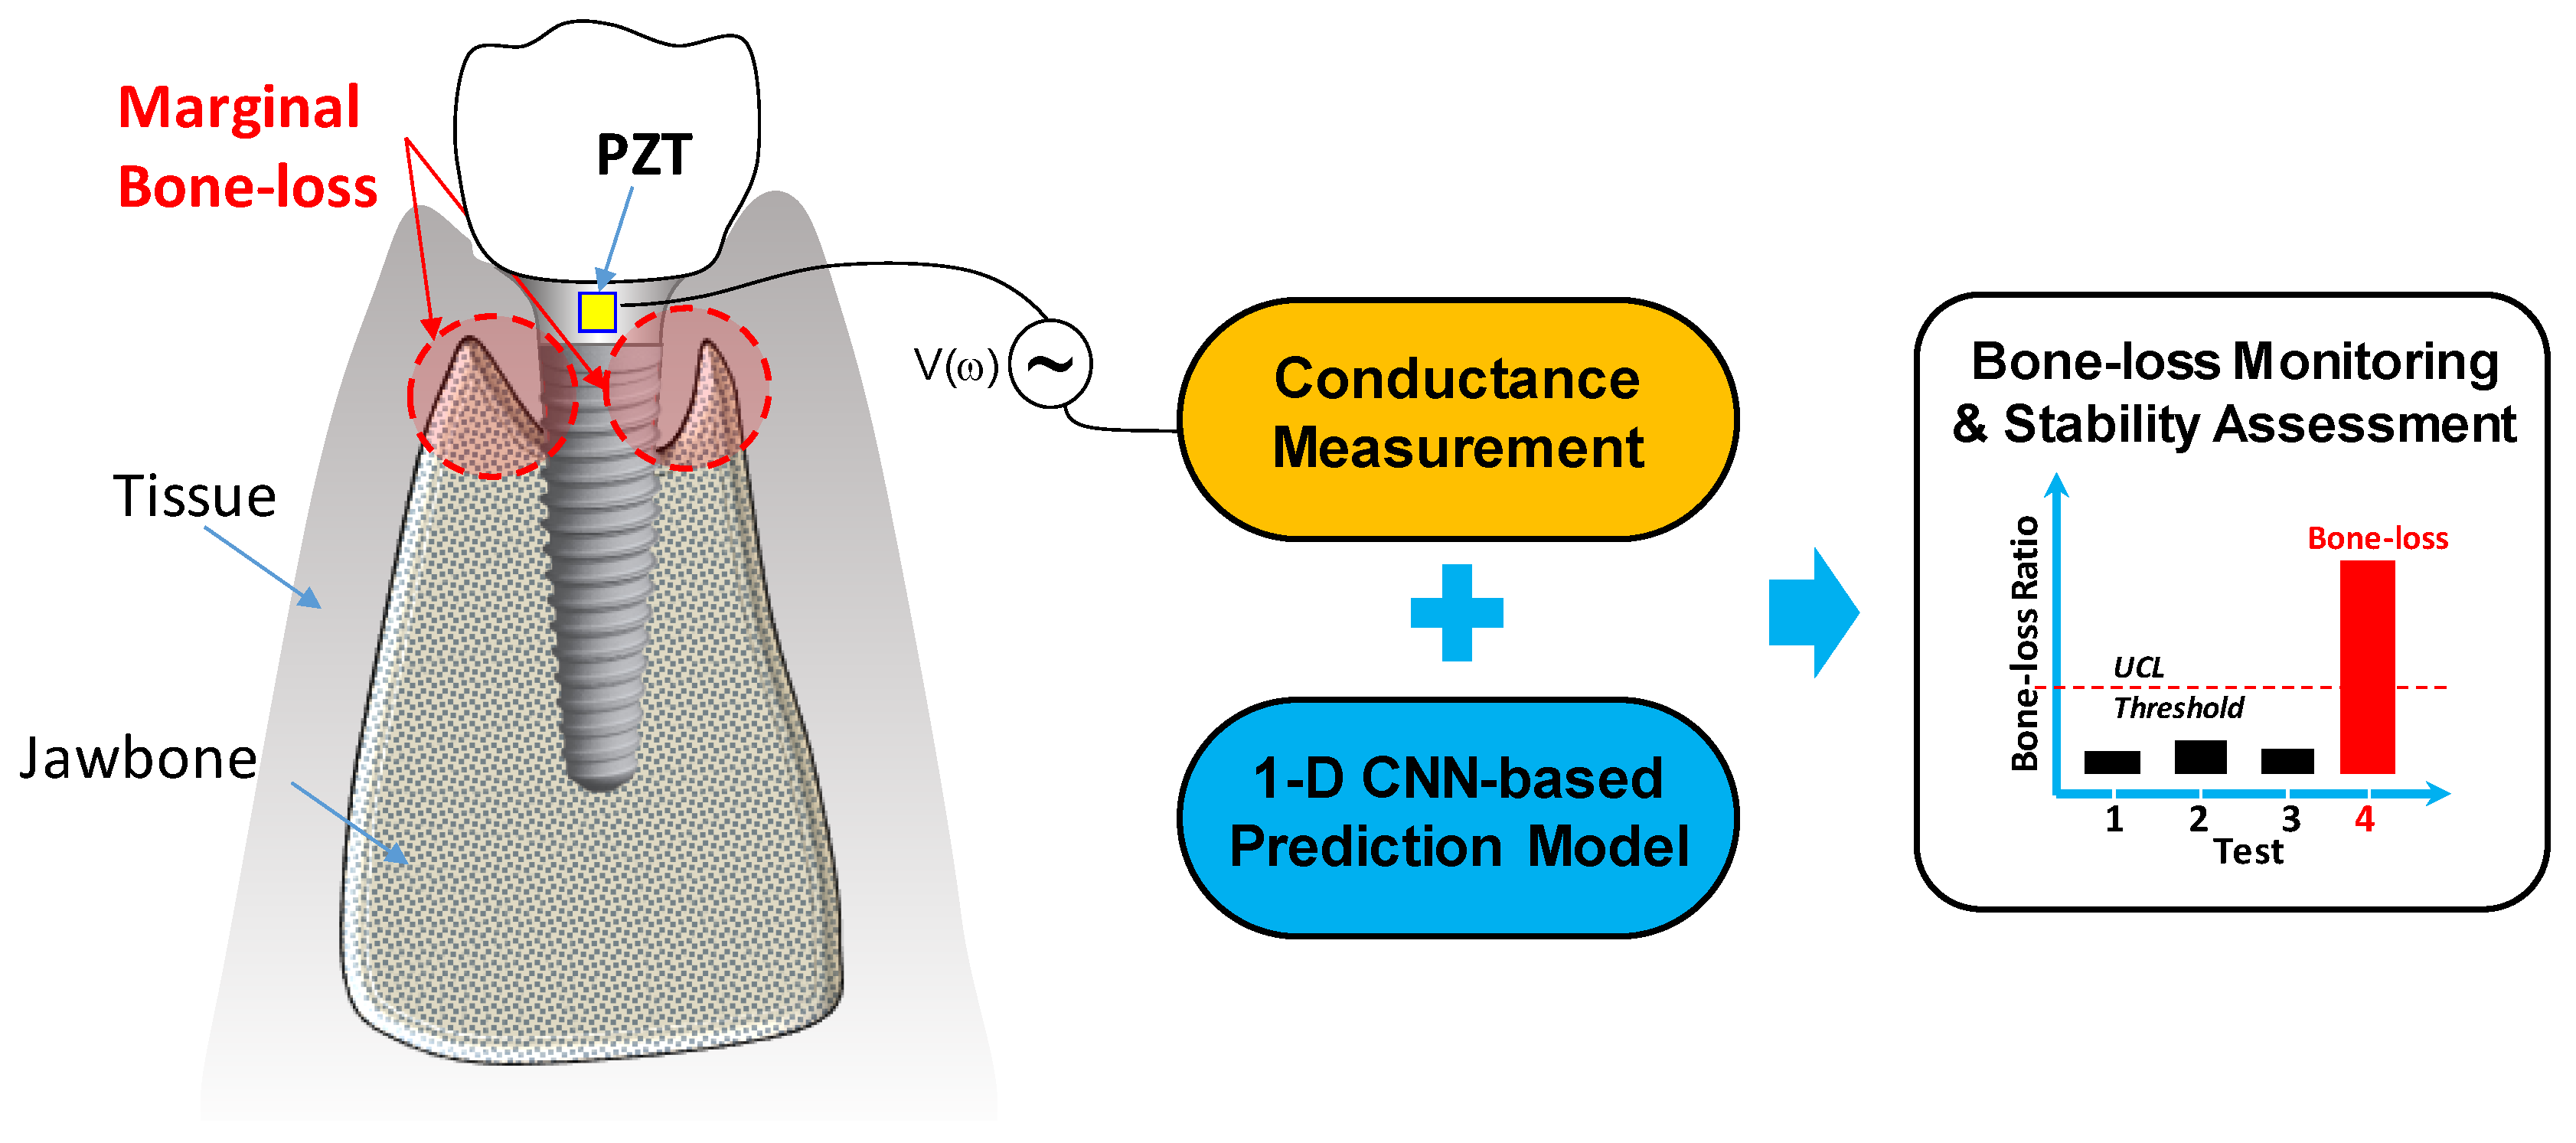
Figure 1. The proposed MBL method integrating the PZT-enabled conductance sensing technique with the 1D CNN algorithm.
Jsan 13 00052 g001
Figure 2. The PZT–implant interaction and 1-dof simplified EMI model.
Jsan 13 00052 g002
Figure 3. The architecture of 1D CNN-based bone-loss prediction models for implants. xi: input: y: output, Conv: convolutional layer, Batchnorm: batch normalization layer, ReLU: rectified linear unit layer, Maxpool: maxpooling layer, FC: fully connected (FC) layer.
Jsan 13 00052 g003
Figure 4. (a) The experimental test of a PZT-free beam structure; (b) FE modeling.
Jsan 13 00052 g004
Figure 5. Validation of the FE modeling approach (a) Simulated conductance vs. experimental result; (b) simulated susceptance vs. experimental result; (c) simulated peak frequency vs. experimental result; (d) simulation error of the peak frequencies; (e) electro-mechanical interactions between the PZT transducer and the free beam at different resonances.
Jsan 13 00052 g005
Figure 6. FE modeling of the PZT–implant–bone system: (a) the 3D numerical model; (b) the boundary conditions; (c) the meshed FE model.
Jsan 13 00052 g006
Figure 7. The conductance responses: (a) the free PZT–implant–bone system; (b) the PZT–implant system.
Jsan 13 00052 g007
Figure 8. The resonant vibration modes of (a) the PZT–implant–bone system (FEM1) and (b) the PZT–implant system (FEM2).
Jsan 13 00052 g008
Figure 9. Simulation of marginal bone loss (MBL) cases.
Jsan 13 00052 g009
Figure 10. The MBL-induced changes in the conductance spectrum: (a) the frequency band of 50 kHz–200 kHz; (b) the frequency band of 56 kHz–60 kHz; (c) the frequency band of 140 kHz–160 kHz.
Jsan 13 00052 g010
Figure 11. Statistical metric-based MBL monitoring results: (a) RMSD metric and (b) CCD metric using the frequency range of 50 kHz–200 kHz; (c) RMSD metric and (d) CCD metric using the six sub-ranges.
Jsan 13 00052 g011
Figure 12. The conductance signals of typical bone-loss cases before and after adding white noise: (a) original signals; (b) noisy signals.
Jsan 13 00052 g012
Figure 13. Training of the four 1D CNN models: (a) training loss; (b) training RMSE.
Jsan 13 00052 g013
Figure 14. The performance evaluation of (a) Model 1, (b) Model 2, (c) Model 3, and (d) Model 4.
Jsan 13 00052 g014
Figure 15. Comparison of the four 1D CNN models.
Jsan 13 00052 g015
Figure 16. The MBL assessment results of Model 3 (the best 1D CNN model) when evaluated on the testing dataset.
Jsan 13 00052 g016
Disclaimer/Publisher’s Note: The statements, opinions and data contained in all publications are solely those of the individual author(s) and contributor(s) and not of MDPI and/or the editor(s). MDPI and/or the editor(s) disclaim responsibility for any injury to people or property resulting from any ideas, methods, instructions or products referred to in the content.