Abstract
This study investigates the optimization of a low-cost IoT-based weather station designed for disaster monitoring, focusing on minimizing power consumption. The system architecture includes application, middleware, communication, and sensor layers, with solar power as the primary energy source. A novel task scheduling algorithm was developed to reduce power usage by efficiently managing the sensing and data transmission periods. Experiments compared the energy consumption of polling and deep sleep techniques, revealing that deep sleep is more energy-efficient (4.73% at 15 s time intervals and 16.45% at 150 s time intervals). Current consumption was analyzed across different test scenarios, confirming that efficient task scheduling significantly reduces power consumption. The energy consumption models were developed to quantify power usage during the sensing and transmission phases. This study concludes that the proposed system, utilizing affordable hardware and solar power, is an effective and sustainable solution for disaster monitoring. Despite using non-low-power devices, the results demonstrate the importance of adaptive task scheduling in extending the operational life of IoT devices. Future work will focus on implementing dynamic scheduling and low-power routing algorithms to enhance system functionality in resource-constrained environments.
1. Introduction
Natural disasters cause significant deaths and economic downturns globally, impacting countries at different levels [1]. During emergencies, their capacity to conduct real-time data analysis and task execution is crucial. Internet of Things (IoT) technologies support disaster management, with most countries establishing meteorological departments to forecast weather based on atmospheric data from weather stations, weather stations, and satellite photos [2]. The function of Internet of Things (IoT) devices is becoming increasingly vital in disaster response. Nevertheless, crises’ ever-changing and uncertain nature presents substantial obstacles to the traditional task scheduling algorithms used in IoT systems. These issues encompass effectively handling network conditions, fluctuations, energy resource limitations, and the pressing requirement for prompt data processing and decision-making. To tackle these issues, it is necessary to create inventive scheduling solutions that are resilient and flexible in the face of swift changes in environmental conditions.
The IoT devices consist of three main components: a microcontroller unit (MCU) that serves as the processing unit, a sensor module for collecting environmental data, and a transmission module responsible for connecting to the Internet. The IoT is defined as an interconnected network of such devices designed to collect, process, and act upon data obtained from the physical environment [3]. IoT technology also allows remote control of devices, enhancing real-time information about disaster-prone areas. Big data technology enhances the performance of these systems by processing, storing, and analyzing large volumes of data in real time. These data, including environmental and telemetry data, can identify patterns, trigger alerts, inform decision-making processes, and improve machine learning algorithms. Big data enhances disaster monitoring systems by providing real-time insights, efficient decision-making, and improved risk management.
IoT devices face resource constraints in memory, computation, low-power radio communication, and power sources. These limitations affect the accuracy and delay of transmitted data and the lifetime of sensor nodes [4]. The software perspective is crucial in designing constraint devices to address these limitations. Low-power operating systems for IoT devices should be designed for task execution [5,6,7], and network protocols like Constrained Application Protocol (CoAP) [8], Message Queuing Telemetry Transport (MQTT) [9], or Web-Socket Protocol should be used [10]. The process scheduling technique provides an optimal solution, such as a scheduling a plan based on the directed acrylic graph and quantum particle swarm optimization to optimize energy consumption [11].
The complexity of power consumption and sensor data scheduling in IoT devices encompass both hardware and software challenges. Hardware concerns encompass the optimization of transmit power over time using causal channel state information [12], the management of energy for data sensing in the face of unpredictable energy harvesting [13], and the maximization of environmental sensor coverage while conserving energy [14]. The software focuses on improving data transmission efficiency by using AI-driven decision-making models to minimize redundancy and power consumption [15]. It also includes energy-efficient data acquisition systems considering spatiotemporal data sparsity [13]. Additionally, adaptive sampling methods are developed to conserve energy while maintaining data quality, considering environmental factors such as temperature and humidity [16]. Tackling these problems is essential to improving the durability and effectiveness of IoT systems.
This work presents a task scheduling algorithm specifically tailored for IoT devices employed in disaster monitoring. This algorithm aims to decrease energy usage while ensuring prompt and effective reactions to natural disasters. The system effectively closes the current disparity between conventional energy management methods and the particular power requirements of catastrophe monitoring applications by optimizing power utilization. Consequently, the system not only greatly decreases power usage but also prolongs the lifespan of the instruments, offering a cost-efficient method for continuous monitoring in areas susceptible to disasters.
This study examines the creation and execution of an inexpensive natural catastrophe monitoring system that utilizes Internet of Things (IoT) technologies. Although government money is available, the system’s coverage is not comprehensive, so certain regions rely on local meteorological data for disaster management and planning. This research primarily focuses on two key contributions. Firstly, this research aims to improve disaster management in villages nationwide, particularly in flood-prone areas. It focuses on deploying low-cost IoT devices that are easily accessible and cost-effective because government funding does not cover all areas. This study also addresses the high energy consumption of sensor nodes, emphasizing the need for practical solutions to overcome the country’s specific constraints. Secondly, it emphasizes the enhancement of power efficiency at the software level. This study examines the impact of power-consuming elements such as processing, sensing, and transmission modules on the overall energy usage of microcontroller units (MCUs) and sensors, which are already built for low power consumption. It emphasizes the importance of energy efficiency in these components.
The rest of the paper is organized as follows: Section 2 presents a comprehensive review of related work. Section 3 describes the system architecture of our low-cost disaster monitoring system and the task scheduling algorithm. Section 4 outlines the experimental setup and results. In Section 5, we discuss the implications of our findings and potential improvements. Finally, Section 6 concludes the paper with a summary of the key contributions and future research directions.
2. Background and Related Works
2.1. Internet of Things
In several applications, Internet of Things (IoT) technologies emphasize notable progress in tackling power consumption concerns. The operation and sustainability of IoT devices, which play a crucial role in many settings, such as home automation and disaster monitoring, rely significantly on effective power management [17]. IoT’s strategy for reducing power consumption revolves around enhancing hardware and software settings. This involves utilizing energy-efficient microcontrollers, sensors, and communication modules such as ZigBee and Bluetooth Low Energy in low-power embedded systems [18]. These gadgets are frequently operated by rechargeable batteries that may be recharged using solar cells, highlighting the significance of sustainable energy sources in IoT applications. Regarding software, the main objective is to decrease power usage by implementing efficient data processing and transmission protocols that reduce unnecessary repetition, reducing the energy needed for activities. They also utilize advanced power management strategies, such as dynamically adjusting power based on the device’s operational condition and employing energy-efficient data transfer protocols [19]. These techniques help prolong the battery life of IoT devices, guaranteeing extended operation without the need for regular recharging [20]. Furthermore, implementing communication protocols that effectively manage the energy consumption of IoT systems is essential, especially when the devices need to operate independently in remote or disaster-prone locations.
The Internet of Things has two key components: smart objects and endpoints. The smart object is an embedded device comprised of a microcontroller, memory, storage, transceiver module (for connecting to the Internet), sensor, and actuator module (depending on the application). All modules are communicated via bus in the PCB that connects the power source. The power source is a battery or power adapter that trades between lifetime and comfortability [21]. The home appliance’s endpoint may be mobile phones, tablets, PCs, or embedded devices that connect directly to the smart object via the wireless network. Energy is not a limitation in this scenario. Thus, the data are transmitted via high bandwidth and reliability, such as Wi-Fi or Bluetooth. The various application protocols (Web Socket, MQTT, CoAP, etc.) are transmitted over a TCP/IP network [22]. The IoT system monitors environmental values, such as soil moisture, temperature, humidity, etc. [3]. Users access the system directly via the application and endpoint. On the other hand, the endpoints may be data storage such as RDBMS, NoSQL, and cloud services in large-scale applications [23]. The Internet of Things in the big data pipeline is a clear-cut demonstration. The IoT collects environmental data and forwards it to data storage via the Internet. The communication protocols are LTE, NB-IoT, LoraWAN, Sigfox, IEEE802.15.4, Z-Wave, etc. The bandwidth and reliability depend on the communication protocol. In addition, the communication protocol directly affects power consumption, which affects the lifetime of sensing devices.
We summarize that the IoT device for weather stations and disaster monitoring is standalone. It collects data and forwards them to the cloud or database server via LoRa Network or GSM [24]. Moreover, the device sends data in the experimental phase via WiFi or ESP-01 module. Most power sources are batteries that recharge solar cells. However, real-time management is challenging for IoT systems [25]. The sensor nodes collect data from the sensor field and forward them to the base station for preprocessing. Then, the summarized data are sent to a cloud server. This scheme is too time-consuming. Thus, real-time management must be aware, especially of a crisis or natural disaster [26]. The important factors are the sensor node and the base station. They must be live during the crisis to collect real-time sensor field data.
2.2. Energy Model Analysis
Any process’ general energy consumption, E, is the power, , that it consumes for a duration, T. The general form of the energy consumption equation is shown in Equation (1); comes from , which is the multiplication of voltage, V, and current, .
The life cycle of an IoT device is awakening from sleep mode, acquiring sensing value, processing the data point, and transmitting it through a wireless channel. This process is repeated over time, and the duty cycle plays a significant role in energy consumption: the smaller the duty cycle, the lower the average power consumption.
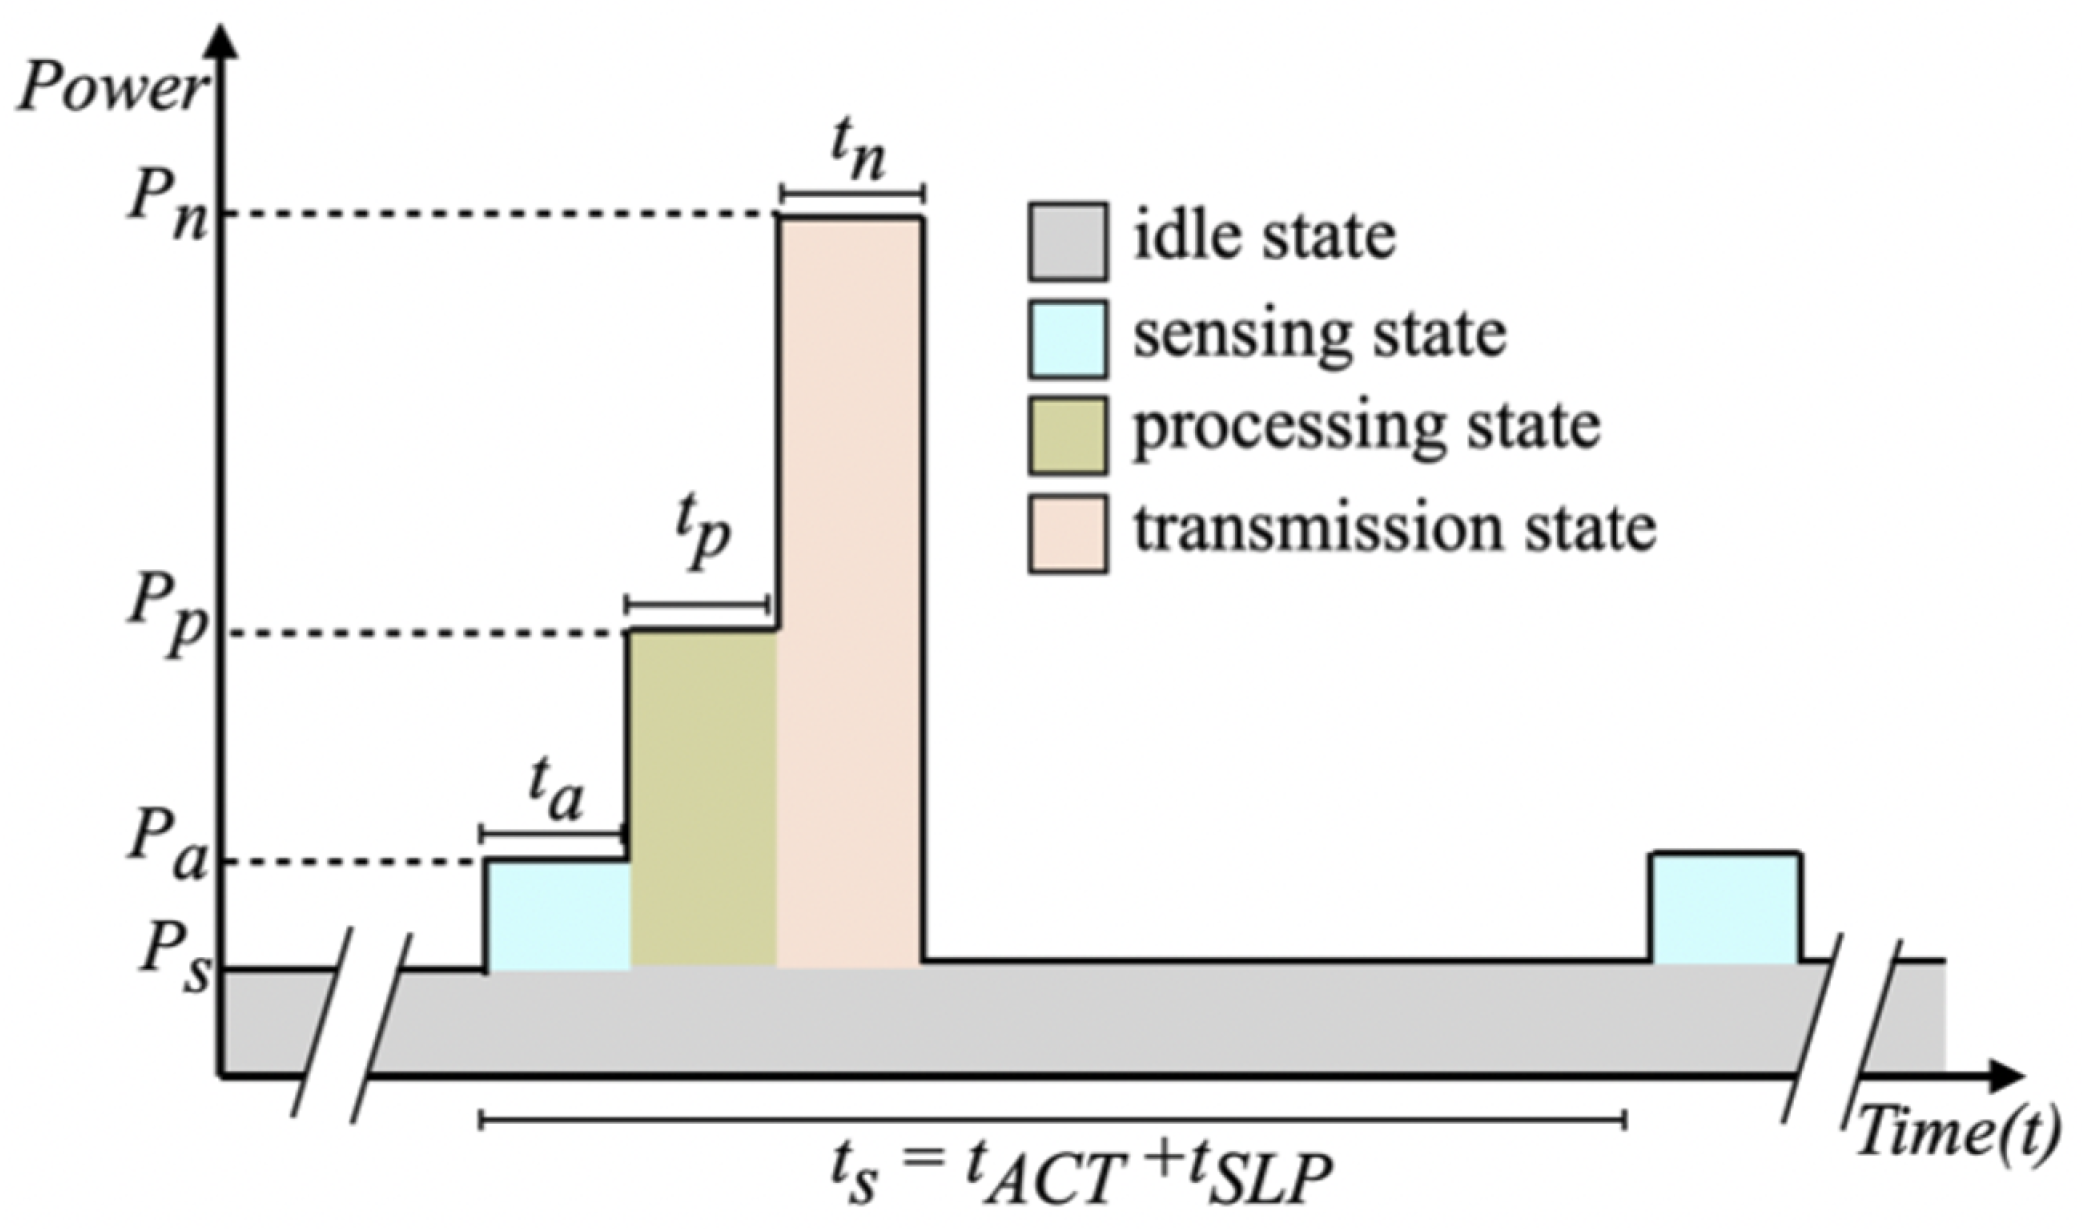
Based on this assumption, the power needed to run an IoT device may be divided into three primary stages: data sensing or acquisition, ; data processing or handling, ; and data transmission or networking, . In addition, a tiny portion is reserved for system administration activities, including real-time operating system (RTOS) execution and system awakening on schedule, [27]. The overall stage of the IoT device’s operation for a cycle is shown in Figure 1.
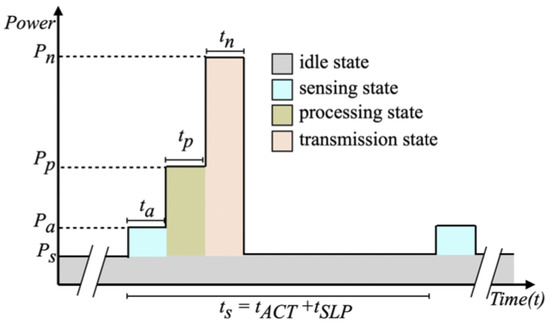
Figure 1.
The power consumption of the node.
Figure 1 shows the characteristics of tasks and their duration time that depends on the application. From Equation (1), overall energy consumption is initiated as Equation (2),
Equation (2) shows the energy consumption of IoT devices during sensing and sending data via wireless transmission. Energy consumption models are proposed for node energy consumption [7,27], and the wireless transmission module [28]. Moreover, the energy model is presented from the perspective of task scheduling. However, the wireless transmission module consumes the power 95% () while the node operation consumes 5% ().
Most research on power models and energy-aware design has focused on transmission techniques or protocols. In addition, the process in one cycle consists of active, , and sleep, , periods (). The active period consists of senseing state (), processing state (), and transmission state (). Hence, the active period (). Using low-power equipment and technologies and effective power management techniques may reduce the power consumption of both the node and the wireless transmission component.
However, all scenarios encompass four distinct states: idle state (), data acquisition state (), processing state (), and network transmission state (). Consequently, we evaluate the current consumption. The energy consumed in the idle state () and the processing state () does not significantly impact the overall experiment. Let us define as the integral of power consumption over time, represented by the equation .
The energy consumption of the IoT device is divided into two parts: the sensing and transmission parts. The sensing part () consists of the energy from node ( and data acquisition state (). Hence, the energy model of the sensing part () is
where the V represents the voltage of microcontroller unit (MCU) and sensor node while represents the current consumption of each module.
Furthermore, we examine the energy consumption from the perspective of network transmission, . Therefore, the parameter, , is measured and compared across various scenarios. The energy model for this part is represented by the overall measurement as shown in Equation (4).
where V represents the voltage of the microcontroller unit (MCU) and the current, , which depends on the transmission schedule.
In summary, we measure the power consumption by collecting the current from each module and scenario to estimate the overall power consumption. Moreover, we assume that the voltage across the system is constant. Additionally, we evaluate the total current of the microcontroller unit (MCU) that connects to the power source and distributes power to the attached modules.
2.3. Related Works: Energy Management of IoT
In order to compare prior studies on energy management in IoT devices, it is important to concentrate on many crucial elements to assess how each solution addresses the issues concerning power consumption. We show this in Table 1.
IoT devices frequently combine hardware and software to perform their tasks. When they actively process data or perform activities, the hardware components, such as microcontrollers, sensors, and actuators, consume power [29]. The type and complexity of the device, the type of hardware and software utilized, the communication protocols and networking technologies used, and other factors can all affect the power consumption of IoT devices [30]. IoT devices are typically made to use low power; however, if they are not correctly tuned, their power consumption can still be high. When executing commands or carrying out duties, the software—which includes the operating system, drivers, and applications—can also use energy [31].
Various techniques have been proposed to optimize the energy consumption of IoT devices. One technique is dynamic voltage and frequency scaling (DVFS), which can adjust the frequency and voltage of the device’s hardware components to minimize power consumption while still maintaining performance [30]. Another technique is duty cycling, which involves turning off certain hardware components when not used to conserve power. Optimizing the software running on IoT devices can also reduce power consumption. This can include using efficient algorithms and data structures, minimizing unnecessary computations, and utilizing low-power operating systems and protocols designed specifically for IoT devices [6].

Table 1.
Comparison of energy management approaches in IoT devices.
Table 1.
Comparison of energy management approaches in IoT devices.
| Issue | Description | Relevant Citations |
|---|---|---|
| Energy Optimization Technique | Techniques such as DVFS, duty cycling, or efficient software algorithms are used to reduce energy consumption. | [6,30] |
| Hardware Efficiency | Utilization of low-power microcontrollers, sensors, and other components to optimize energy consumption at the hardware level. | [29,32] |
| Software Optimization | Optimization of software through low-power operating systems, efficient algorithms, and minimizing unnecessary computations to conserve energy. | [5,6,31] |
| Communication and Networking Protocols | Use of low-power communication methods like BLE, Zigbee, and LoRa, along with efficient MAC and routing protocols, to minimize power consumption in communication tasks. | [32,33,34,35] |
| Power Source and Sustainability | Incorporation of renewable energy sources (e.g., solar, wind) to prolong the life of IoT devices, particularly in remote or inaccessible areas. | [36,37,38,39,40] |
| Task Scheduling for Power Minimization | This paper introduces a task scheduling algorithm that efficiently manages sensing and data transmission periods to reduce power consumption. It uses deep sleep techniques to further minimize energy usage. | Our approach |
Communication protocols and networking technologies significantly impact IoT device power consumption [33]. Wireless communication methods, such as Bluetooth or Wi-Fi, require high power consumption to transmit and receive data. Additionally, networking technologies can affect power consumption based on range, data rate, MAC protocol, and routing protocol [34]. Overall, there are several ways to minimize the power consumption of Internet of Things (IoT) devices:
- Use low-power hardware: Use components specifically designed for low-power consumption, such as low-power microcontrollers and sensors.
- Optimize your system’s power management: Implement power management strategies that can help reduce the power consumption of your system, such as turning off unused peripherals and putting the device into sleep mode when not in use.
- Use a low-power operating system: Implement the real-time operating system and low power consumption to handle multitasking of IoT services [5].
- Use efficient communication protocols: Choose communication protocols that are designed for low power consumption, such as Bluetooth Low Energy (BLE) or Zigbee [32,35].
- Use power-efficient networking: Use networking technologies that are designed for low power consumption, such as Wi-Fi HaLow or Long Range (LoRa) networks [34,41].
- Use renewable energy sources: Consider using renewable energy sources, such as solar or wind power, to power your IoT devices. This can help reduce their power consumption and carbon footprint [36].
IoT devices will last as long as their power source does since using too much power can cause the device to overheat, which can damage it or make it stop working. So, it is important for IoT computing to use as little power as possible, and using renewable energy sources can help extend the device’s monitoring life [37,38]. It is crucial to use power-efficient components and software to extend the life of IoT devices. Additionally, renewable energy sources such as solar, wind, or kinetic energy can help prolong the device’s monitoring life. This can be especially useful in remote or hard-to-reach areas where replacing or recharging batteries is difficult. IoT devices can operate longer and provide continuous monitoring and data collection by combining energy-efficient design with renewable energy sources. Power management in IoT devices is a critical aspect that involves hardware and software issues, including estimating power consumption and scheduling sensor readings [42]. However, actual power consumption may differ from the predicted values. Power management implementation is crucial for disaster monitoring systems, but budget constraints can limit investments in high-performance equipment, resulting in incomplete coverage of surveillance areas [39,40].
3. Materials and Methods
3.1. System Architecture
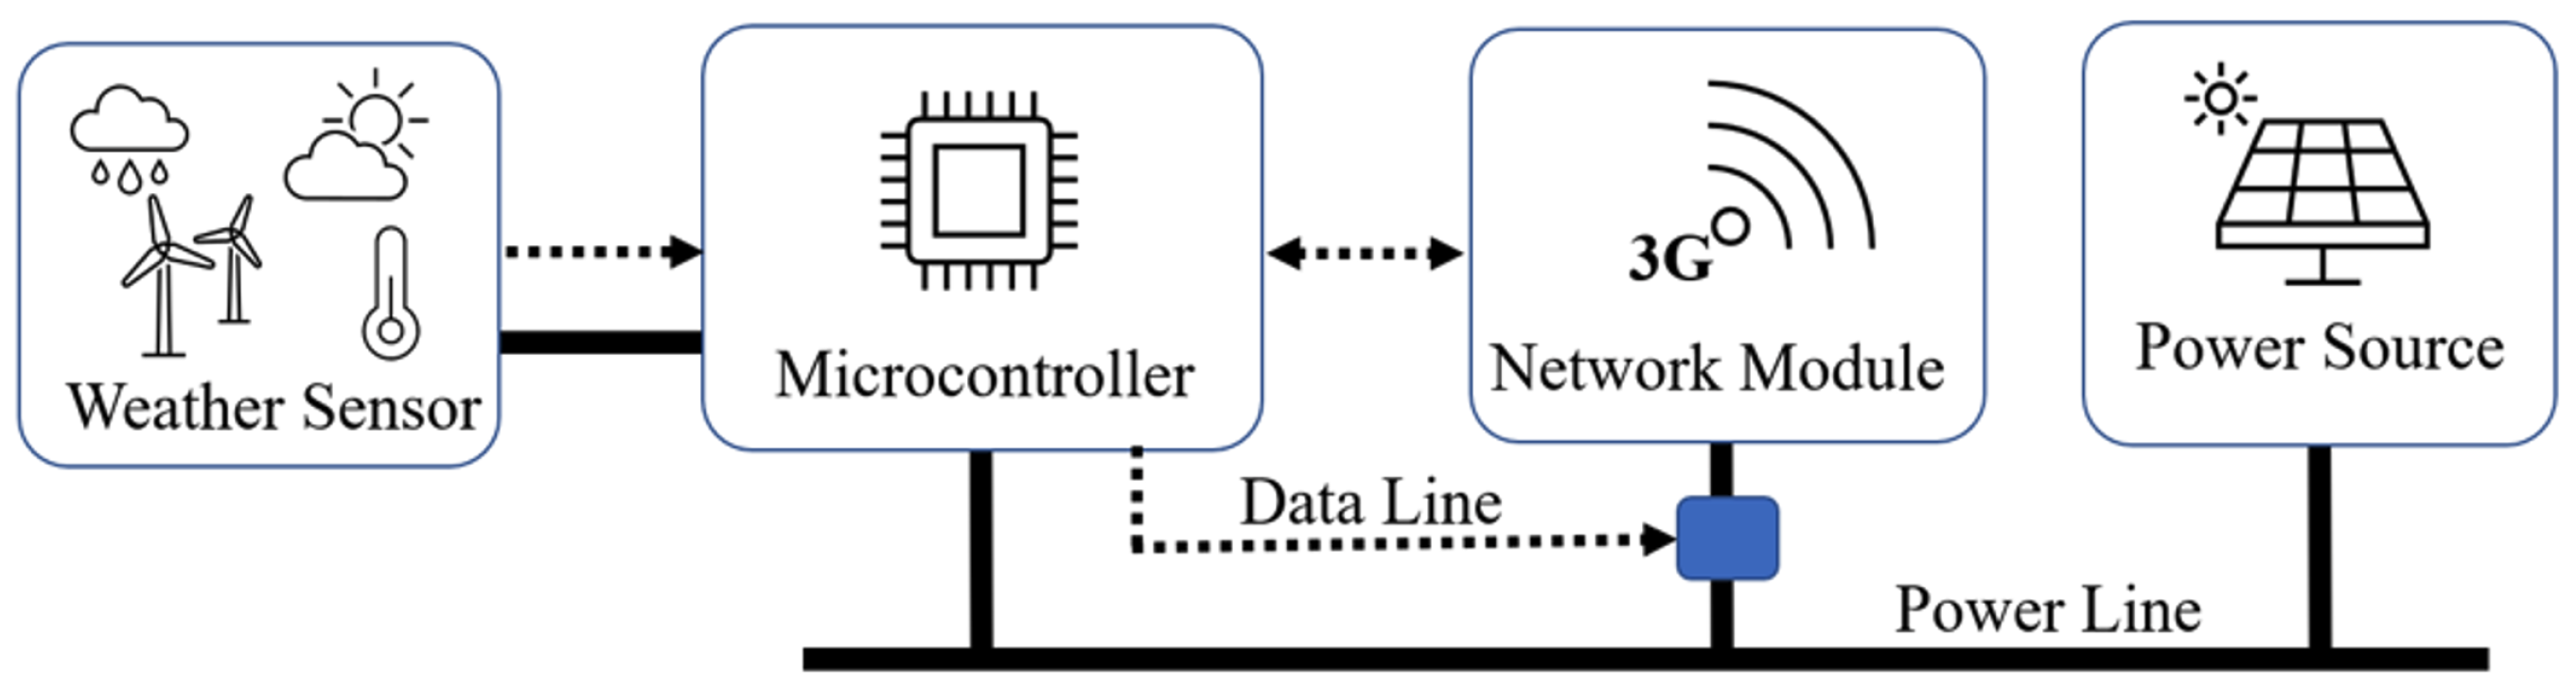
The weather station system architecture comprises four layers: application, middleware, communication, and sensor. The application layer uses mobile and web-based apps, with a chatbot as the user interface. The middleware layer handles data storage and web API, storing data in NoSQL and implementing a simple web API. Depending on the area, the communication layer uses wireless network communication, such as 3/4/5G, LoraWAN, or NB-IoT. This paper focuses on the sensor layer, with an IoT station attached to the weather sensor in the crisis area, collecting and sending data to the middleware layer or IoT cloud.
The weather station consists of 4 modules: a weather sensor, a microcontroller, a network, and a power source. This weather station is designed to monitor environmental crises. Thus, the power consumption needs to be monitored. Moreover, the limitation of network bandwidth is a factor that affects the system. The microcontroller and weather sensor are the supporters of power consumption minimization.
The power source is the vital module of the IoT station. This system selects the solar power system as the primary source. In a normal situation, the power source works with full performance. On the other hand, the power source is the system’s decision. Thus, the capacity of solar cells and batteries needs to be calculated.
The solar cells convert the solar energy into electrical energy stored in the batteries. The system employs the Maximum Power Point Tracking (MPPT) algorithm to optimize the solar power system. The battery capacity calculation also considers the worst-case scenario of 3 days without sunlight. The battery is also the module that the system can control to reduce power consumption in crises. Therefore, the battery capacity is selected based on the available energy balance equation. The following make up the software architecture:
- The network module is the main power consumption module. Each network module consumes a different level of power that results in the total level of throughput. On the other hand, it represents the main objective of the monitoring system. If the network fails, the analysis module in the big data system cannot process continuously.
- The microcontroller is the system’s computation, memory, and storage module. Power-aware programming needs to be a priority in resource-constrained devices. Power constraints need to be considered, especially because they affect the lifetime and stability of the system.
- Weather sensors are the collection of the sensor modules that collect sensing data. The type of sensor affects the accuracy of sensing data and power consumption, too.
Our design proposes power management at the software level. The specific sensor, microcontroller, and network devices have yet to be determined. We plan to schedule the sensing and sending periods to reduce power consumption. Figure 2 illustrates our approach where the microcontroller turns the network module’s power on/off to ensure the network module is active during the sending time and is turned off during inactive time. The solid line represents the power line.
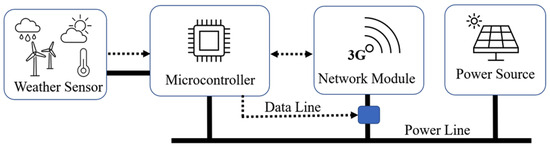
Figure 2.
The system architecture of the IoT weather station. The data line is represented with the dotted line to turn the network module on/off via relay.
3.2. Low-Cost Disaster Monitoring System
This experiment utilized the IoT devices based on the system architecture depicted in Figure 2. The testbed was implemented using the ESP8266 or NodeMCU board, with the firmware developed in C-sketch programming language. The ESP8266 had a 32-bit microcontroller, 80 MHz clock speed, 4 kB flash memory, 64 kB RAM, WiFi IEEE802.11b/g/n, and a C to 125 C temperature range. The NodeMCU’s voltage was 3.3 V. The weather sensor comprised DHT22 for humidity and temperature monitoring, PMS7003 for pm 1.0 and 2.5 monitoring, wind speed with direction, and rain gauge. Three sensors, wind, rain gauge, and PMS7003, were connected via RS232. The voltage of these sensors was 3.3 V, and they related to the digital pin and the 5.0 V pin. Additionally, a relay was connected between ESP8266 and the network module’s power line. The IoT device is connected to the Internet via Wi-Fi, connected to a 4G IoT gateway. The power source was solar power connected to the solar cell and battery of 12 V 500 A. Figure 3 illustrates the connection between the ESP8266 microcontroller and its sensor, while the right-hand side shows its installation in the sensor field.
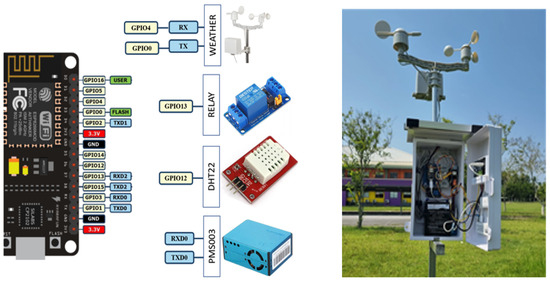
Figure 3.
The low-cost disaster monitoring system and its peripheral sensor.
3.3. Task Scheduling Algorithm
From the software architecture perspective, the IoT weather station consists of three components: a microcontroller, weather sensor, and network module. All components communicate via the digital line depending on their interface. Figure 4 shows the sequence diagram and its method.
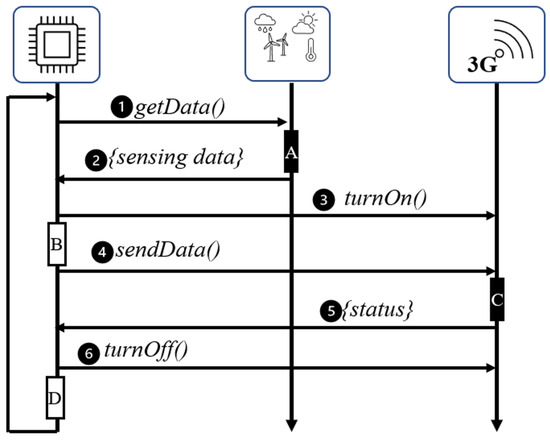
Figure 4.
The sequence diagram of the software architecture.
The method in the diagram comprises two categories: executing in the module and communicating between modules.
The main idea of our design method is scheduling between the sensing and sending modules. The sensing module is executed in the microcontroller, while the sending module is executed in the network module. The network module consumes 95% of the overall power consumption, while 5% is used for other activities, including sensing and computing, in the sensing module.
The sequence diagram in Figure 4 shows that the first six instructions are looped in the microcontroller module. When the bootstrap code is finished, the microcontroller retrieves the sensing data from the sensor via the getData() function. The sensor modules sense the environmental data in round-robin mode. During the sensing process, there is the latency from the sensor and the delay function. The process A is repeated N times to average the collection of the sensing data based on Algorithm 1.
| Algorithm 1 Get Data Algorithm is to collect the sensing data from the sensor node |
|
The delay function in processes A, B, and C is implemented with the polling technique, while process D is selected between the polling and deep sleep technique. Each technique affects the power consumption in the microcontroller. Using the traditional delay() function in the microcontroller for the short delay has significant drawbacks, especially ESP8266. Thus, we propose the poll_delay() with the polling technique in Algorithm 2.
Algorithm 2 is a proposed polling delay function that replaces the traditional delay() function in the microcontroller for short delays. It is designed to be used in processes A, B, and C, where a few milliseconds delay is required.
| Algorithm 2 poll_delay(t) is more precise delay function |
|
The microcontroller activates the network module using the turnOn() function. To reduce energy consumption during standby mode, the wireless functionality is disabled. Under typical conditions, the IoT device transmits data once or twice daily, increasing transmission frequency during crises. Subsequently, the device attempts to establish a network connection in process B. This process employs a polling technique to delay execution while awaiting network connectivity, retrying up to T times in case of connection errors. The process is aborted if the microcontroller cannot connect to the internet after T attempts. The algorithm for the turnOn() function is detailed in Algorithm 3.
| Algorithm 3 turnOn connects to WiFi |
|
Upon establishing a network connection, the IoT device transmits data using the sendData() function, as outlined in Algorithm 4. The microcontroller awaits a status reply message. If the sending status is false, the process attempts to resend the data to the cloud for up to K rounds. However, this retry process consumes more energy than other processes. Therefore, the retry interval must be adjusted according to the specific application requirements.
| Algorithm 4 sendData transmits sensing data to server |
|
The function employs a while loop to monitor if the desired delay has elapsed continuously. Within the loop, the current time is compared to the start time of the delay. If the specified delay period has passed, the loop exits, returning control to the calling function. If not, the loop continues until the delay period is met. As implemented here, polling delays can be more power-efficient than traditional delay() functions, which block the microcontroller from executing other code during the delay. Using polling, the microcontroller can perform other tasks while waiting for the delay to pass. However, a deep sleep technique may be more energy-efficient for longer delays. This method places the microcontroller into a low-power sleep state, waking it after the desired delay. The selection of a delay technique should be based on the specific requirements of the application and the desired balance between power consumption andfunctionality.
| Algorithm 5 Main Loop |
|
3.4. Complexity Analysis
The algorithm is structured into four essential procedures: , which repeatedly attempts to establish a WiFi connection; , which regularly collects environmental data; , which ensures data is transmitted to a remote server through multiple attempts if needed; and a main program that coordinates these functions in a continuous loop, adjusting operations based on the outcomes of the data gathering and transmission efforts.
- involves N sensing operations. Assuming each sensing operation takes constant time, the procedure operates with an complexity.
- iteratively attempts to activate the WiFi up to T times. Each attempt is considered to operate in constant time , leading to a total complexity of .
- attempts to transmit up to K times. With each transmission assumed to be , the total complexity is .
- Given that orchestrates , , and in a loop, the complexity of one iteration is the sum of the complexities of these three procedures:
The proposed algorithm exhibits linear complexity, which is tied to the variables controlling WiFi connection attempts (T), data collection cycles (N), and data transmission efforts (K). This linear nature ensures predictability and scalability, although efficiency may differ due to implementation specifics and operational conditions. Future enhancements include optimizing these procedures or developing adaptive algorithms that dynamically adjust T, N, and K in response to real-time performance data to improve efficiency.
4. Experiments and Results
This study addresses power consumption challenges in IoT devices, utilizing a low-cost weather station as the experimental model. Two primary issues were identified: power consumption during polling and the implementation of deep sleep techniques, as well as delays encountered in the waiting state of the next cycle with varying delay durations. Power consumption was systematically measured in both the microcontroller and during network transmission. This study highlights critical strategies for reducing power consumption in IoT devices.
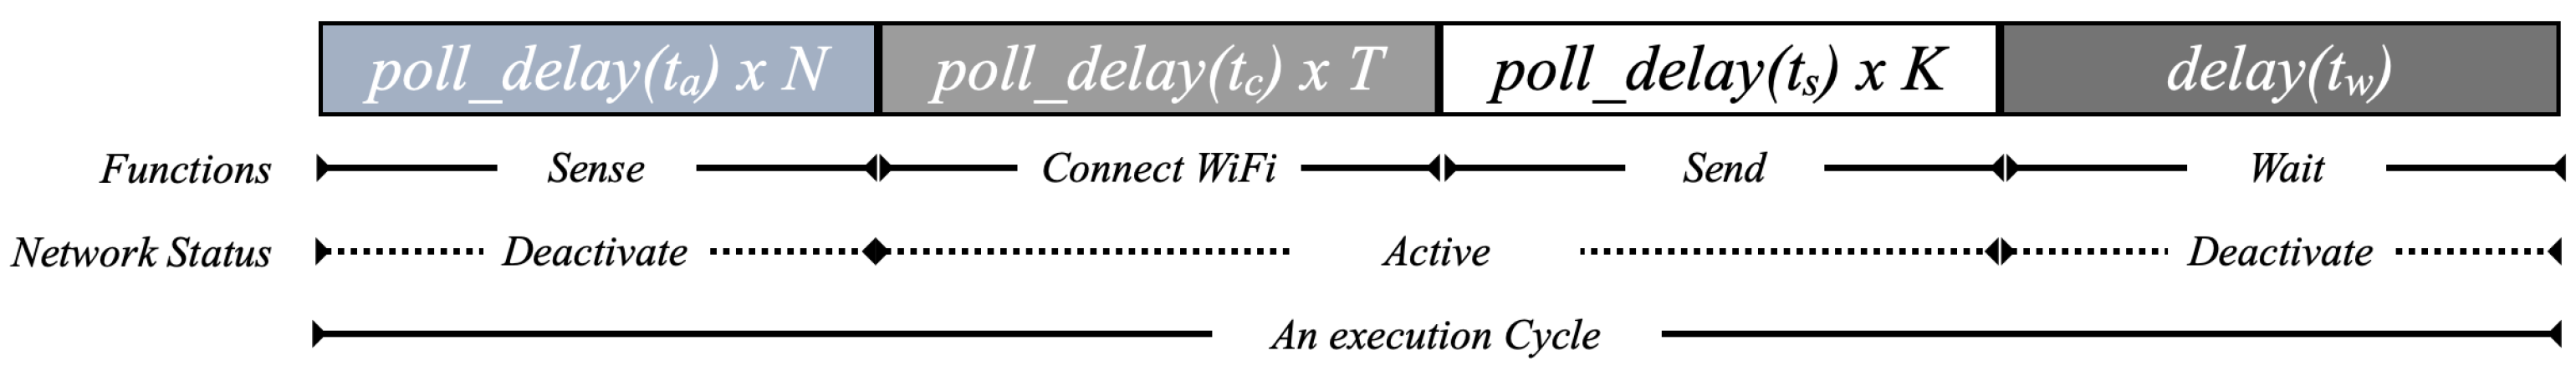
In Figure 5, we demonstrate the power consumption of getData()and sendData() functions. The test cases have four delay points: turnOn(), the getData() function, connecting the network, and waiting for the next cycle. The polling and deep sleep techniques are applied in the poll_delay() and deep_delay() functions. An execution cycle consists of two periods: active () and sleep () period. The active period is the functional state. The devices sense and send data to the data store (cloud) with the getData() and sendData() functions, whereas the sleep period waits for the next cycle with the delay technique. There is a short delay in the getData() and sendData() functions.
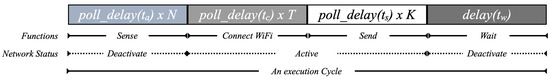
Figure 5.
The sequence diagram of the software architecture.
For the network active period, the send() function consists of two sub-functions: network connection and data transmission sub-functions. This experiment turns the WiFi module off to reduce power consumption during the network deactivation mode. Furthermore, there is a delay function connecting the network and trial time. After the device is connected, it transmits and sends data, and suddenly, the network function turns off.
4.1. The Power Consumption in Sensing Part ()
We examine the difference in delay methods between the deep sleep of the microcontroller unit (MCU) with the deep_sleep() function and the simple delay (polling method). The dependent variable is delaying tactics. We examine the differences in power usage between deep sleep and polling. Moreover, we also evaluate the power consumption in the idle state of the microcontroller unit (MCU). This scenario consists of sense/delay actions and idle state power usage. The code’s setup() and loop() functions are idle when they do not include instructions. Bootstrapping codes call the begin() and loop() functions even when the setup() and loop() functions have empty bodies (no instructions).
In addition, we specify three trial times (N, T, and K). Conversely, when polling or deep sleep techniques are implemented, the sleep period () will be 1.00, 0.10, 1.00, and 1.00 s, respectively. Finally, we compare the current consumption of the network deactivation period in terms of delay time in any scenario, as shown in Table 2, while the independent variable is current consumption.
Table 2.
The test case of the experiment I.
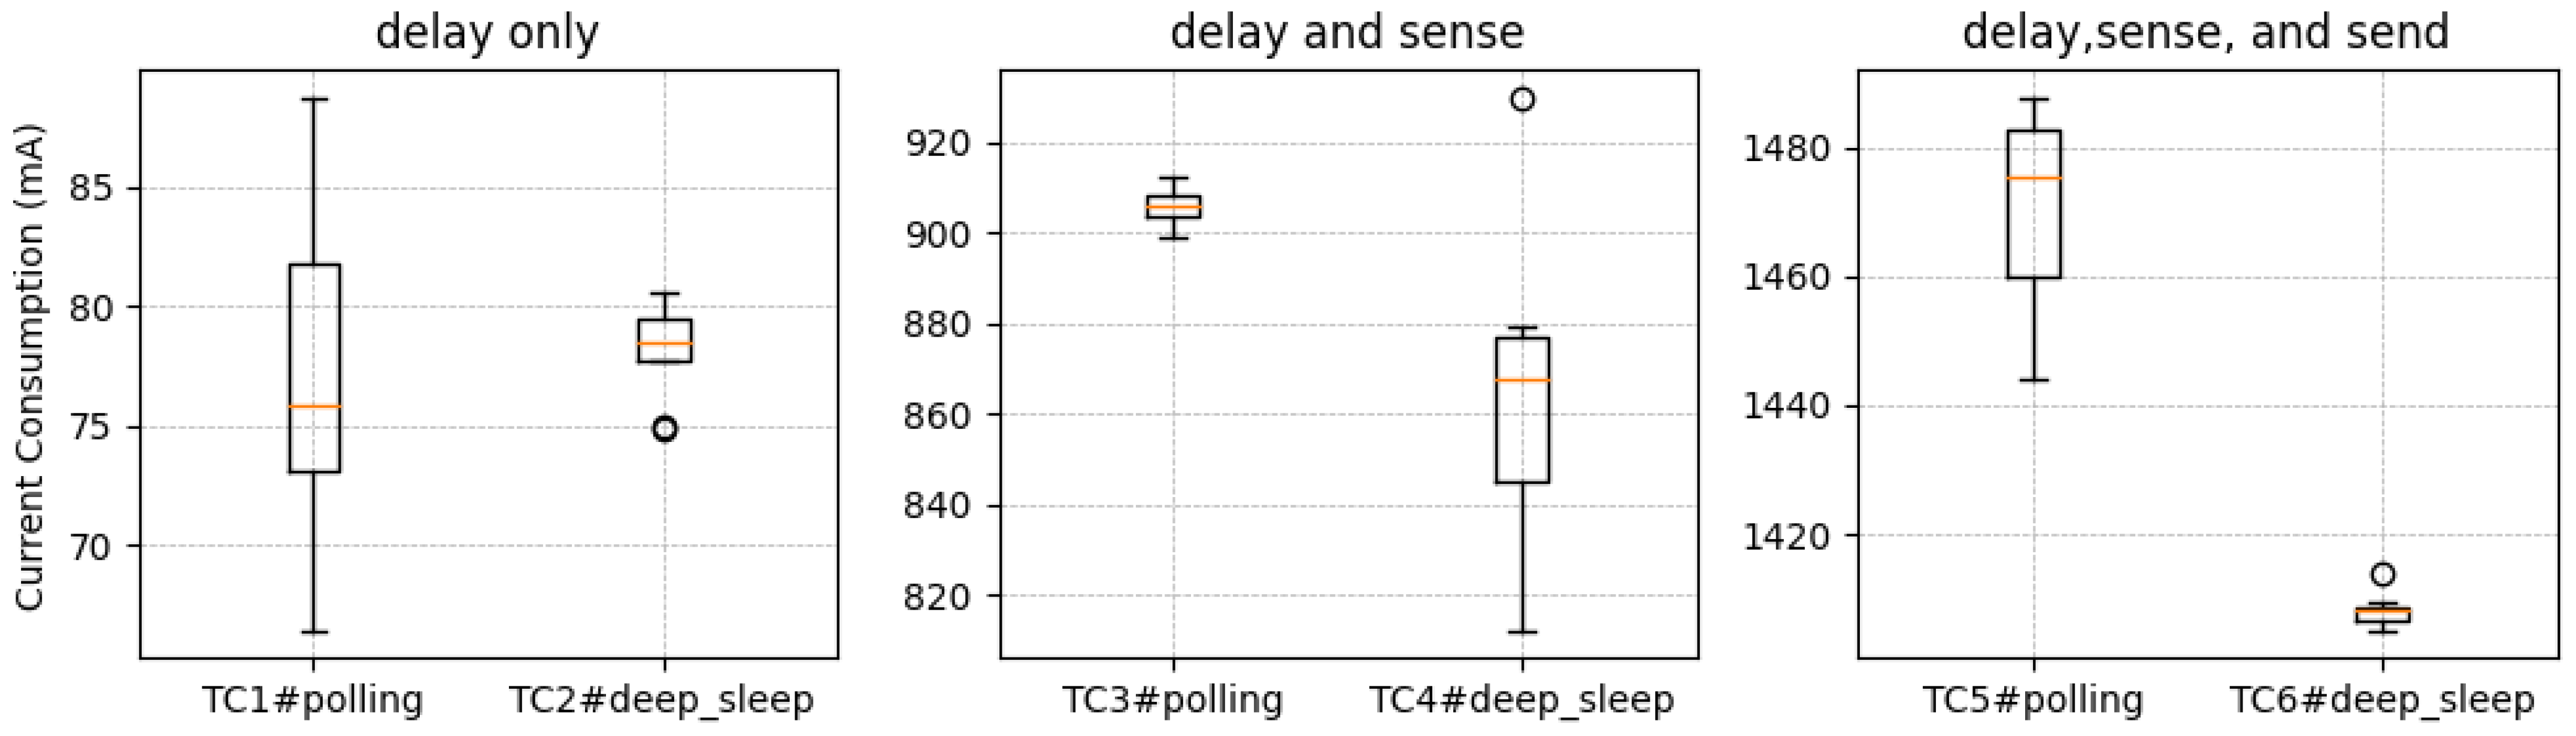
TC1 and TC2 are to compare the two delay techniques as the baseline of this experiment. TC3 and TC4 add the sense module to evaluate and compare the sensing state with the baseline. TC5 and TC6 evaluate the sending module, which is the full function of IoT devices. For each test case, the IoT devices process for 30 s per round and repeat for ten rounds.
4.1.1. The Experimental Results
The data in Table 3 are tested with the normality and Levene’s tests. We confirm that all columns are normally distributed and have equal variances. The results of the ANOVA test for all data columns (, p-value ≈ 0.00). We interpret that the extremely low p-value indicates significant differences between the means of at least some of the columns in the dataset. This suggests that the test case groups do not all have the same mean, and at least one group’s mean is significantly different.
Table 3.
The overall current consumption (mA/10 rounds) of the experiment I.
Based on the experimental results, the data in the table for each test case are normally distributed. When comparing the means of each pair, it was found that TC1 and TC2 do not differ significantly, whereas TC3 and TC4 show a significant difference. Similarly, TC5 and TC6 also exhibit a significant difference.
The boxplot in Figure 6 compares each column’s central tendency and spread in the dataset. We found that the means of each test case were consistent with the statistical testing methodology. TC1 and TC2 had the lowest values and similar means, while TC3 and TC4 had higher means, falling within the mid-range group, and showed significant differences between the pairs. This pattern was similarly observed in the TC5 and TC6 experiments.
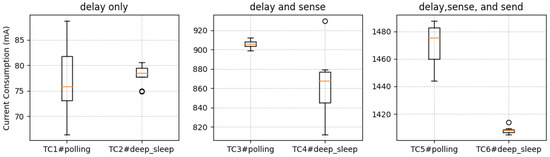
Figure 6.
Current consumption of all test cases.
4.1.2. Least Squares Analysis
We select the least squares analysis to analyze each module’s current consumption. The least squares analysis is used to find the best-fitting solution to a system of linear equations when an exact solution may not exist. It minimizes the sum of the squares of the residuals, which are the differences between the observed and predicted values. Here is the general form of the least squares analysis:
where A is an matrix of coffecient, x is an vector of unknows, and b is vector of observed values. The least squares solution is to find x that minimizes the residual sum of squares:
and the solution to this optimization problem is given by:
Based on the least squares analysis, the estimated current consumption for each module in the system is as follows: consumes approximately 51.819 mA, consumes 43.350 mA, consumes 8.469 mA, consumes 806.913 mA, and consumes 554.996 mA. These values provide a detailed breakdown of the individual module contributions to the overall consumption observed across test cases TC1 to TC6, highlighting the significant consumption levels of and compared to the other modules.
4.2. The Power Consumption in Transmission Part ()
The main objective of this experiment is to investigate and analyze the impact of delay time on the waiting period for the next cycle. In addition, this experiment aims to compare the power consumption of polling and deep sleep techniques. This experiment is designed based on the diagram shown in Figure 5, where the values of , and are fixed at 1.00 s, 0.10 s, and 1.00 s, respectively. On the other hand, the value of is varied systematically to cover a range of delay times, including 15, 30, 60, 90, 120, and 150 s. The IoT devices process 40 times per round for each test case and repeat for ten rounds.
This experiment employs two different techniques, polling and deep sleep, to simulate the delay functions. In the polling technique, the system continuously checks for the next cycle without entering sleep mode, which consumes more power. In contrast, in the deep sleep technique, the system enters a low-power sleep mode until the next cycle arrives. By comparing the power consumption of these two techniques, the experiment can determine which technique is more energy-efficient for waiting periods of varying lengths.
To ensure the reliability of the experimental results, each test case was repeated ten times. This repetition enables the average power consumption to be calculated, thereby mitigating the impact of random fluctuations in the data. Through this experiment, we aim to identify an optimal technique for power consumption minimization during idle periods, thereby contributing to the design of more energy-efficient systems. This study compares the long-term current consumption of two techniques: delay with polling and deep sleep. The results, presented as the average of accumulated current consumption, are detailed in Table 4.
Table 4.
Comparison of current consumption (A) of 40 times per round.
Table 4 provides a comparative analysis of the current consumption (in amperes) of two techniques—polling and deep sleep—across various time intervals, measured in seconds (15 s, 30 s, 60 s, 90 s, 120 s, and 150 s). Each measurement was repeated ten times to ensure reliability, and the results are presented with their means and standard deviations. For the polling technique, the average current consumption decreases from 5.92 A at 15 s to 3.83 A at 150 s, with relatively low standard deviations indicating consistent results. Similarly, the deep sleep technique shows a decrease in current consumption from 5.64 A at 15 s to 3.20 A at 150 s, though with slightly higher standard deviations, indicating more variability in the measurements. Overall, both techniques reduce current consumption over longer intervals, with the deep sleep technique generally being more energy-efficient. This analysis is crucial for optimizing energy consumption during idle periods in system design, highlighting the deep sleep technique as a potentially superior approach for minimizing power usage.
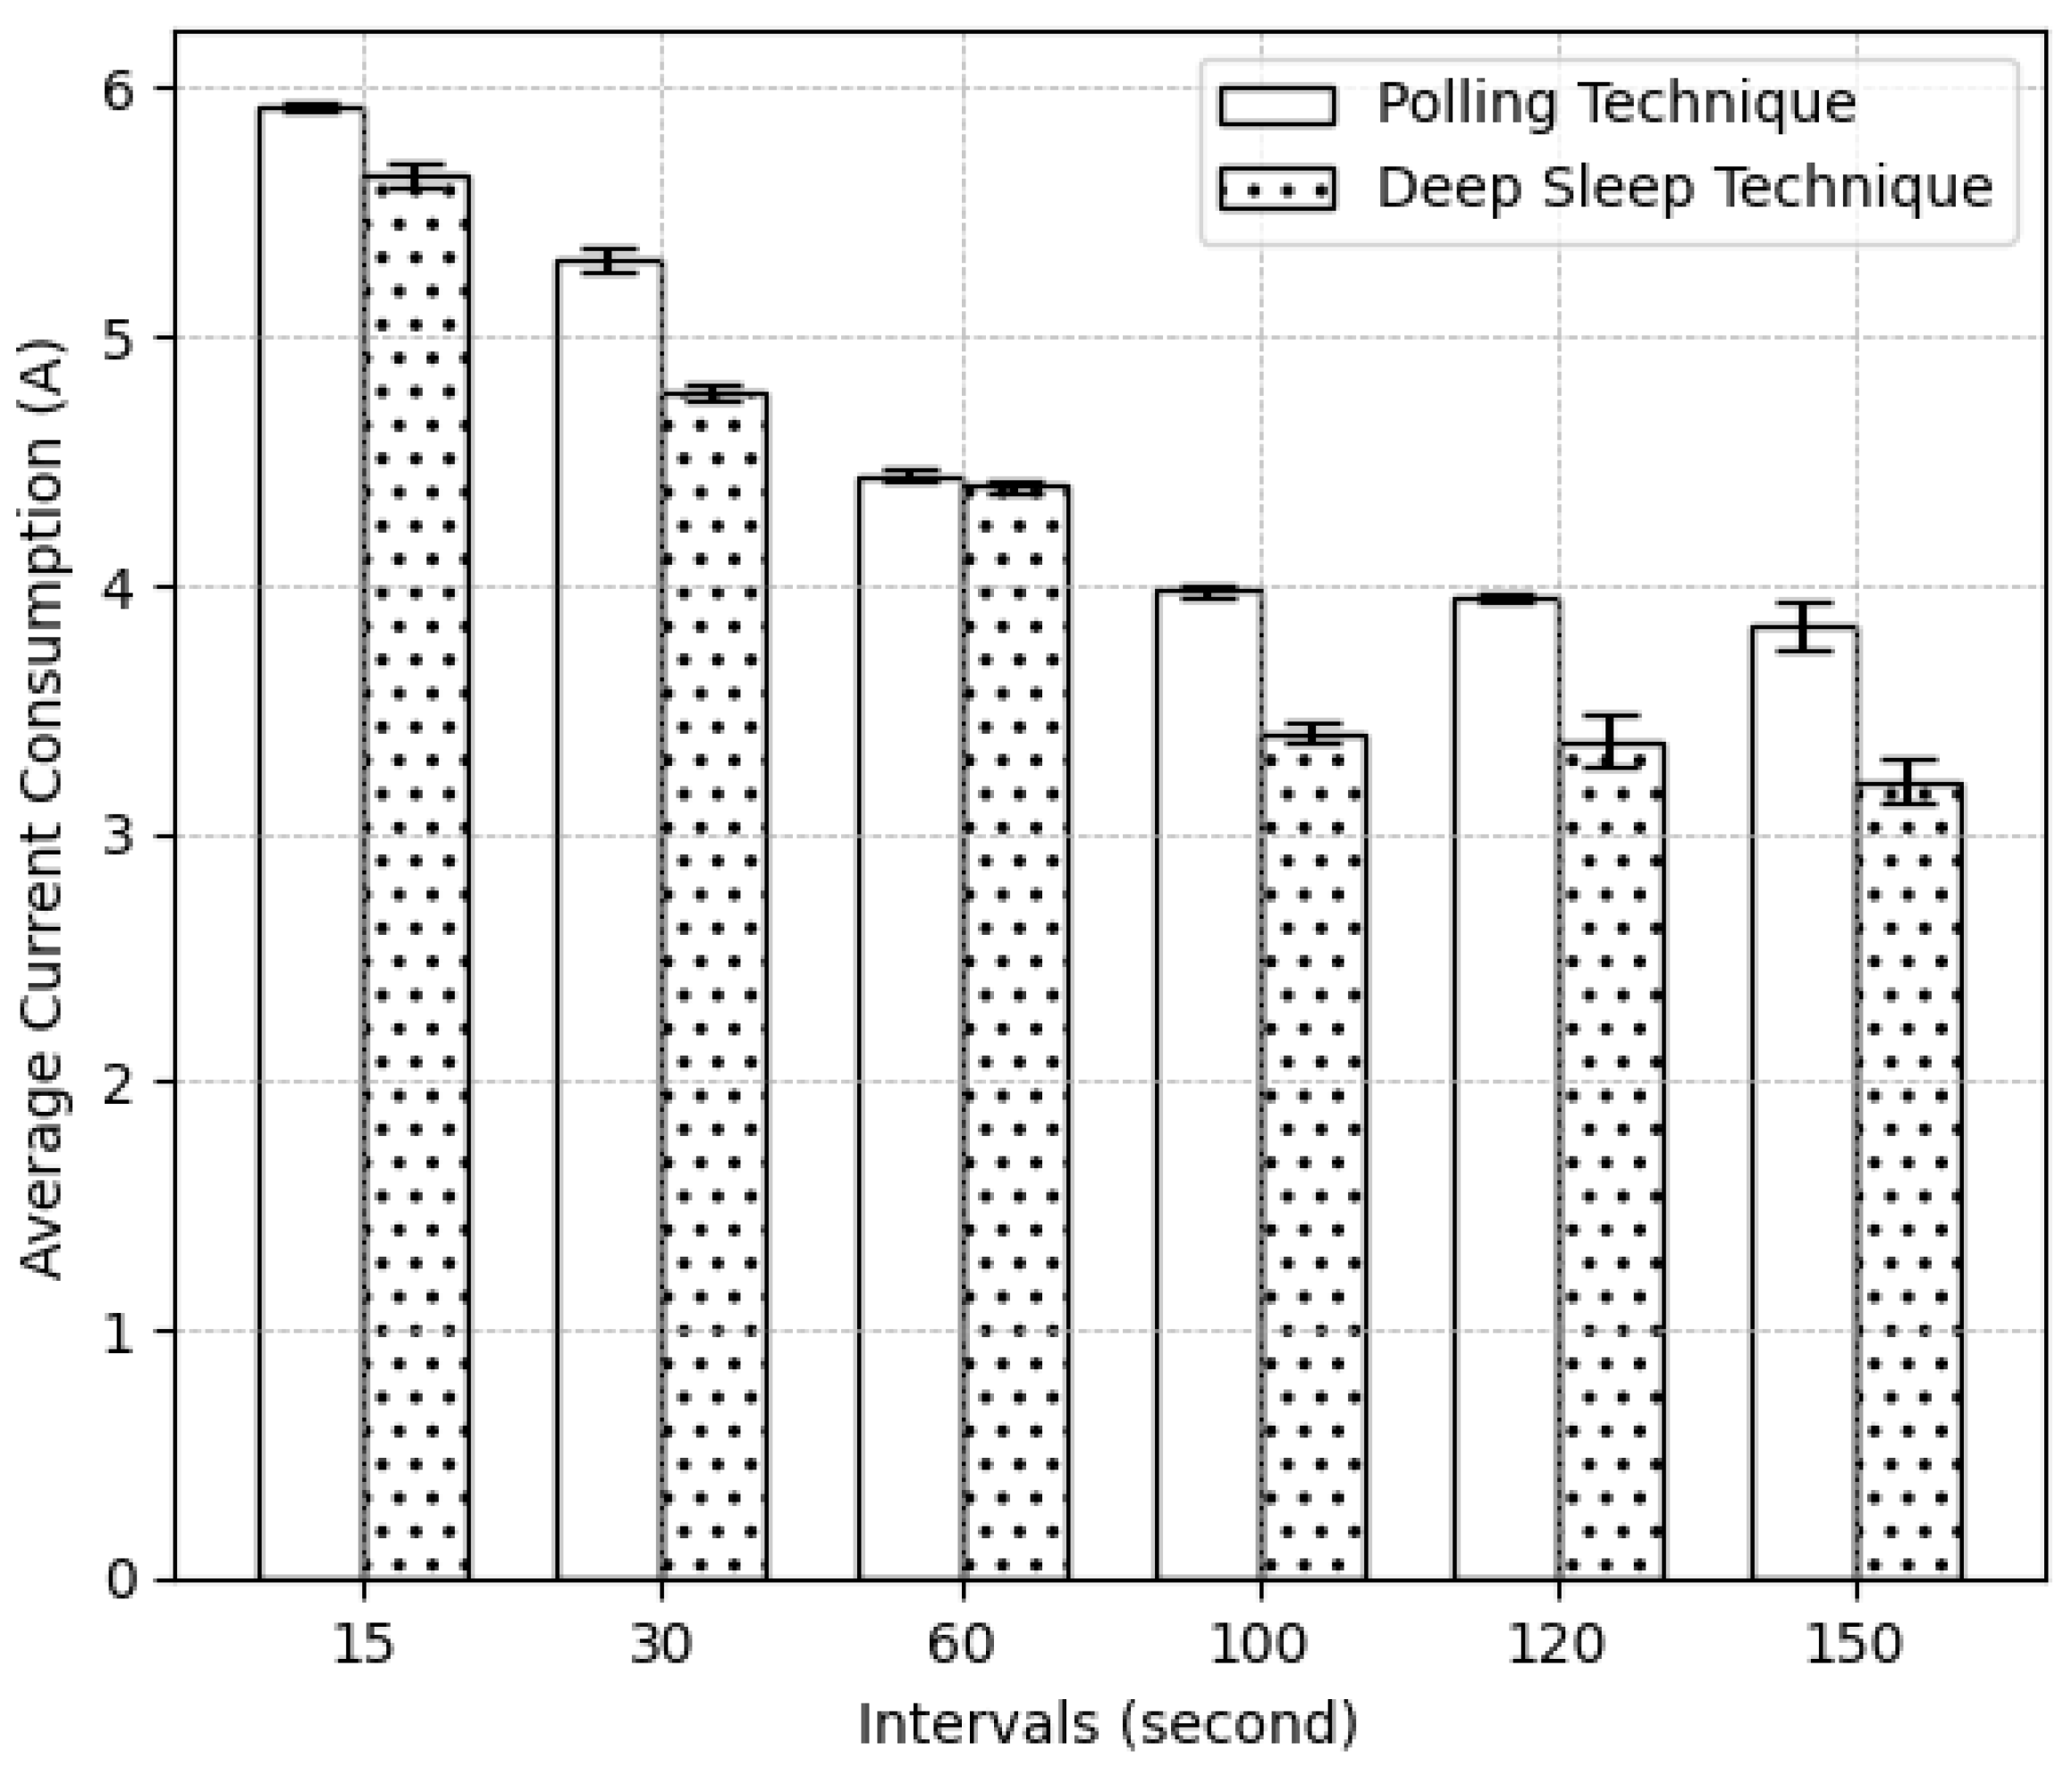
The bar chart in Figure 7 compares the average current consumption of the polling technique and the deep sleep technique across various time intervals (15, 30, 60, 100, 120, and 150 s). The polling technique consistently shows higher average current consumption, starting near 6 A at 15 s and decreasing to around 3.8 A at 150 s. In contrast, the deep sleep technique demonstrates lower average current consumption, beginning at approximately 5.6 A at 15 s (4.73%) and reducing to about 3.2 A at 150 s (16.45%). The error bars, indicating variability, are relatively small for both techniques, suggesting consistent measurements. overall, the deep sleep technique appears more energy-efficient than the polling technique.

Figure 7.
The average current consumption (A) for 40 rounds per interval.
We also confirm the experimental result in Table 4 with the statistical method. The normality tests (Shapiro–Wilk) for the polling technique () and the deep sleep technique () yielded p-values significantly less than 0.05, indicating that neither variable follows a normal distribution.
Given this non-normality, a one-tailed Mann–Whitney U test was performed to compare the distributions of the two variables. The test result showed a U statistic of 2291.0 and a p-value of 0.0050, leading to rejecting the null hypothesis. This indicates that significant evidence supports the claim that the polling technique is superior to the deep sleep technique.
4.3. The Power Estimation of the Solar Cell
This section estimates the solar cell’s power source from Table 4 given an IoT device with a current consumption of 3.20 A over 40 times. Hence, it consumes 0.08 A per time. To run an IoT device that continuously consumes 0.08 A per hour for seven days, we would need a battery with a capacity of approximately 15.81 Ah (≈20 Ah in the market). This calculation considers a total operational time of 168 h over the week and includes an efficiency factor of 0.85 to account for potential system inefficiencies.
To ensure adequate energy production for an IoT device consuming 0.08 A per hour, a solar panel with a capacity of approximately 8.53 W (≈10 W in the market) is recommended. This calculation is based on the device’s daily energy consumption of 7.104 Wh, an average of 5 sunlight hours per day, a panel efficiency of 20%, and a 20% safety margin to account for inefficiencies and variability in sunlight.
Thus, to sustain the operation of this IoT device for a full day using a 12 V battery, a step-down regulator, and a solar panel, a system incorporating a 12 Ah battery and a 10 W solar panel is required, considering 5 h of operational sunlight per day. These specifications may vary depending on the device’s location, environmental conditions, and specific power consumption profile (Figure 8).
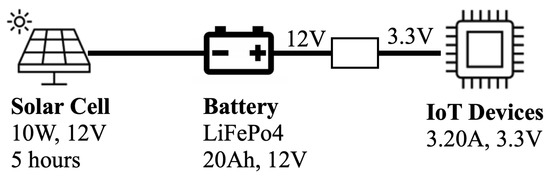
Figure 8.
The power source estimation of the proposed system.
5. Discussions
5.1. Findings and Contributions
5.1.1. Energy-Efficient IoT Monitoring System
This paper introduces a novel low-cost IoT system designed for natural disaster monitoring. This study primarily focuses on power consumption in IoT devices and proposes methods to minimize it, both in the context of microcontroller processing and network processing. The system’s architecture comprises IoT devices; all hardware components are affordable and readily available. Compared to commercial IoT solutions, the system is cost-effective. Additionally, the system utilizes a task scheduling technique that reduces power consumption, and the deep sleep delay function further reduces energy consumption. Finally, a solar cell system that powers a rechargeable battery is the power source. These features make the system an excellent low-cost solution for natural disaster monitoring.
From a hardware perspective, using a solar cell system as a power source further reduces the system’s overall cost and environmental impact. Overall, the proposed system’s simplicity, affordability, and energy efficiency make it a promising solution for natural disaster monitoring in resource-limited settings. Choosing appropriate hardware is crucial in reducing energy consumption and extending the lifetime of IoT devices. Even if hardware options are limited, implementing effective task scheduling and delay techniques can still help reduce power consumption. However, these techniques are just the beginning of power-aware design.
The choice of low-power microcontrollers, sensors, and transmission devices can also significantly impact overall power consumption. The batteries selected must be both easily accessible and cost-effective within the local market. In addition to hardware, software-level solutions such as low-power real-time operating systems, task and transmission scheduling algorithms, and power management techniques can further reduce power consumption and extend the lifetime of IoT devices.
5.1.2. Affordable IoT Solution Challenges
Understanding the current challenges in implementing IoT solutions in the natural disaster monitoring domain is crucial for further discussing the significance of the proposed system. Typically, such systems require expensive and complicated hardware that is difficult to maintain, especially in harsh environmental conditions. In contrast, the proposed system uses affordable and readily available hardware that is robust enough to withstand harsh environmental conditions. Furthermore, the system’s task scheduling technique, coupled with the deep sleep delay function, significantly reduces power consumption, thus making it an energy-efficient solution.
5.1.3. The Adaptive Task Scheduling for Efficiency
This study highlights the importance of wireless transmission modules in power consumption, but it does not consider the presence of sensor modules. The energy requirements of sensor modules significantly influence overall power consumption. Efficient task scheduling is crucial for reducing power consumption in IoT devices, as it minimizes idle time and optimizes task execution. In disaster monitoring systems, a balance must be achieved between real-time data availability and power consumption efficiency. Frequent transmission intervals require more energy, while extended intervals reduce power consumption and prolong battery life. The interval choice should be tailored to the specific application, with longer intervals being more appropriate during steady periods. Adaptive task scheduling dynamically adjusts transmission intervals based on the situation’s urgency, ensuring the system remains responsive and energy-efficient, extending the device’s lifespan. Longer transmission intervals substantially reduce power consumption, with deep sleep being the most energy-efficient solution. In disaster monitoring, extended time intervals may be deemed appropriate during stable periods when quick updates are not necessary. An adaptive scheduling system can close this disparity by modifying transmission intervals according to the monitored event’s urgency level. During disasters, when real-time data are crucial, shorter intervals may be used, whereas longer intervals may be used during periods of stability to maximize energy conservation.
5.1.4. CPU and Memory Usage
This paper does not explicitly evaluate the CPU and memory usage in ESP8266. The CPU and memory usage in the ESP8266 are analyzed, revealing significant variations between active and sleep modes, which directly affect power consumption. The CPU is at its maximum capacity, managing tasks with Wi-Fi enabled, consumes approximately 80–100 mA of power in active mode. In sleep modes, the CPU either decreases activity or shuts down to conserve energy. The Wi-Fi module is also shut down while the CPU is still operational. During deep sleep, the CPU shuts down, consuming only 10–20 A, and performs with limited performance until it resumes operation.
Due to its constrained 4 KB flash memory and 64 KB RAM, optimal memory management is crucial for the ESP8266 to prevent performance bottlenecks, memory overflow, and system crashes. Excessive RAM utilization leads to higher power consumption due to frequent memory access. Deep sleep mode facilitates energy conservation, but crucial data must be saved in non-volatile memory or transferred to the cloud before sleep. The balancing of CPU and memory usage and energy efficiency needs to be deeply experimented with and discussed in future work.
5.2. Limitations
We proposed, implemented, and demonstrated the low-cost IoT system for natural disaster monitoring. In addition, we studied energy consumption in delayed function using polling and deep sleep techniques. However, our work was designed and experimented under the following limitations: (1) None of the hardware and sensors are low-power devices, so the results are not the least-power-consumption solution. (2) We evaluated the overall power consumption, which cannot show the power consumption of each sensor or each state. This results in the inability to show and discuss a profound result. (3) The wireless module is Wi-Fi and connects to the 3G access point. The power source of the 3G access point is outside the experiment. Thus, the power consumption does not cover the 3G access point.
5.3. Open Issues
In crises, effective power consumption management is crucial for IoT devices. Power and network transmission are key factors affecting such devices’ functionalities and lifetimes. While these systems may function normally in pre-disaster phases, their effectiveness can be reduced during the disaster and recovery. To prevent such issues, IoT systems must be designed to function normally, even under low resources, such as bandwidth, power, or damaged sensor nodes. Adaptive task scheduling is a potential solution to extend power consumption. As highlighted in this research, 50% of power consumption comes from the sensing module and 40% from network transmission. Therefore, task scheduling should be dynamically adjusted based on the current situation. A low-power dynamic routing algorithm in wireless sensor networks can also help extend the sensor network’s reach when the routing node fails. These concepts must be thoroughly studied and implemented to ensure practical application and sustainability in real-world scenarios.
6. Conclusions
This study introduces a cost-effective IoT-based disaster monitoring system emphasizing the minimization of power consumption. The system employs affordable hardware components, such as the ESP8266 microcontroller, and utilizes solar power for efficient monitoring. Our task scheduling algorithm, which incorporates polling and deep sleep techniques, significantly reduces power consumption, extending IoT devices’ operational life through strategic management. This study optimizes energy consumption during the sensing and transmission phases, demonstrating a balance between performance and power efficiency through methodical scheduling and energy-efficient delay techniques.
This study found promising results but identified several limitations. These include the constraints posed by energy-efficient hardware and sensors, the inability to isolate individual sensor or state power consumption, and the exclusion of the 3G access point power consumption from the analysis. Despite these limitations, the system’s resilience and efficiency in crisis scenarios highlight the need for further exploration of adaptive task scheduling and dynamic routing algorithms to overcome resource limitations.
The proposed low-cost IoT system for disaster monitoring represents a significant advancement towards developing sustainable, energy-efficient solutions for real-time environmental monitoring. Integrating affordable hardware, solar power, and advanced task scheduling algorithms provides a robust framework that can be further refined and expanded to meet the demands of diverse disaster monitoring applications.
The findings of this study underscore the critical importance of energy-aware design in IoT systems. By demonstrating how strategic task scheduling and energy-efficient techniques can extend the operational life of IoT devices, this research paves the way for future innovations in this vital area. The proposed system offers a practical solution for current disaster monitoring challenges and sets the stage for future advancements in sustainable IoT technology.
Further research is recommended to address the identified limitations, particularly in enhancing the precision of power consumption measurements and integrating more sophisticated adaptive scheduling algorithms. By continuing to refine and expand upon this framework, future studies can contribute to developing even more efficient and resilient IoT-based disaster monitoring systems, ultimately improving our ability to respond to and manage environmental crises.
Author Contributions
Conceptualization, C.J. and S.S.; methodology, C.J. and S.S.; software, C.J. and S.S.; validation, J.K., P.K. and M.T.; formal analysis, C.J. and P.K.; investigation, J.K.; resources, J.K.; data curation, C.J.; writing—original draft preparation, C.J.; writing—review and editing, S.S. and M.T.; visualization, J.K.; supervision, C.J.; project administration, S.S.; funding acquisition, C.J. All authors have read and agreed to the published version of the manuscript.
Funding
This research was funded by Walailak University’s individual research grant (grant number WU66254).
Data Availability Statement
The raw data supporting the conclusions of this article will be made available by the authors on request.
Conflicts of Interest
The authors declare no conflicts of interest.
References
- Dalvi, S.A.; Shaikh, D. Internet of Things for Smart Cities. Imp. J. Interdiscip. Res. 2017, 3, 947–951. [Google Scholar]
- Ding, Z.; Jiang, S.; Xu, X.; Han, Y. An Internet of Things based scalable framework for disaster data management. J. Saf. Sci. Resil. 2022, 3, 136–152. [Google Scholar] [CrossRef]
- Kiani, F.; Seyyedabbasi, A. Wireless Sensor Network and Internet of Things in Precision Agriculture. Int. J. Adv. Comput. Sci. Appl. 2018, 9. [Google Scholar] [CrossRef]
- Majid, M.; Habib, S.; Javed, A.R.; Rizwan, M.; Srivastava, G.; Gadekallu, T.R.; Lin, J.C.W. Applications of Wireless Sensor Networks and Internet of Things Frameworks in the Industry Revolution 4.0: A Systematic Literature Review. Sensors 2022, 22, 2087. [Google Scholar] [CrossRef]
- Baccelli, E.; Hahm, O.; Gunes, M.; Wahlisch, M.; Schmidt, T. RIOT OS: Towards an OS for the Internet of Things. In Proceedings of the 2013 IEEE Conference on Computer Communications Workshops (INFOCOM WKSHPS), Turin, Italy, 14–19 April 2013; pp. 79–80. [Google Scholar] [CrossRef]
- Sinha, A.; Kumar, P.; Rana, N.P.; Islam, R.; Dwivedi, Y.K. Impact of internet of things (IoT) in disaster management: A task-technology fit perspective. Ann. Oper. Res. 2019, 283, 759–794. [Google Scholar] [CrossRef]
- Zhou, H.Y.; Luo, D.Y.; Gao, Y.; Zuo, D.C. Modeling of Node Energy Consumption for Wireless Sensor Networks. Wirel. Sens. Netw. 2011, 3, 18–23. [Google Scholar] [CrossRef]
- Shelby, Z.; Hartke, K.; Bormann, C. The Constrained Application Protocol (CoAP); RFC 7252; 2014; pp. 1–112. Available online: https://www.rfc-editor.org/rfc/rfc7252.html (accessed on 30 August 2024).
- Akintade, O.O.; Yesufu, T.K.; Kehinde, L.O. Development of Power Consumption Models for ESP8266-Enabled Low-Cost IoT Monitoring Nodes. Adv. Internet Things 2019, 9, 90552. [Google Scholar] [CrossRef]
- Fette, I.; Melnikov, A. RFC 6455: The WebSocket Protocol; RFC Editor; 2011. Available online: https://www.rfc-editor.org/rfc/rfc6455.html (accessed on 30 August 2024).
- Xiong, W.; Guo, B.; Yan, S. Energy consumption optimization of processor scheduling for real-time embedded systems under the constraints of sequential relationship and reliability. Alex. Eng. J. 2022, 61, 73–80. [Google Scholar] [CrossRef]
- Yu, H.; Chin, K.W. Learning Algorithms for Data Collection in RF-Charging IIoT Networks. IEEE Trans. Ind. Inform. 2023, 19, 88–97. [Google Scholar] [CrossRef]
- Zhang, W.; Xie, M.; Scott, C.; Pan, C. Sparsity-Aware Intelligent Spatiotemporal Data Sensing for Energy Harvesting IoT System. IEEE Trans. Comput.-Aided Des. Integr. Circuits Syst. 2022, 41, 4492–4503. [Google Scholar] [CrossRef]
- Sangaiah, A.K.; Javadpour, A.; Ja’fari, F.; Zavieh, H.; Khaniabadi, S.M. SALA-IoT: Self-Reduced Internet of Things with Learning Automaton Sleep Scheduling Algorithm. IEEE Sens. J. 2023, 23, 20737–20744. [Google Scholar] [CrossRef]
- Al-Hawawreh, M.; Elgendi, I.; Munasinghe, K. An Online Model to Minimize Energy Consumption of IoT Sensors in Smart Cities. IEEE Sens. J. 2022, 22, 19524–19532. [Google Scholar] [CrossRef]
- Rodriguez-Pabon, C.; Riva, G.G.; Zerbini, C.; Ruiz-Rosero, J.; Ramirez-Gonzalez, G.; Corrales, J.C. An Adaptive Sampling Period Approach for Management of IoT Energy Consumption: Case Study Approach. Sensors 2022, 22, 1472. [Google Scholar] [CrossRef]
- Sharma, K.; Anand, D.; Sabharwal, M.; Tiwari, P.K.; Cheikhrouhou, O.; Frikha, T. A Disaster Management Framework Using Internet of Things-Based Interconnected Devices. Math. Probl. Eng. 2020, 2021, 9916440. [Google Scholar] [CrossRef]
- Syam, M.S.; Luo, S.; Che, Y.L.; Wu, K.; Leung, V.C.M. Energy-Efficient Intelligent Reflecting Surface Aided Wireless-Powered IIoT Networks. IEEE Syst. J. 2023, 17, 2534–2545. [Google Scholar] [CrossRef]
- Rahamathunnisa, U.; Vivekanand, C.V.; Kiran, V.; Rajendiran, M. Energy-Efficient Communication Protocols for IoT Devices. In Proceedings of the 2024 Ninth International Conference on Science Technology Engineering and Mathematics (ICONSTEM), Chennai, India, 4–5 April 2024; pp. 1–5. [Google Scholar] [CrossRef]
- Alzahrani, S.; Salh, A.; Audah, L.; Alhartomi, M.A.; Alotaibi, A.; Alsulami, R. Empowering Energy-Sustainable IoT Devices With Harvest Energy-Optimized Deep Neural Networks. IEEE Access 2024, 12, 70600–70614. [Google Scholar] [CrossRef]
- Aldin, H.N.S.; Ghods, M.R.; Nayebipour, F.; Torshiz, M.N. A comprehensive review of energy harvesting and routing strategies for IoT sensors sustainability and communication technology. Sens. Int. 2023, 5, 100258. [Google Scholar] [CrossRef]
- Donta, P.K.; Srirama, S.N.; Amgoth, T.; Annavarapu, C.S.R. Survey on recent advances in IoT application layer protocols and machine learning scope for research directions. Digit. Commun. Netw. 2022, 8, 727–744. [Google Scholar] [CrossRef]
- Li, T.; Liu, Y.; Tian, Y.; Shen, S.; Mao, W. A Storage Solution for Massive IoT Data Based on NoSQL. In Proceedings of the 2012 IEEE International Conference on Green Computing and Communications, Besancon, France, 20–23 November 2012; pp. 50–57. [Google Scholar] [CrossRef]
- Musonda, S.K.; Ndiaye, M.; Libati, H.M.; Abu-Mahfouz, A.M. Reliability of LoRaWAN Communications in Mining Environments: A Survey on Challenges and Design Requirements. J. Sens. Actuator Netw. 2024, 13, 16. [Google Scholar] [CrossRef]
- Malik, S. Data-Driven Decision-Making: Leveraging the IoT for Real-Time Sustainability in Organizational Behavior. Sustainability 2024, 16, 6302. [Google Scholar] [CrossRef]
- Wang, F.; Yuan, H. Challenges of the Sensor Web for disaster management. Int. J. Digit. Earth 2010, 3, 260–279. [Google Scholar] [CrossRef]
- Martinez, B.; Monton, M.; Vilajosana, I.; Prades, J.D. The Power of Models: Modeling Power Consumption for IoT Devices. IEEE Sens. J. 2015, 15, 5777–5789. [Google Scholar] [CrossRef]
- Qin, W.; Hempstead, M.; Woodward, Y. A realistic power consumption model for wireless sensor network devices. In Proceedings of the 2006 3rd Annual IEEE Communications Society on Sensor and ad Hoc Communications and Networks, Reston, VA, USA, 25–28 September 2006; Volume 1, pp. 286–295. [Google Scholar] [CrossRef]
- Ray, P.P.; Mukherjee, M.; Shu, L. Internet of Things for Disaster Management: State-of-the-Art and Prospects. IEEE Access 2017, 5, 18818–18835. [Google Scholar] [CrossRef]
- Henkel, J.; Pagani, S.; Amrouch, H.; Bauer, L.; Samie, F. Ultra-low power and dependability for IoT devices (Invited paper for IoT technologies). In Proceedings of the Design, Automation & Test in Europe Conference & Exhibition (DATE), Lausanne, Switzerland, 27–31 March 2017; pp. 954–959. [Google Scholar] [CrossRef]
- Randhawa, R.H.; Ahmed, A.; Siddiqui, M.I. Power Management Techniques in Popular Operating Systems for IoT Devices. In Proceedings of the 2018 International Conference on Frontiers of Information Technology (FIT), Islamabad, Pakistan, 17–19 December 2018; pp. 309–314. [Google Scholar] [CrossRef]
- Abbad, L.; Nacer, A.; Abbad, H.; Brahim, M.T.; Zioui, N. A weighted Markov-clustering routing protocol for optimizing energy use in wireless sensor networks. Egypt. Inform. J. 2022, 23, 483–497. [Google Scholar] [CrossRef]
- Al-Turjman, F. Cognitive routing protocol for disaster-inspired Internet of Things. Future Gener. Comput. Syst. 2019, 92, 1103–1115. [Google Scholar] [CrossRef]
- Elshrkawey, M.; Elsherif, S.M.; Wahed, M.E. An Enhancement Approach for Reducing the Energy Consumption in Wireless Sensor Networks. J. King Saud Univ.-Comput. Inf. Sci. 2018, 30, 259–267. [Google Scholar] [CrossRef]
- Lee, C.; Kim, S.L. Most Efficient Sensor Network Protocol for a Permanent Natural Disaster Monitoring System. IEEE Internet Things J. 2021, 8, 11776–11792. [Google Scholar] [CrossRef]
- Salam, A. Internet of Things in Sustainable Energy Systems. In Internet of Things; Springer: Berlin/Heidelberg, Germany, 2020; pp. 183–216. [Google Scholar] [CrossRef]
- Heidari, H.; Onireti, O.; Das, R.; Imran, M. Energy Harvesting and Power Management for IoT Devices in the 5G Era. IEEE Commun. Mag. 2021, 59, 91–97. [Google Scholar] [CrossRef]
- Liu, X.; Zhu, R.; Anjum, A.; Wang, J.; Zhang, H.; Ma, M. Intelligent data fusion algorithm based on hybrid delay-aware adaptive clustering in wireless sensor networks. Future Gener. Comput. Syst. 2020, 104, 1–14. [Google Scholar] [CrossRef]
- Wang, Y.; Chen, C.; Wang, J.; Baldick, R. Research on Resilience of Power Systems Under Natural Disasters—A Review. IEEE Trans. Power Syst. 2016, 31, 1604–1613. [Google Scholar] [CrossRef]
- Zhang, W.; Fang, W.; Zhao, Q.; Ji, X.; Jia, G. Energy Efficiency in Internet of Things: An Overview. Comput. Mater. Contin. 2020, 63, 787–811. [Google Scholar]
- Kang, J.; Adibi, S. Bushfire Disaster Monitoring System Using Low Power Wide Area Networks (LPWAN). Technologies 2017, 5, 65. [Google Scholar] [CrossRef]
- Gao, K.; Huang, Y.; Sadollah, A.; Wang, L. A review of energy-efficient scheduling in intelligent production systems. Complex Intell. Syst. 2020, 6, 237–249. [Google Scholar] [CrossRef]


Disclaimer/Publisher’s Note: The statements, opinions and data contained in all publications are solely those of the individual author(s) and contributor(s) and not of MDPI and/or the editor(s). MDPI and/or the editor(s) disclaim responsibility for any injury to people or property resulting from any ideas, methods, instructions or products referred to in the content. |
© 2024 by the authors. Licensee MDPI, Basel, Switzerland. This article is an open access article distributed under the terms and conditions of the Creative Commons Attribution (CC BY) license (https://creativecommons.org/licenses/by/4.0/).