Article

An Intelligent Water Level Estimation System Considering Water Level Device Gauge Image Recognition and Wireless Sensor Networks

1
Graduate School of Science and Engineering, Okayama University of Science, 1-1 Ridaicho, Kita-ku, Okayama City 700-0005, Japan
2
Department of Information and Computer Engineering, Okayama University of Science, 1-1 Ridaicho, Kita-ku, Okayama City 700-0005, Japan
3
Department of Biosphere-Geosphere Science, Okayama University of Science, 1-1 Ridaicho, Kita-ku, Okayama City 700-0005, Japan
4
Department of Information Science and Engineering, Okayama University of Science, 1-1 Ridaicho, Kita-ku, Okayama City 700-0005, Japan
5
Department of Information and Communication Engineering, Fukuoka Institute of Technology, 3-30-1, Washirohigashi, Higashi-ku, Fukuoka City 811-0295, Japan
*
Author to whom correspondence should be addressed.
J. Sens. Actuator Netw. 2025, 14(1), 13; https://doi.org/10.3390/jsan14010013
Submission received: 4 December 2024 / Revised: 24 January 2025 / Accepted: 27 January 2025 / Published: 30 January 2025

Abstract

:
The control of water levels in various environments is very important for predicting flooding and mitigating flood damages. Generally, water level device gauges are used to measure water levels, but the structural setting of reservoirs presents significant challenges for the installation of water level device gauges. Therefore, the solution to this problem is to apply image recognition methods using water level device gauges. In this paper, we present an intelligent water level estimation system considering water level device gauge image recognition and a Wireless Sensor Network (WSN). We carried out experiments in a water reservoir to evaluate the proposed system. From the experimental results, we found that the proposed system can estimate the water level via the object recognition of numbers and symbols on the water level device gauge.

1. Introduction

In recent years, heavy rainfall disasters have become more severe and more frequent, resulting in an increasing number of large-scale river disasters such as floods and landslides into rivers. Therefore, disaster countermeasures are being considered, providing information such as river conditions and disaster and evacuation information. Also, by using live camera feeds, rivers can be monitored and disaster information such as flood forecasting and water level detection can be obtained. Additionally, river administrators should manage various river monitoring facilities such as water level device gauges and soil moisture gauges on the water surface of rivers and on the slopes of embankments to measure river water levels and monitor embankments.
For the monitoring of second-class rivers, there is not only the lack of river monitoring equipment, but also a high risk of delays in providing river information in the event of disasters such as sudden torrential rains, especially with small- and medium-sized rivers, due to the rapid rate at which the water level rises. Even the first-class rivers that have already-considered disaster countermeasures face the problem of damaged river monitoring equipment during disasters, making it difficult to continously provide river information. Therefore, for further disaster prevention and mitigation, it is an urgent issue to provide continuous river information, monitoring rivers to enable the prediction and detection of large-scale disasters.
Recently, global warming and other factors have been causing extreme weather situations. The increasing frequency and severity of extreme weather events is acknowledged as a global problem of significant concern to people’s lives. Natural disasters such as floods and landslides caused by heavy rainfall are increasing in frequency and severity and have become a major global problem. According to the World Disasters Report 2022 [1], floods comprised 46 [%] of all types of natural disasters during 10 years. In Japan, the local and national governments have installed floodgate stations and water level device gauges along rivers to monitor water levels and support evacuation decisions. However, monitoring systems are often insufficient in municipally managed branch rivers, leading to inadequate information for effective disaster response. Furthermore, water reservoirs have a variety of uses, including purification, industrial, agricultural and fire protection. In many cases, water reservoirs are located outdoors. Therefore, water levels fluctuate under the influence of weather conditions. Monitoring water levels is critical to predict potential overflows and mitigate flood damage.
In existing water level monitoring, flow monitoring systems, embankment monitoring systems, meteorological monitoring systems and other approaches have been proposed and operated [2,3,4,5]. The flow monitoring systems measure river flows in upstream areas and are used to predict water levels in downstream areas. They are also used to measure the turbidity of rivers for predicting water levels, as river turbidity increases after the rainfall. Embankment monitoring systems are used for detecting the overtopping of embankments due to rising water levels caused by heavy rainfall, as well as for detecting the occurrence of flood damage such as embankment breaches during river flooding. Meteorological monitoring systems are used to monitor meteorological conditions and predict rainfall. Each monitoring approach is useful for monitoring water levels, but may be delayed when all the approaches are used together.
To solve this problem, a river monitoring system is required to reduce the burden on river administrators. The monitoring system can continuously obtain and provide information on river conditions, disasters and evacuations by monitoring, predicting and detecting disasters during large-scale river disasters [6,7,8].
The Internet of Things (IoT) [9,10] approach is very useful for river monitoring since it uses different devices such as sensors, actors and cameras to obtain and provide information via the Internet. In addition, the application of Artificial Intelligence (AI) for river monitoring can improve the efficiency of river monitoring and enable the prediction and detection of river disasters [11,12,13].
In this paper, we present an image recognition system for a water level device gauge. The proposed system can prevent accidents related to water level estimation and assist in reducing the burden on the administrator. In the proposed system, sensor nodes are set up around the water reservoir. The sensor nodes obtain video images using cameras and measure the water level by object recognition based on YOLOv5. We carried out many experiments to evaluate the performance of the proposed system and to demonstrate its effectiveness.
This paper is structured as follows. The related work is presented in Section 2. In Section 3, we present the implemented water level system for estimating water levels using image recognition in the water level device gauge. In Section 4, we discuss the experimental results. Finally, in Section 6, we conclude the paper.

2. Related Works

In this section, we discuss related works. In our research work, we consider Wireless Sensor Networks (WSNs) as a type of IoT, which use cameras mounted on sensor nodes deployed in water reservoirs and rivers. The WSNs collect images of the water level device gauge and measure the water level by reading the printed scale. Therefore, we describe WSNs for object recognition with a focus on text and numbers and for obtain environmental data on rivers and water areas. Then, we present the integration of AI and WSNs.
First, we will discuss object recognition methods as a type of AI relating to text and number recognition. In the field of text and numbers recognition, deep learning-based methods can achieve accurate text detection and recognition in a variety of scenarios. In segmentation-based text recognition, a Differentiable Binarization (DB) module has been proposed that can simplify the final processing of the binarization required for recognition, as well as improve the performance of text detection [14]. A transformer-based method for scene text recognition, such as object labels and road signs, has also been proposed and shows good performance on several benchmark datasets  [15]. Another research considers vision transformers for speed and computational efficiency, emphasizing mobile machines that are limited by power and other constraints  [16]. For number recognition, some methods combine Convolutional Neural Networks (CNNs) and Generative Adversarial Networks (GANs) that read vehicle license plates to prevent misidentification and identify plate numbers  [17]. In addition, improved Convolutional Recurrent Neural Networks (CRNNs) with an attention mechanism, intended for use with fixed cameras, have been proposed and show good performance in Optical Character Recognition (OCR) tasks [18].
Next, we discuss WSNs used for obtaining environmental data on rivers and water areas. WSNs have an important role in the monitoring and management of water resources. For monitoring water resources, a system that estimates soil moisture based on WSNs is proposed, which contributes to the scheduling of freshwater resources in small watersheds [19]. WSNs can monitor water quality in coastal areas and detect water quality that does not meet the requirements for use by plants and animals [20]. Also, for water quality control in rivers and wetlands, a real-time monitoring system was proposed that determines water pH levels, total dissolved solids and the dielectric constant to prevent water pollution [21]. In addition, developing WSNs based on low-cost ultrasonic water level sensors has significantly reduced the cost of flood warnings to residents and watershed management [22]. In [23], the authors enabled the continuous operation of a WSN by optimizing data transfer for data collection and energy harvesting to ensure that the energy of the entire system is not depleted.
Finally, we discuss the integration of AI and WSNs. To simulate and inform people about the wide variety of floods in mountain basins, one study combined support vector machines and WSNs [24]. In another study, in order to detect anomalies in water quality that cannot be detected manually, multivariate deep learning techniques were applied to a large amount of time-series data collected by WSNs  [25]. In addition, to understand the overall condition of the river, a system was developed that uses a machine learning-based classification of the data obtained from the WSN to create a map showing the level of pollution in the river [26]. Furthermore, another study combined the changes in water quality obtained from the WSN with a spatial weights matrix to analyze the spatial relationships between monitoring areas and a neural network [27], which was used to predict key areas to maximize the monitoring coverage of water bodies. Also, in [28], an intelligent WSN monitoring system was proposed to build a framework for water quality monitoring.
The research on AI and WSN-based water level measurement can be used in a wide range of areas from disaster prevention to the economy, such as evacuation from river flooding caused by natural disasters and the management of water resources to support human life.

3. Proposed System

In this section, we present a system for water level estimation based on the object recognition of the numbers and symbols indicating the water level and scale on a water level device gauge.

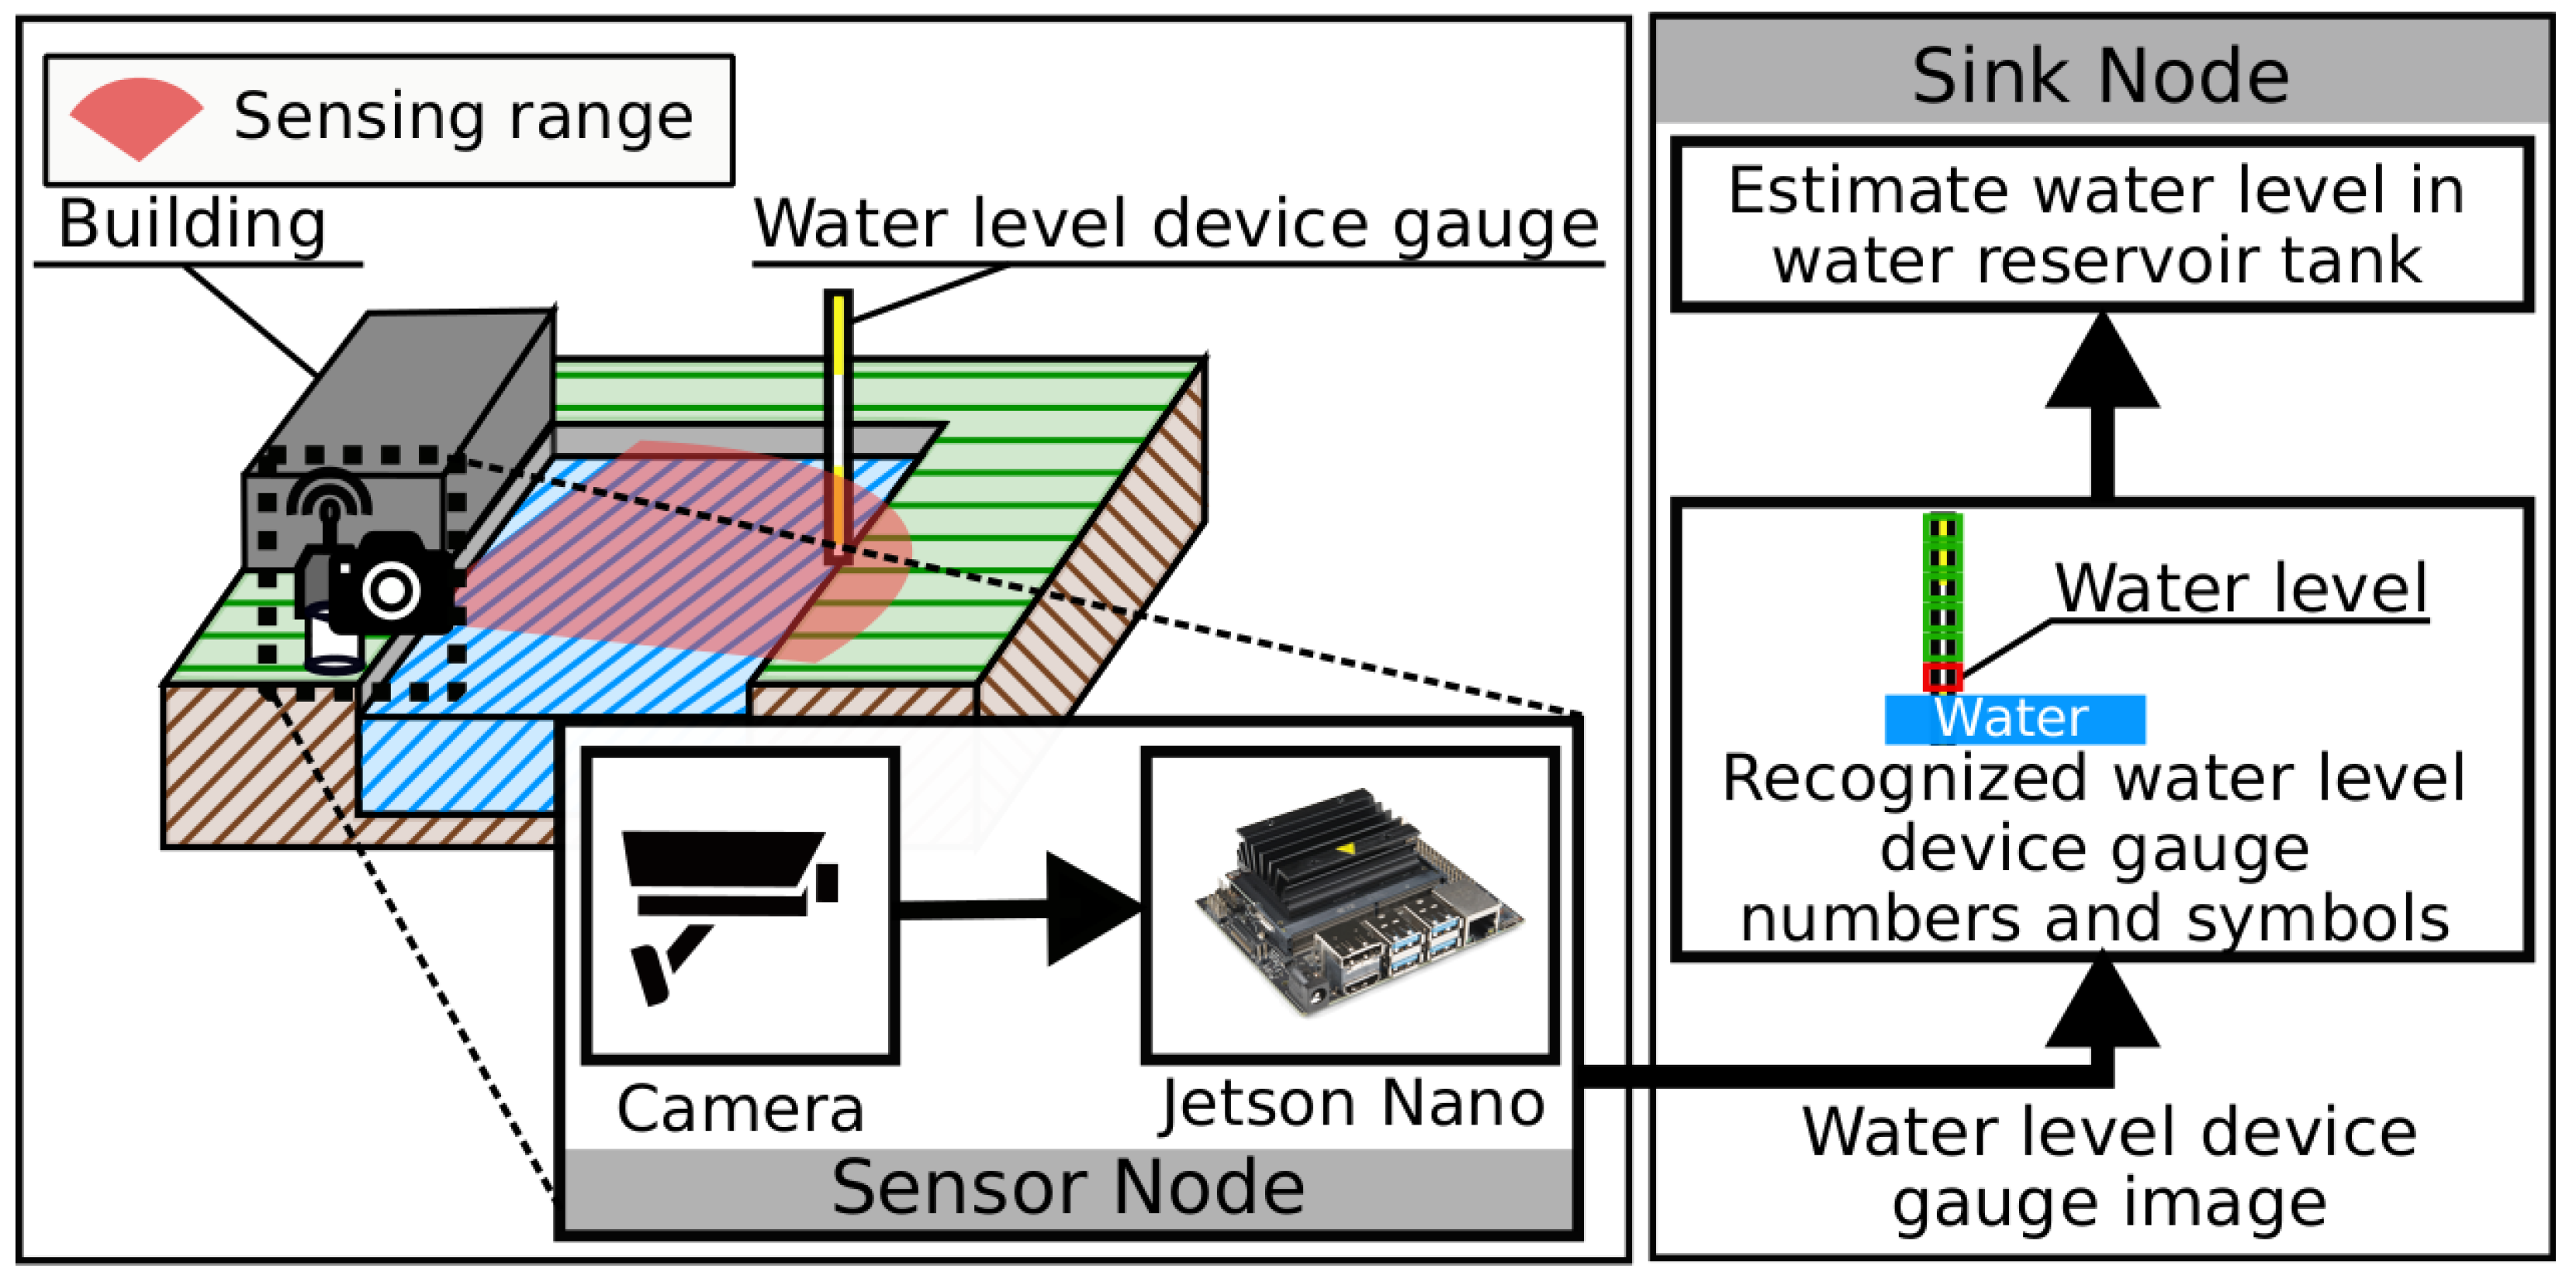
3.1. Design of Object Recognition-Based Water Level Estimation System

In the water level device gauge, the water level markers are printed with numbers and symbols to check the water level and they are installed on river banks and bridges. They are calibrated on vertical posts, which are read visually. The water level reported in the event of flooding or rising water levels is performed by checking the water level device gauge. The proposed system structure shown in Figure 1 uses the Jetson Nano [29,30], a camera device and a water level device gauge. In the proposed system, the sensor nodes are equipped with camera devices to obtain images of the water level device gauges, and the sensor nodes transmit the images of the water level device gauges to the sink node [31,32]. The sink node estimates the water level of the water reservoir tank from the image data of the water level device gauge by object recognition based on YOLOv5 [33].
A snapshot of the water level device gauge is shown in Figure 2, while the view of the water level device gauge using image recognition is shown in Figure 3. The water level in the device is indicated by different colors. Figure 3 shows each range of the water level scale.
The water level device gauge is colored yellow from 0 [m] to 1 [m], white from 1 [m] to 2 [m] and yellow from 2 [m] to 3 [m], alternating with yellow for each 1 [m] in order to improve visibility from a distance. Different heights are indicated by a combination of numbers and red symbols. Numbers corresponding to heights are printed in black on the left-hand in units of 10 [cm] and in units of 1 [m] when they are printed in red. When the number on the right-hand side is printed in black, the value is in units of 10 [cm], while if it is printed in red, the value is in units of 1 [m]. In addition, a red symbol indicating the height is printed above each number, from 1 [m] to 1.9  [m] for a red symbol and from 2 [m] to 2.9  [m] for two red symbols. As an example, two red symbols and the number 3 in black indicate a height of 2.3  [m].
The proposed system obtains the image data of the water level device gauge in the reservoir using a camera mounted on the sensor node and transmits the acquired image data to the sink node. Next, the sink node recognises the water level device gauge in the received image and then recognises the red numbers and symbols in the rectangular area. Then, the sink node estimates the water level in the water reservoir based on the red numbers and symbols. The red numbers and symbols are printed on the water level device gauge where images are recognized by YOLOv5, one of the intelligent algorithms for object recognition, and the smallest value among them is taken as the water level. When training YOLOv5, the red numbers and symbols are included, so it is possible to recognize the same number between different water levels.

3.2. Example of Water Level Estimation Using Proposed System

As shown in Figure 4, we conduct an experiment using the proposed system on a water reservoir tank at Okayama University of Science, Japan. The height from the camera on the sensor node to the surface of the water is about 2 [m]. Figure 5 shows the sensor nodes of the proposed system. Figure 5a shows the placement of the sensor node and Figure 5b shows the hardware configuration of the sensor node. We train YOLOv5 to recognize the numbers and symbols of the water level device gauge using a total of 160 images. Out of a total of 160 images, 60 water level device gauge images were taken indoors and 100 were taken in the water reservoir tank. The training iteration count for YOLOv5 was set to 100,000.
In carrying out the experiment, it was ensured that the water level device gauge was in the water and that the values were minimal. The training data consisted of 100 images taken of water level device gauges in the water reservoir tank, all of which visually confirmed that the water level device gauges were submerged. These training data are applied to the proposed system to evaluate the recognition rate of numbers and symbols and the recognition rate of the water level device gauge by the proposed system. Figure 4 shows the experimental environment.
Figure 6 shows the visualization results of the object recognition of the numbers and symbols and water level device gauges in images when the water level device gauge is perpendicular to the camera. Figure 6a,b show the original image and the visualization results of the water level device gauge, respectively. The numbers and symbols of the water level device gauges and the numerical values listed next to the results of the object recognition of the water level device gauges indicate the confidence level of the object recognition. As shown in Figure 6, the water level estimated by the proposed system is approximately 1.8  [m]. This estimation is based on the recognition of the numerical value “8” and its associated symbols on the water level device gauge.

4. Performance Evaluation

In this section, we discuss the experimental results using proposed system. In the proposed system, an infrared (IR) filter and IR light are attached. The IR filter reduces the effects of environmental light fluctuations by eliminating unnecessary visible light components. Meanwhile, the IR light provides consistent light intensity, enabling the system to adapt when the light levels change (during different times of the day or a change in weather conditions).
The camera angle significantly affects the view of the target object. Thus, the selection of an appropriate angle is essential to maximize the visibility of the water level device gauge. The angles where the camera can observe the gauge depend on the installation environment and operational conditions. Therefore, ensuring the consistent functioning of the system for different angles is crucial for maintaining system practicality. Moreover, accurately understanding the impact of angle variations enables this knowledge to be applied to the optimal placement of cameras and sensors.
We conduct experiments by varying the horizontal angle of the camera with respect to the water level device gauge from 0 [deg.] to 40 [deg.] every 10 [deg.] to evaluate the angle of the view at which the proposed system can recognise the water level device gauge image. The map of the experimental area is shown in Figure 7. In addition, the real environment of the cameras’ location for taking images of water level device gauge is shown in Figure 8. A snapshot of the experimental environment for the performance evaluation of the proposed system is shown in Figure 9.
In the proposed system, the captured images are first resized to a resolution of 640 × 640 pixels. Then, the images are converted to grayscale and fed into YOLOv5. A total of 160 images were used for training the proposed system. Among these images, 140 images were utilized as training data for training the model, while the remaining 20 images were used as test data to evaluate the system performance.
The original images taken by the camera are shown in Figure 10, while the visualization results for the original data based on object recognition are shown in Figure 11. In Figure 12, we show the experimental results of the recognition rate for different camera angles using original data. At 0 [deg.], the recognition rate for numbers and symbols is 2.09 [%], while for the water level this is 17.3 [%]. In case the angle is 10 [deg.], the recognition rate for numbers and symbols is 41.1 [%], while for the water level this is 98.0 [%]. For 20 [deg.], the recognition rate for the numbers and symbols is 16.1 [%] and for the water level this is 97.6 [%]. At 30 [deg.], the recognition rate for the numbers and symbols is 14.6 [%], while for the water level this is 99.4 [%]. Finally, for 40 [deg.], the recognition rate for the numbers and symbols is 0.172 [%] and for the water level this 94.5 [%]. Considering these results, we conclude that at the 0 [deg.] angle, the light reflection directly impacts the sensor, reducing the image contrast. Consequently, the recognition of the water level line and numbers becomes challenging, resulting in a decreased recognition rate for the water level. On the other hand, for angles exceeding 20 [deg.], the visual distortion becomes a significant factor that reduces the recognition rate, exhibiting a declining trend compared to the performance observed at 10 [deg.]. In case of a 40 [deg.] angle, the recognition rate decreases because the field of view is distorted, hindering the recognition rate of the numbers and symbols. However, the color-coded range on the water level device gauge becomes more prominent, enabling the water level height to be determined without relying on numbers and symbols.
We show in Figure 13 the conversion from original data to grayscale data. The grayscale data are used for learning and predicting water levels by the proposed system. Also, the image data captured by sensor nodes are processed by grayscale data before estimating the water level. The visualization results for grayscale data based on object recognition are shown in Figure 14. Additionally, the experimental results of the recognition rate for different camera angles using grayscale data are shown in Figure 15. At 0 [deg.], the recognition rate for the numbers and symbols is 32.9 [%], while for the water level this is 99.3 [%]. In the case of a 10 [deg.] angle, the recognition rate for the numbers and symbols is 56.5 [%], while for water level this is 98.0 [%]. For angle 20 [deg.], the recognition rate for the numbers and symbols is 24.5 [%] and for water level this 96.5 [%]. At 30 [deg.], the recognition rate for the numbers and symbols is 29.3 [%], while for water level this is 98.6 [%]. Finally, for 40 [deg.], the recognition rate for the numbers and symbols is 0.649 [%] and for water level this is 86.0 [%]. From these results, we can see that the recognition rate decreases at 40 [deg.]. The proposed system has the best performance for 10 [deg.], which is attributable to the training data containing a greater number of images.
The recognition rate for grayscale data was lower than that of the original data at 0 [deg.]. By removing color information in grayscale data, the system is focused on the contours of numbers and symbols as well as the contrast between light and dark. This reduces susceptibility to background noise and lighting conditions, enhancing recognition accuracy. Furthermore, for the grayscale data, the recognition rate for water level was higher than 95 [%] from 0 to 30 [deg.].
We carried out experiments to evaluate the water level error. Figure 16 shows the experimental results for different camera angles using grayscale data. The tests were conducted ten times for each angle and the average values were calculated for each time interval. The recognition accuracy is good and less than 9 [%] most of the time.

5. Discussion

The proposed system enables real-time visual water level measurement, achieving a high recognition rate of approximately 99.5 [%] at the optimal angle for numbers and symbols. While traditional satellite remote sensing technology can be used for wide-area monitoring, it faces challenges such as weather dependency and high costs [34]. The satellite altimeters are good for long-term data collection and wide-area monitoring but are unsuitable for small water bodies or scenarios requiring real-time responses. A cavity optomechanical liquid level meter is a non-contact technique that can detect minute water level fluctuations with high precision and in real-time [35]. However, it is susceptible to changes in light conditions and the environment where the measurement equipment is installed. Inland water level monitoring using satellite observations is cost-effective to install and limited to specific locations, making wide-area monitoring challenging [36]. In contrast, the proposed system combines flexibility in installation with the ability to collect wide-area data and can be used for monitoring small water bodies and small- to medium-sized rivers.
However, the proposed system also has some challenges. Environmental factors, in particular, may cause fluctuations in recognition accuracy. The visibility of the water level device gauge can be decreased due to rain, fog, or the accumulation of mud and debris, potentially affecting image recognition accuracy. To address these issues, solutions, such as introduction of self-cleaning cameras or improving image correction algorithms, are required.

6. Conclusions

Disaster countermeasures are being promoted to prevent large-scale river disasters such as floods and landslides, using river monitoring equipment to provide information on rivers. Thus, the prediction and detection of river disasters are important to quickly identify river anomalies.
In this paper, we proposed a water level estimation system based on water level device gauge image recognition and WSN. We carried out many experiments to evaluate the performance of the proposed system. From the experimental results, we conclude the following.
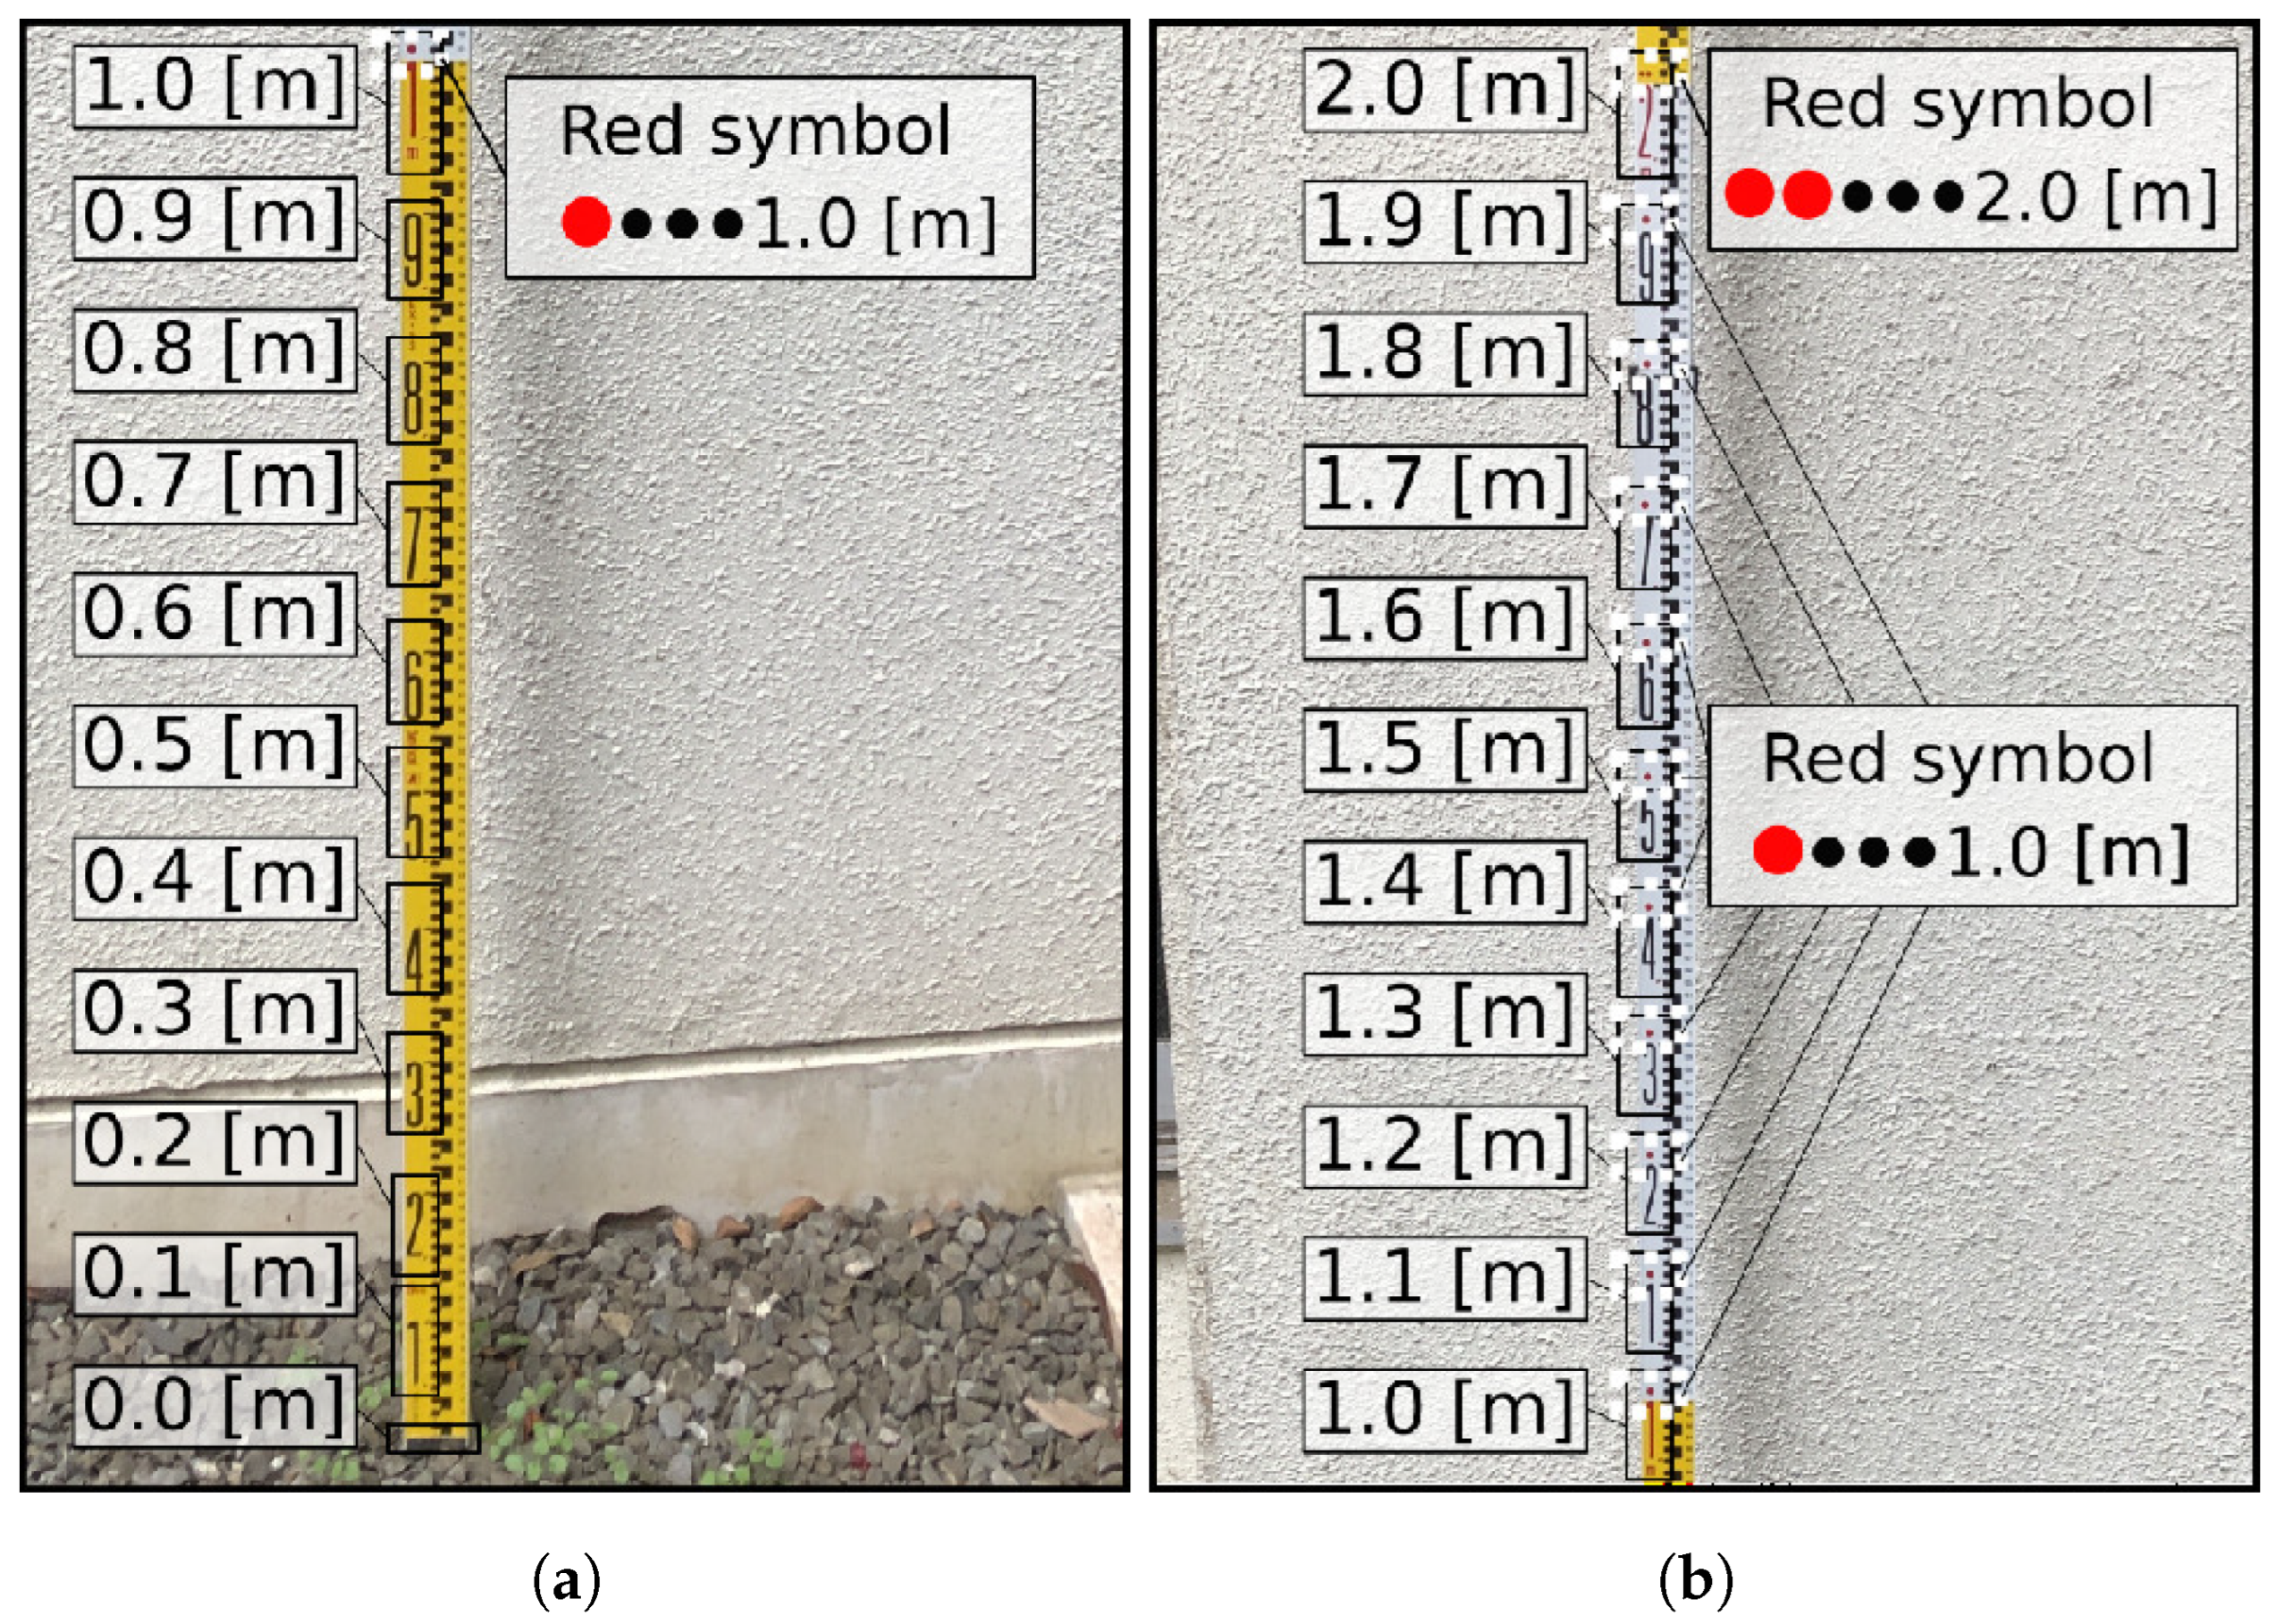
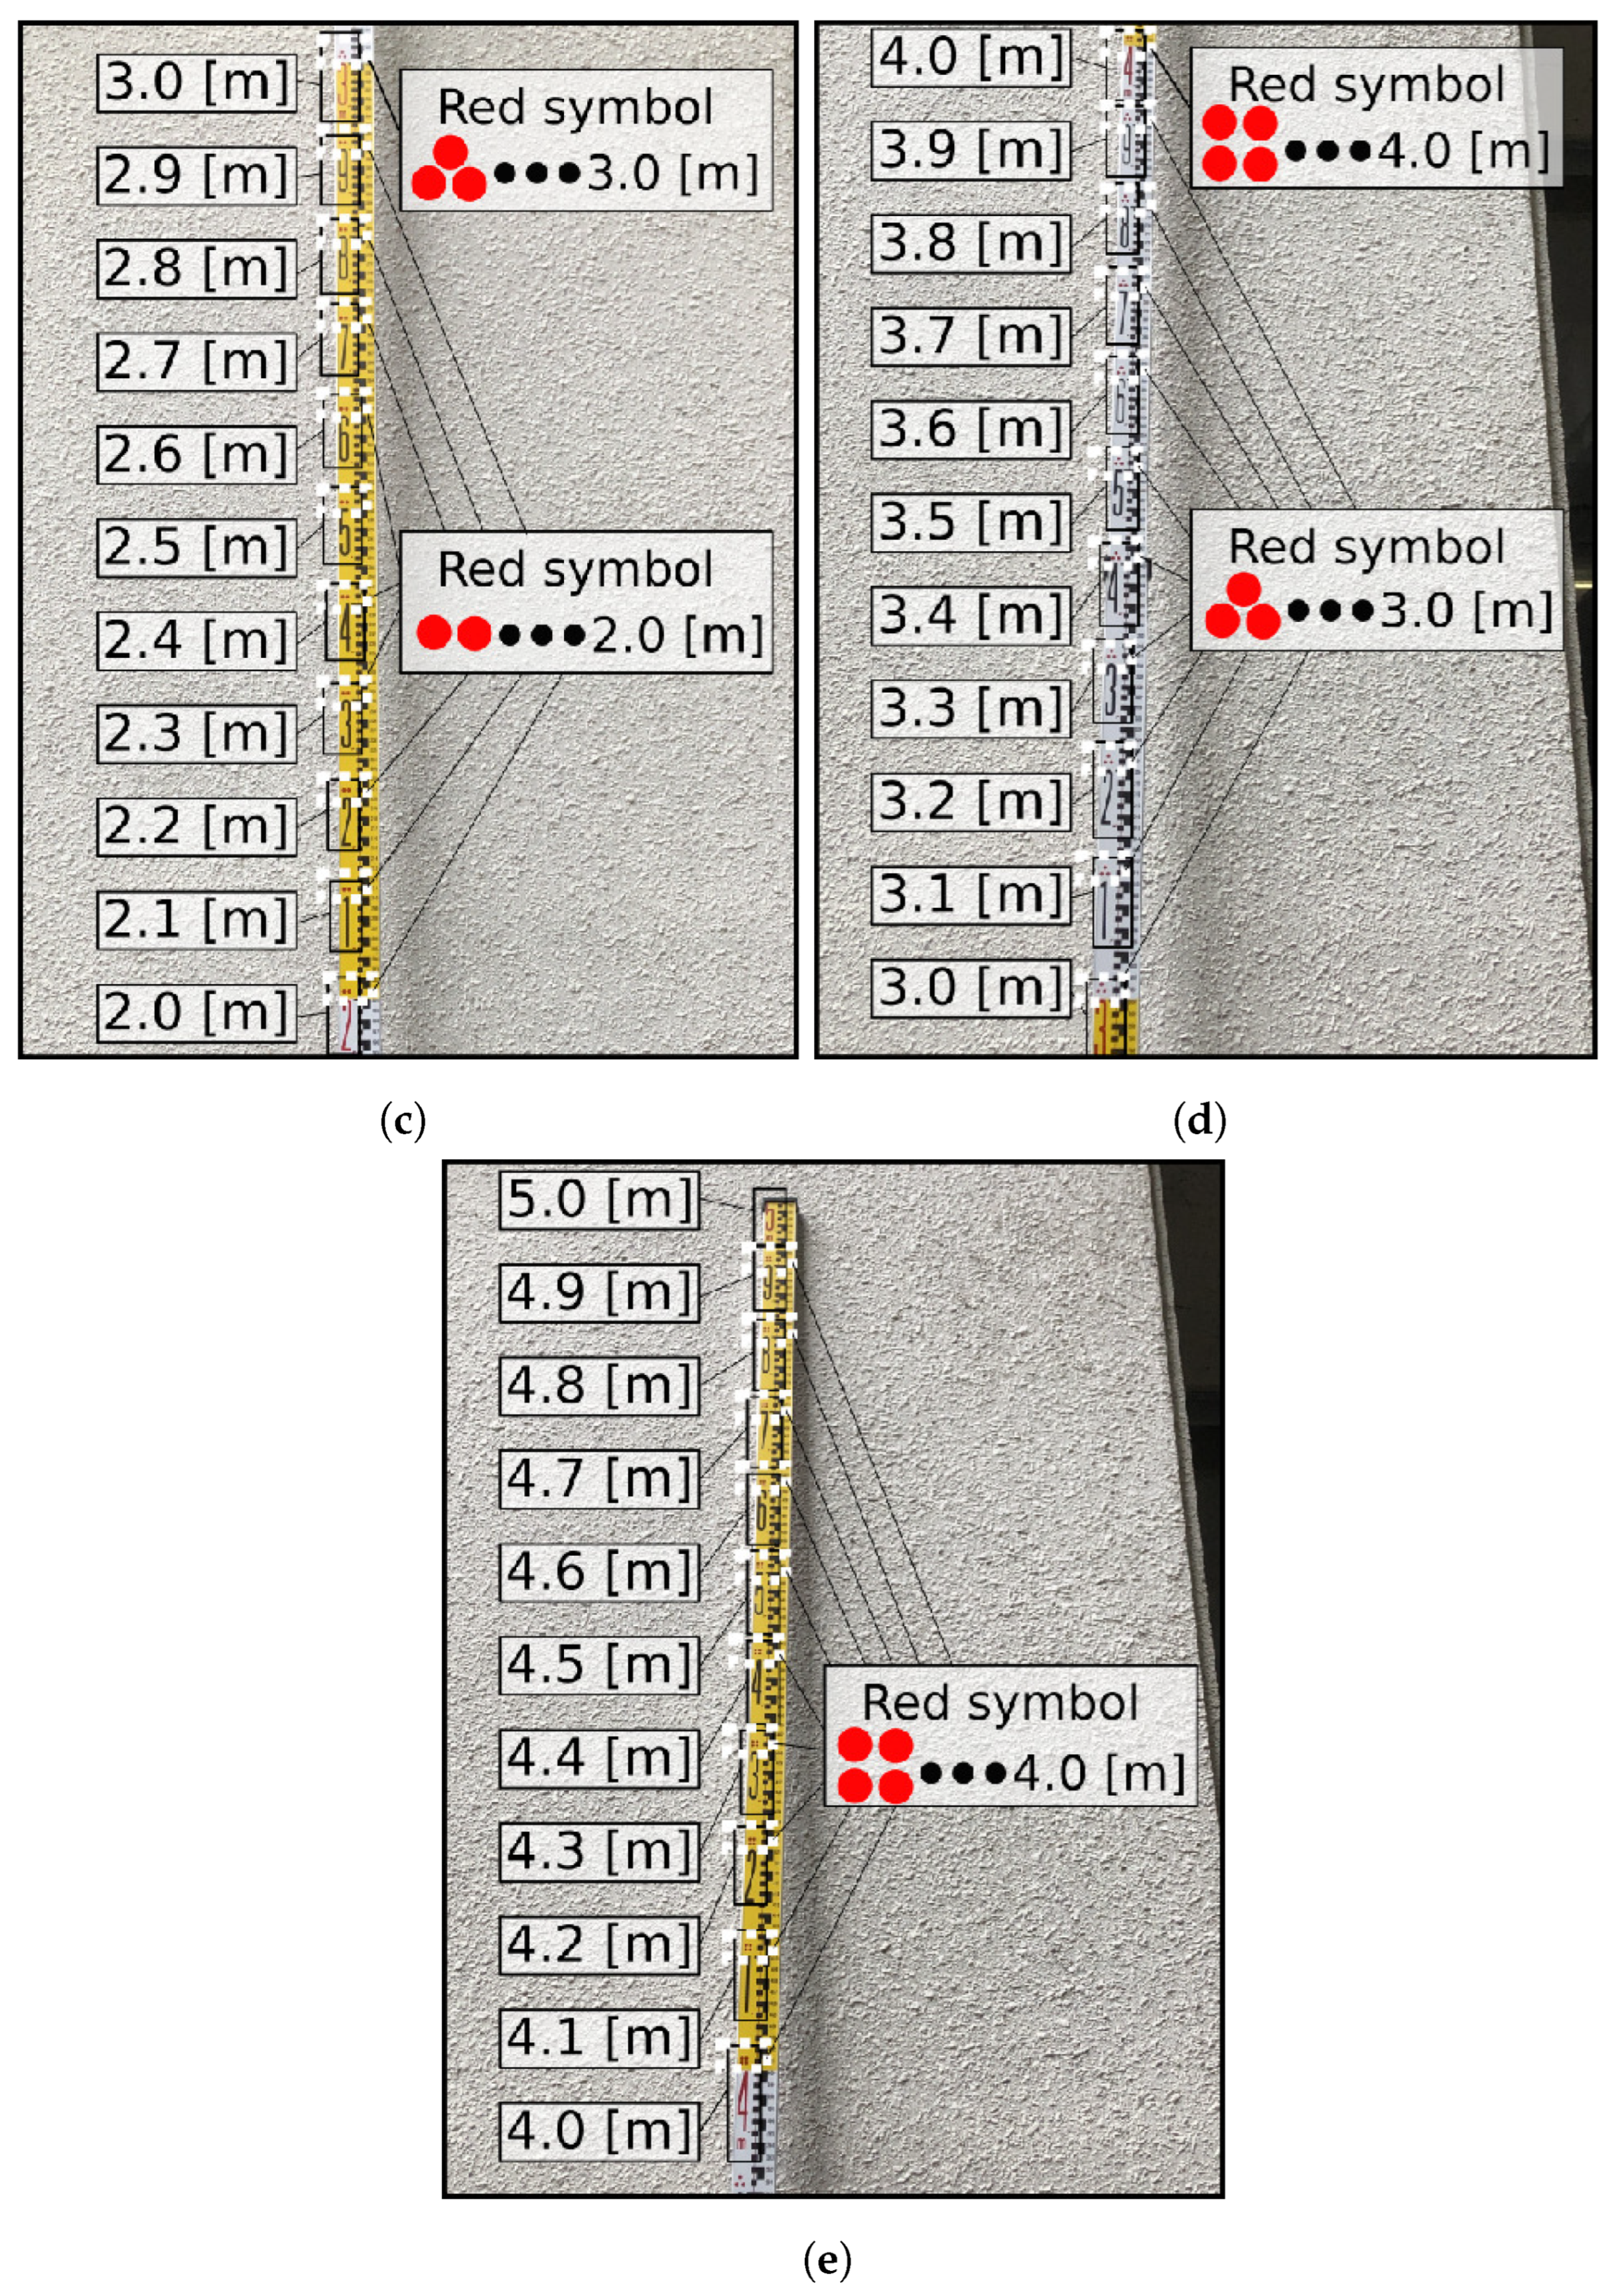
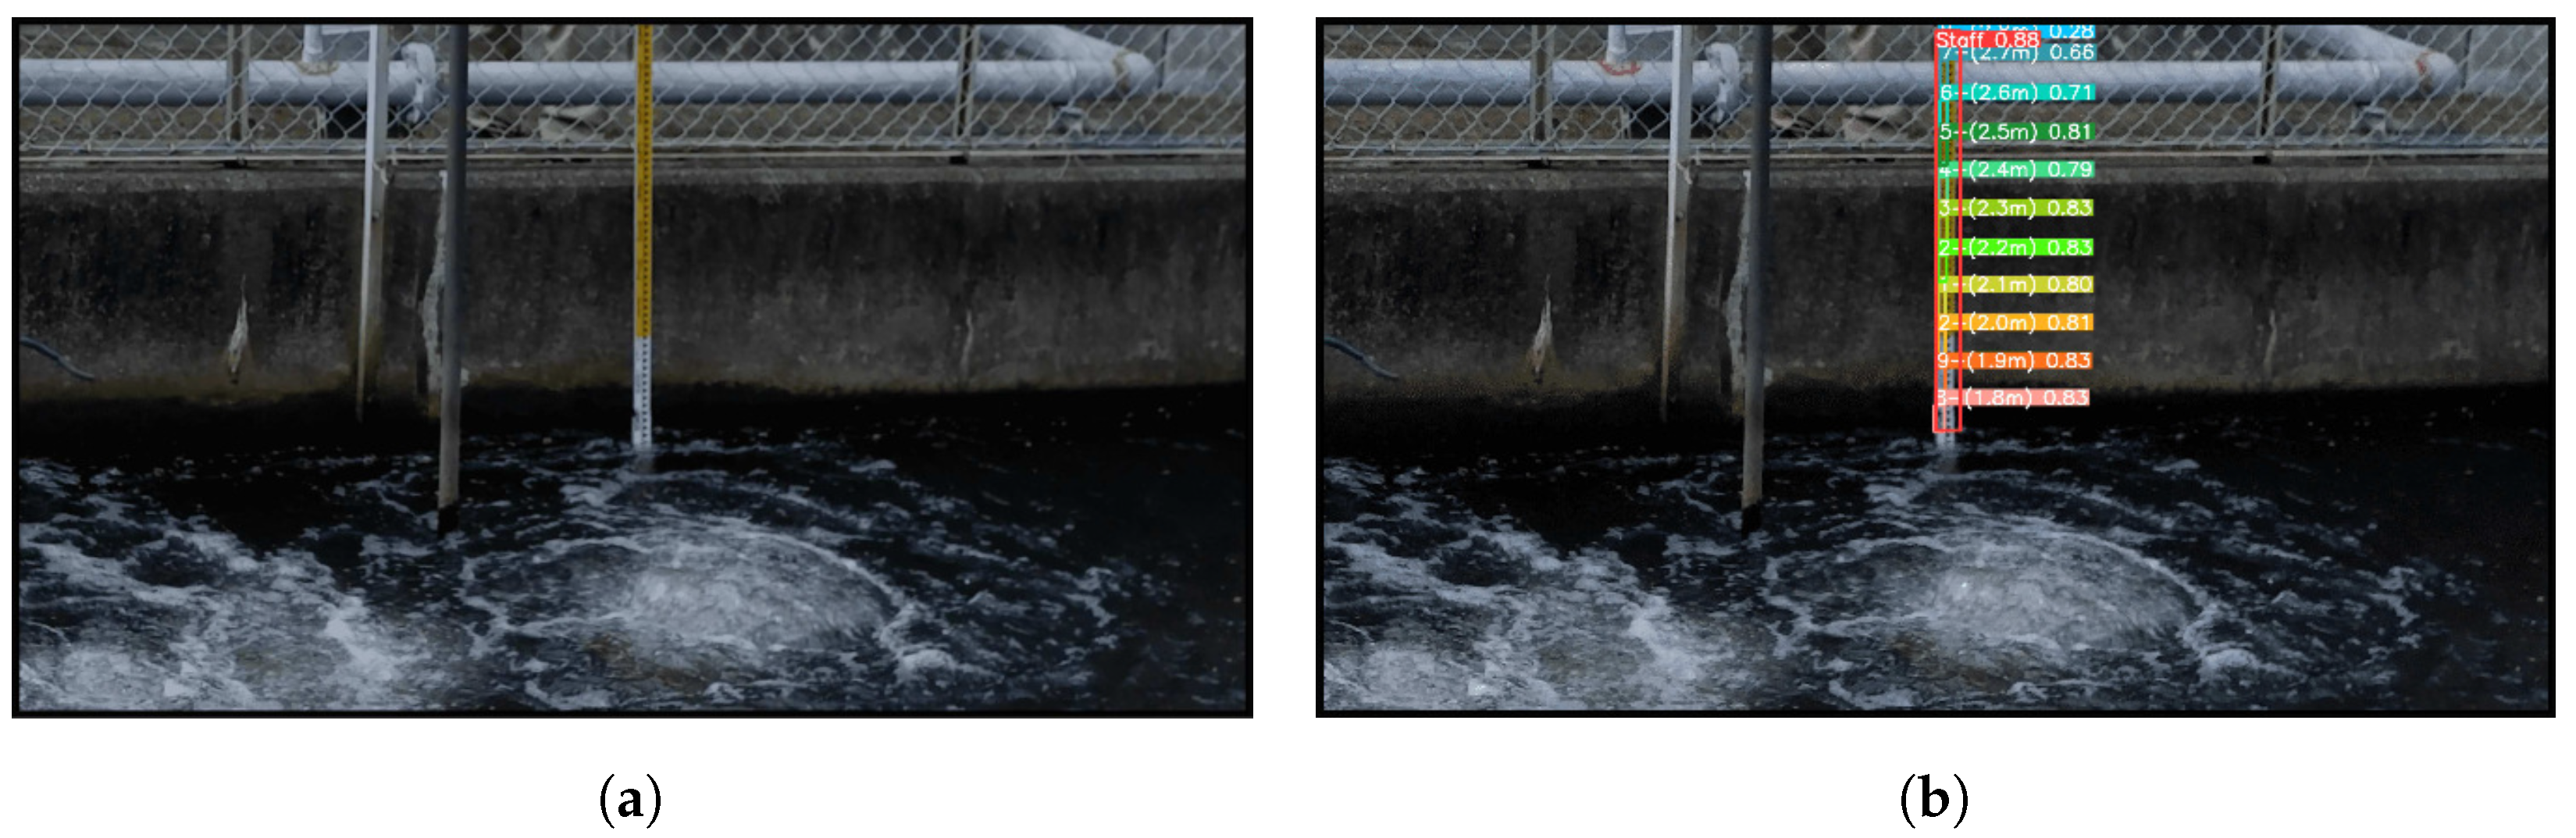
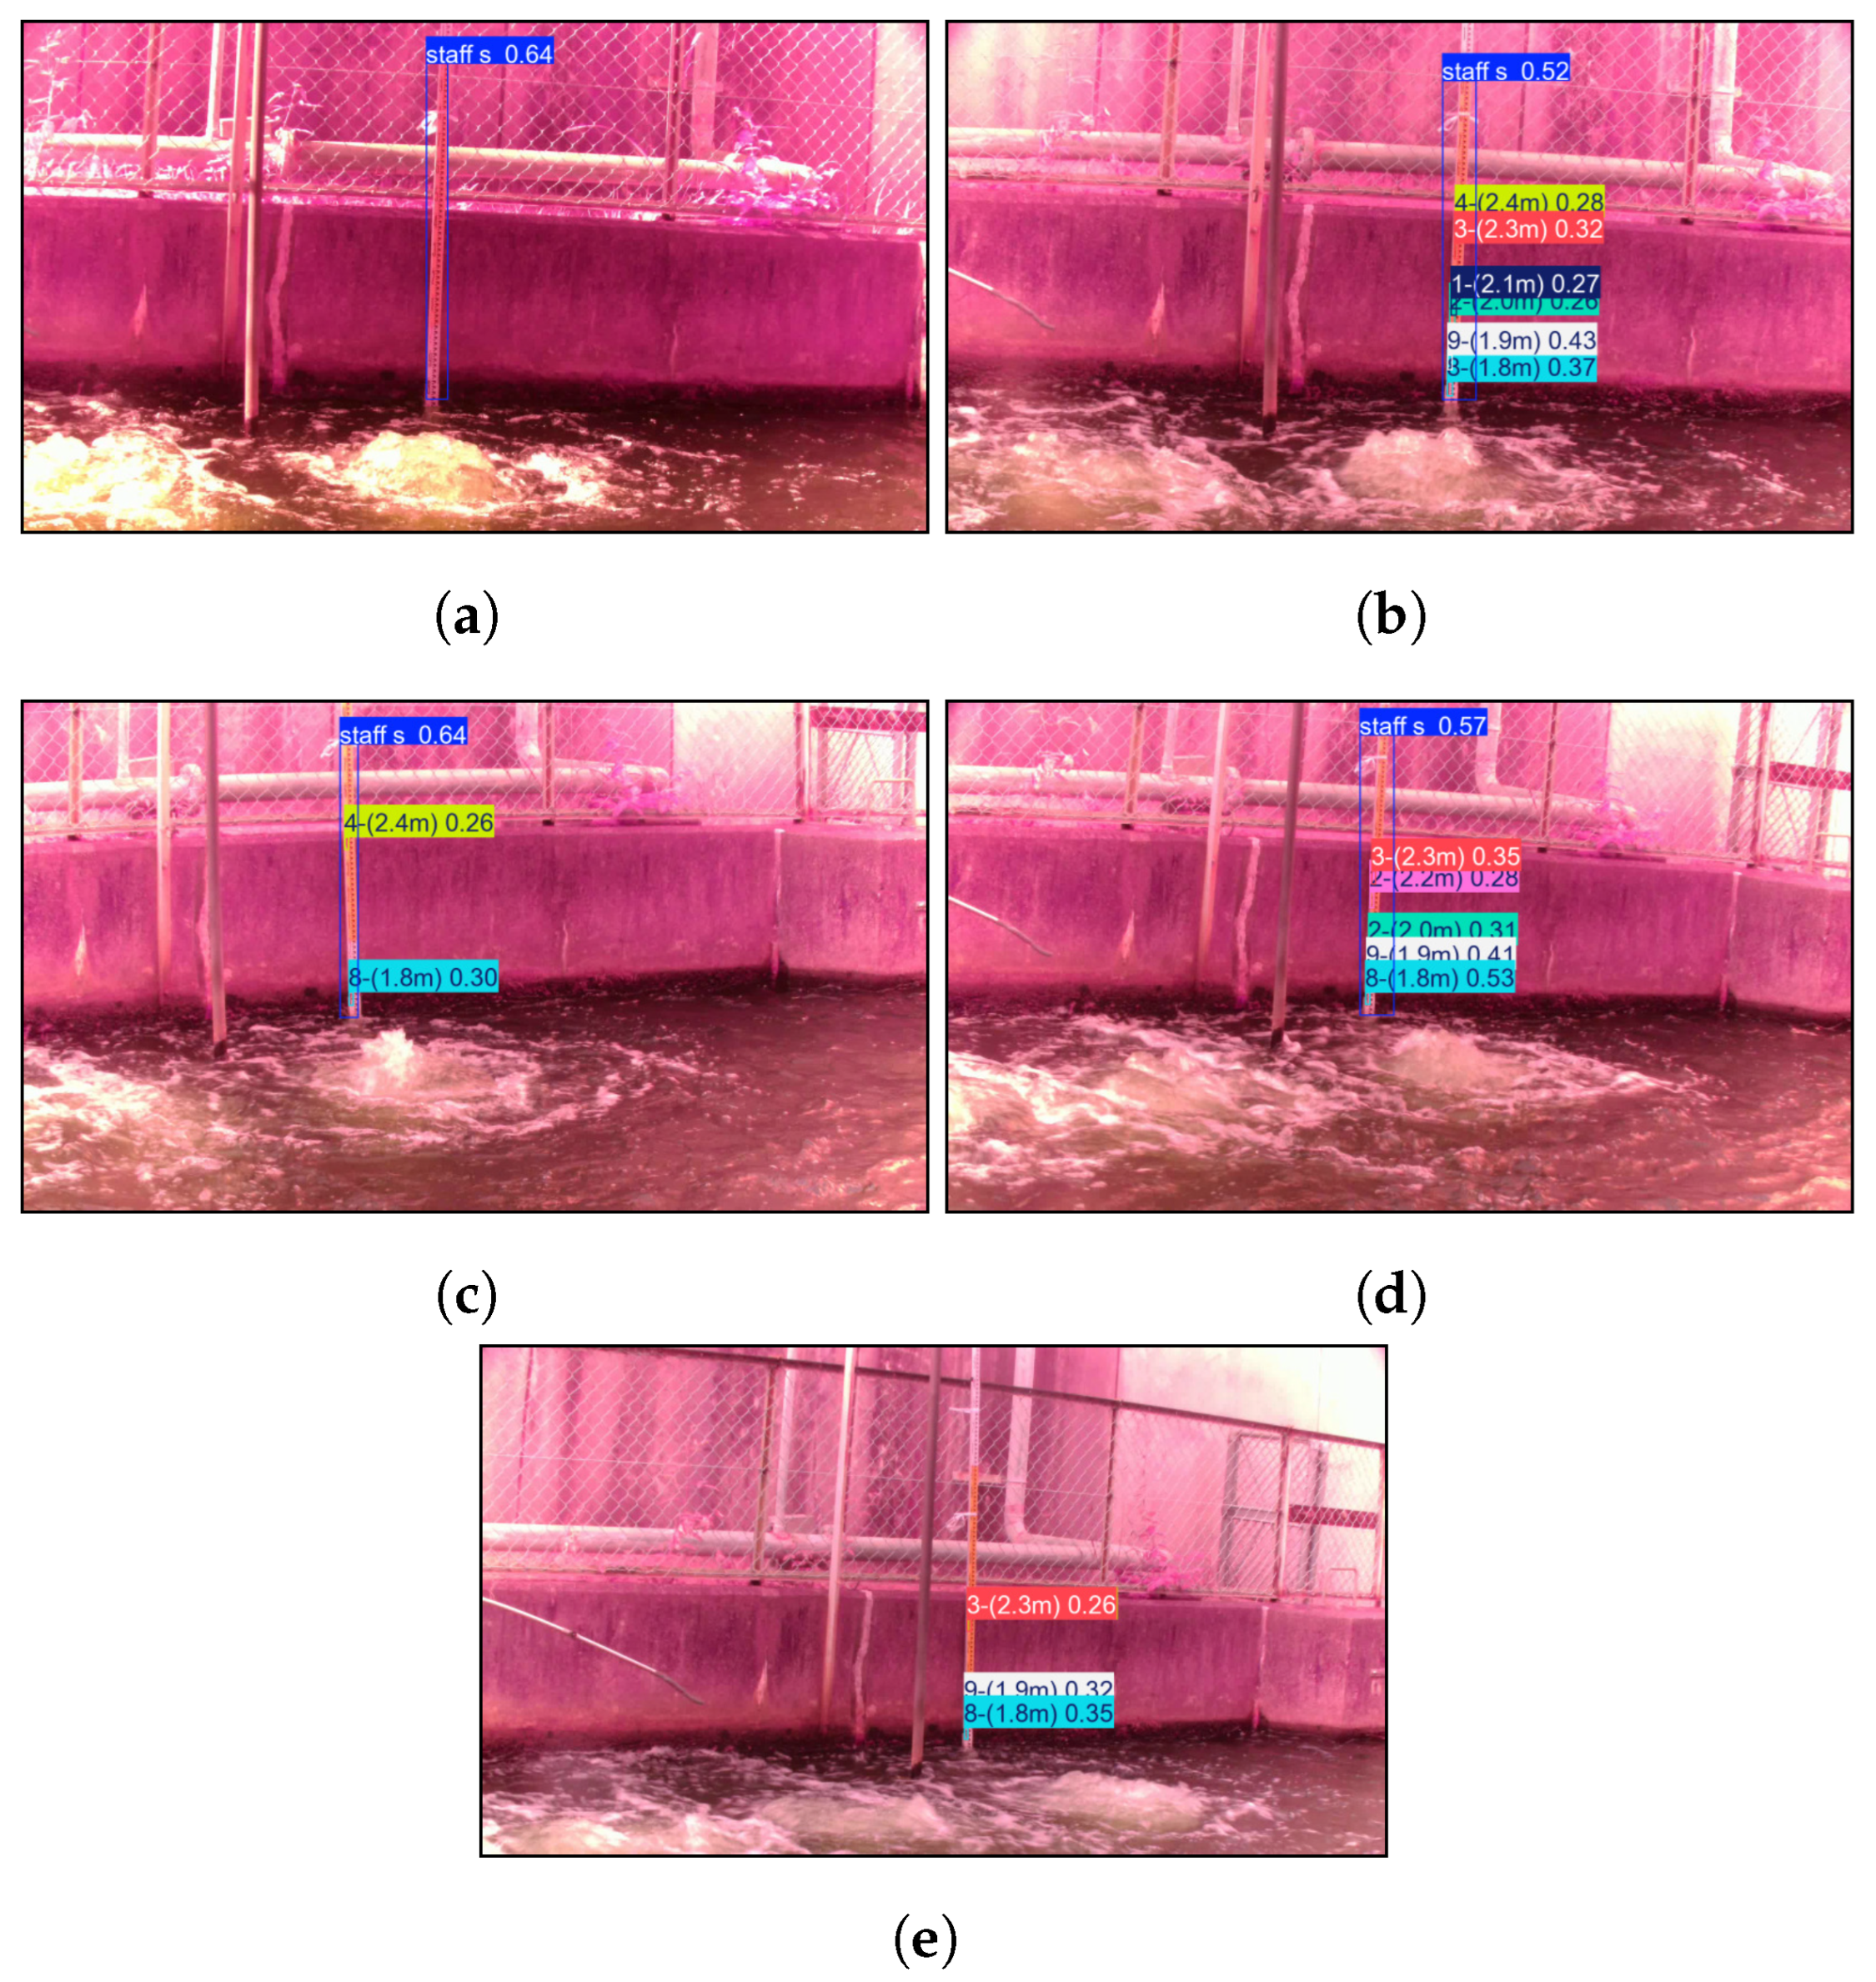
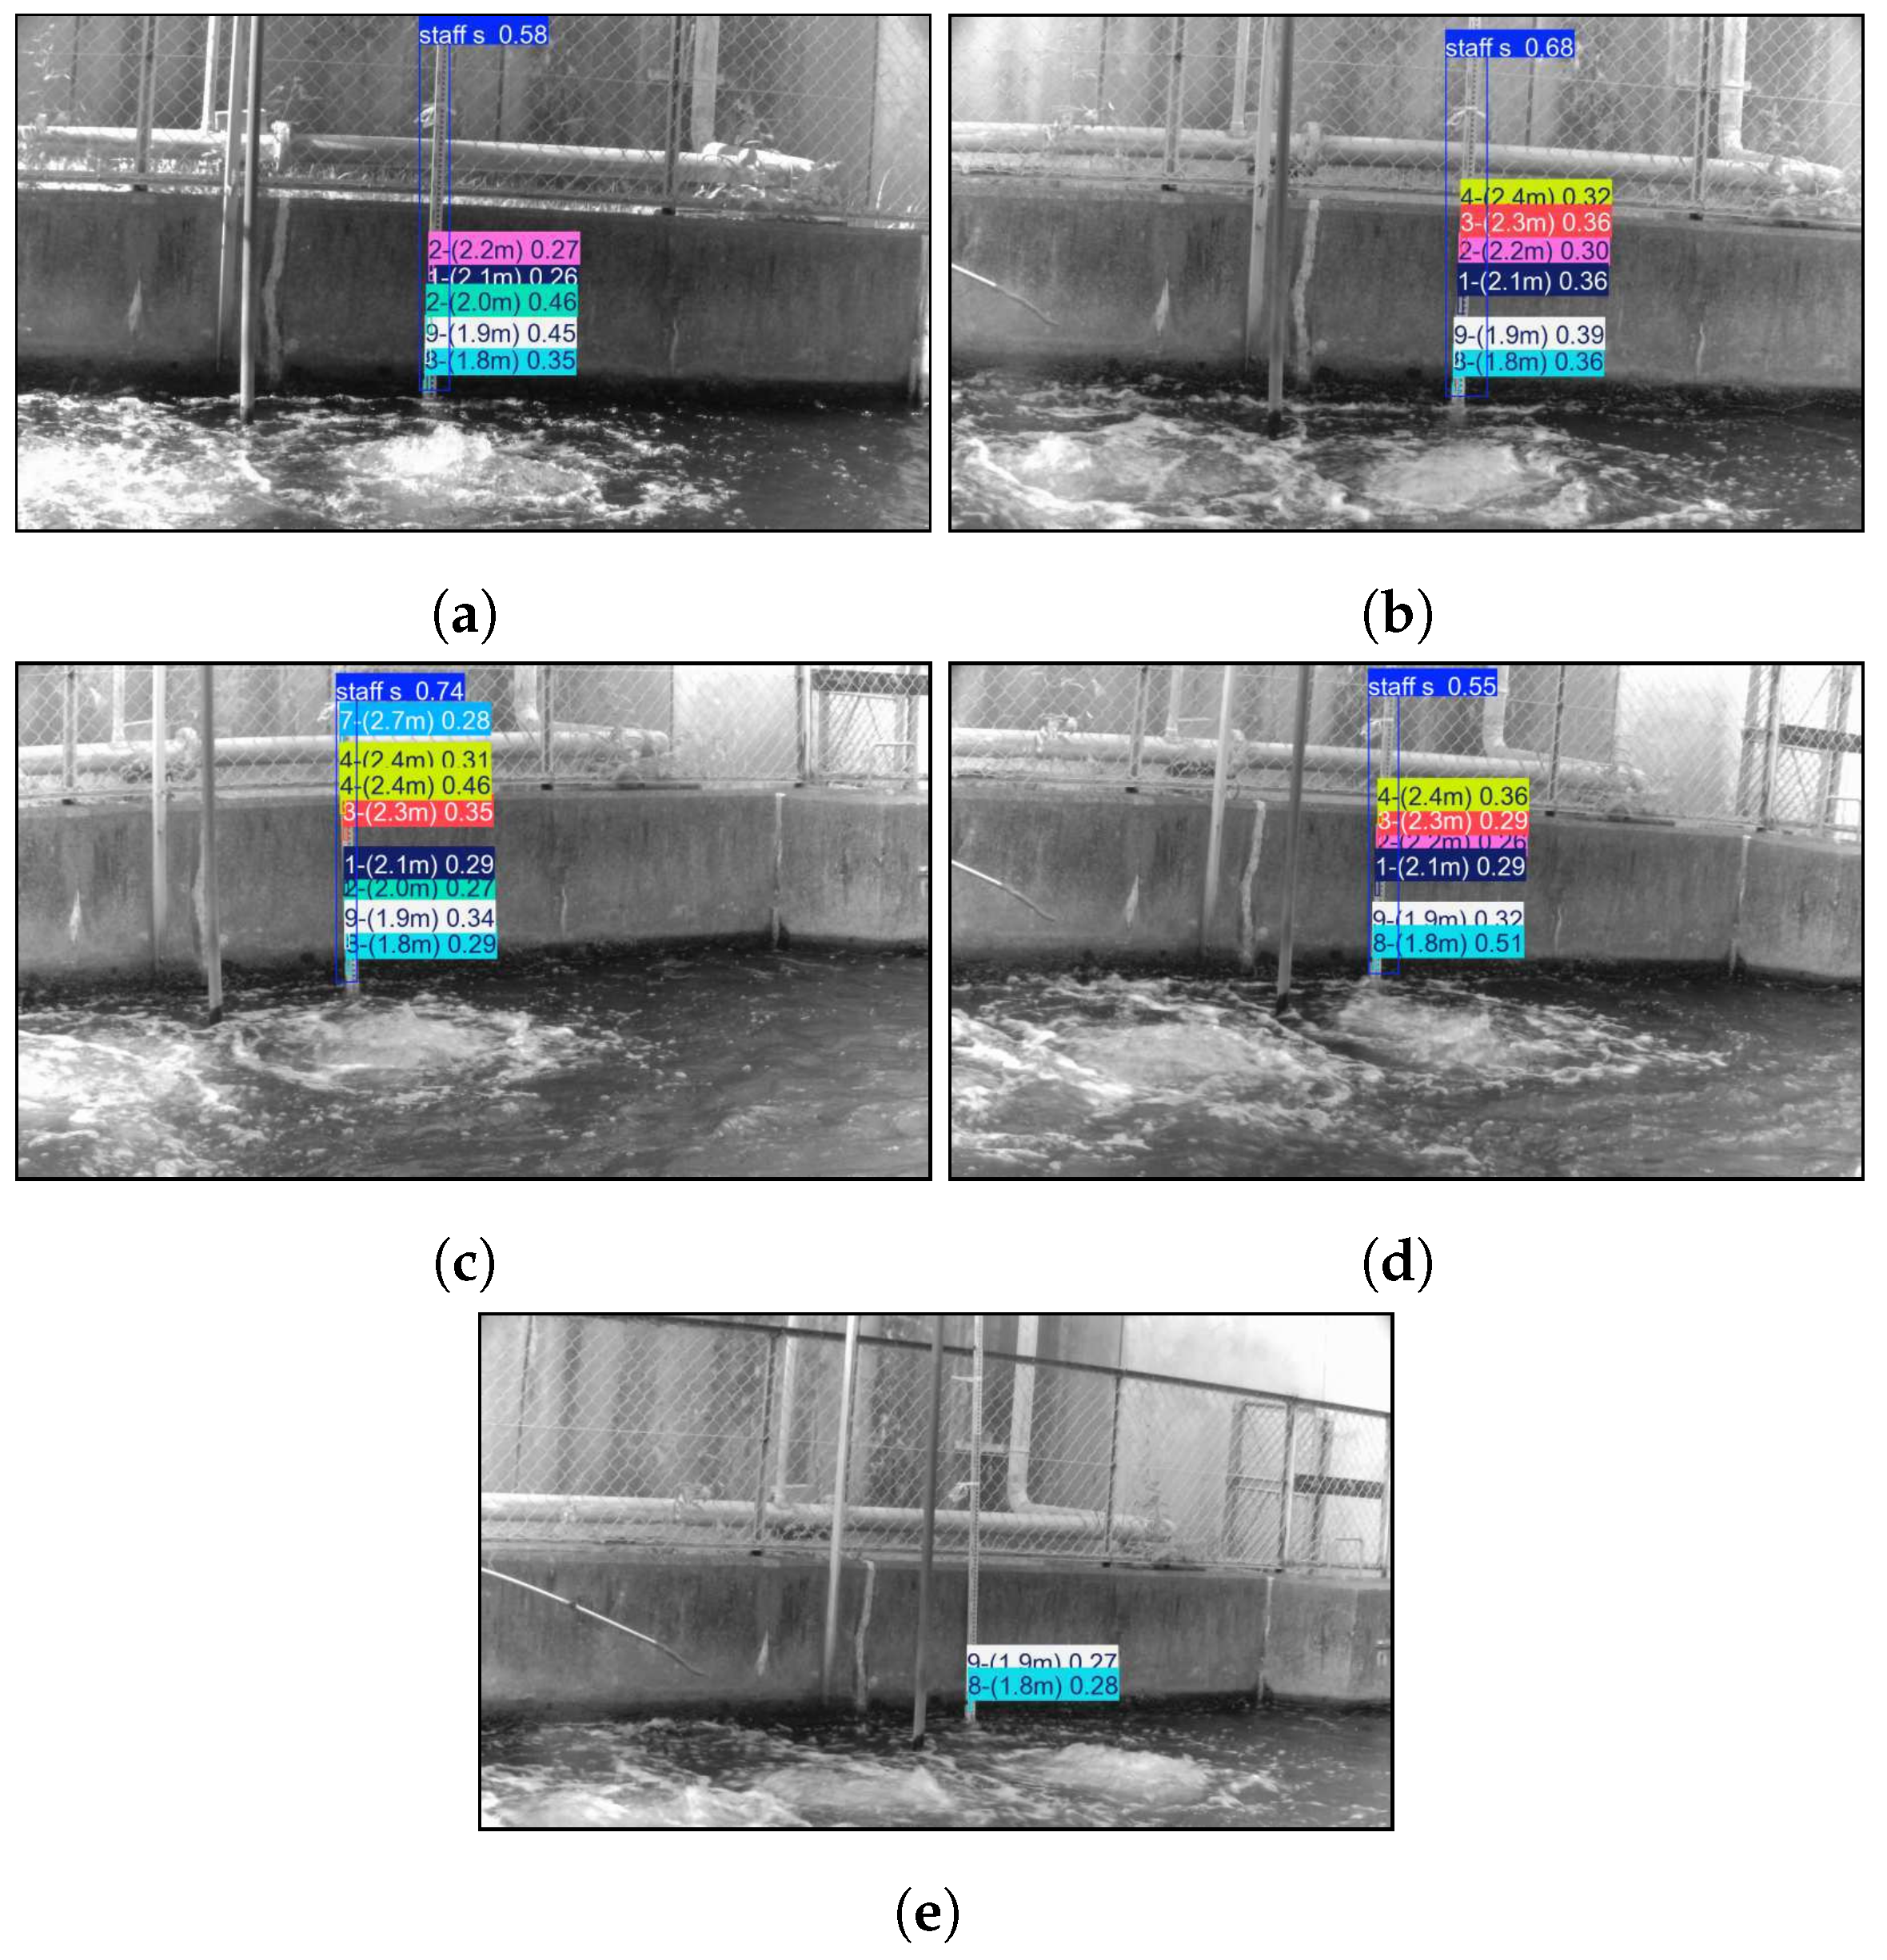
  • The proposed system was found to be able to estimate the water level by using the image-based object recognition of the numbers and symbols printed on the water level device gauge.
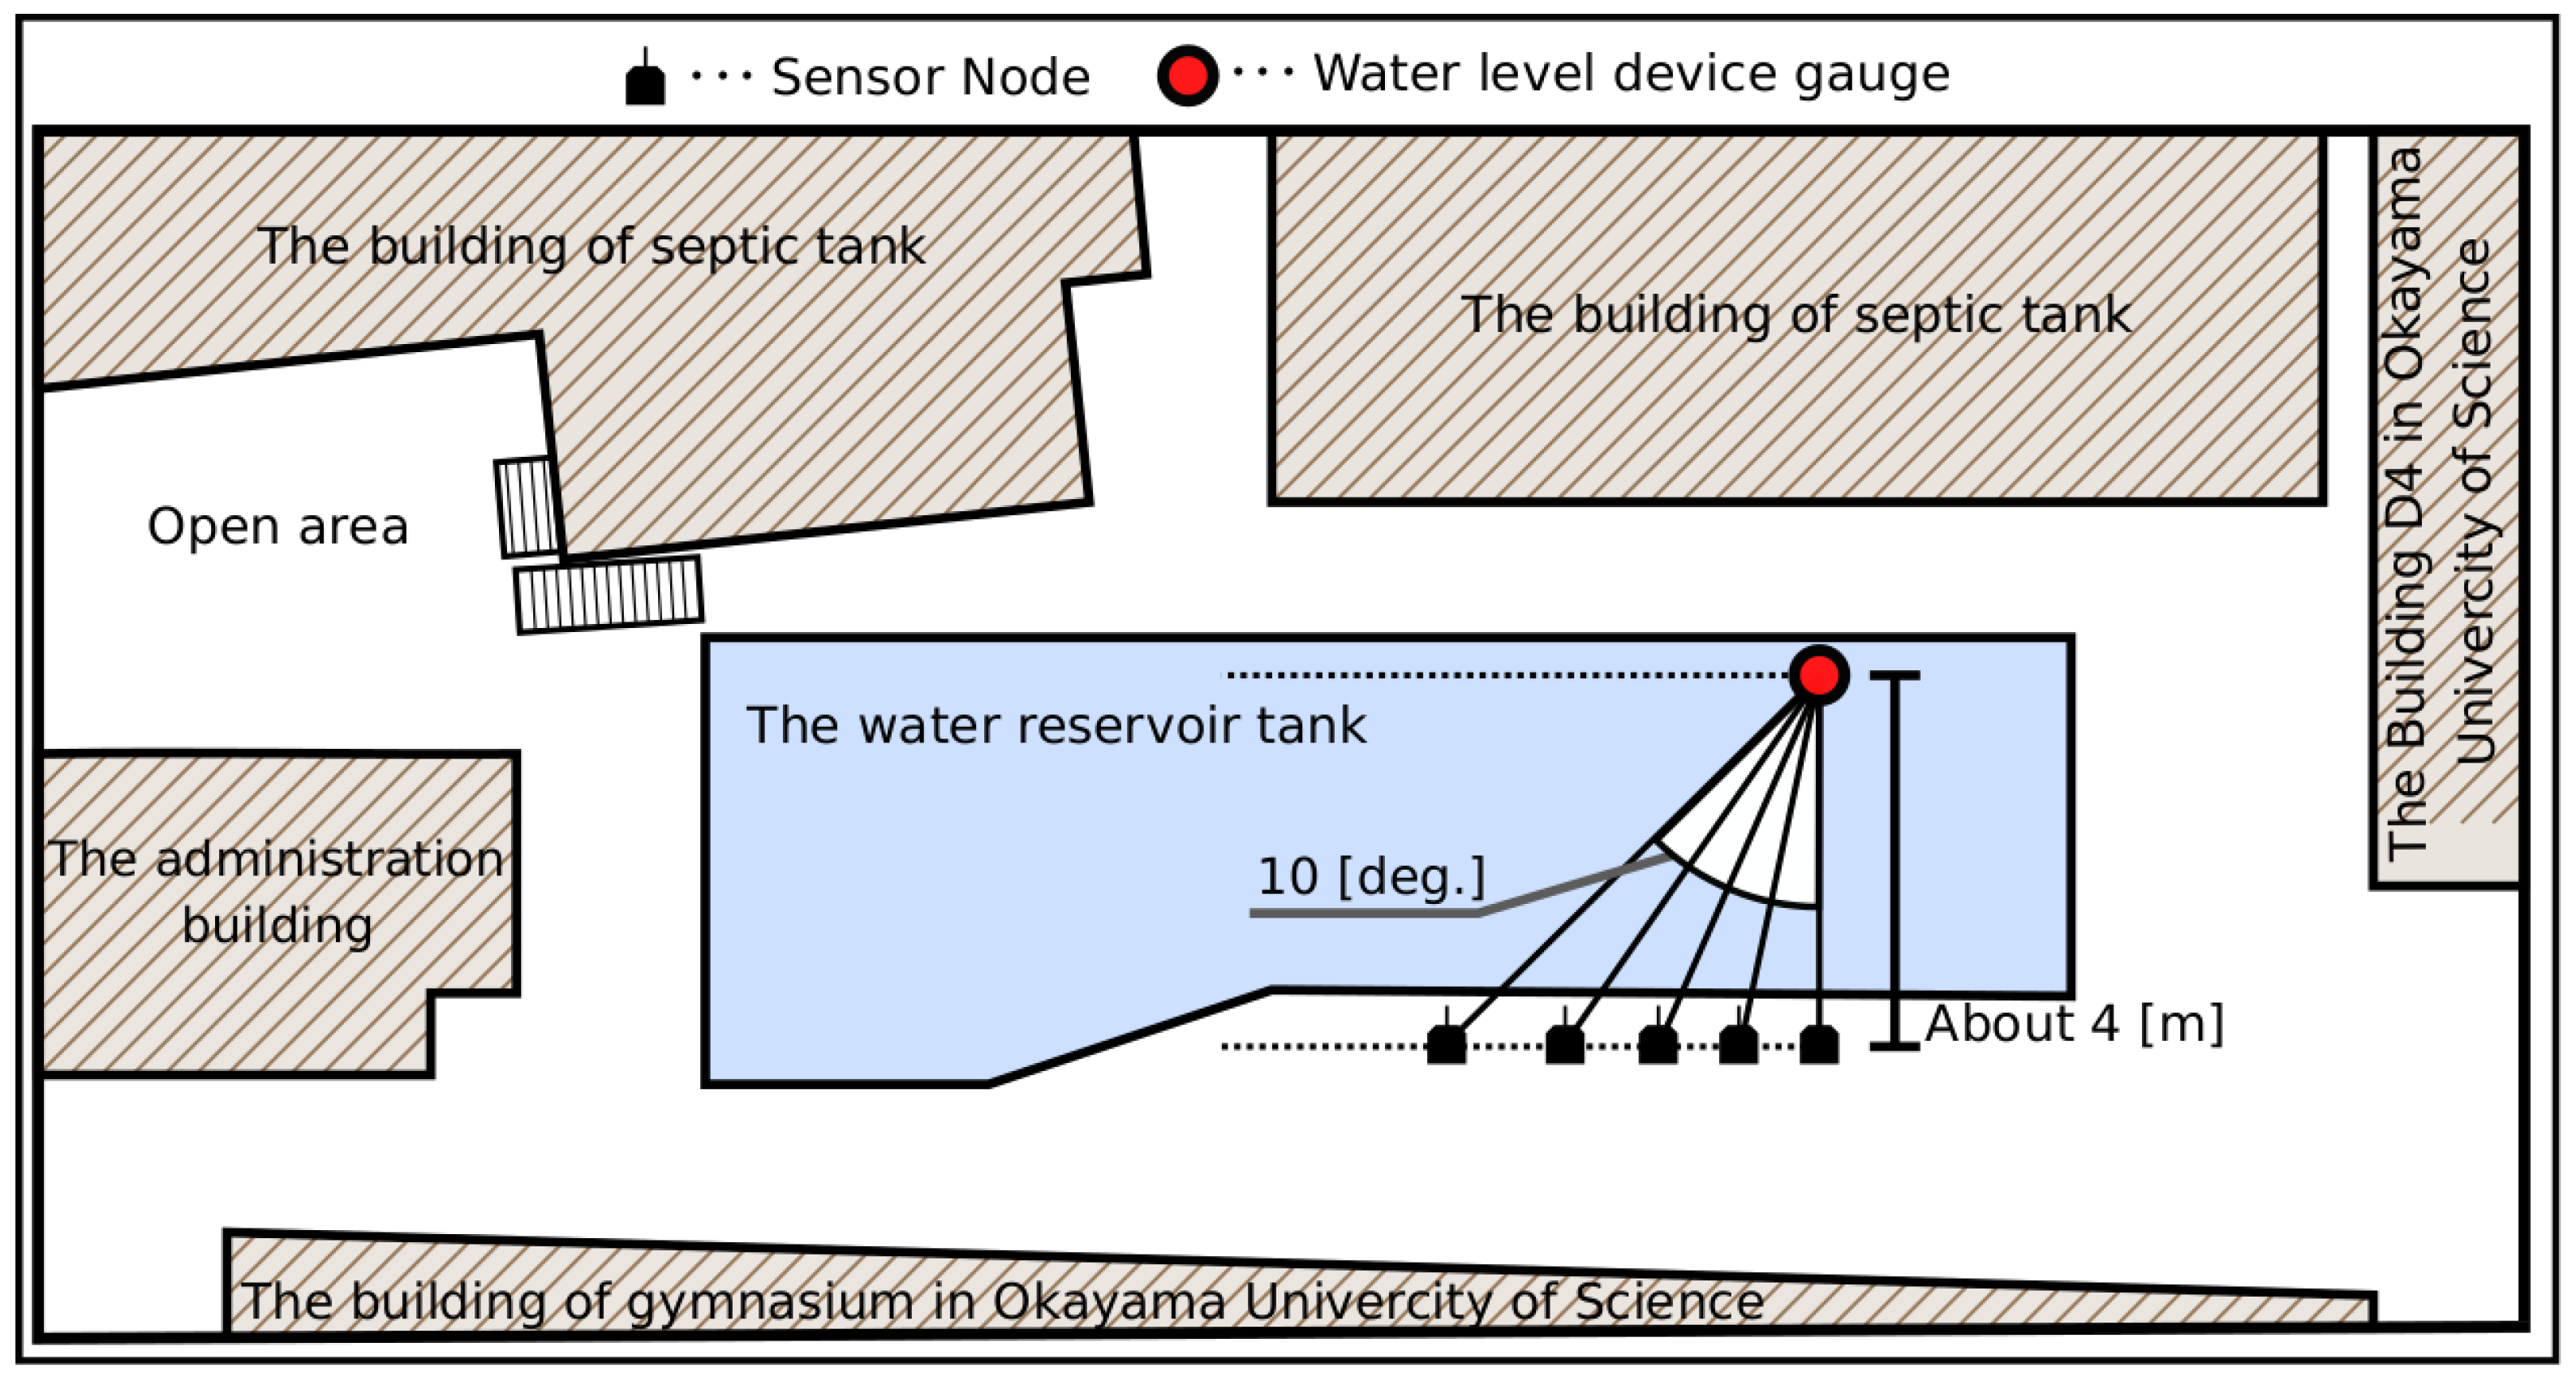
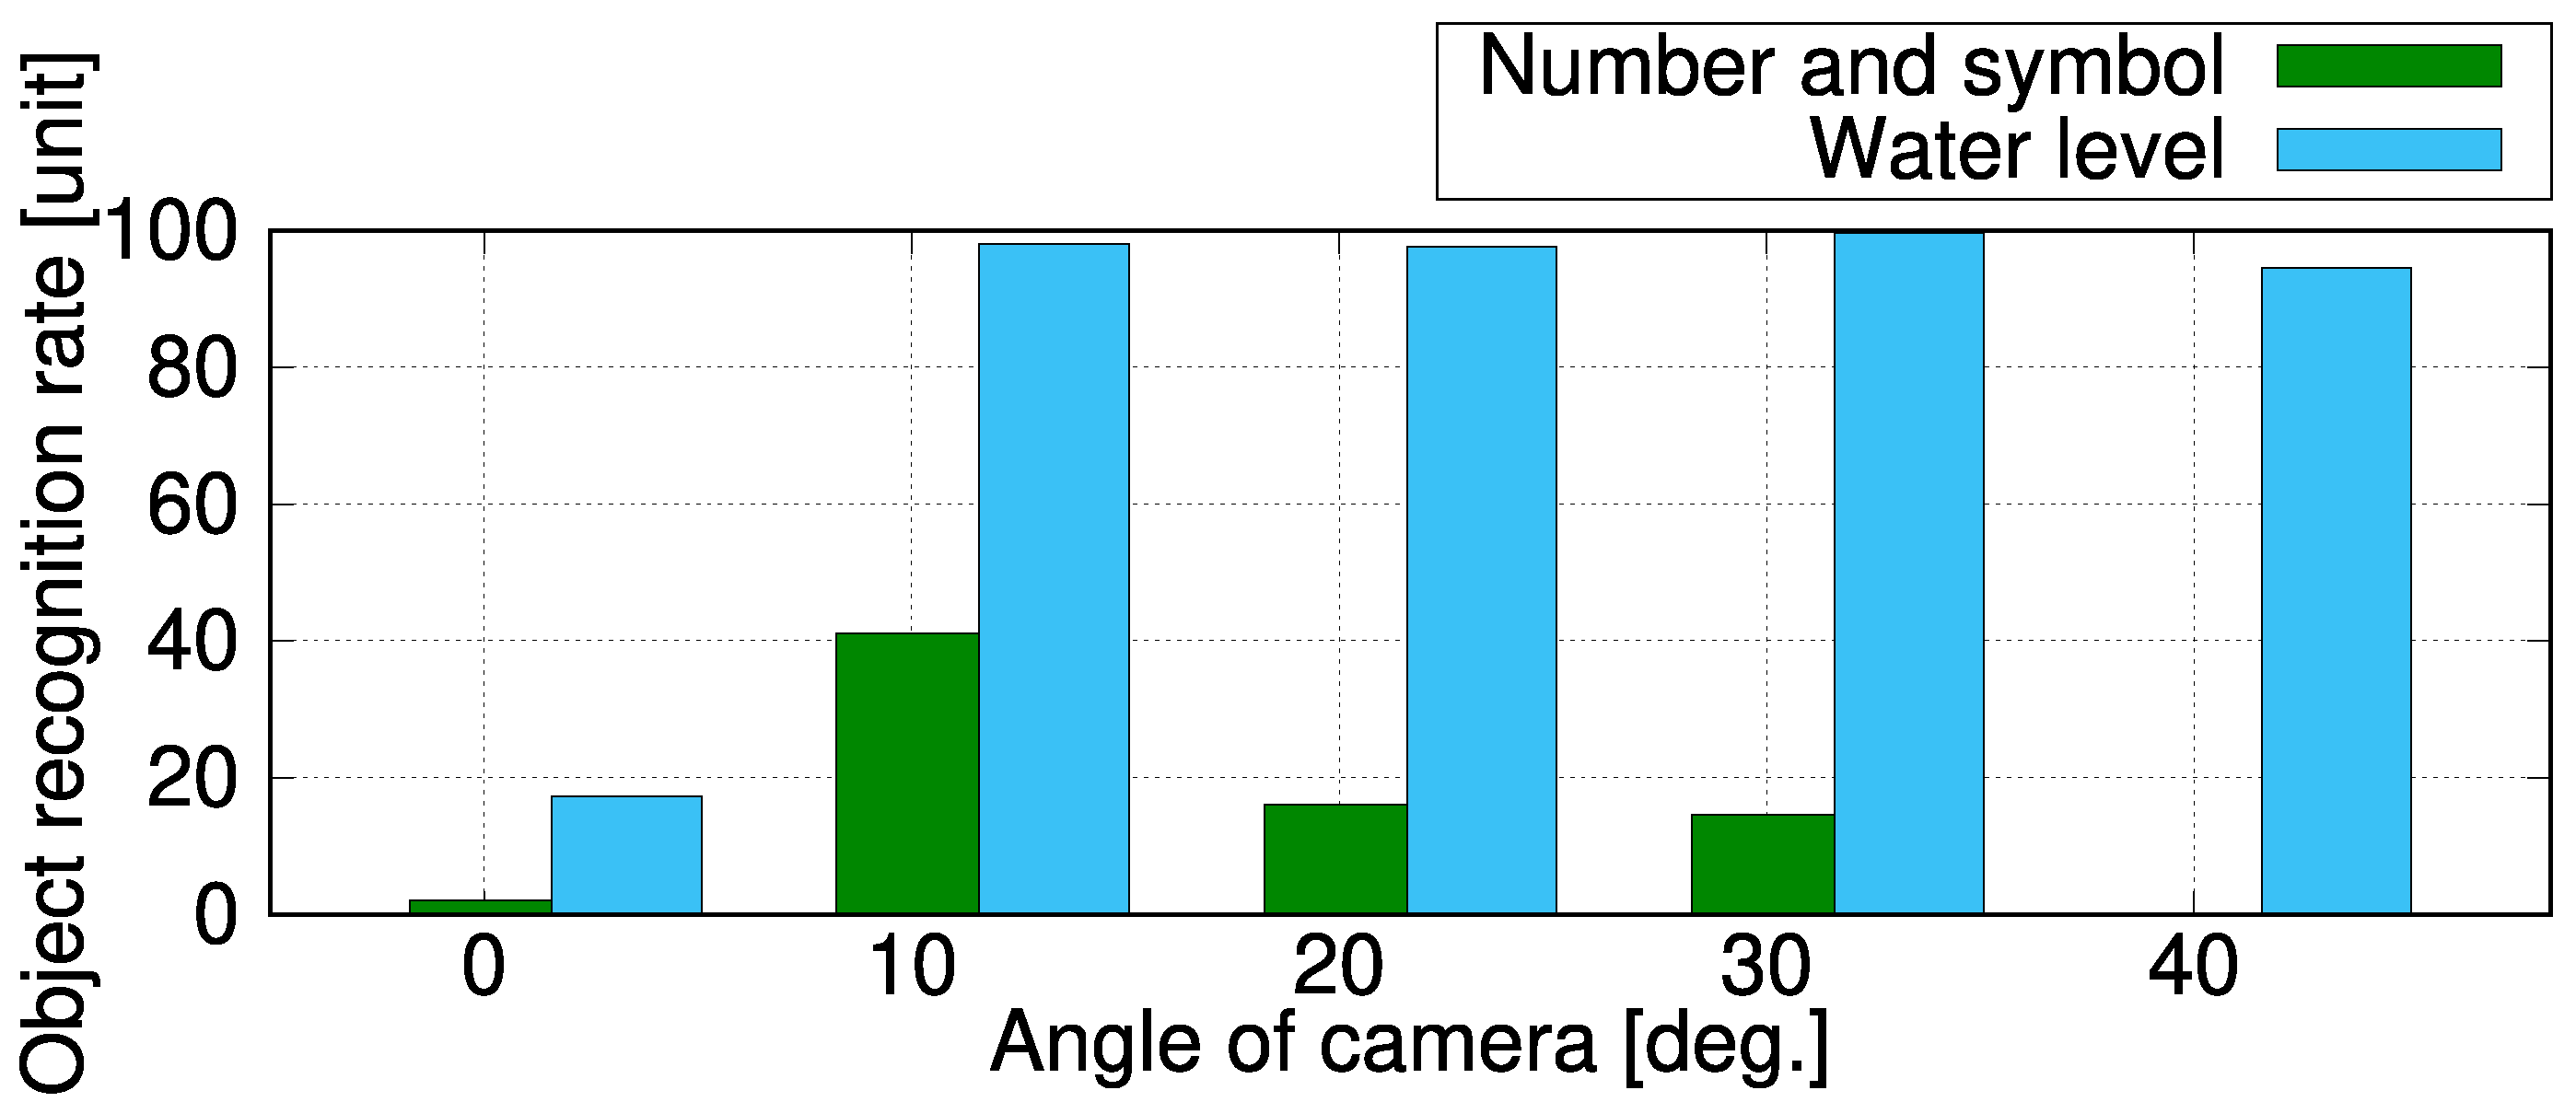
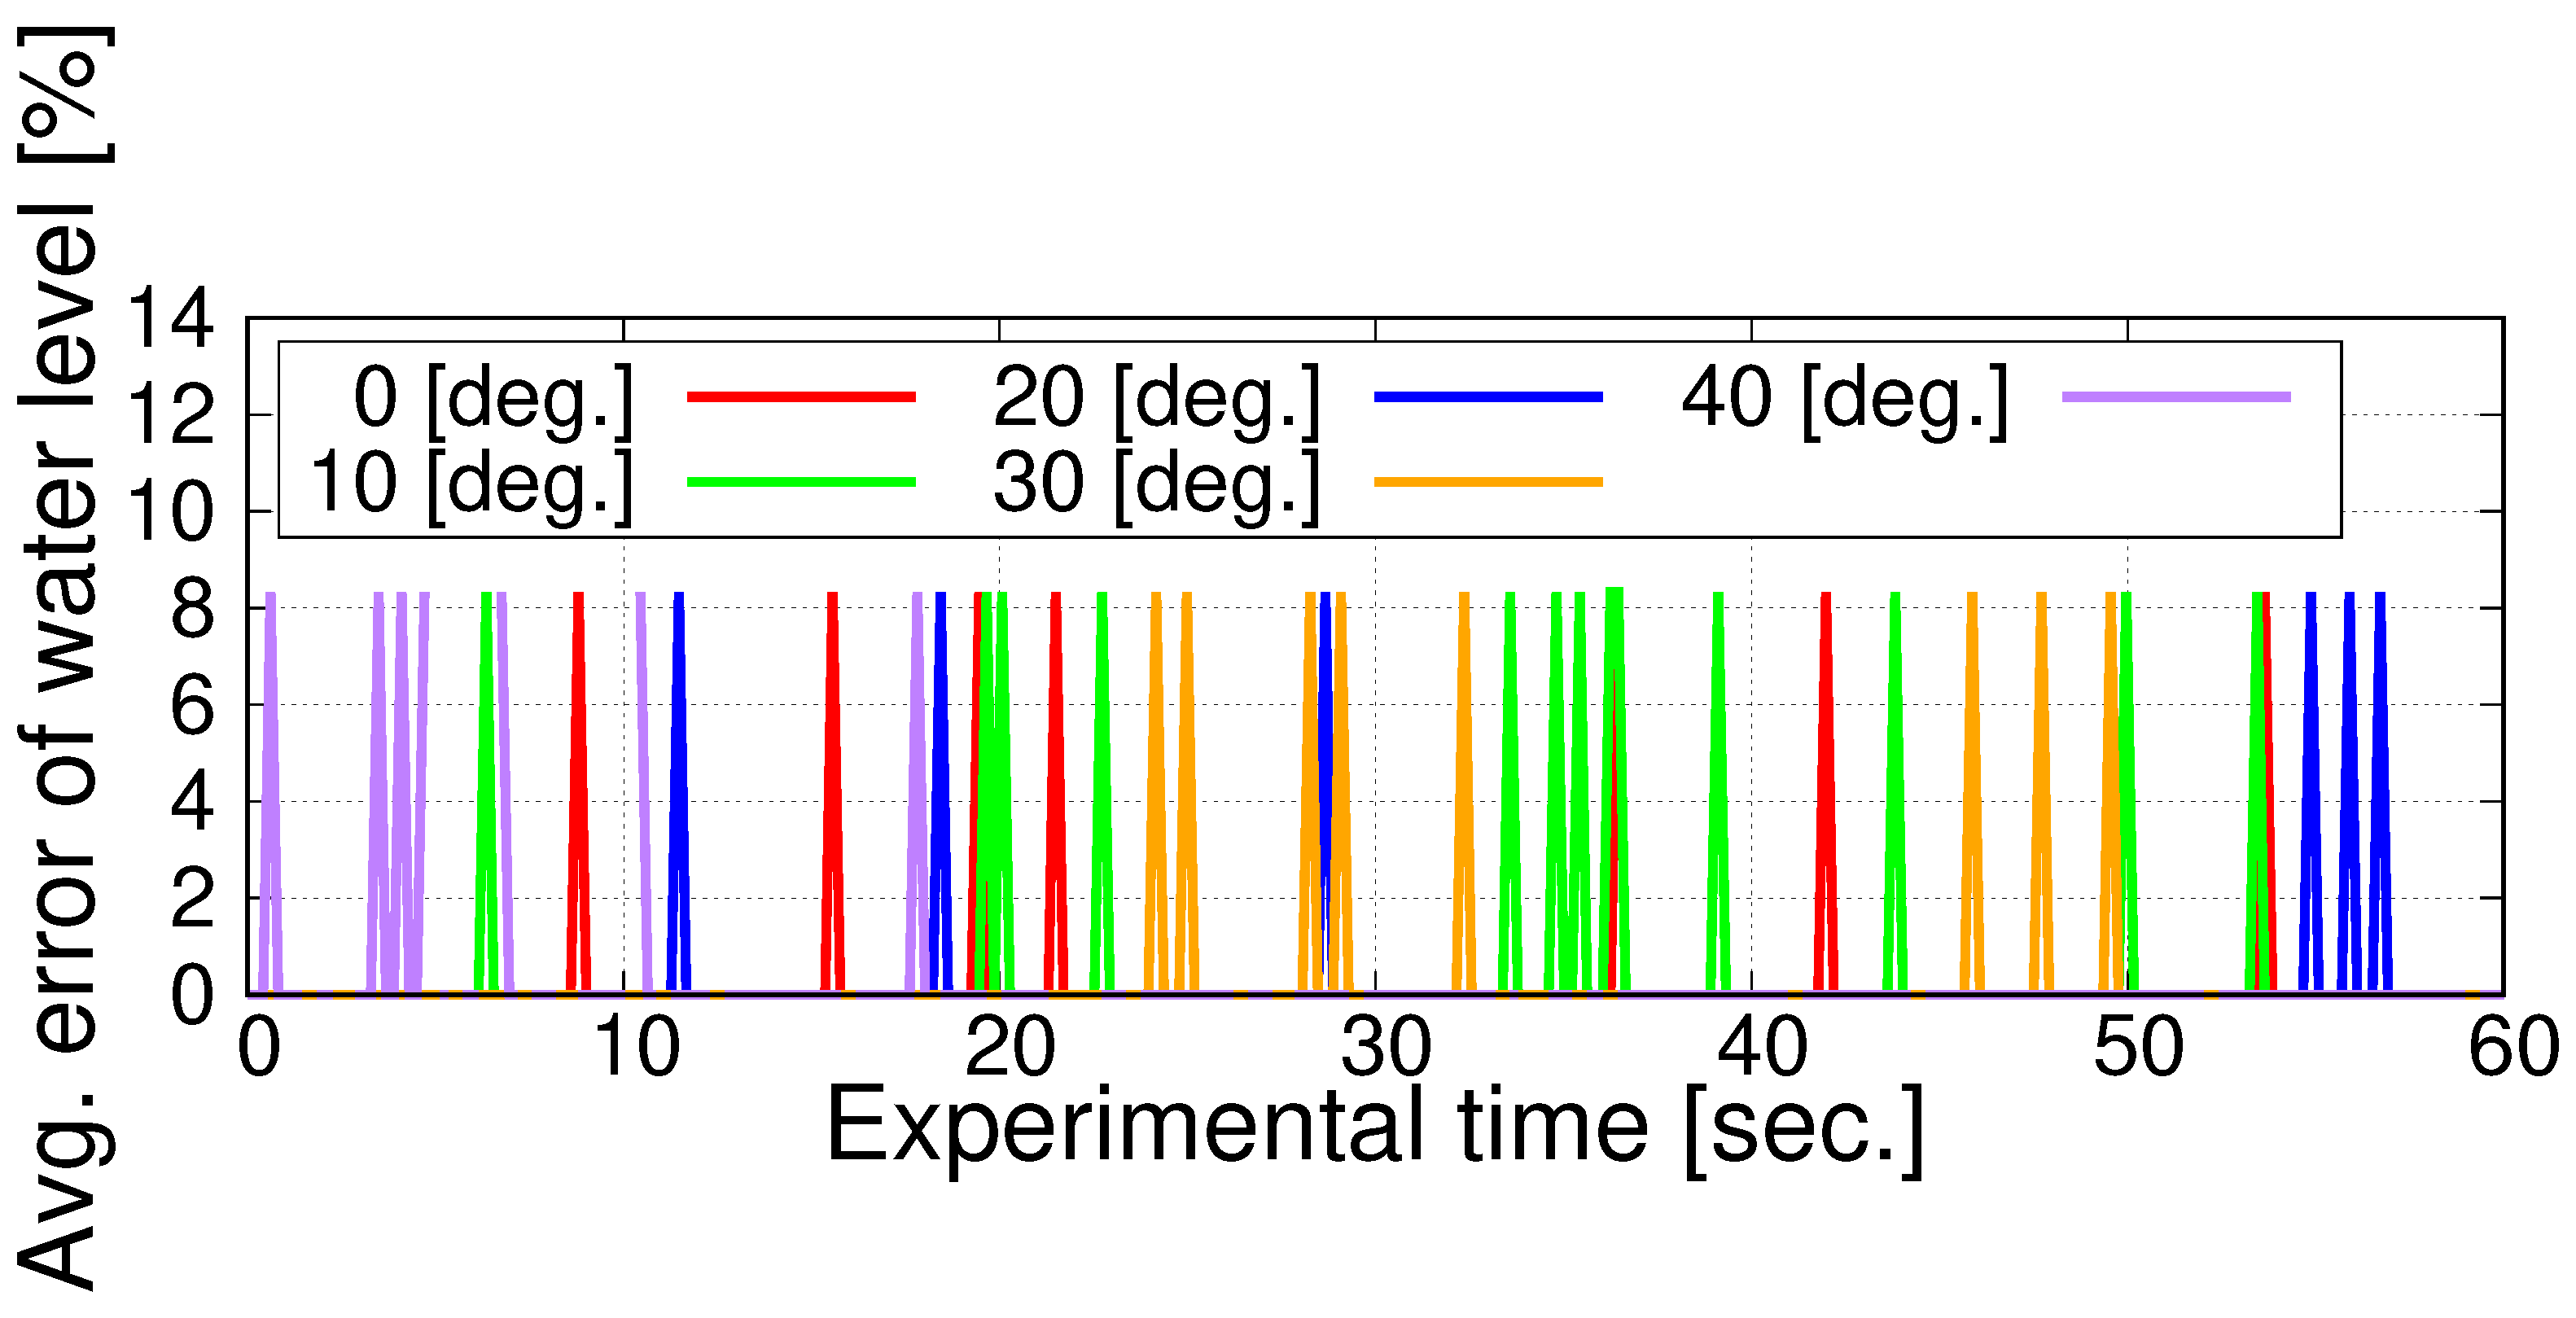
  • The experimental results confirm that the proposed system is capable of estimating transitions between the camera and the water level device gauge from 0 [deg.] to 40 [deg.].
  • The proposed system can reduce the workload of reservoir and river managers.
In future research, we would like to investigate different measurement approaches and develop an infrared device for detecting water levels during the night.

Author Contributions

Conceptualization, C.Y. and T.O.; data curation, C.Y.; investigation, T.S.; methodology, C.Y. and T.O.; project administration, T.O. and T.S.; resources, C.Y.; software, C.Y., T.O., M.H. and K.K.; supervision, T.O. and K.K.; validation, C.Y., T.O., T.S., M.H. and L.B.; visualization, C.Y. and L.B.; writing–original draft, C.Y. and T.O.; writing–review & editing, L.B. All authors have read and agreed to the published version of the manuscript.

Funding

This work was supported by JSPS KAKENHI, grant Number JP24K07993.

Data Availability Statement

Data are contained within the article.

Conflicts of Interest

The authors declare no conflicts of interest.

References

  1. International Federation of Red Cross and Red Crescent Societies (IFRC). World Disasters Report 2022; International Federation of Red Cross and Red Crescent Societies: Geneva, Switzerland, 2022. [Google Scholar]
  2. Cretaux, J.F. Instrumentation and Measurement Technologies for Water Cycle Management; Springer Nature: Cham, Switzerland, 2022. [Google Scholar]
  3. Guo, X.; Zhu, A.; Li, Q.; Chen, R. Improving the Response to Inland Flooding. Science 2021, 374, 831–832. [Google Scholar] [CrossRef]
  4. Scott, D.; Paul, B. A Levee Breach Induced by Internal Erosion in Western Australia. Q. J. Eng. Geol. Hydrogeol. 2021, 55, qjegh2021-037. [Google Scholar]
  5. Dolojan, N.L.J.; Moriguchi, S.; Hashimoto, M.; Xuan Tinh, N.; Tanaka, H.; Terada, K. Hydrologic-geotechnical Modelling of Shallow Landslide and Flood Hazards Caused by Heavy Rainfall. Eng. Geol. 2023, 323, 107184. [Google Scholar] [CrossRef]
  6. Kusudo, T.; Yamamoto, A.; Kimura, M.; Matsuno, Y. Development and Assessment of Water-level Prediction Models for Small Reservoirs Using a Deep Learning Algorithm. Water 2021, 14, 55. [Google Scholar] [CrossRef]
  7. Chen, D.; Liu, Z.; Wang, L.; Dou, M.; Chen, J.; Li, H. Natural Disaster Monitoring with Wireless Sensor Networks: A Case Study of Data-intensive Applications upon Low-cost Scalable Systems. Mob. Netw. Appl. 2021, 18, 651–663. [Google Scholar] [CrossRef]
  8. Yawut, C.; Kilaso, S. A Wireless Sensor Network for Weather and Disaster Alarm Systems. In Proceedings of the 2011 International Conference on Electrical Engineering and Informatics, Bangkok, Thailand, 28–29 May 2011; pp. 155–159. [Google Scholar]
  9. Tanyingyong, V.; Olsson, R.; Hidell, M.; Sjödin, P. Scalable IoT Sensing Systems with Dynamic Sinks. IEEE Internet Things J. 2022, 9, 7211–7227. [Google Scholar] [CrossRef]
  10. Cruzada, C.J.; Francisco, P.; Loyola, R.; Asaba, H.; Flores, F.K.; Peradilla, M. Proposed Real-time Data Aggregation Scheme for Clusterbased WSN Sensor Nodes. In Proceedings of the 18th Asian Internet Engineering Conference (AINTEC), Hanoi, Vietnam, 12–14 December 2023; pp. 54–61. [Google Scholar]
  11. Qiao, G.; Yang, M.; Wang, H. A Water Level Measurement Approach Based on YOlOv5s. Sensors 2022, 22, 3714. [Google Scholar] [CrossRef] [PubMed]
  12. Lo, S.W.; Wu, J.H.; Lin, F.P.; Hsu, C.H. Visual Sensing for Urban Flood Monitoring. Sensors 2015, 15, 20006–20029. [Google Scholar] [CrossRef]
  13. Zhang, Z.; Zhou, Y.; Liu, H.; Zhang, L.; Wang, H. Visual Measurement of Water Level Under Complex Illumination Conditions. Sensors 2019, 19, 4141. [Google Scholar] [CrossRef]
  14. Liao, M.; Wan, Z.; Yao, C.; Chen, K.; Bai, X. Real-time Scene Text Detection with Differentiable Binarization. In Proceedings of the AAAI 34th Conference on Artificial Intelligence, New York, NY, USA, 7–12 February 2020; pp. 11474–11481. [Google Scholar]
  15. Feng, X.; Yao, H.; Qi, Y.; Zhang, J.; Zhang, S. Scene Text Recognition Via Transformer. arXiv 2020, arXiv:2003.08077. [Google Scholar]
  16. Atienza, R. Vision Transformer for Fast and Efficient Scene Text Recognition. In Proceedings of the 16th International Conference on Document Analysis and Recognition (ICDAR), Lausanne, Switzerland, 5–10 September 2021; pp. 319–334. [Google Scholar]
  17. Kukreja, V.; Kumar, D.; Kaur, A. GAN-based Synthetic Data Augmentation for Increased CNN Performance in Vehicle Number Plate Recognition. In Proceedings of the 4th International Conference on Electronics, Communication and Aerospace Technology (ICECA), Coimbatore, India, 5–7 November 2020; pp. 1190–1195. [Google Scholar]
  18. Dang, L.T.A.; Ngoc, V.D.; Thien Vu, P.C.L.; Truong, N.N.; Trinh, T.D. Vietnam Vehicle Number Recognition Based on An Improved CRNN with Attention Mechanism. Int. J. Intell. Transp. Syst. Res. 2024, 22, 374–389. [Google Scholar] [CrossRef]
  19. Zhang, Y.; Hou, J.; Huang, C. Basin Scale Soil Moisture Estimation with Grid SWAT and LESTKF Based on WSN. Sensors 2023, 24, 35. [Google Scholar] [CrossRef] [PubMed]
  20. Sendra, S.; Parra, L.; Jimenez, J.M.; Garcia, L.; Lloret, J. LoRa-based Network for Water Quality Monitoring in Coastal Areas. Mob. Netw. Appl. 2023, 28, 65–81. [Google Scholar] [CrossRef]
  21. Ali, M.A.J.; Jasim, M.N.; Al-Saad, S.N. Novel Smart Water Quality Monitoring System for Iraqi Rivers and Marshes. In Proceedings of the 1st International Conference on Environment and Sustainability (ICEST), Anbar, Iraq, 21 July 2023; pp. 19–30. [Google Scholar]
  22. Kalyanapu, A.; Owusu, C.; Wright, T.; Datta, T. Low-Cost Real-Time Water Level Monitoring Network for Falling Water River Watershed: A Case Study. Geosciences 2023, 13, 65. [Google Scholar] [CrossRef]
  23. Olatinwo, S.O.; Joubert, T.H. Efficient Energy Resource Utilization in a Wireless Sensor System for Monitoring Water Quality. EURASIP J. Wirel. Commun. Netw. 2019, 2019, 6. [Google Scholar] [CrossRef]
  24. Langhammer, J. Flood Simulations Using a Sensor Network and Support Vector Machine Model. Water 2023, 15, 2004. [Google Scholar] [CrossRef]
  25. El-Shafeiy, E.; Alsabaan, M.; Ibrahem, M.I.; Elwahsh, H. Real-time Anomaly Detection for Water Quality Sensor Monitoring Based on Multivariate Deep Learning Technique. Sensors 2023, 23, 8613. [Google Scholar] [CrossRef]
  26. Rosero-Montalvo, P.D.; López-Batista, V.F.; Riascos, J.A.; Peluffo-Ordóñez, D.H. Intelligent WSN System for Water Quality Analysis Using Machine Learning Algorithms: A case Study (Tahuando River from Ecuador). Remote Sens. 2020, 12, 1988. [Google Scholar] [CrossRef]
  27. Sun, Q.; Yang, F.; Yu, X.; Wang, X.; Xu, J.; Cao, N.; Zhang, H.; Wang, L.; Yu, J. Environment Adaptive Deployment of Water Quality Sensor Networks. Int. J. Intell. Syst. 2022, 37, 2911–2925. [Google Scholar] [CrossRef]
  28. Singh, Y.; Walingo, T. Smart Water Quality Monitoring with IoT Wireless Sensor Networks. Sensors 2024, 24, 2871. [Google Scholar] [CrossRef]
  29. Süzen, A.A.; Duman, B.; Şen, B. Benchmark Analysis of Jetson TX2, Jetson Nano and Raspberry Pi Using Deep-CNN. In Proceedings of the 2nd International Congress on Human-Computer Interaction, Optimization and Robotic Applications, Ankara, Turkey, 26–27 June 2020; pp. 1–5. [Google Scholar]
  30. Uddin, M.I.; Alamgir, M.S.; Rahman, M.M.; Bhuiyan, M.S.; Mora, M.A. AI Traffic Control System Based on Deepstream and IoT Using NVIDIA Jetson Nano. In Proceedings of the 2nd International Conference on Robotics, Electrical and Signal Processing Techniques, Dhaka, Bangladesh, 5–7 January 2021; pp. 115–119. [Google Scholar]
  31. Idoudi, M.; Bourennane, E.-B.; Grayaa, K. Wireless Visual Sensor Network Platform for Indoor Localization and Tracking of a Patient for Rehabilitation Task. IEEE Sens. J. 2018, 18, 5915–5928. [Google Scholar] [CrossRef]
  32. Wu, P.F.; Xiao, F.; Sha, C.; Huang, H.P.; Wang, R.C.; Xiong, N.-X. Node Scheduling Strategies for Achieving Full-view Area Coverage in Camera Sensor Networks. Sensors 2018, 17, 1303. [Google Scholar] [CrossRef] [PubMed]
  33. Redmon, J.; Divvala, S.; Girshick, R.; Farhadi, A. You Only Look Once: Unified, Real-time Object Detection. In Proceedings of the IEEE 29th Conference on Computer Vision and Pattern Recognition, Washington, DC, USA, 23–28 June 2016; pp. 779–788. [Google Scholar]
  34. Duong-Nguyen, T.; Hoang, T.; Vo, P.; Le, H. Water Level Estimation Using Sentinel-1 Synthetic Aperture Radar Imagery and Digital Elevation Models. arXiv 2020, arXiv:2012.07627. [Google Scholar]
  35. Asano, M.; Yamaguchi, H.; Okamoto, H. Cavity optomechanical liquid level meter using a twin-microbottle resonator. arXiv 2024, arXiv:2401.12529. [Google Scholar]
  36. Kossieris, S.; Tsiakos, V.; Tsimiklis, G.; Amditis, A. Inland Water Level Monitoring from Satellite Observations: A Scoping Review of Current Advances and Future Opportunities. Remote Sens. 2024, 16, 1181. [Google Scholar] [CrossRef]
Figure 1. Proposed system structure.
Jsan 14 00013 g001
Figure 2. Snapshot of water level device gauge.
Jsan 14 00013 g002
Figure 3. Water levels shown in water level device gauge. (a) Range from 0.0 to 1.0 [m]; (b) range from 1.0 to 2.0 [m]; (c) range from 2.0 to 3.0 [m]; (d) range from 3.0 to 4.0 [m]; (e) range from 4.0 to 5.0 [m].
Jsan 14 00013 g003aJsan 14 00013 g003b
Figure 4. Environment used for experiment.
Jsan 14 00013 g004
Figure 5. Snapshot of sensor node. (a) Placement of sensor node; (b) hardware configuration of sensor node.
Jsan 14 00013 g005
Figure 6. Results of object recognition of numbers and symbols and water level device gauges in images when the water level device gauge is perpendicular to the camera. (a) Original image; (b) visualization result.
Jsan 14 00013 g006
Figure 7. Map of experimental area.
Jsan 14 00013 g007
Figure 8. Positions and angles of cameras for taking images of water level device gauge.
Jsan 14 00013 g008
Figure 9. Snapshot of experimental environment. (a) 0 [deg.]; (b) 10 [deg.]; (c) 20 [deg.]; (d) 30 [deg.]; (e) 40 [deg.].
Jsan 14 00013 g009aJsan 14 00013 g009b
Figure 10. Image obtained by sensor node: original data. (a) 0 [deg.]; (b) 10 [deg.]; (c) 20 [deg.]; (d) 30 [deg.]; (e) 40 [deg.].
Jsan 14 00013 g010
Figure 11. Results for original data based on object recognition. (a) 0 [deg.]; (b) 10 [deg.]; (c) 20 [deg.]; (d) 30 [deg.]; (e) 40 [deg.].
Jsan 14 00013 g011
Figure 12. Experimental results of recognition rate for different camera angles using original data.
Jsan 14 00013 g012
Figure 13. Conversion from original data to grayscale data. (a) 0 [deg.]; (b) 10 [deg.]; (c) 20 [deg.]; (d) 30 [deg.]; (e) 40 [deg.].
Jsan 14 00013 g013
Figure 14. Results for grayscale data based on object recognition. (a) 0 [deg.]; (b) 10 [deg.]; (c) 20 [deg.]; (d) 30 [deg.]; (e) 40 [deg.].
Jsan 14 00013 g014
Figure 15. Experimental results of recognition rate for different camera angles using grayscale data.
Jsan 14 00013 g015
Figure 16. Experimental results on water level errors over time using grayscale data for different camera angles.
Jsan 14 00013 g016
Disclaimer/Publisher’s Note: The statements, opinions and data contained in all publications are solely those of the individual author(s) and contributor(s) and not of MDPI and/or the editor(s). MDPI and/or the editor(s) disclaim responsibility for any injury to people or property resulting from any ideas, methods, instructions or products referred to in the content.

