The sample period for our empirical econometric analysis begins at the start of the 20th century and ends in 2015. However, the Norwegian economy of 1900 had a pre-history in the 1800s, which is relevant for understanding the development that took place in the first decade of our main sample period. I therefore first comment on some important trends of the last part of the 19th century, see
Section 2.1. I then turn to the development after 1900, which was marked by the end of mass emigration and of the underemployment that it reflected, see
Section 2.2. The other parts of the chapter,
Section 2.3,
Section 2.4,
Section 2.5 and
Section 2.6, contain a presentation of the time series for unemployment and productivity, and discuss the development of labour market regulation and institutions. The dual, sometimes conflicting, developments towards product market deregulation and globalization, and a strong trait of collective regulation of the labour market, is a main theme. That section also gives the backdrop for the empirical modelling, including the assessment of the relevance of the economic theory of wages, see
Section 3, which of course is central in the econometric models in
Section 4.
2.3. Unemployment and Productivity
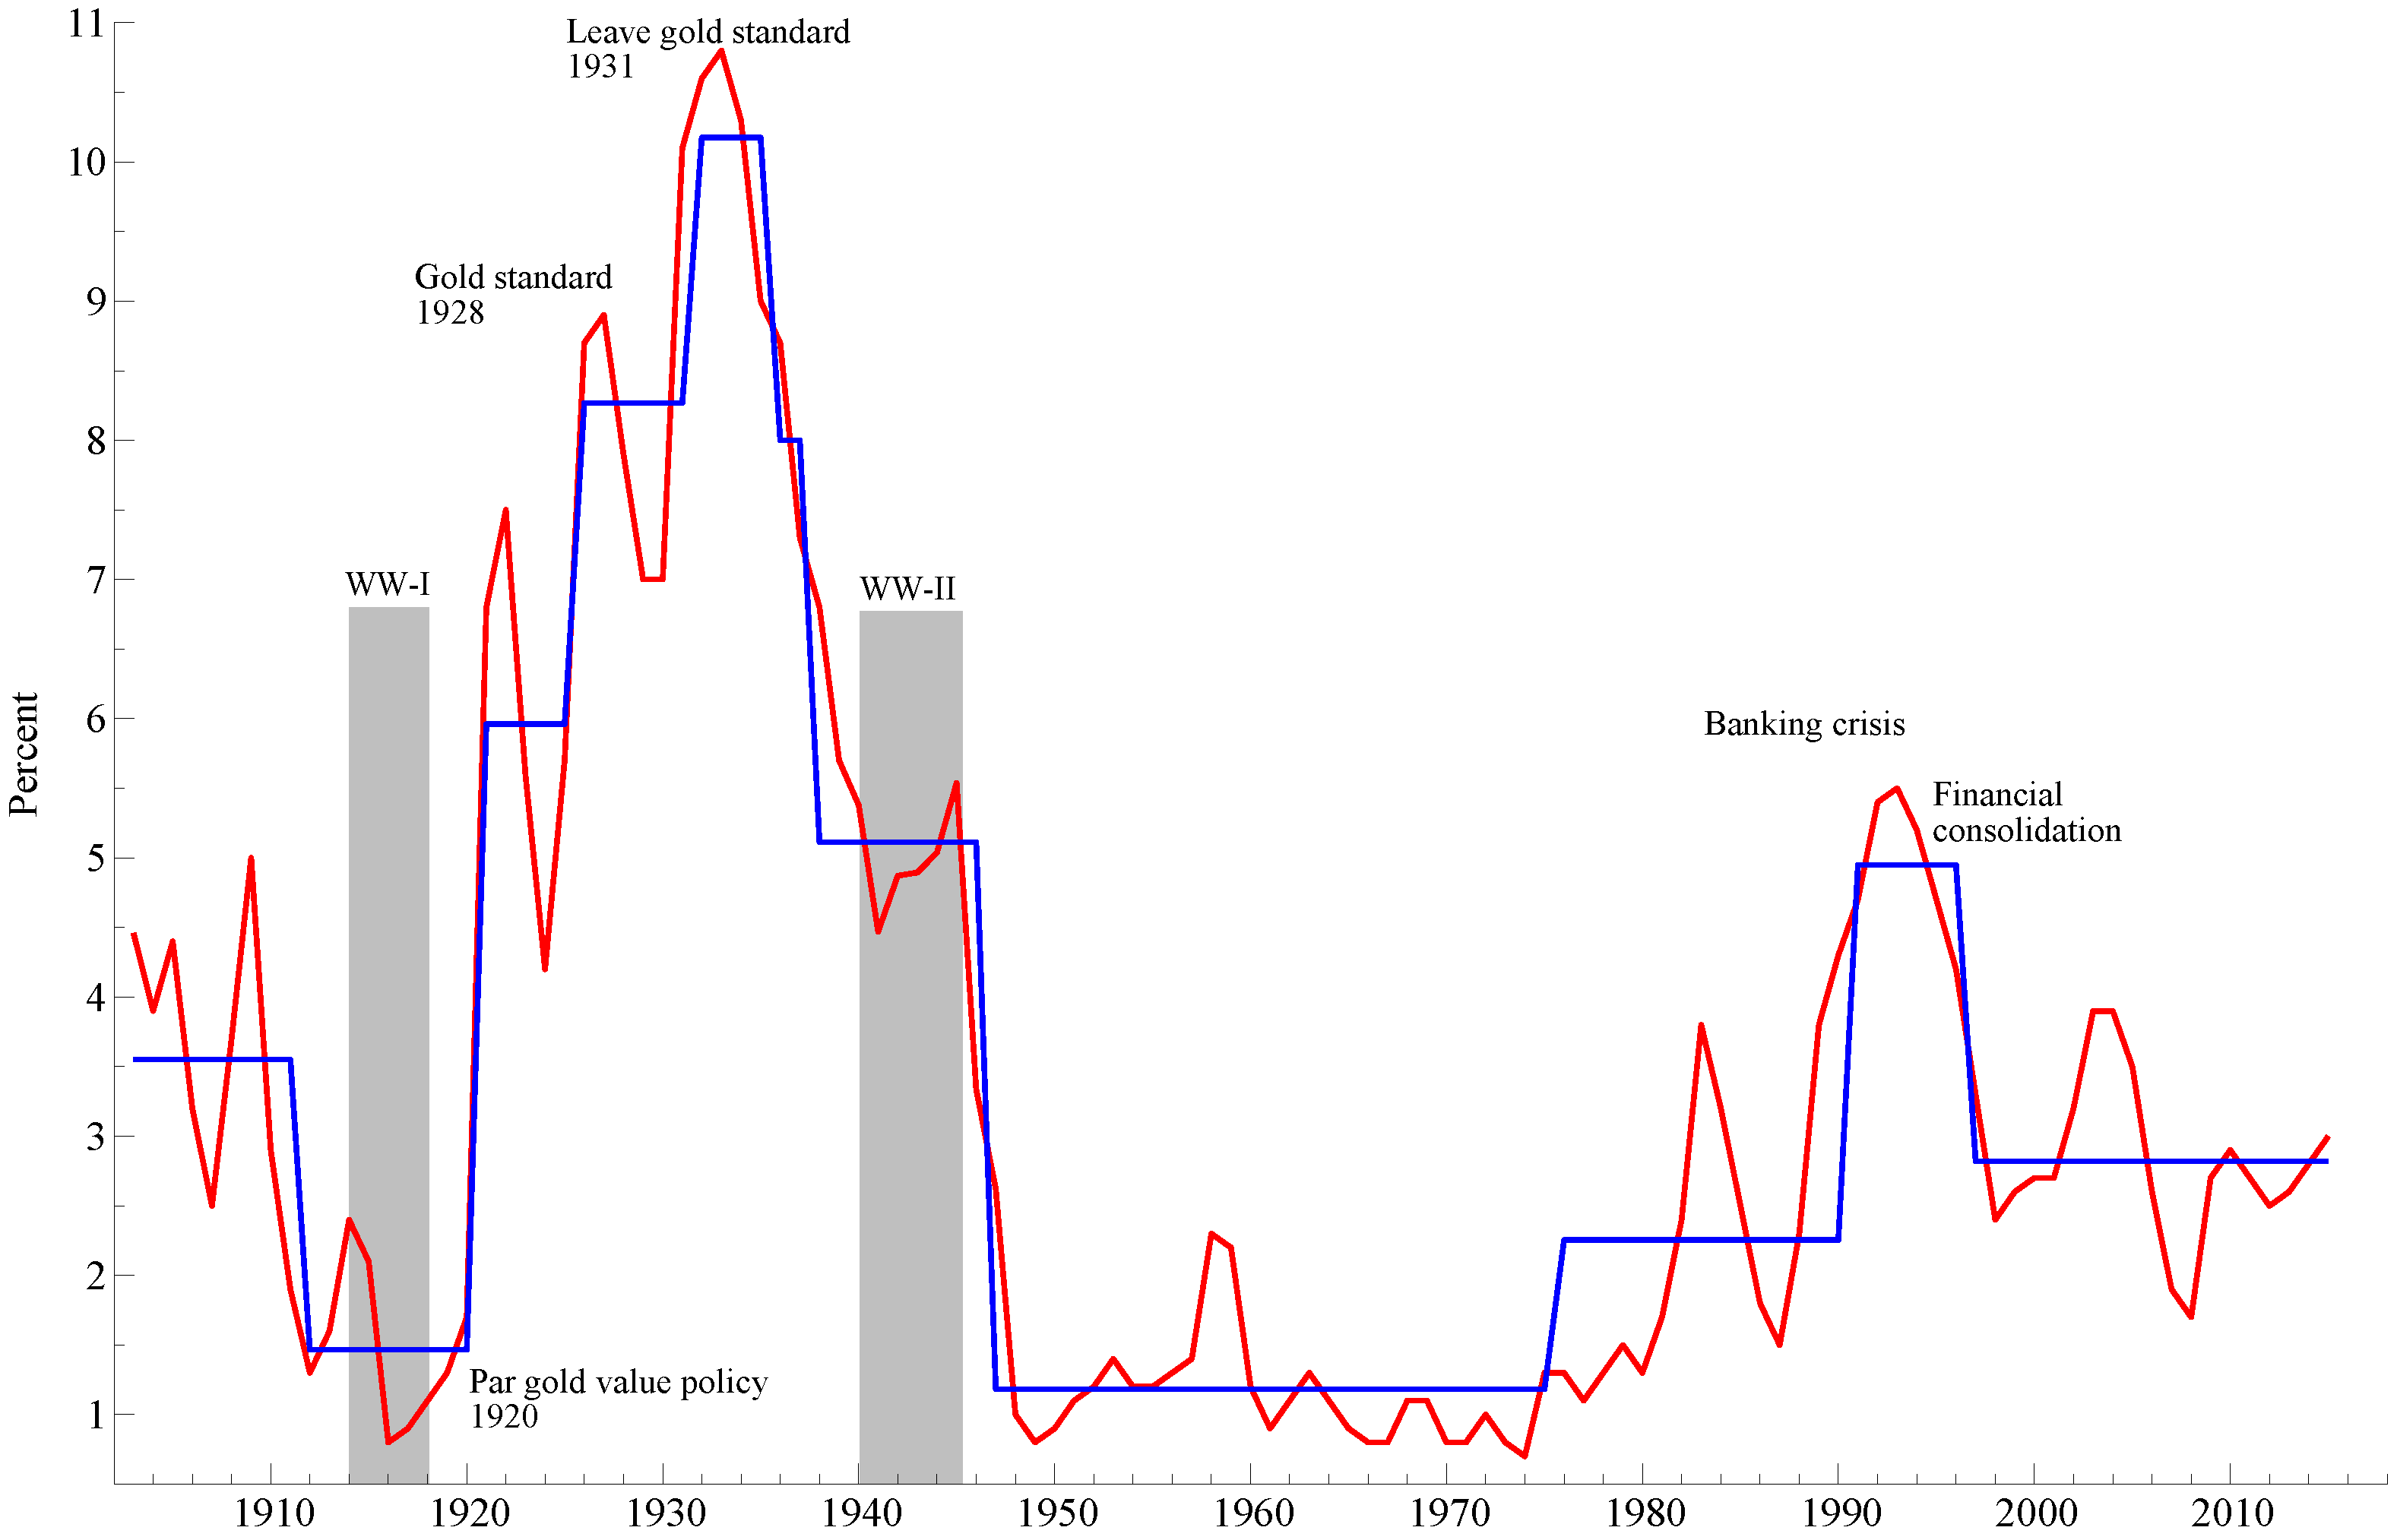
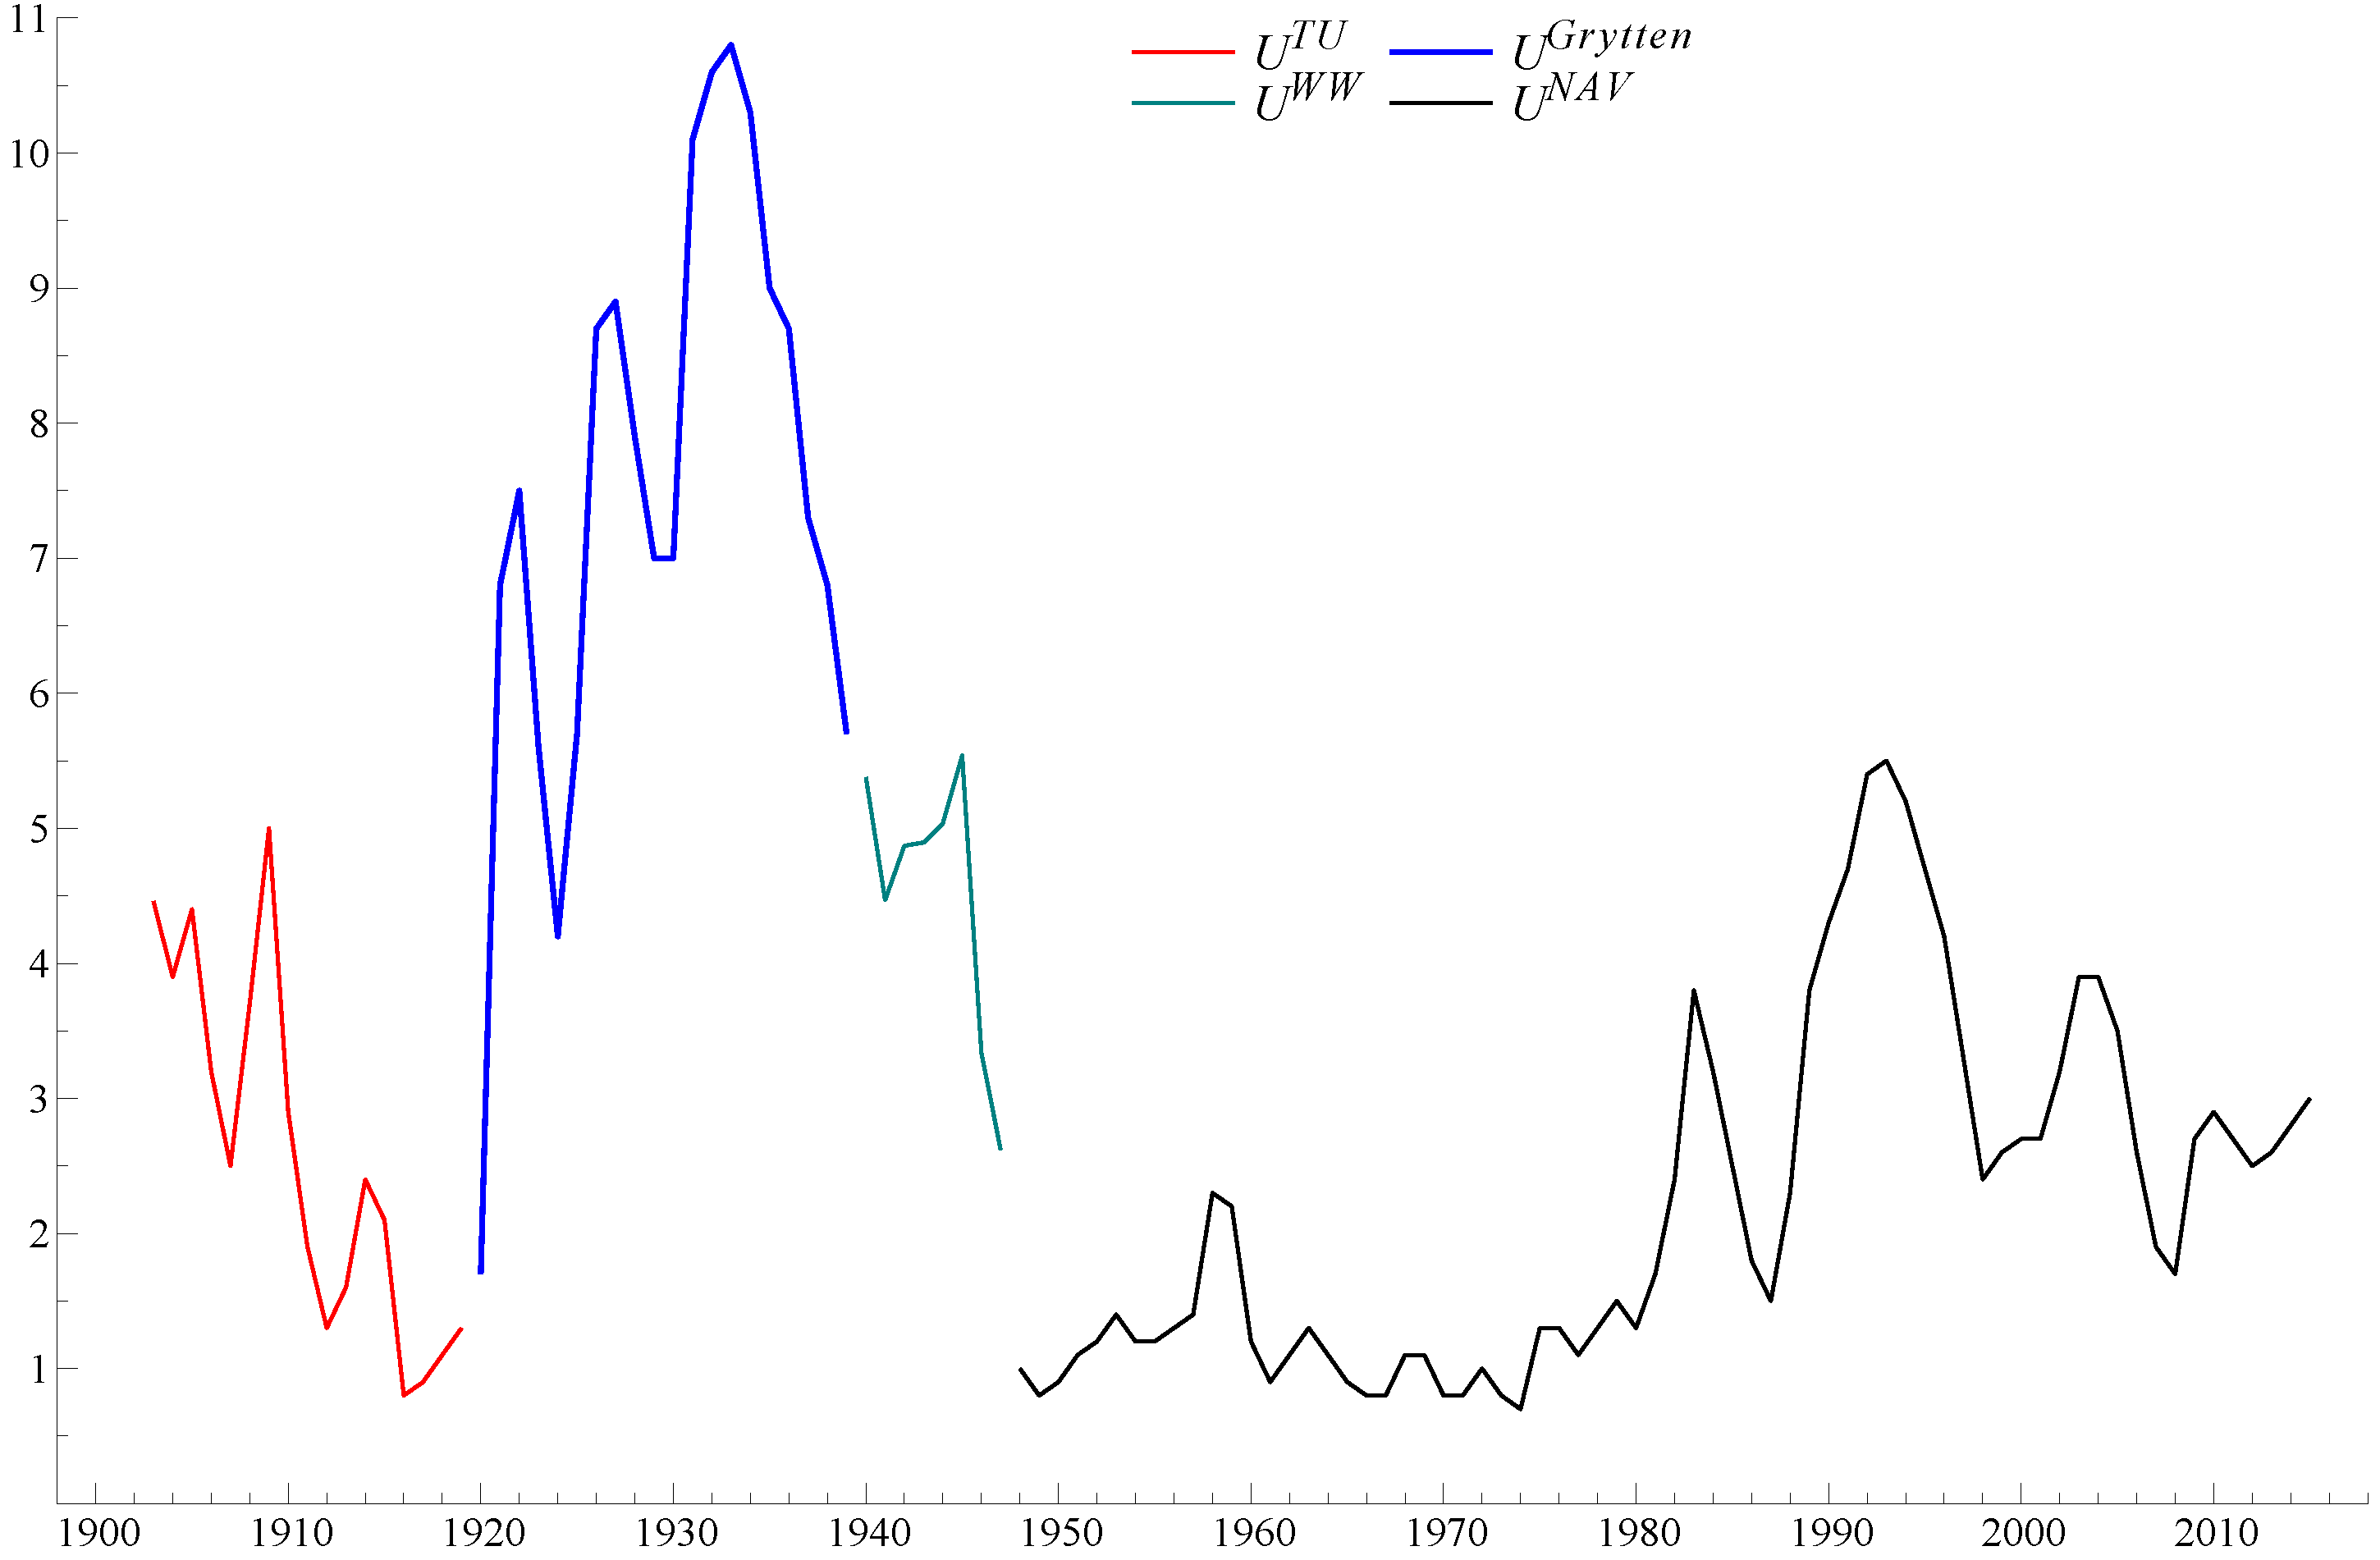
The boom during WW-I continued until 1919, but was stopped short in 1920 by a deflationary economic policy in the western European economies, notably the UK and Sweden, Norway’s most important trading partners. This policy was monitored by the central banks in order to decrease prices, and thereby increase the value of their currencies back to par gold values. Norway followed suit, and one of the deflationary consequences was the increase in the rate of unemployment seen in
Figure 2. The gold-parity target was reached in 1928, but Norway, again following Bank of England’s example, left the gold standard in September 1931. Monetary policy came off the deflationary track that had been followed (with only a few stops) since 1920. Lowered central bank interest rates may have contributed to higher economic activity. Other, more indirect effects of the policy change may also have been important. The international value of the krone was lowered, which made it easier to successfully compete for market shares in the export market, and in the domestic market against imported goods. Fiscal policy, after a while along “Keynesian lines”, may have contributed to the fall in unemployment. However, the main impression is that budget discipline was given priority, also during the years with Labour party rule in the 1930s, see Grytten (2008) [
17].
Although the historians still debate the causes, the depression in the 1930s was less severe in Norway (and Sweden), than in many other western european countries, and the USA. In Norway, the 1920s was a tougher decade than the late 1930s. As noted, Grytten (2008) [
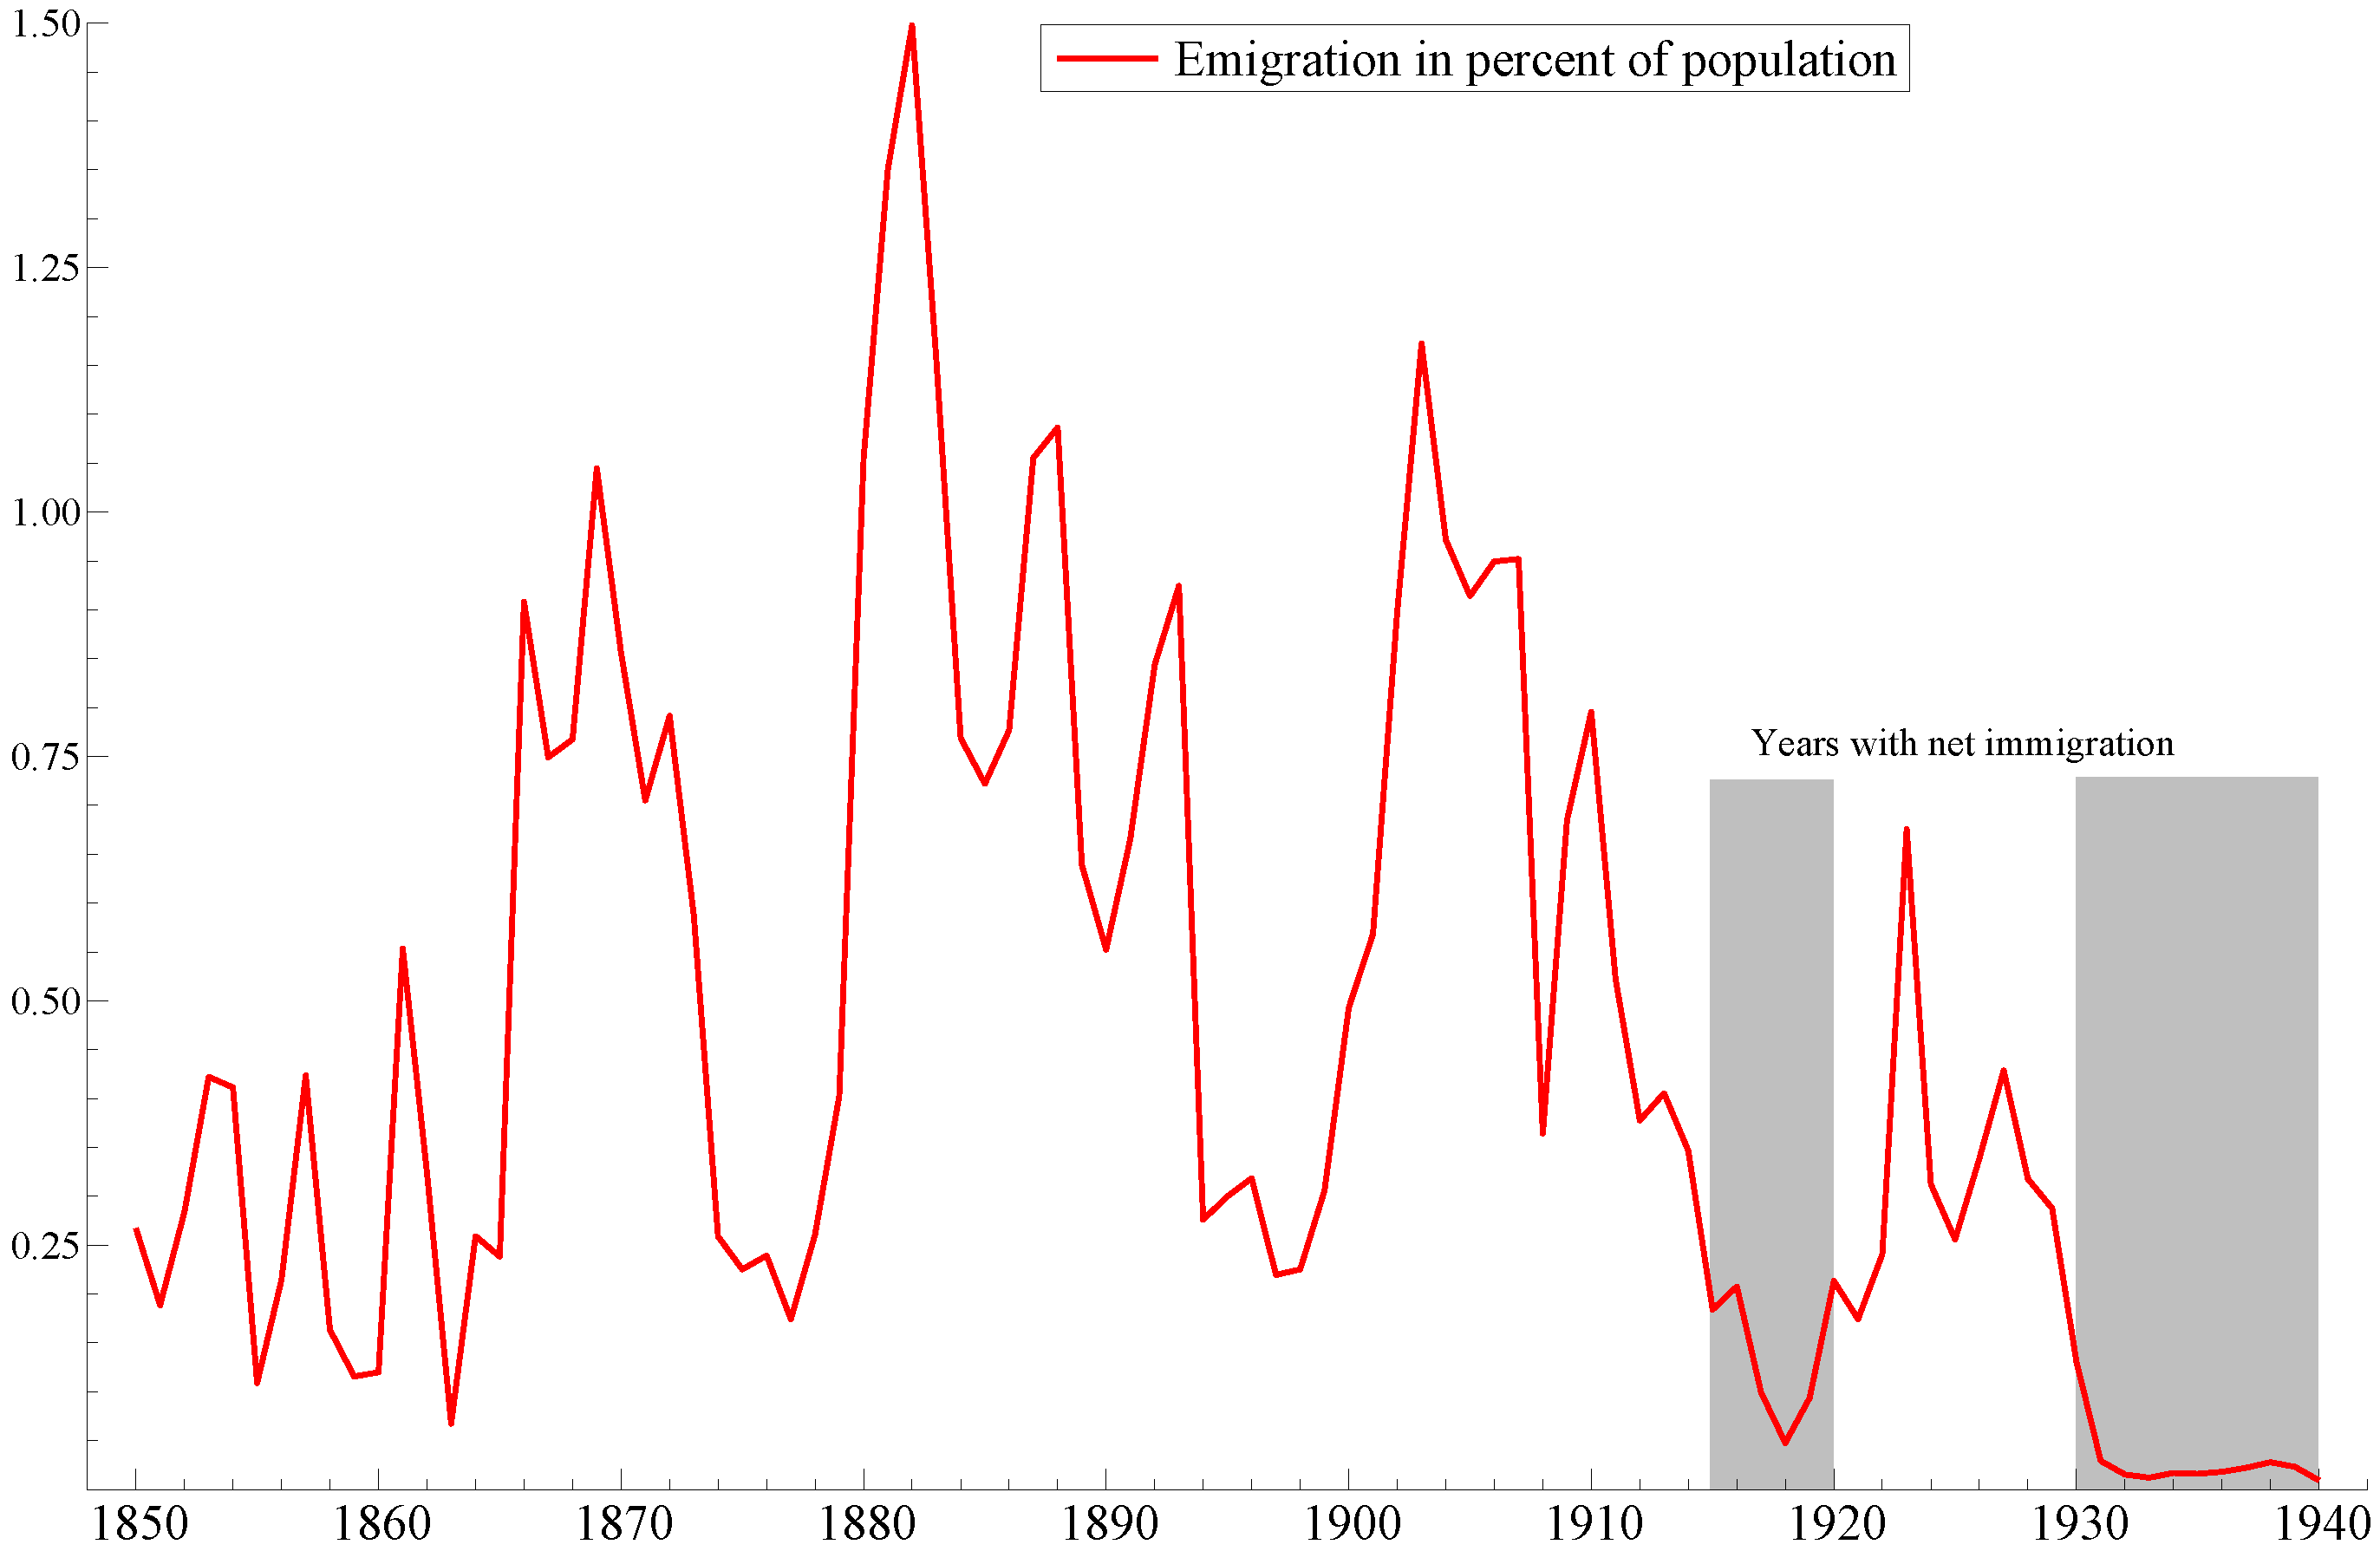
17] finds it noteworthy that unemployment did not fall more during the 1930s, but pointed to the increased labour supply noted due to (re-)immigration as an important explanatory factor of relatively high unemployment rates, see
Figure 2.
The unemployment rates for the Nazi occupation years have been constructed by utilizing an empirical post-war relationship between employment growth and unemployment, as explained in the data appendix. The result is a series which shows an unemployment rate during occupation that was lower than in any year between 1921 and 1939. Unemployment may have been even lower, as the historians argue, see Hodne and Grytten (2002) [
18] and Bjørnhaug and Halvorsen (2009) [
19] (p. 124). In any case, mass unemployment was a thing of the past already in the first war years. With the exception of 1983–1984, unemployment stayed below 3 percent right until the housing price crash and the banking crisis in 1990–1991
9.
Productivity is one of the main determinants of the trend growth in real wages, and ultimately also of living standards. Conversely, the trend in productivity can be conditioned by the system of wage formation. In particular during epochs of full employment, collective wage setting may “free” more labour to move to the more efficient production units, than a local and individual wage setting will do, see Barth et al. (2014) [
22]. Hence, labour market regulation with collective agreements needs not be an impediment to productivity growth. On the contrary, it can be a productivity increasing factor, since it makes a larger share of the employment work with the latest and best technology, Barth and Moene (2015) [
23].
Labour productivity is also shaped by many other factors than organization of the labour market. For a country at the technological frontier, productivity improvement depends on innovations, education and institutions, and these dimensions are interdependent as well. Over long historical periods, any one country is however likely to find itself lagging in development and adaptation of new technologies. Although, at first thought such countries must surely catch-up relatively easily, the evidence shows that this does not always happen. One explanation may again be that institutions are also important for technology adaptation and copying, see Bergeaud et al. (2015 ) [
24].
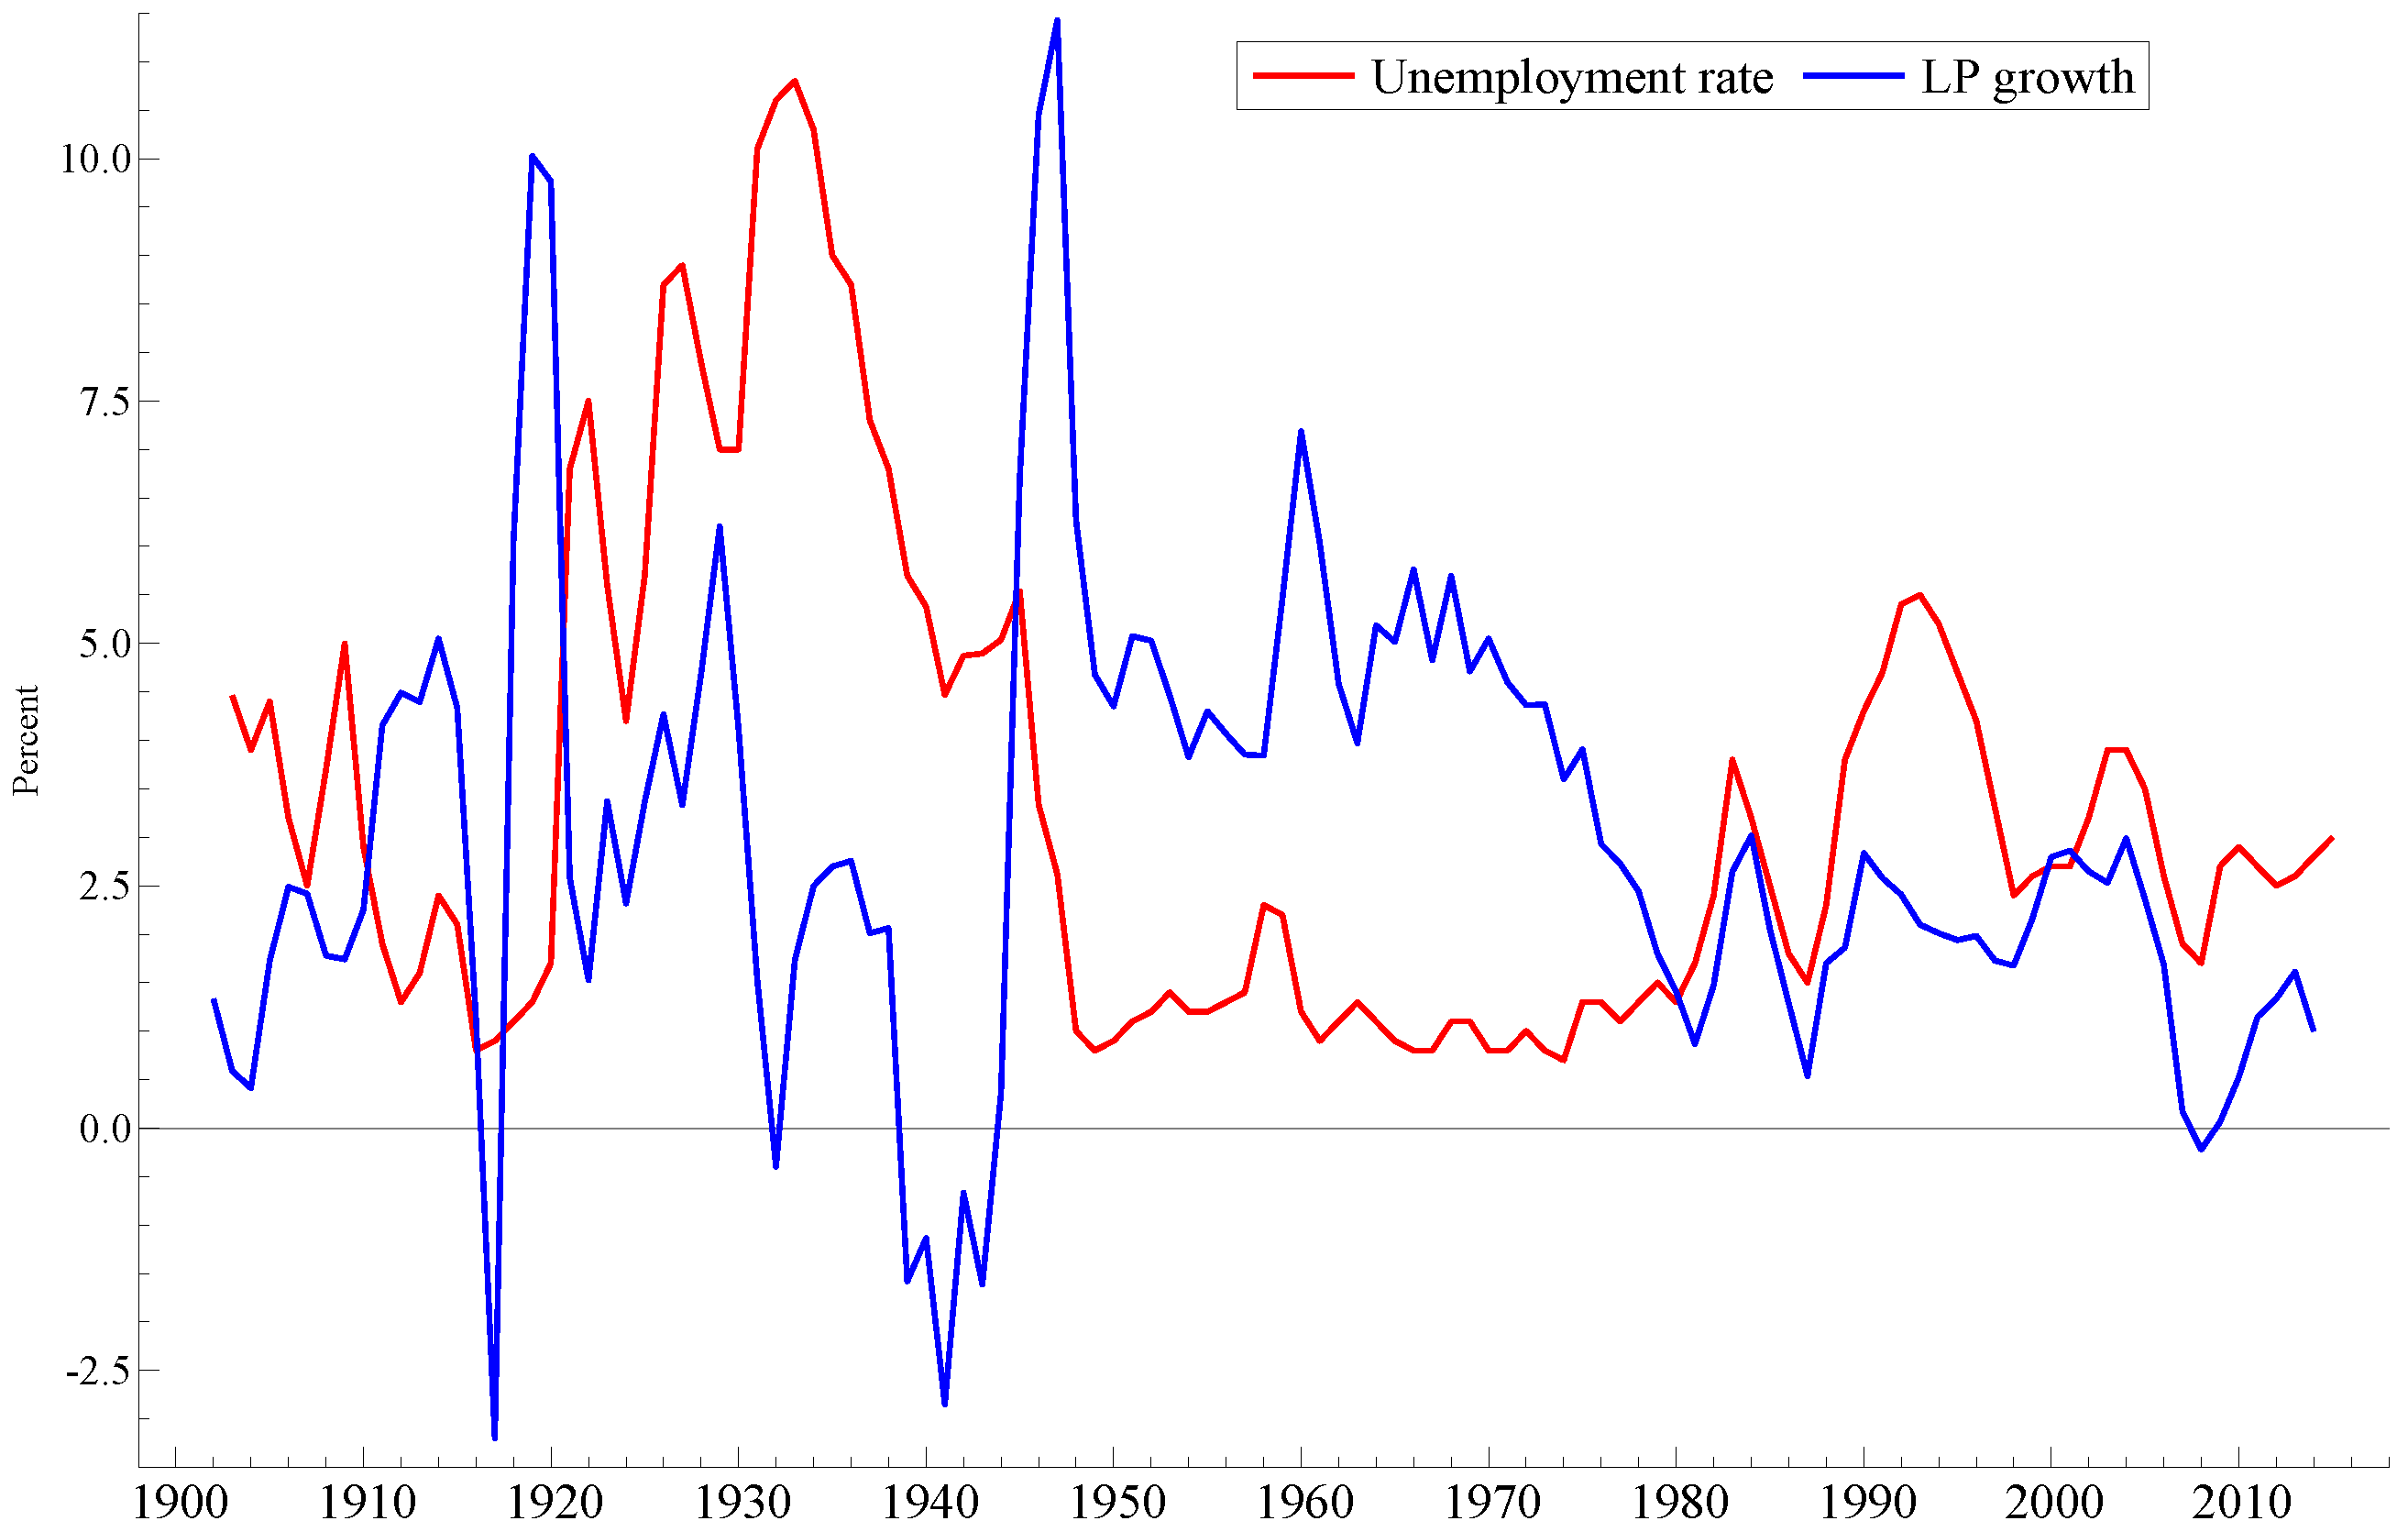
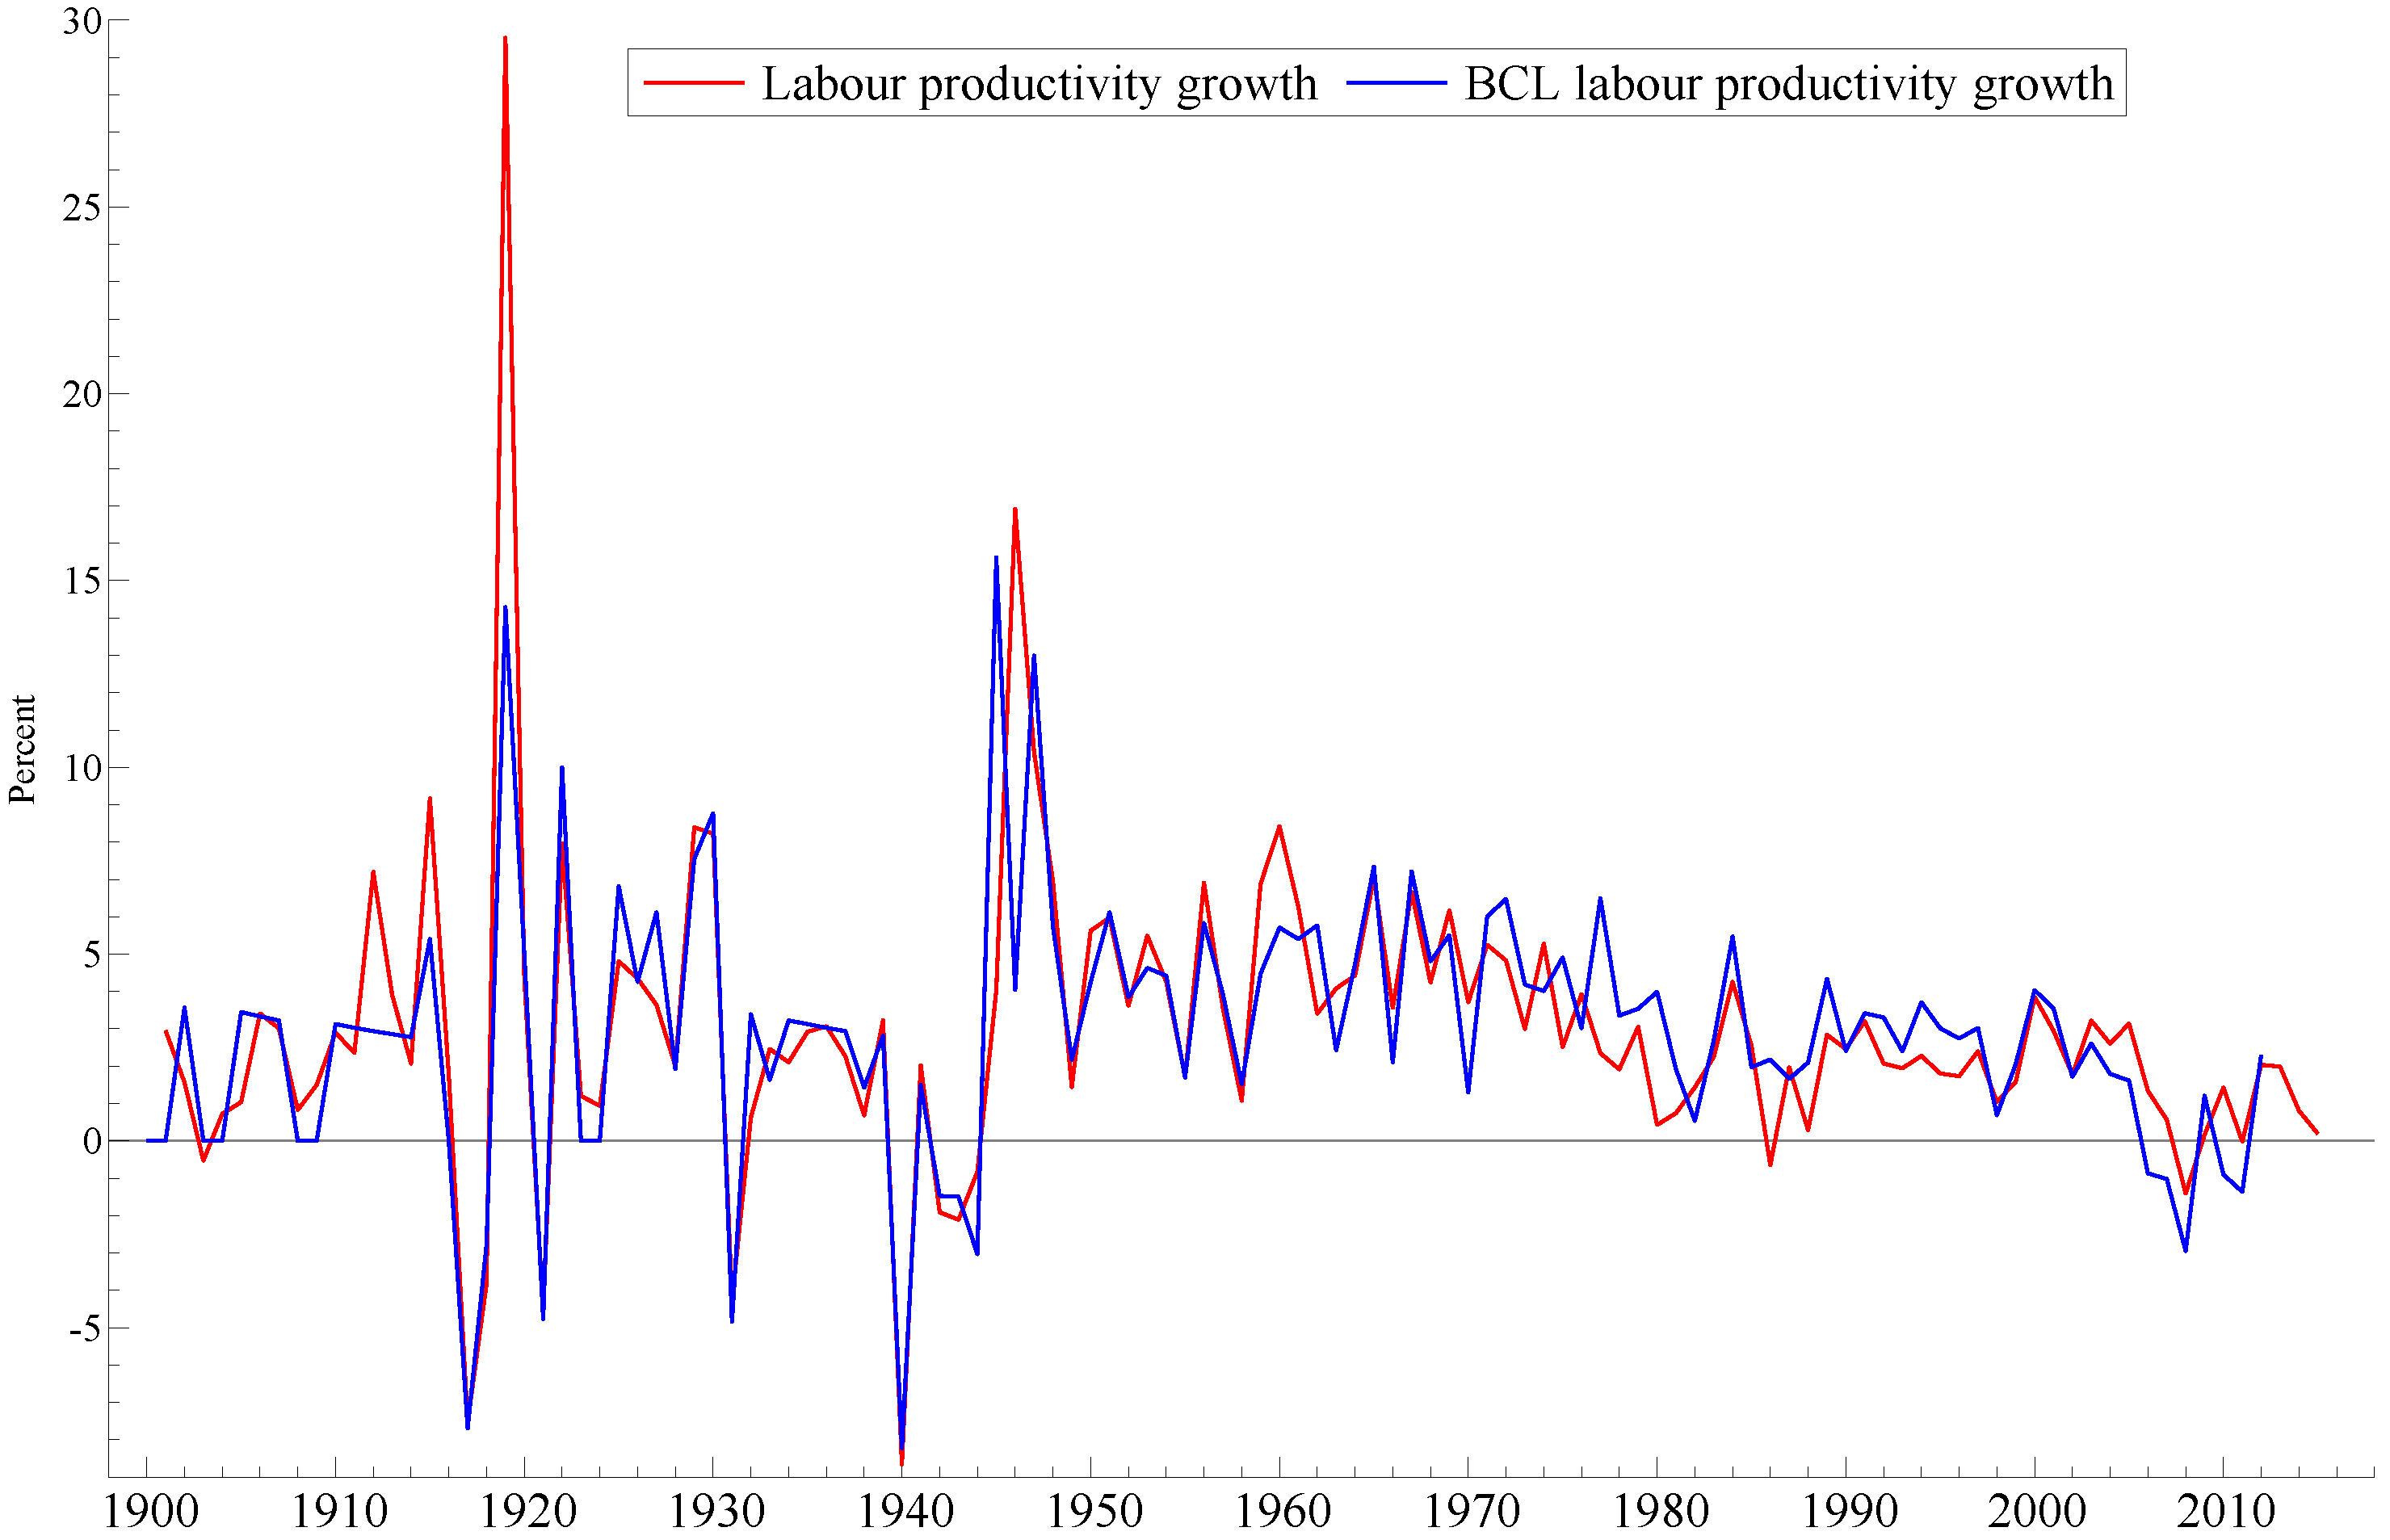
Figure 3 plots LP-growth together with the rate of unemployment for comparison. Three epochs are evident. First, productivity growth was very volatile until WW-II. Second, productivity growth was both high and relatively stable, from the beginning of the re-building period until the second half of the 1970s. The 1980s and 1990s were characterised by lower productivity growth. By and large, this performance after the WW-II is not very different from other western European countries, cf. Bergeaud et al. (2015) [
24].
As we will discuss below, collective bargaining became the main principle already before the occupation. Although the system may have been at its strongest in the 1950s and 1960s, it is still in place today. Hence, it does not seem that a break in labour market regulation can explain the secular drop in LP growth towards the end of the sample. Neither is there a simple and stable correlation between LP growth and unemployment. The graphs show examples of positive correlation (1920s and 1930s), high LP growth together with constant and full employment (1946–1975), and a few examples of negative correlation as well.
2.4. Labour Market Regulation
Hydroelectric power, and new electrotechnical and electrochemical industries led to industrialisation of Norway at the start of the 20th century. These and other new large scale industries that had developed during the 1880s, were organised in ways that regulated competition. As a result, the 1900s started with a movement away from free trade and market liberalism in some important product markets
10. Hence a wider acceptance of the legitimacy of protection against unwanted competition was “in the air”, and this may have favoured changes in the regulation of the labour market, where collective agreements took over from individualised work contracts as the main principle. The late industrialisation of Norway may have been a blessing, since society escaped the fractures that decades of socially harsh “Victorian” liberalism would have created. Not that the conservative paternalism of 19th century Norwegian capitalism represented any less of an impediment for the individual worker and his family, as the very high emigration rates also were evidence of.
And of course, the growth of trade unions and the acceptance of collective bargaining did not happen without conflict. The Norwegian trade union confederation (LO) was formed in 1899, and the first decades was marked by struggles to limit competition for jobs and to push for higher wages, Olstad (2009) [
4] (p. 89). As
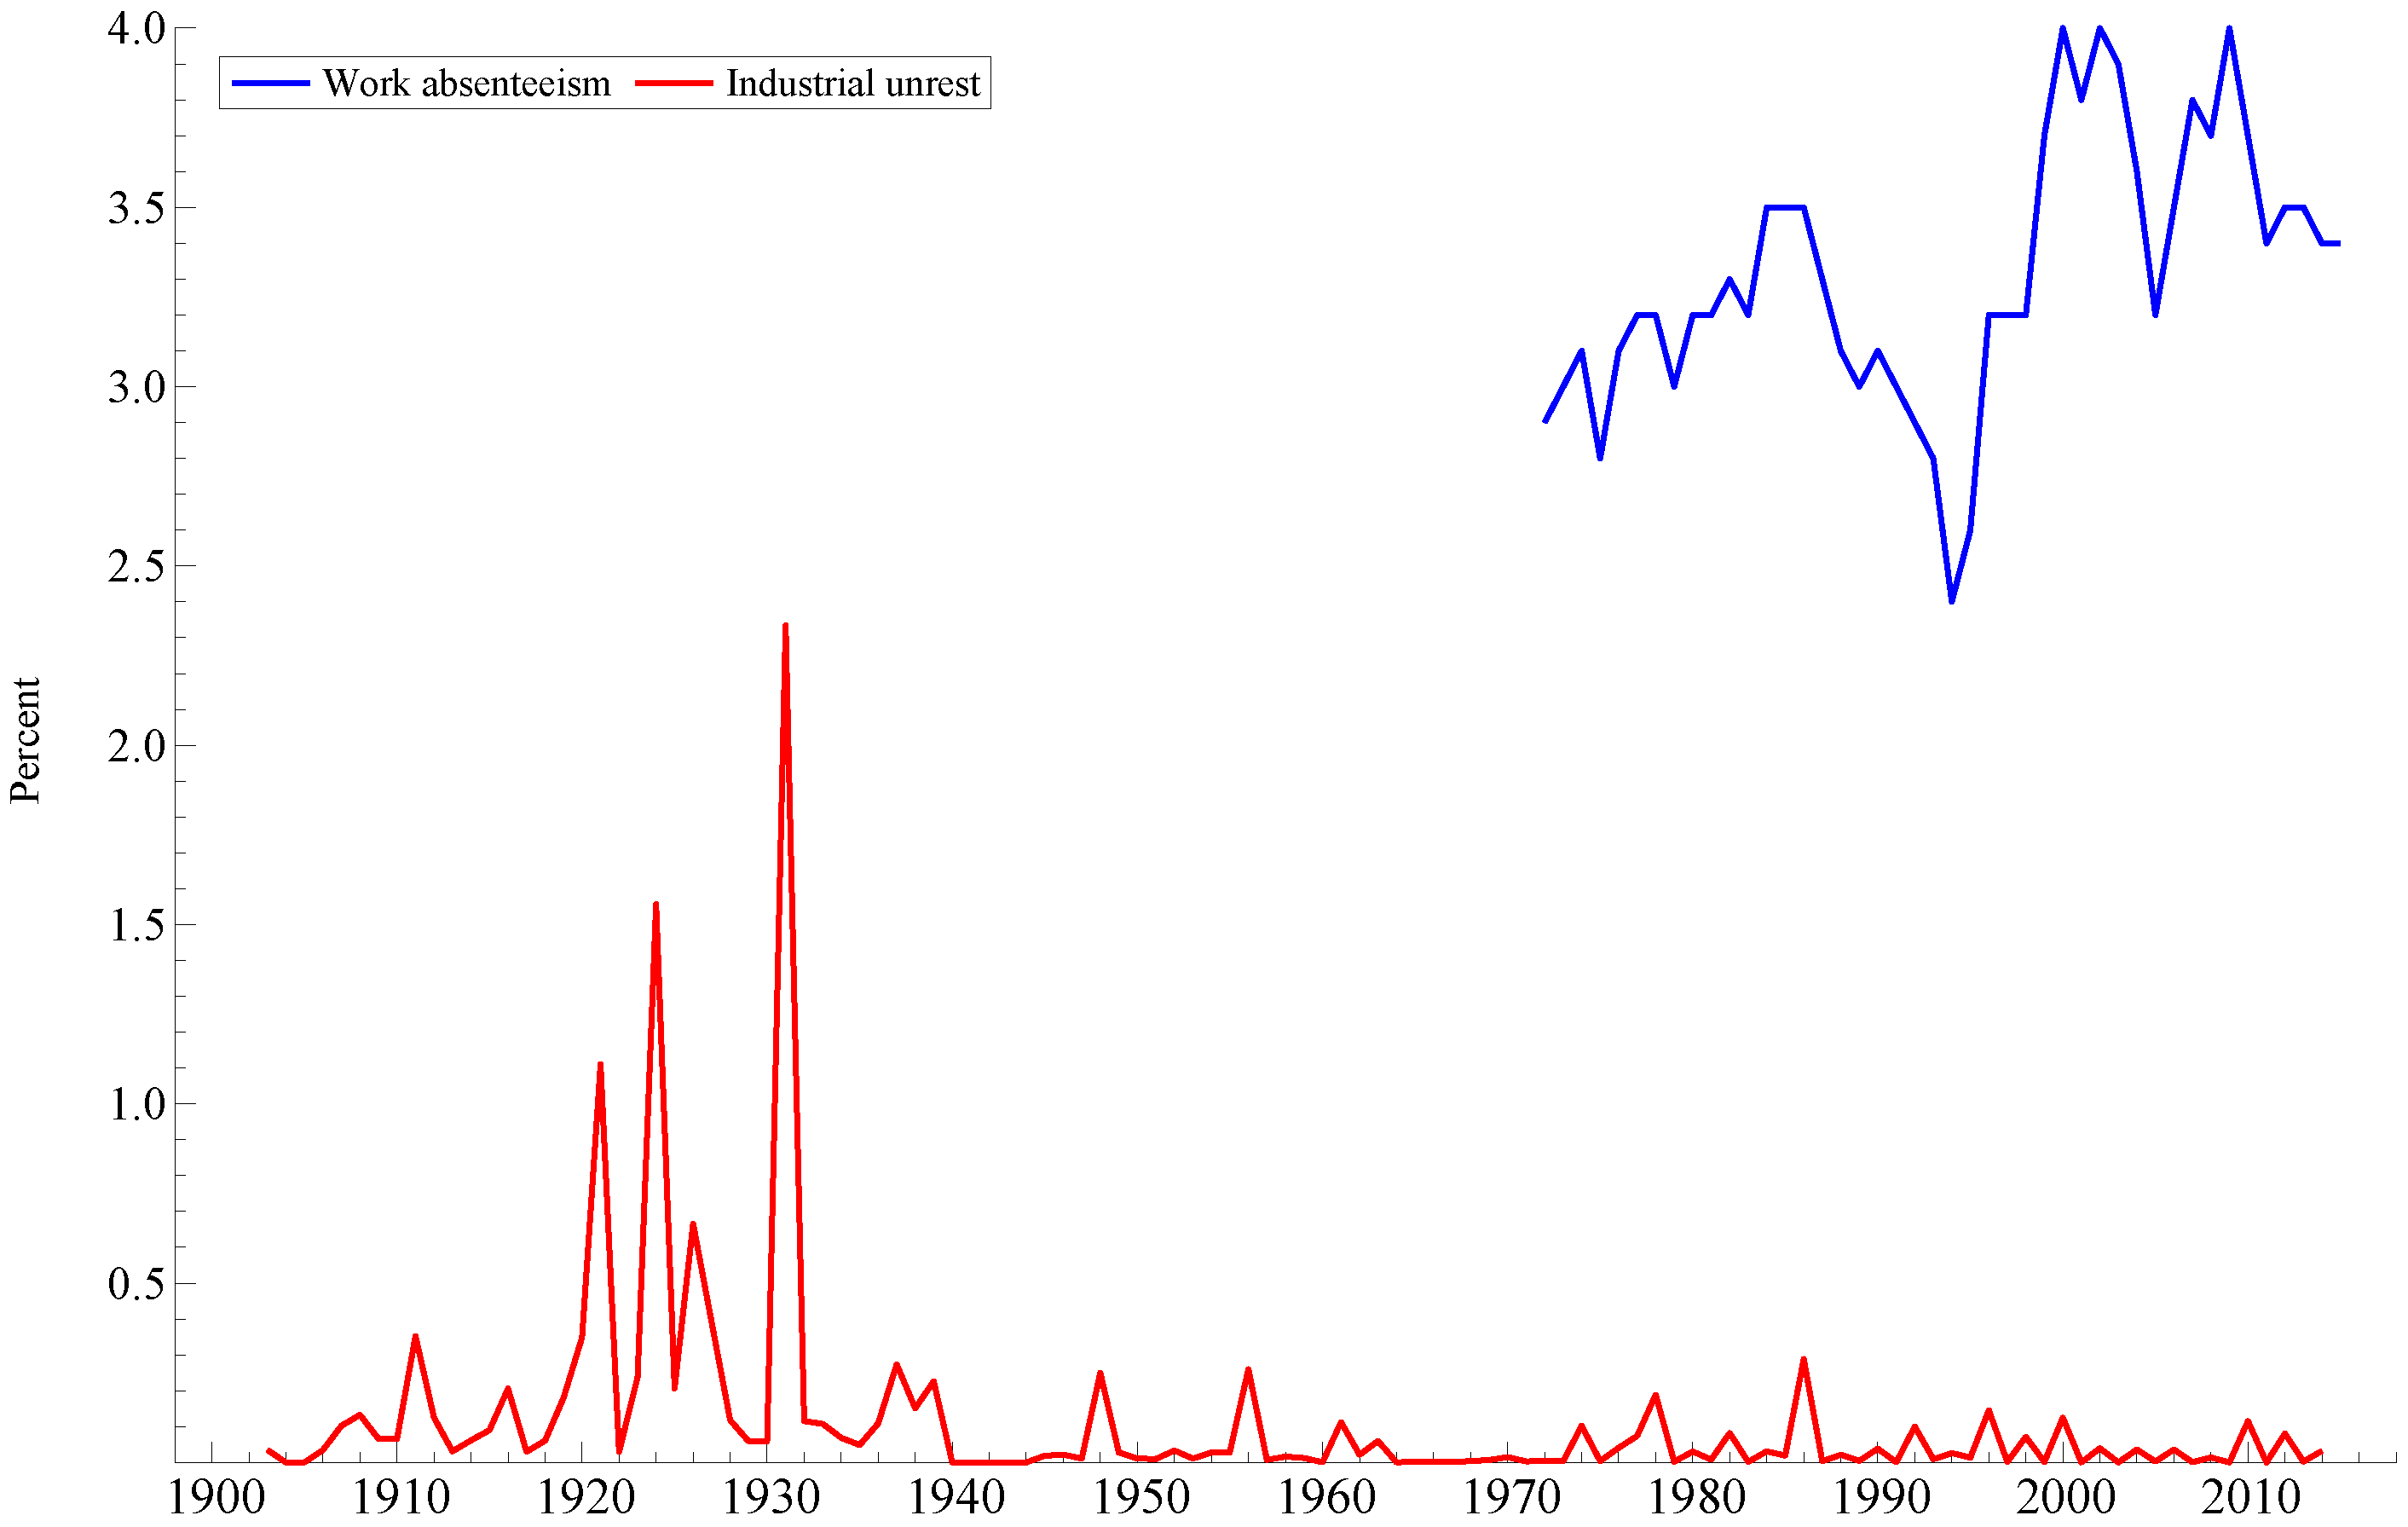
Figure 4 shows, years when working hours lost in strikes and lockouts took a substantial share of total hours were much more common before WW-II than after. In particular 1921, 1924 and 1931 were years with serious conflicts. Still, the 2.3 percent lost in the worst year, which was in 1931, may have been less than the percentage lost due to sick absence from work, as indicated by the graph showing work absenteeism in the 1970s. Apart from the strike-free West-Germany and Japan, industrial unrest returned in some scale to western economies in the 1960s and 1970s
11. To some extent the Scandinavian countries were also affected. However, strikes tend perhaps to loom higher in the public consciousness than in the actual figures, as
Figure 4 also indicates.
Labour market reforms have typically started from below, and have later been supported (or extended) by law. One reason why this has been a regular pattern is the limited reach of a collective agreement, Evju (2014) [
27]. It it only binding for the parties that have signed the agreement: The union’s members and firm(s) that have negotiated with the union.
An important early collective agreement was the iron worker settlement of 1907. In addition to settling important issues about economics and principles between two strong parties, that agreement showed, by example, that much could be achieved by trade unions that respected firms’ right to manage, was positive to technological progress and which allowed for wage differentiation according to individual qualifications and working hours, Olstad (2009) [
4] (p. 89). Many of these principles later became associated with the so called Norwegian model of labour market organization.
There can be little doubt that the bargaining position of Norwegian manufacturing workers was weaker at the start of the 20th century than later in our period. The organization percentage for workers (union density) may have been below 10 percent in 1900, Olstad (2009) [
4]. However, it increased year by year, and reached 50 percent at the end of the 1930s. The number and coverage of collective agreements also increased both before WW-I, and in the interwar years, in spite of the difficult economic situation in that period, Olstad (2009) [
4] (pp. 436,437). In an econometric paper, Bårdsen and Klovland (2010) [
28] presented evidence showing that wages responded to changes in firms’ profitability during the Great Depression, which is a typical characteristic of wage formation with mutual bargaining power
12.
Leiserson (1959) [
29] is an example of an early “onlooker’s” impression of Norwegian labour market regulation. Leiserson emphasised the importance of the Master agreement between the two confederations LO and NAF in 1935 as a turning point: away from strife and towards a capacity for coordinated, concerted adjustments in several key areas.
Olstad (2009) [
4] writes in his book about LO from 1989 to 1935, that the Master agreement of 1935 saved the labour movement from a possibly destructive confrontation with both firm owners and the government
13. When the process away from strife started around 1930, LO did not participate in the government’s “industrial peace commission” out of strength. It was in a defensive position. On the other hand, the factory owners and the employer confederation NAF had experienced that an ambition to dictate wage setting was illusionary. At a critical point in 1934, when the government had already taken controversial labour laws through parliament, it took a step back and accepted to replace those laws by self-enforced rules by the unions, about secret ballots in particular. In that way, the unions ended up setting up rules for their own behaviour that the employers’ confederation and the government had already accepted, Olstad (2009) [
4] (p. 419)
14.
There is also a political side of this development. The Labour party moved away from Moscow-communism during the 1920s, and the labour government that was elected in 1937, was basically committed to the idea that the working-class could benefit from living in a society with liberalised product markets and private ownership to productive capital in those markets, but with collective bargaining in the labour markets. On the other hand, it was seen as almost an prerequisite that a viable system of labour market regulation had to be in place before the Labour party could take responsibility for national economic policy, Olstad (2009) [
4] (p. 419). Hence, the historical process may have been characterized by positive feed-back between institutions in the labour market and in the political sphere. In the words of Barth and Moene (2015) [
31], “institutions were beginning to reciprocate”.
This development continued after WW-II, when the ambitious combination of macroeconomic planning, political democracy and free collective bargaining was noted by American economists and political scientists, see Bjerkholt (2014) [
2]
15. In particular, free collective wage bargaining continued as the main principle, SSB (1965) [
20] (p. 370).
Legislation and institutions were introduced to bolster up the wage-setting system, with the aim to reduce probability of conflicts, and to increase the degree of coordination in wage-setting. The legislation that regulates labour disputes, and a separate Labour Court, dates back to 1915.
The Technical Calculation Committee (TCC) was established in 1967 by a tripartite agreement, and is vested with elaborating a common understanding about recent wage developments and about the forecast for cost of living, and other parameters of relevance for the upcoming agreement revisions
16. The state mediator has had a strong position, and the period of validity of agreements has become coordinated (two years).
A machinery for interest dispute resolution was built up quite early. The “peace obligation” in disputes of rights (in practice everything that is regulated by collective agreement), goes back to the Master agreement of 1935. There has been a relatively low threshold for the use of compulsory arbitration. For example, when the petroleum sector was built up, arbitration was often used to settle wage disputes in that sector. The phasing-in of a super-profitable industry in the small open Norwegian economy was going to be challenging under any circumstances. Completely free collective bargaining in petroleum could have destabilised the nominal path of the economy, or at least undermined the competitiveness of non-petroleum based industry. Dyrstad (2016) [
34] provides evidence indicating that government intervention was effective in establishing an element of co-ordination in the “oil-sector”, before the wider consequences for wage formation became too large to be reversed.
Like in many other countries with collective bargaining, there have been epochs with (different versions) of incomes policies, as well as a few examples of completely centralised wage setting (by law, as in 1988). Free collective bargaining has in periods no doubt been regarded as a major problem as well. In particular, like in many other countries, in the inflation decades of the 1970s and 1980s. In 1973, a proposal about replacing free wage bargaining by a Price and Income Policy Council almost became government policy, but the largest union confederation LO made a U-turn, Lie and Venneslan (2010) [
35] (pp. 200–202), Bergh (2009) [
36] (p. 122).
As noted, union membership was low early in the 20th century, but increased through the 1920s and 1930s, and union strength became a factor in the evolution of the collective labour market regulation that continued in the postwar Norwegian economy. As
Table 1 shows, the unionisation rate (“union density”), may have peaked around 1990, and the overall impression is one of stability. In a comparison with other western countries, the Norwegian unionisation rate has not been particularly high, Stokke et al. (2013) [
37] (Chapter 2.3.1 and p. 81)
17. But because there has been a secular decline in the union density of many countries, Norway’s stability at 52%–53% places the country higher in the league table in 2013 than it would have done in 1980 for example.
We have less data about the degree of organisation on the employer side of the bargain, but
Table 1 indicates increasing organisation tendencies among firms. The numbers for the firm side are for the private business sector (and for the number of employees, not firms, to make them comparable with union density numbers). If government administration is included, the organisation density becomes 75%.
The power and political influence of the main union confederation (LO) has varied over the period, and so too has the role of the main employers association (NHO (which used to be NAF)). As pointed out by Soskice (1990) [
39], the analysis of collective wage formation may become too narrowly focused on the worker organisations, Their counterparts on the employer side are usually not passive on-lookers to the developments in labour market organisations, but contribute actively out of organisational and political strength. Above, when we discussed the 1935 Master agreement, we noted that the leaders of the NAF opted for a compromise, when another employer strategy would have meant a more direct conflict with the weakened trade unions. There are other examples of the importance of the power (or weakness) of employer organisation, and if the 1935 compromise came out of burgeoning power, the unfortunate lock-out in 1986 may have been a nadir for collective employer behaviour.
More generally, the secular trend in the strength of employer organization may be one of the main determinants of how systems of wage setting have evolved. In some epochs, with perhaps Western-Germany as prime example, the strong employer organisations were arguably more instrumental to the system of pattern bargaining than the unions, see Soskice (1990) [
39] and Ruoff (2016) [
40].
Bargaining coverage denotes the proportion of wage earners to whom a collective agreement signed by a union or worker representative and the employer or employers’ association applies.
Table 2 indicates that the coverage rate in Norway is somewhat higher than the unionisation degree, but not by a large margin. It is higher in manufacturing and other goods producing sectors, than in service production. However, this reflects the same difference in unionisation.
In comparison with other western countries, the Norwegian bargaining coverage would take a place at the bottom half of that league table, Stokke et al. (2013) [
37] (pp. 81–92). The reason is that there are formal extension mechanisms in many countries. Hence, in the balance between collective bargaining and the use of law in labour market regulation, the weight is much more on the legal pillar in countries like Austria, Belgium, France and even Finland and Sweden, than it has been in Norway.
In sum, the postwar Norwegian system can be characterized as a voluntarily system for regulation of wage compensation and working conditions. The parties have little direct support in the legislation when it comes to extending their agreement to other wage contracts, see Evju (2014) [
27]. Hence, we can draw a distinction between formal bargaining coverage, as measured in
Table 2, and the effective bargaining coverage that results when employers without membership in a confederation nevertheless offer their workers compensation in line with the relevant collective agreement. It is not unrealistic to believe that voluntary extension of collective agreements has been a feature of actual labour market regulation for long periods, in particular in the post WW-II epoch. For example, in a situation with “excess demand” for labour, it can be rational for employers to remove the wage compensation issue from the competition interface, to avoid cost increasing bidding rounds for employers
18.
But it is also possible to imagine that a system of voluntary extension of collective agreement can be unstable, and that there are tipping points in the organisations rates. If those lines are crossed, both the effective and formal bargaining coverage can decline sharply
19. A relatively new element in the labor market regulation in Norway is the The General Application Act (of Collective Agreements), of June 1993. Although it was far from a semi-automatic extension mechanism, and considering that it targeted social dumping, the act was contested by organizations on both sides of the bargain at the time. It has become more in use after 2007 and 2009, see Evju (2014) [
27,
41], possibly as a response to real-life problems of maintaining collective bargaining as a regulator of labour markets with many EU labour immigrants.
2.5. Coordination
As the postwar period unfolded, with
de facto full employment, and with a commitment to free collective bargaining, the management of the economy in many western countries centered around the trade balances, exchange rate policies and “the inflation problem”. Inflation was not popular among union leaders and members, Bergh (2009) [
36] (p. 118). For the policy makers, it represented a problem for the attainment of important goals, not an instrument towards attainment of those goals. Contrary to the academic Phillips curve myth that emerged between 1975 and 1977, there are almost no evidence of Phillips curve inflationism in Britain, as Forder (2014) [
42] shows convincingly.
In Norway, the central role of wage formation in the inflation process was clearest conceptualized in the so called “main-course model”, or the Norwegian model of inflation as it was dubbed in 1977 when one of the intellectual fathers of the model finally published a paper in English, Aukrust (1977) [
43]. The main-course model was the outcome of two reports that an expert group of Norwegian economists (Aukrust, Holte and Stoltz) published as background material for the wage and agricultural price negotiations in 1966. The second report, contained the long-run model that we refer to as the main-course model, see Aukrust (1977) [
43]. The connotation is navigation over long distances, not the dinner table. It is also referred to as the “front runner model”, or “leader model”, since the collective agreement in the internationally competing manufacturing sector represents the wage-norm that other sectors in the economy follow. The premise is that wage growth must be adjusted to a level which over time is capable of sustaining the competitiveness of import and export competing industries.
In that historical epoch, there were similar developments in, for example, Sweden, see Edgren et al. (1969) [
44], and the Netherlands. This model became the framework for both medium term forecasting and normative judgements about “sustainable” centrally negotiated wage growth in Norway and Sweden
20. A key-point in the analysis was that in the export and import competing sectors of the economy, considerations about the required return to capital served as an automatic stabilizer of nominal wage cost growth. Over time it was one of the corrective mechanism that would make the wage cost level fluctuate around a main-course growth path defined by the value of average labour productivity. Therefore, the source of the domestic cost-push inflation could not be the wage settlements in the export and import competing part of the economy. That problem instead resided in the sectors where there was little foreign competition in the product market. In those markets, pressure for higher wages could be compensated by price increases. It was easy to foresee that a process of mutual wage and price increases which started in the “sheltered” sector of the economy, would over time feed into wage growth in the competing sectors as well. With near full employment, claims for wage compensation, could become near impossible to withstand.
Hence, there was a fundamental horizontal co-ordination problem in wage and price setting. In Norway, the solution became to grant the wage settlement in the manufacturing sector a special role as wage-leader (or wage-norm setter, or front runner), and sweetening the pill for the wage earner in the following sectors by reminding them that if they are loyal to the system, they can on average expect to get the value of a much higher productivity growth than they could count on if they break out of the system.
As noted above, the wage-leader system has performed variably over the decades, with the the late 1970s and 1980s as possible low-marks, see, e.g., Skånland (1981) [
46], Llewellyn (1994) [
47]. It clearly relies on strong confederate unions, and it seems to have adapted to the increase in such organizations. LO was alone, and dominant until the start of the 1970s, but now there are five.
The fragmentation of organisations at the employee side may have increased the importance of the Technical Calculation Committee, (TCC). As noted above, the organizations’ participation in TCC means that the expectations about cost-of-living increase become synchronised before the negotiations about wage adjustment start each year.
A returning point of concern has been
wage drift, which denotes the part of the total wage change which is not due to the agreement between the confederate organisations. Wage drift arises mainly from the local wage agreements in the manufacturing sector, not in the wage following sectors. As a result, the actual wage growth in the wage-leading industry can end up considerably above the wage-norm. Wage drift has been so large in some epochs (the 1980s in particular) that it could potentially have undermined the system. However, as analysed by Holden (1989) [
48], since there is no right to strike or lock-out during local negotiations, a bargaining model implies that wage drift would not completely undo the outcomes of the settlements at the confederate level. Holden reported empirical evidence that supported the theoretical conclusions, and hence there may be a structural explanation for why wage drift has not perverted the system. Nevertheless, the worrying about wage-drift has never disappeared. For example, if fragmentation of organisations means weaker ability to contain firm level wage increases, especially for the higher paid white-collar workers, the unions of the wage-followers might loose patience, and horizontal coordination will suffer. In 2013, an official report where the organisations participated, reinforced the extension of the wage-norm: it should also regulate the wage negotiations for white-collar workers in manufacturing, cf. NOU (2013) [
49].
2.6. Development of Working Time and Wages
Beside wage compensation and health hazards at work, working time is the main variable that needs regulation in the labour market. Unlike wage agreements, which to a very limited degree have been law regulated in Norway, working time reforms have usually started with collective agreements before it has been extended to all wage contracts by law.
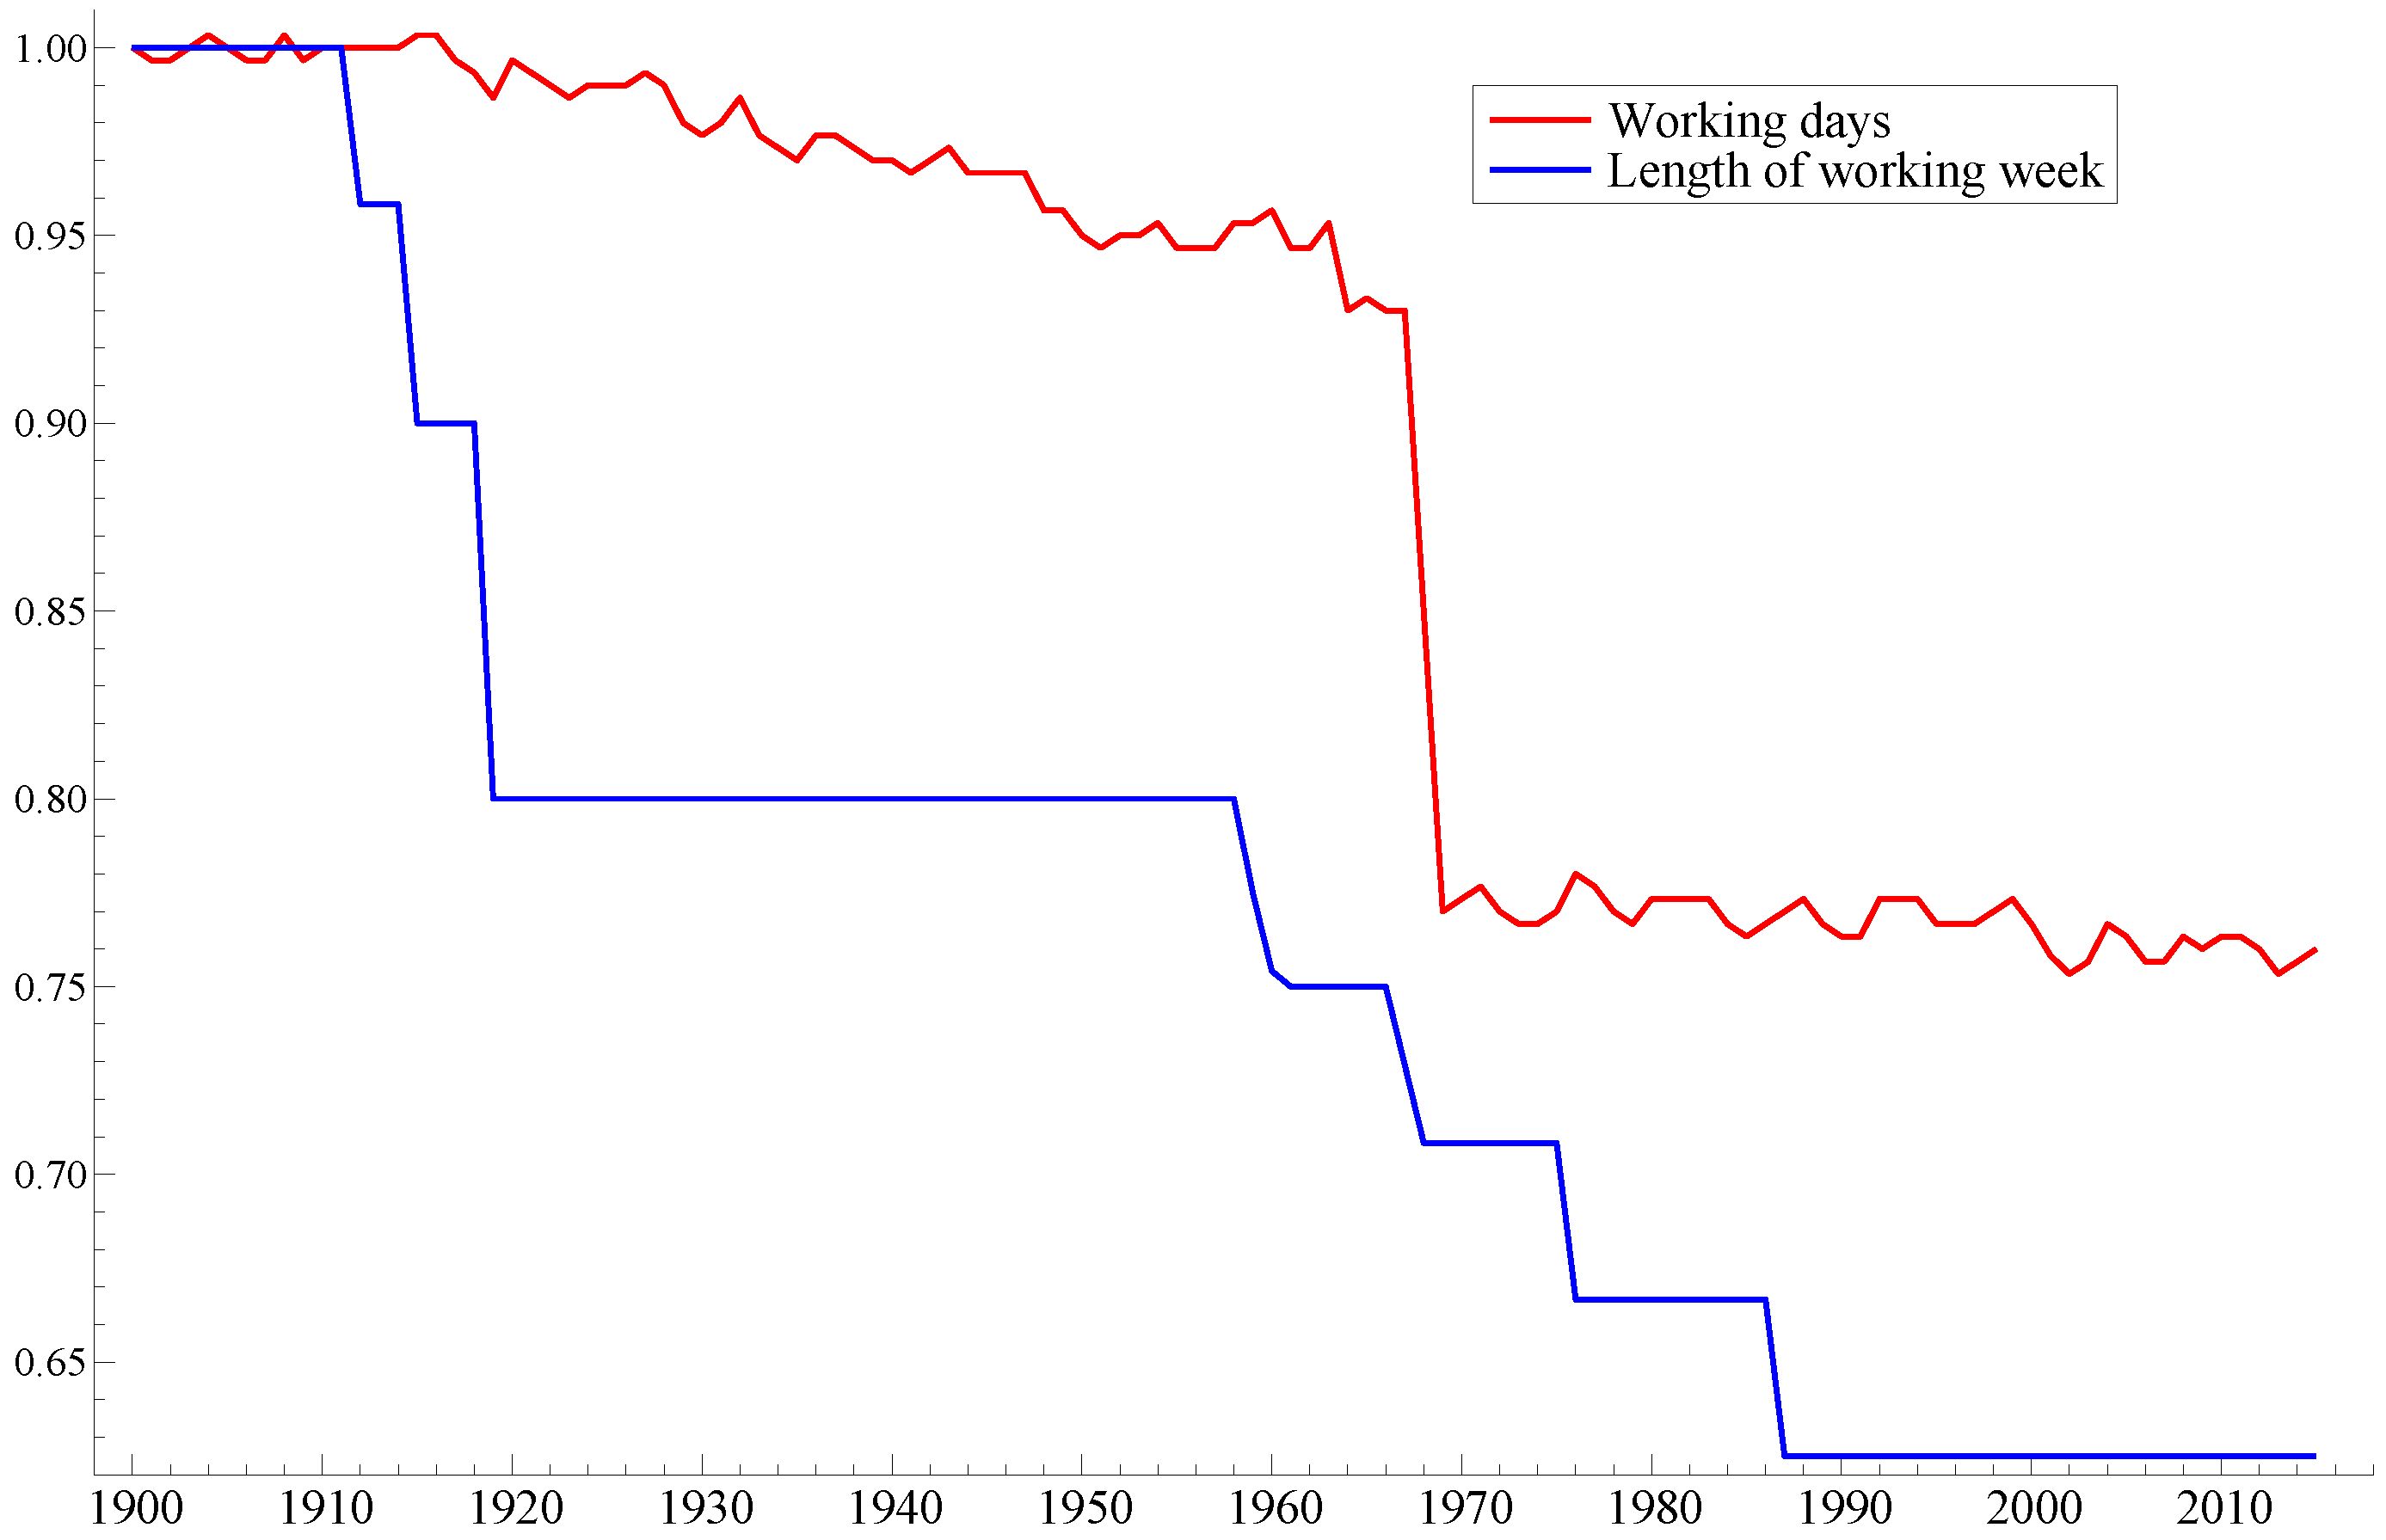
Figure 5 shows the development of the length of the working week, and the number of working days, relative to 1900.
At the start of the century, the number of working days was 300 and the length of the working week for regular day time work was 60 h. By the end of WW-I, weekly hours has been reduced by 20 percent (to 48 h) but then it stayed unchanged until 1959. The last reduction in normal hours came in 1987, and was the result of the wage settlement in 1986 (which also involved a somewhat bizarre lockout, since the economy was in a boom in that year). Hour reductions have usually been compensated, so that annual earning are intended to be unchanged, Nymoen (1989) [
50]. This happened in 1987, but also in 1976 (40 h) even though many firms struggled with the consequences of stagflation internationally, the industrial structure needed an overhaul, and cost-push inflation was already a recognized problem, Bergh (2009) [
36] (p. 135).
The more gradual reduction in the number of workdays, from 300 in year 1900, reflects the increasing length of annual holidays. A major reduction came in the short time span between 1965 (280 days) and 1969 (231 days). Again this was an effect of extension of agreements about a fourth holiday week, but the main part of the reduction was due to the introduction of the five-day working week. Clearly, the reduction in annual working days has been compensated. Hence, labour productivity per hour worked needed to be increased, either before or, more realistically, as a response to increased holiday length and shorter working week.
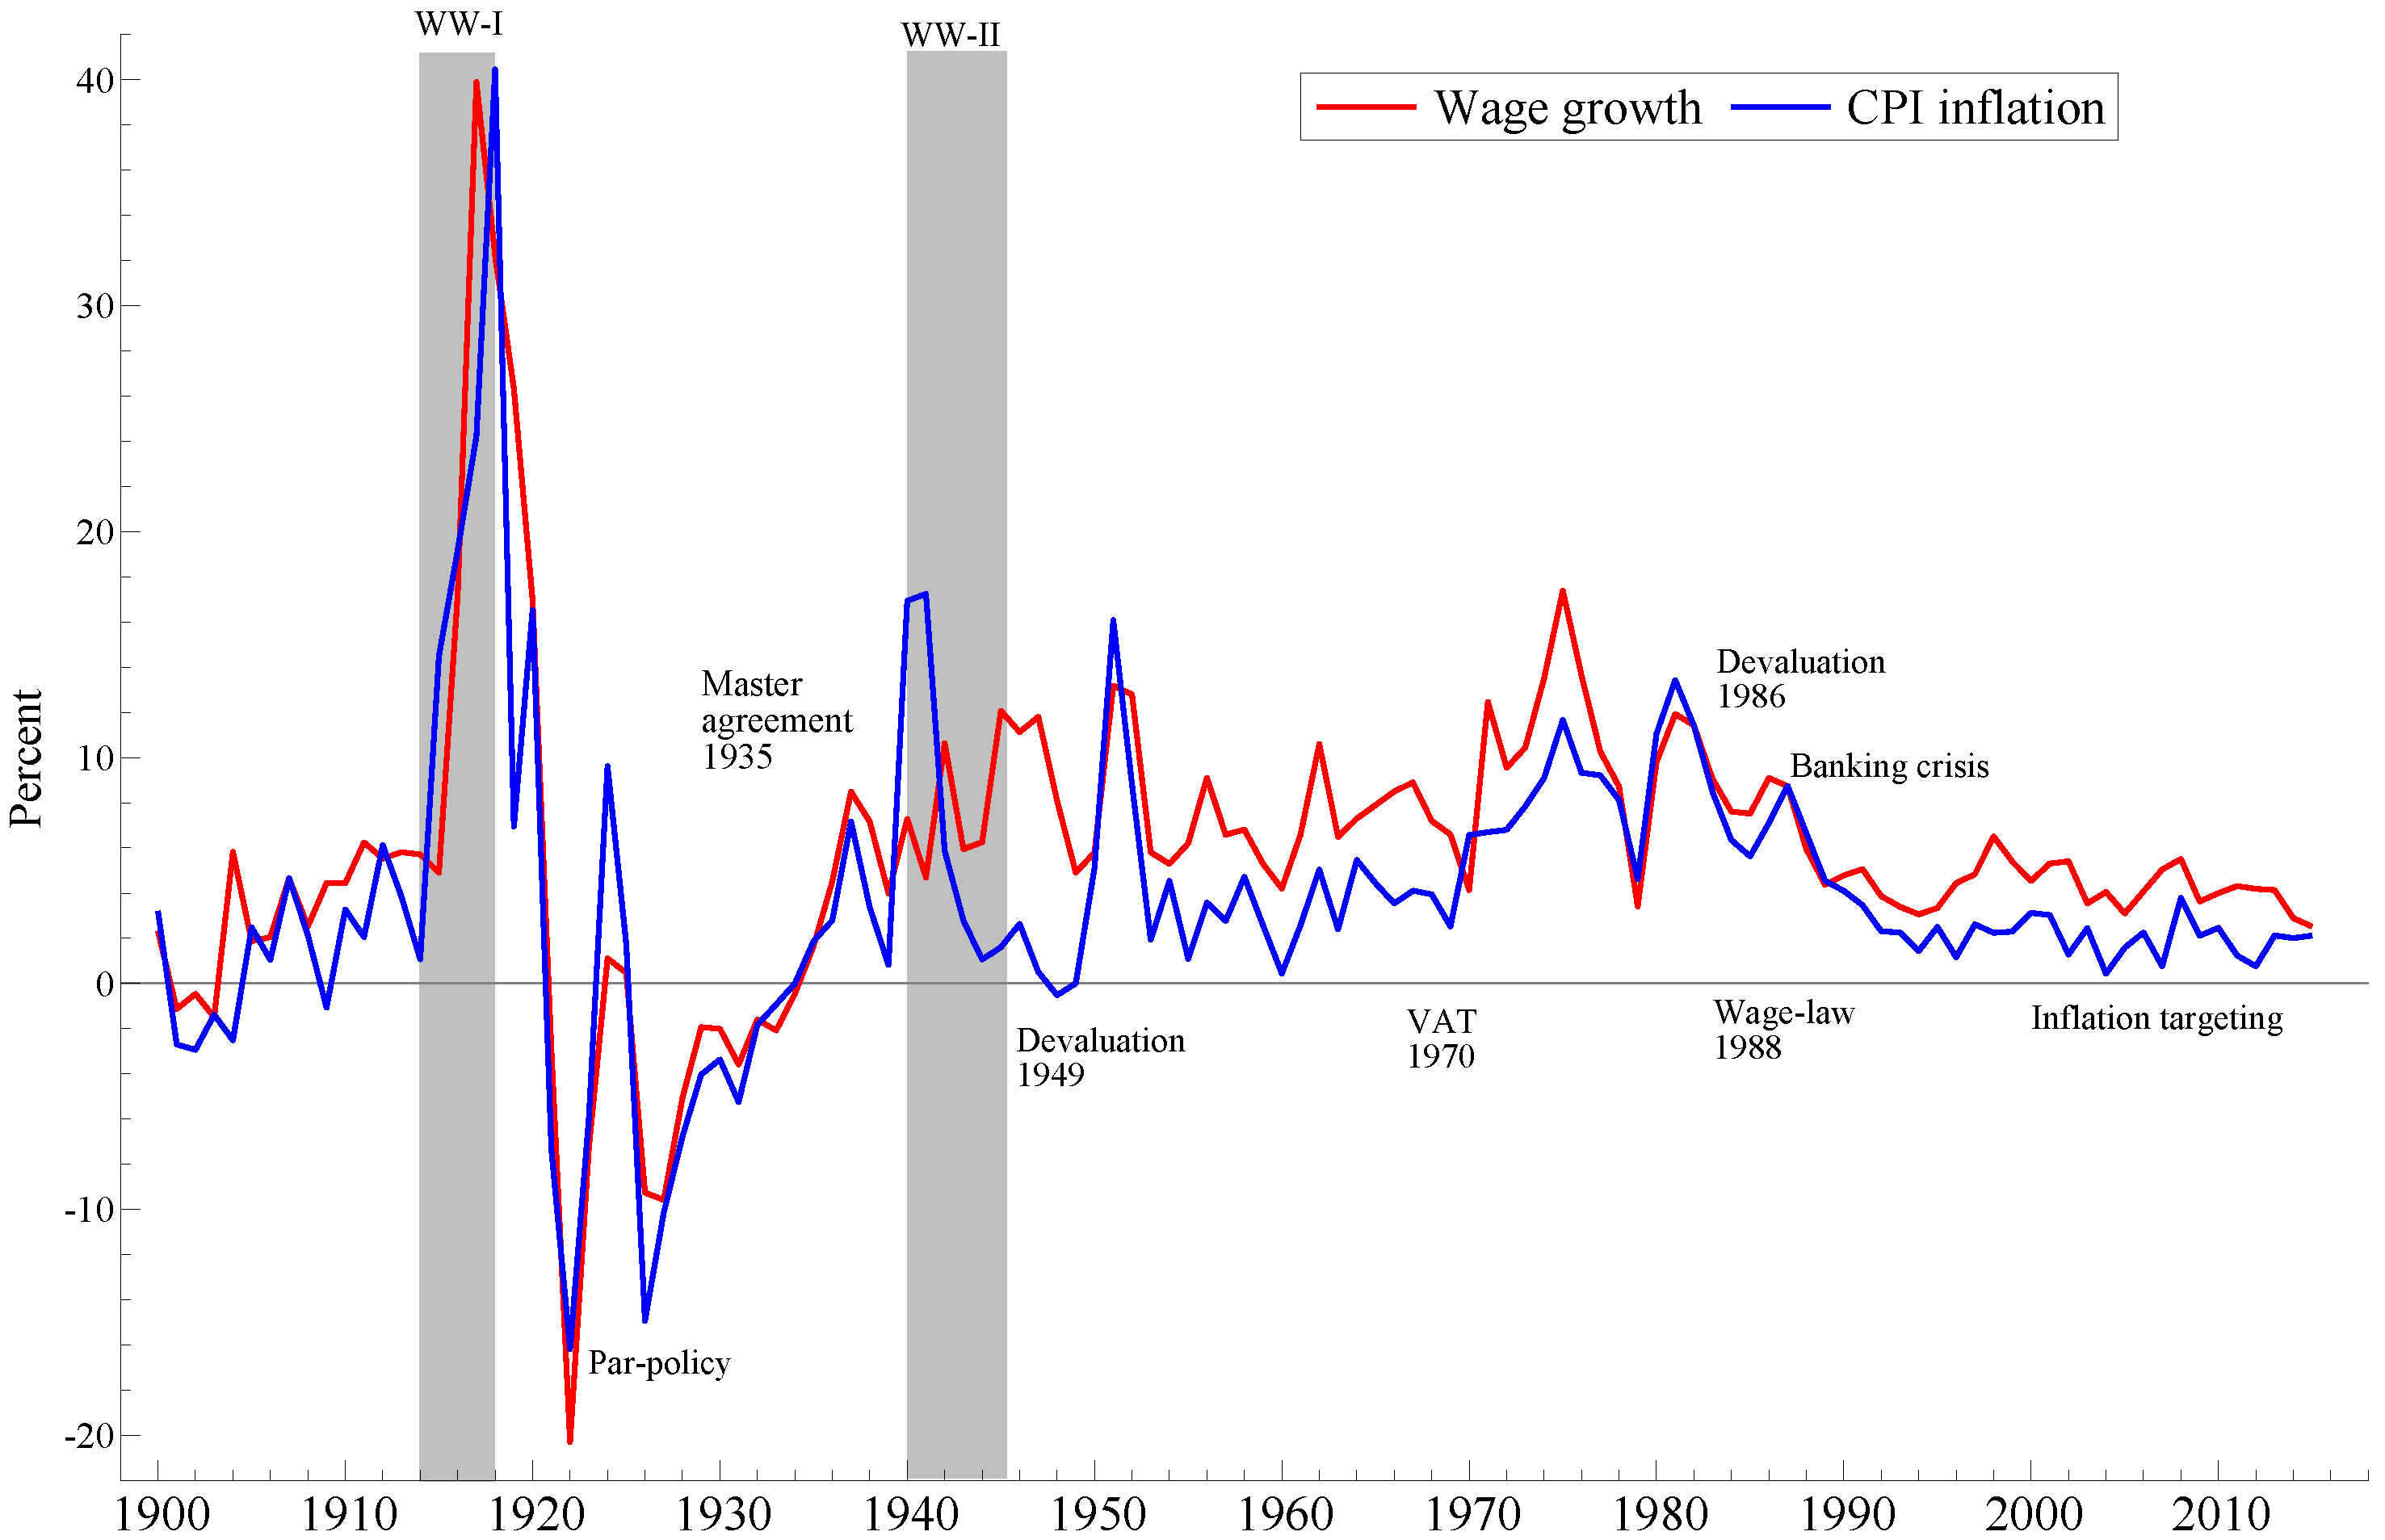
Figure 6 shows wage and price growth. Inflation was low (some years negative) at the start of the last century, which was an international phenomenon. That was soon over, and wages in particular grew steadily until the war, in part as a result of construction and building activity and low unemployment as noted above. During WW-I, prices first shot up, and wages followed quickly.
The high inflation rates during WW-I were extraordinary, in particular when we take into account that Norway did not participate in the war. Great Britain in comparison recorded inflation rates around 25%. Lie (2012) [
15] describes what seems to have been a near meltdown of the monetary system during the war, and in the first years after it ended. The deflationary par policy that began in 1920 was a reaction. It may have been needed to restore confidence in the system, but the real economic costs of the chosen policy became huge as the par policy period dragged on. There were 12 years with nominal wage reduction between 1920 and 1934. Only in 1924 and 1925 did nominal wages grow.
After WW-II, and after the effect of the 1949 devaluation was over, inflation was stable and relatively low until the early 1970s. During the 1940s and 1950s, rationing and direct price control was used to contain what was clearly understood as a situation with “excess demand” at the time, see SSB (1965) [
20]. But gradually, price formation in the product markets was normalised, and as noted above, there was in principle free collective wage bargaining during the whole period. As also noted, the 1970s were marked by gradually increasing inflation, in Norway as elsewhere in western Europe. Early in the 1970s, North Sea oil production was still nowhere large enough to shelter the country from the price increases that followed after the international oil crisis. The 1980s were even more problematic with a string of self-inflicted unemployment in 1983–1984, “technical devaluations”, a collapse in coordination of wage formation, and the mentioned lock-out in 1986, followed by a relatively large devaluation. The decade ended with a collapse of the housing market, a huge banking crisis and finally a big rise in the rate of unemployment. The consequences of the housing price crisis were also felt long into the 1990s, as financial consolidation in the household sector depressed private consumption.
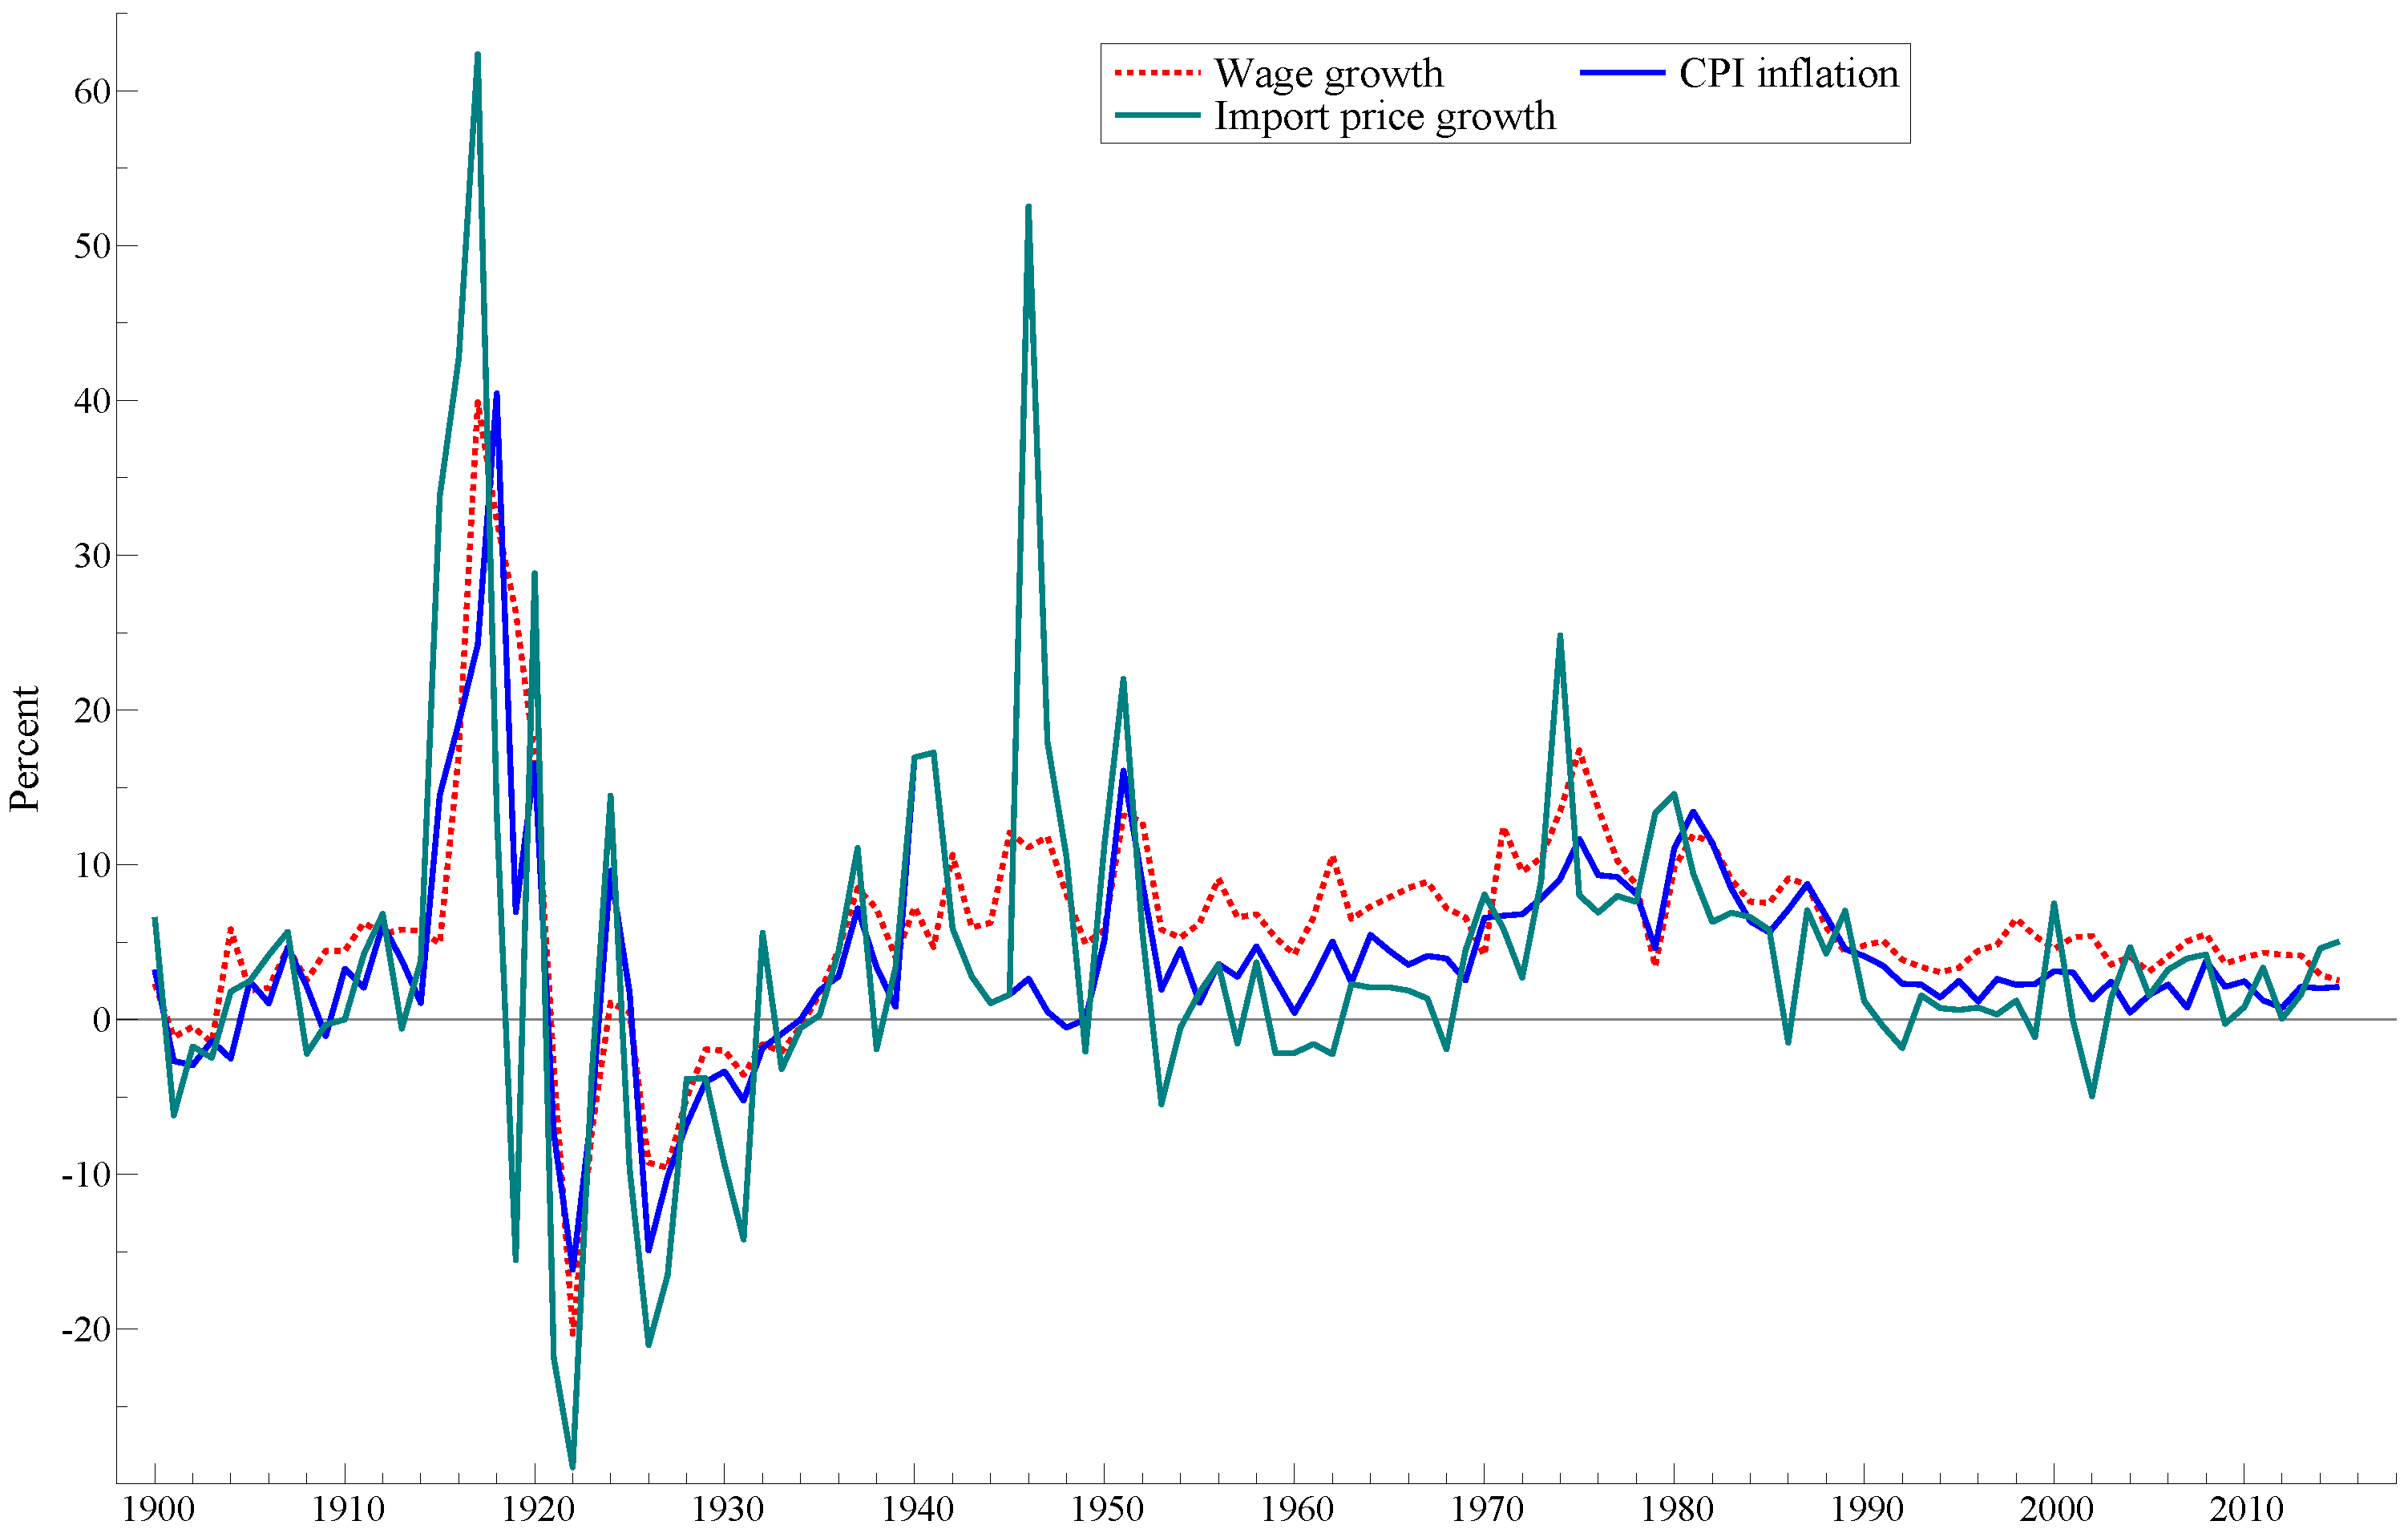
In a small open economy, inflation is always associated with foreign inflation, and with the rate of change in the international value of the domestic currency (rate of depreciation). In
Figure 7, this is brought out by the graph for the annual change in the Norwegian import price index. Import price growth was clearly leading inflation at the start of WW-I. Even though it is thinkable that the domestic deflation contributed to the appreciation of the currency during the 1920s, it is more realistic that the causation was mainly the other way, from par-policy to domestic deflation. During the 1930s, the effects of the Great Depression on foreign currency denoted imports must also have played a role.
Finally, towards the end of the sample, the secular reduction in import price growth seems to have weighted down the nominal path of the Norwegian economy, CPI inflation in particular. This can in part be due to the increased value of the krone, a consequence of the high oil price level of the period. However, the increasing role of China-produced commodities in the world economy, also depressed the prices of many imported goods to Norway.
As a result, growth in the consumer real wage was quite high, and also stable, during the first 15–16 years of the new millennium, as
Figure 6 shows. For example, from 1997 to 2012 the consumer real wage increased by 46%. In 2015, the 15 year growth rate had been reduced somewhat, to 38%, but was still high compared to other countries. The source of the strong recent real wage performance is still debated. A plausible argument is that by the end of the 1990s, Mainland-Norway had become integrated with the international petroleum industry. Hence, even though as noted above, the wage level in that sector has had a limited direct influence on the general wage level in Norway, the indirect effect nevertheless became quite large when the oil price and oil investments started to grow after the financial crisis. In a way, the super profitable petroleum sector had come to influence the wage norm trough the back-door, see Anundsen (2016) [
51].
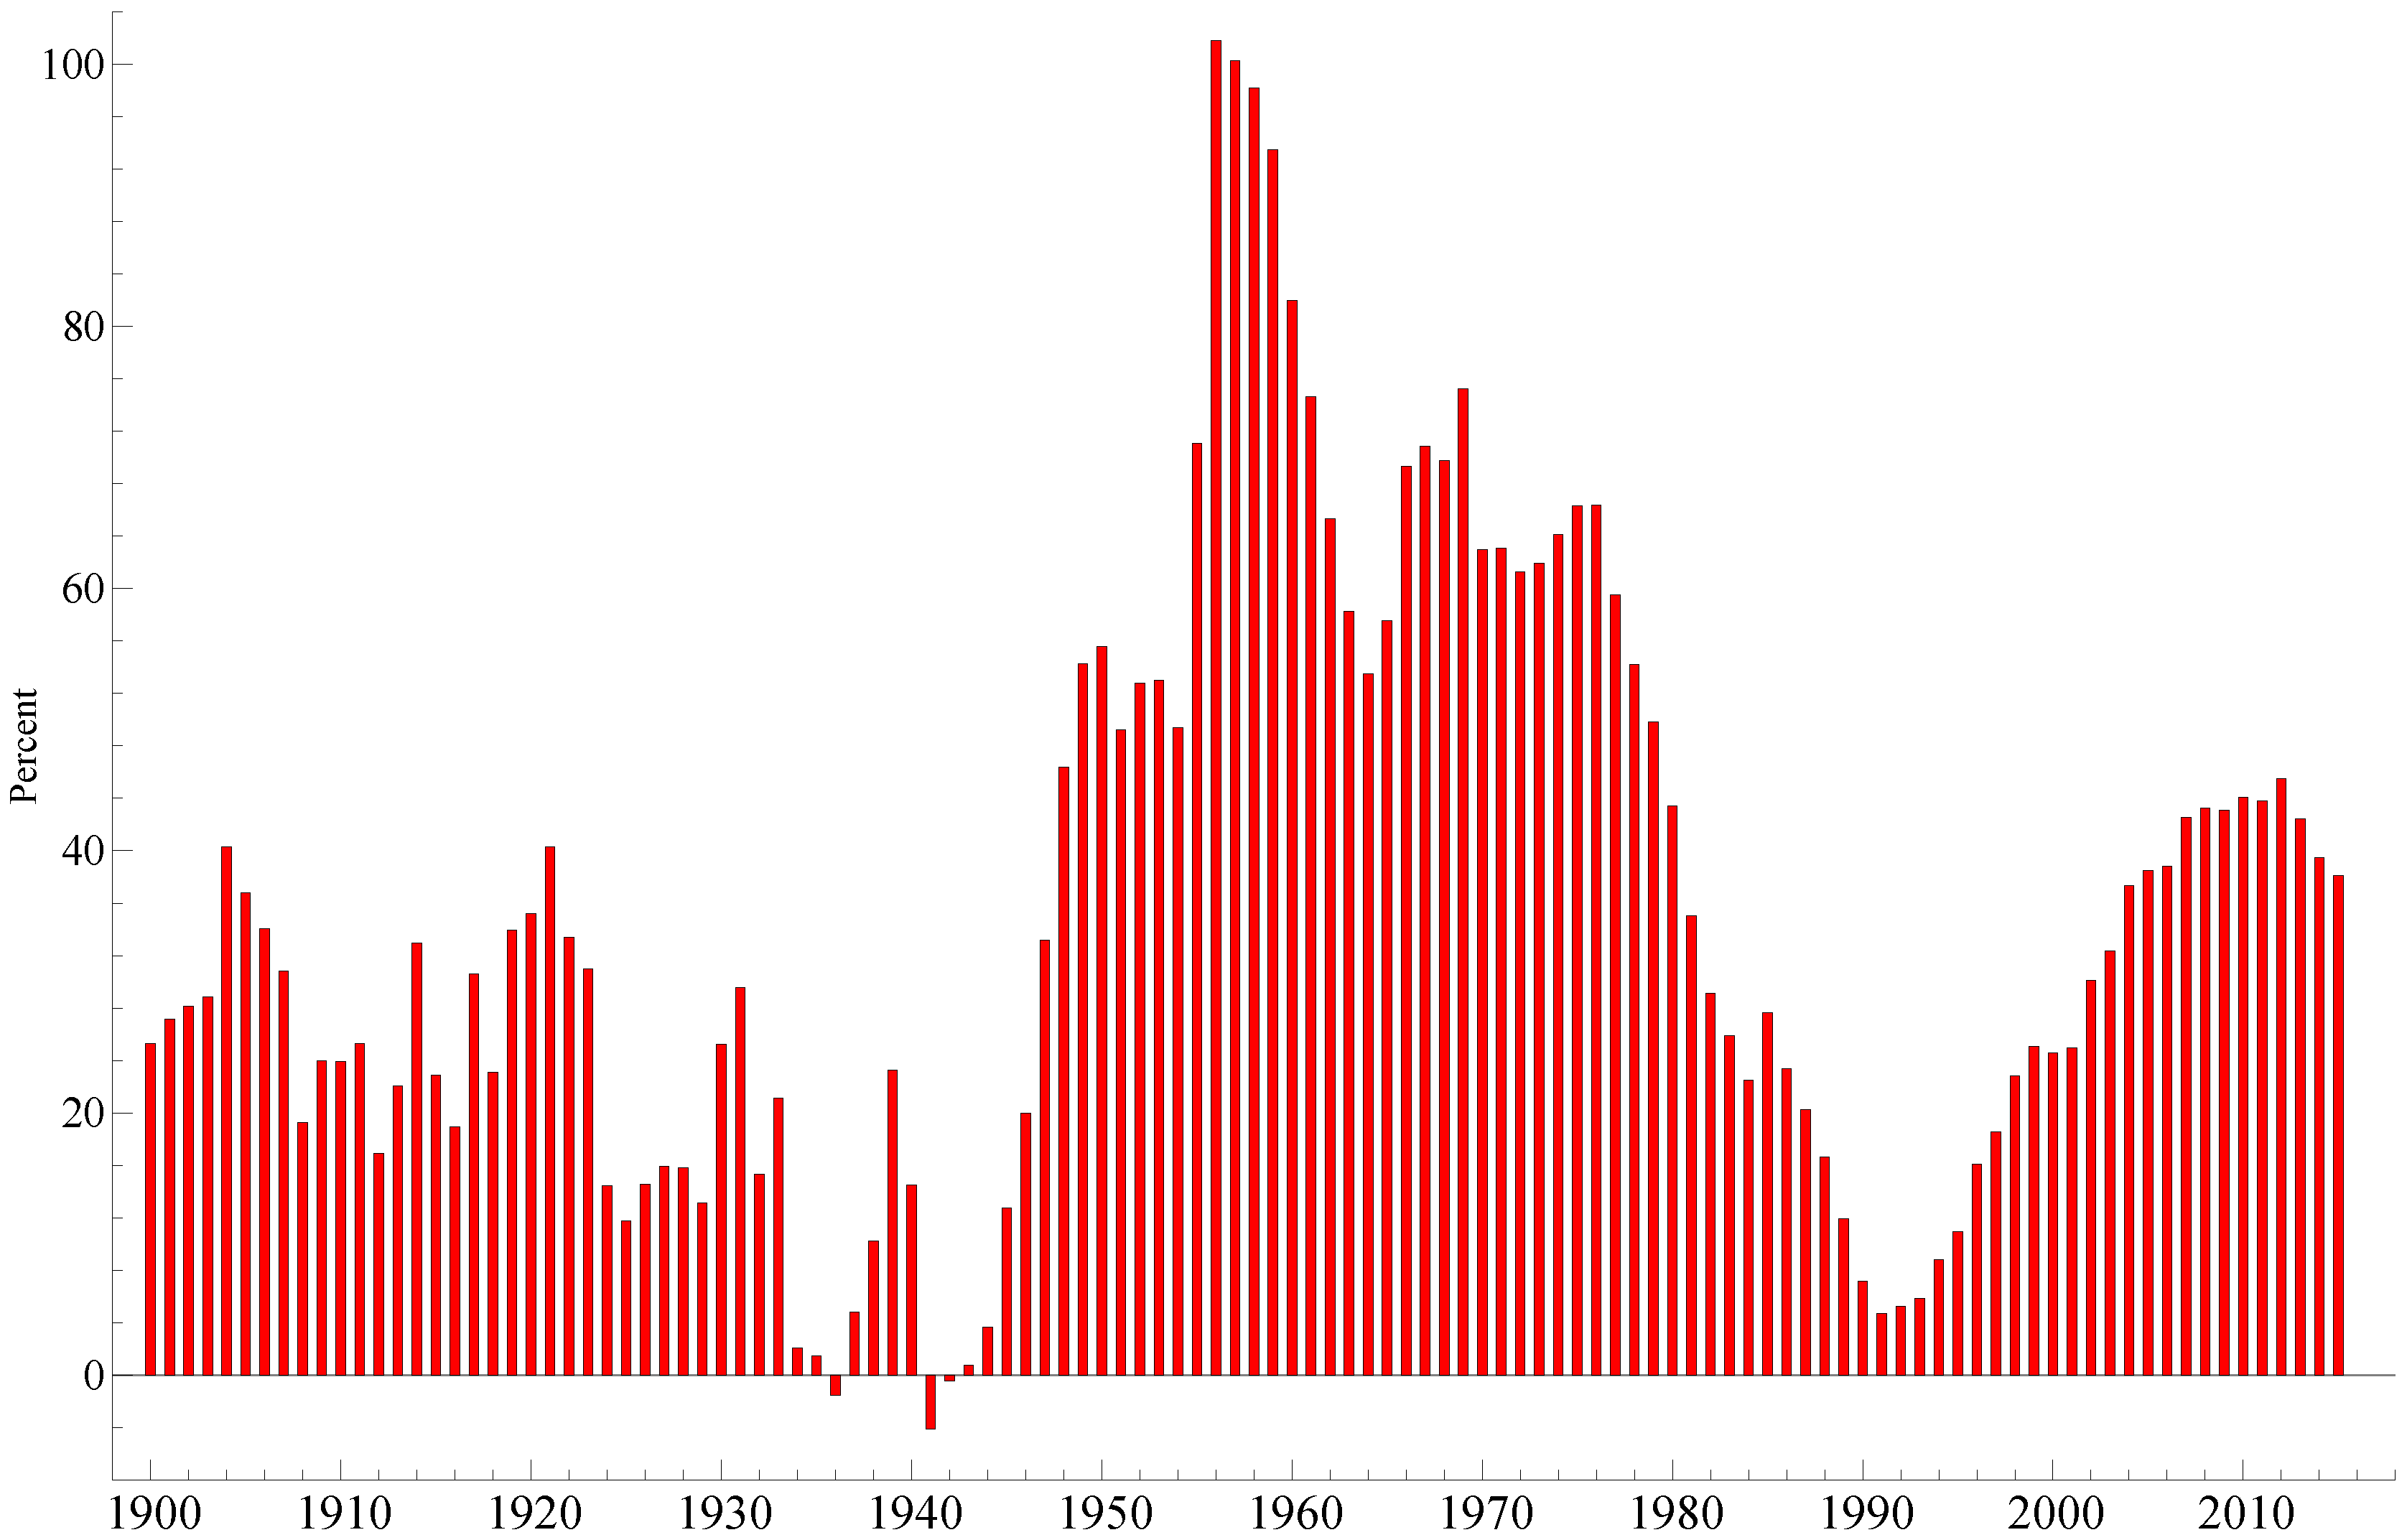
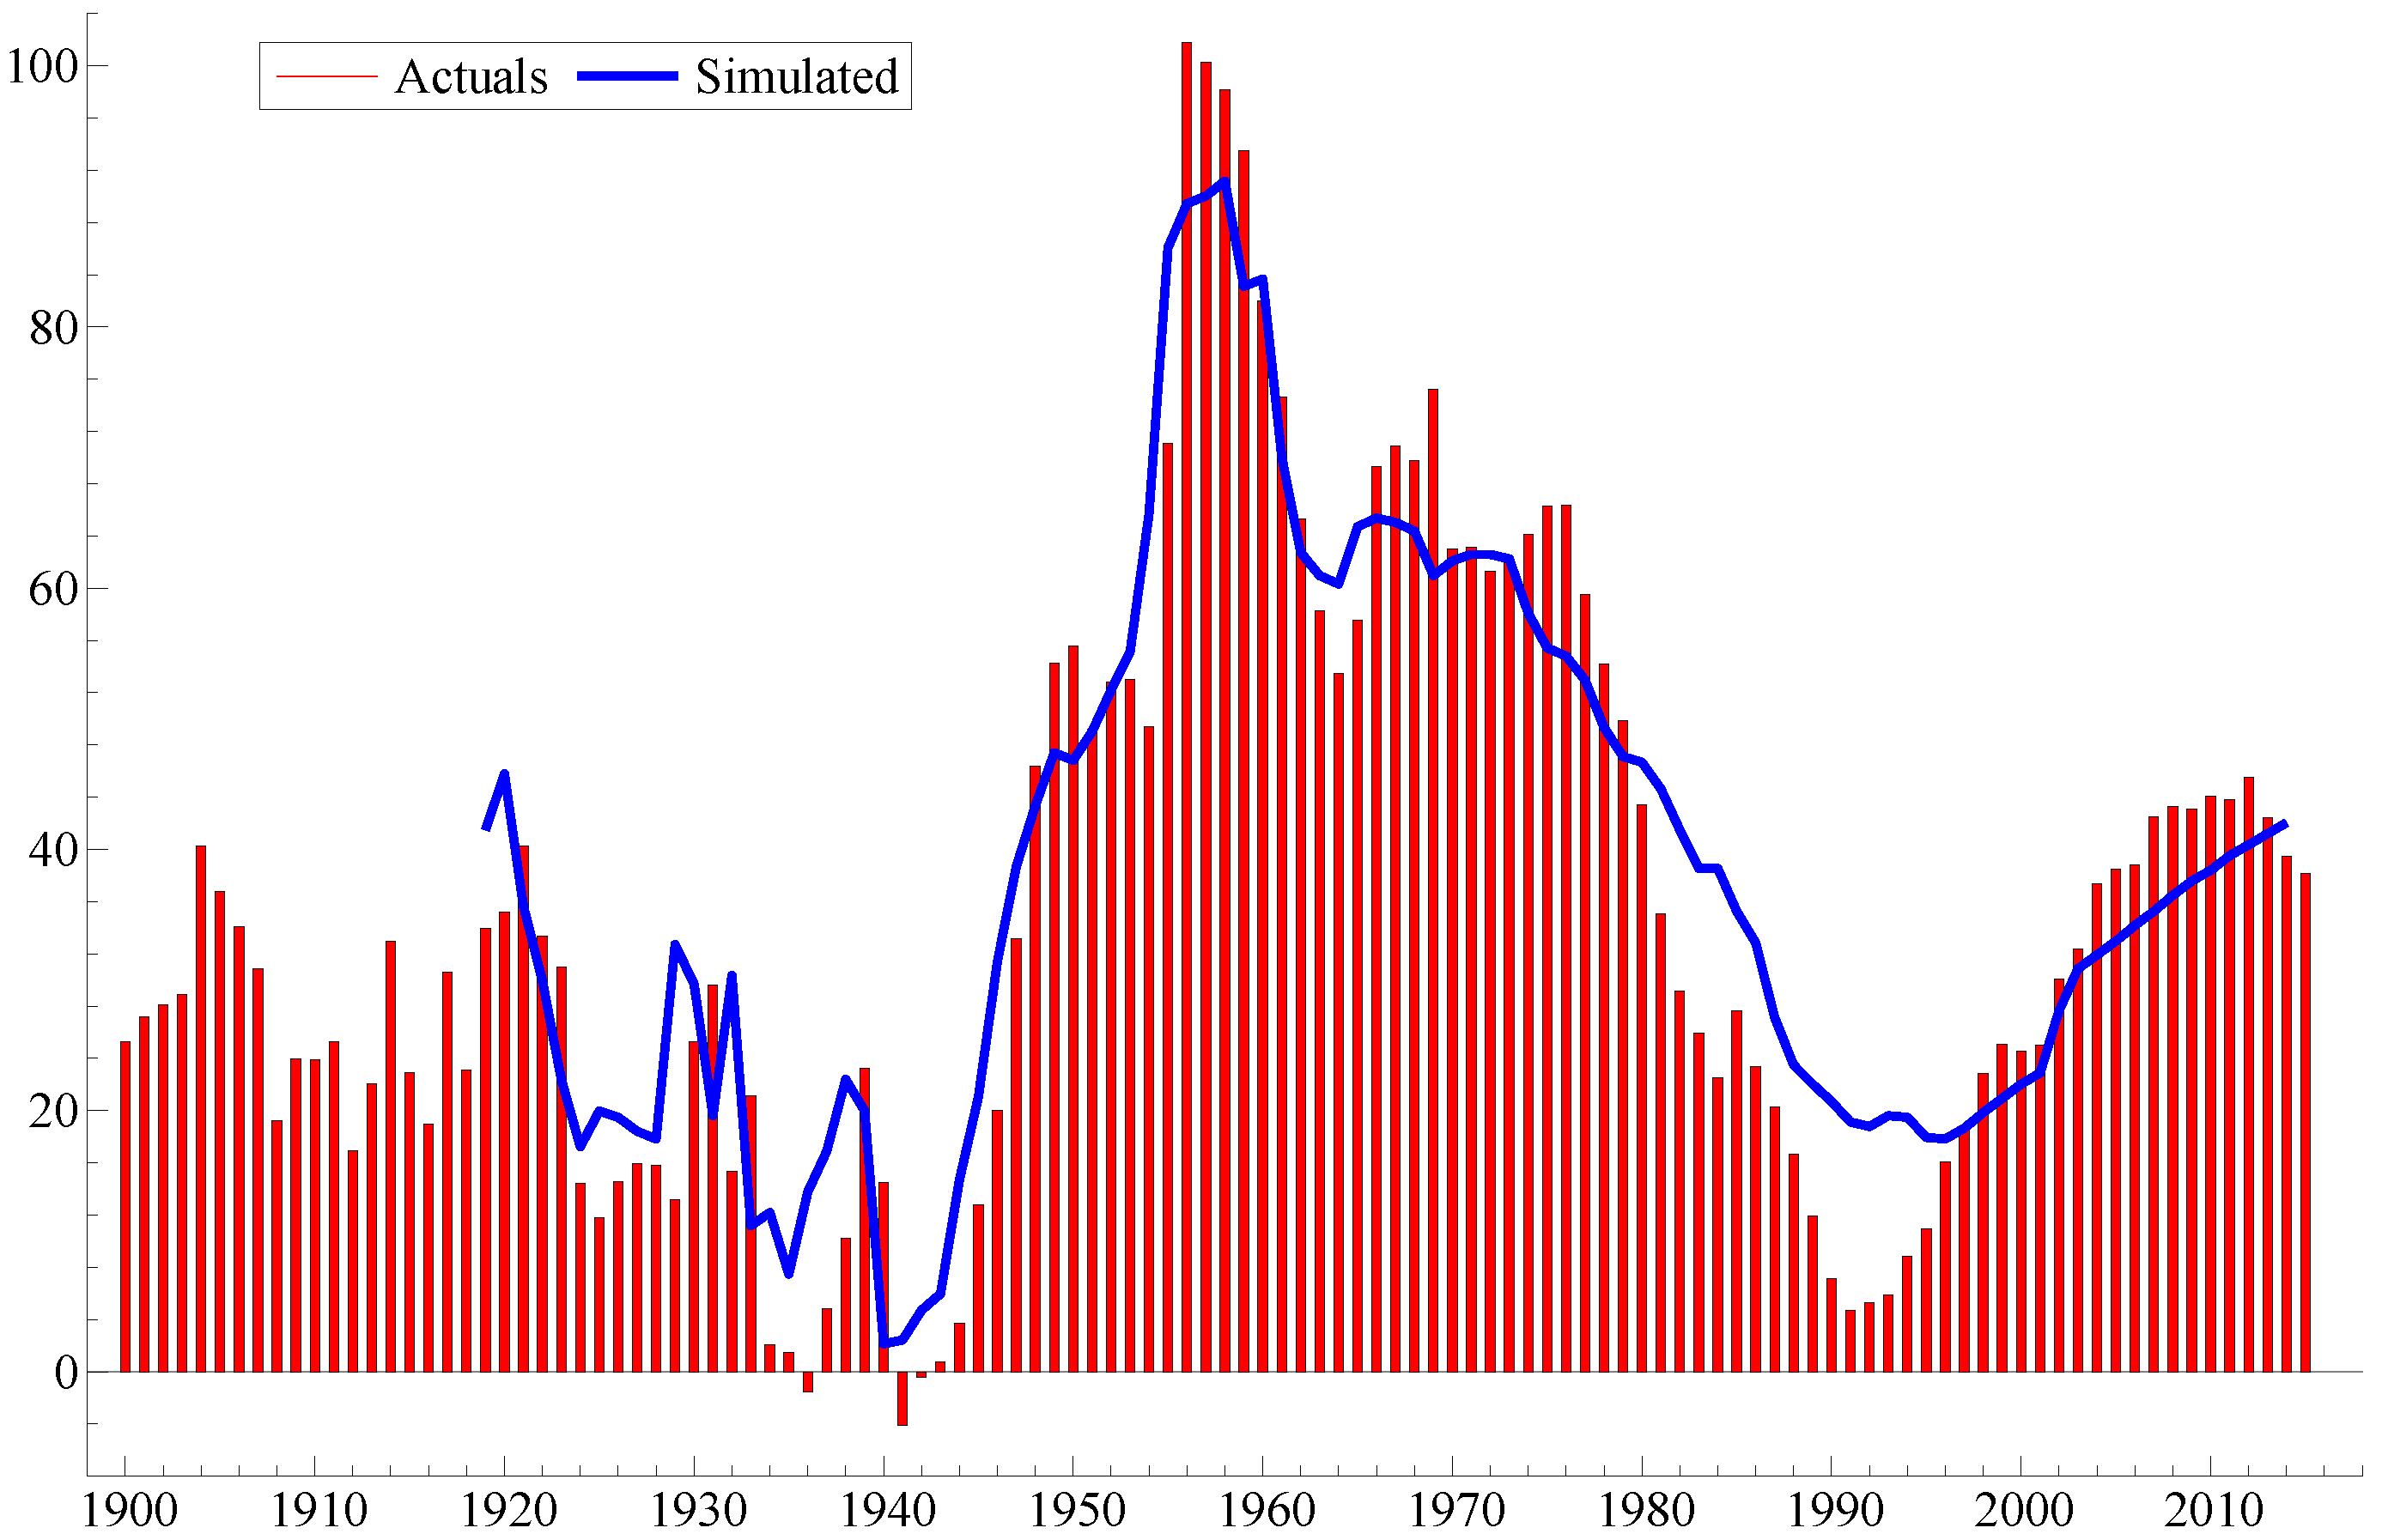
The bar chart in
Figure 8 shows all the 15-year growth rates from 1900 to 2015. The heights of the bars show the growth rates. The steady increase in the growth rates after the low-point at the start of the 1990s is easy to see. At the start for the graph, the impression is not so much that real wage growth was absent, but that it was relatively uneven. When the economy came out of the deflation years, real wage growth was very weak. Real wage growth was actually more positive during the deflation itself (the CPI index was more reduced than the yearly wage). However, that did not help the real economy much, since the increasing weight of debt depressed aggregate demand for product and labour.
Figure 8 also shows that the highest growth rates occurred in the late 1950s, not so surprising given how the economy developed during the reconstruction years. In 1956, the consumer real wage had doubled compared to the real wage of the first year of the Nazi occupation. The 15-year real-wage growth rates continued to be very high during the 1960s. Even the 1970s bad reputation for real wage eroding inflation seems a little exaggerated when we look at this graph: The real wage growth rates did not dip below 50 percent before 1980.
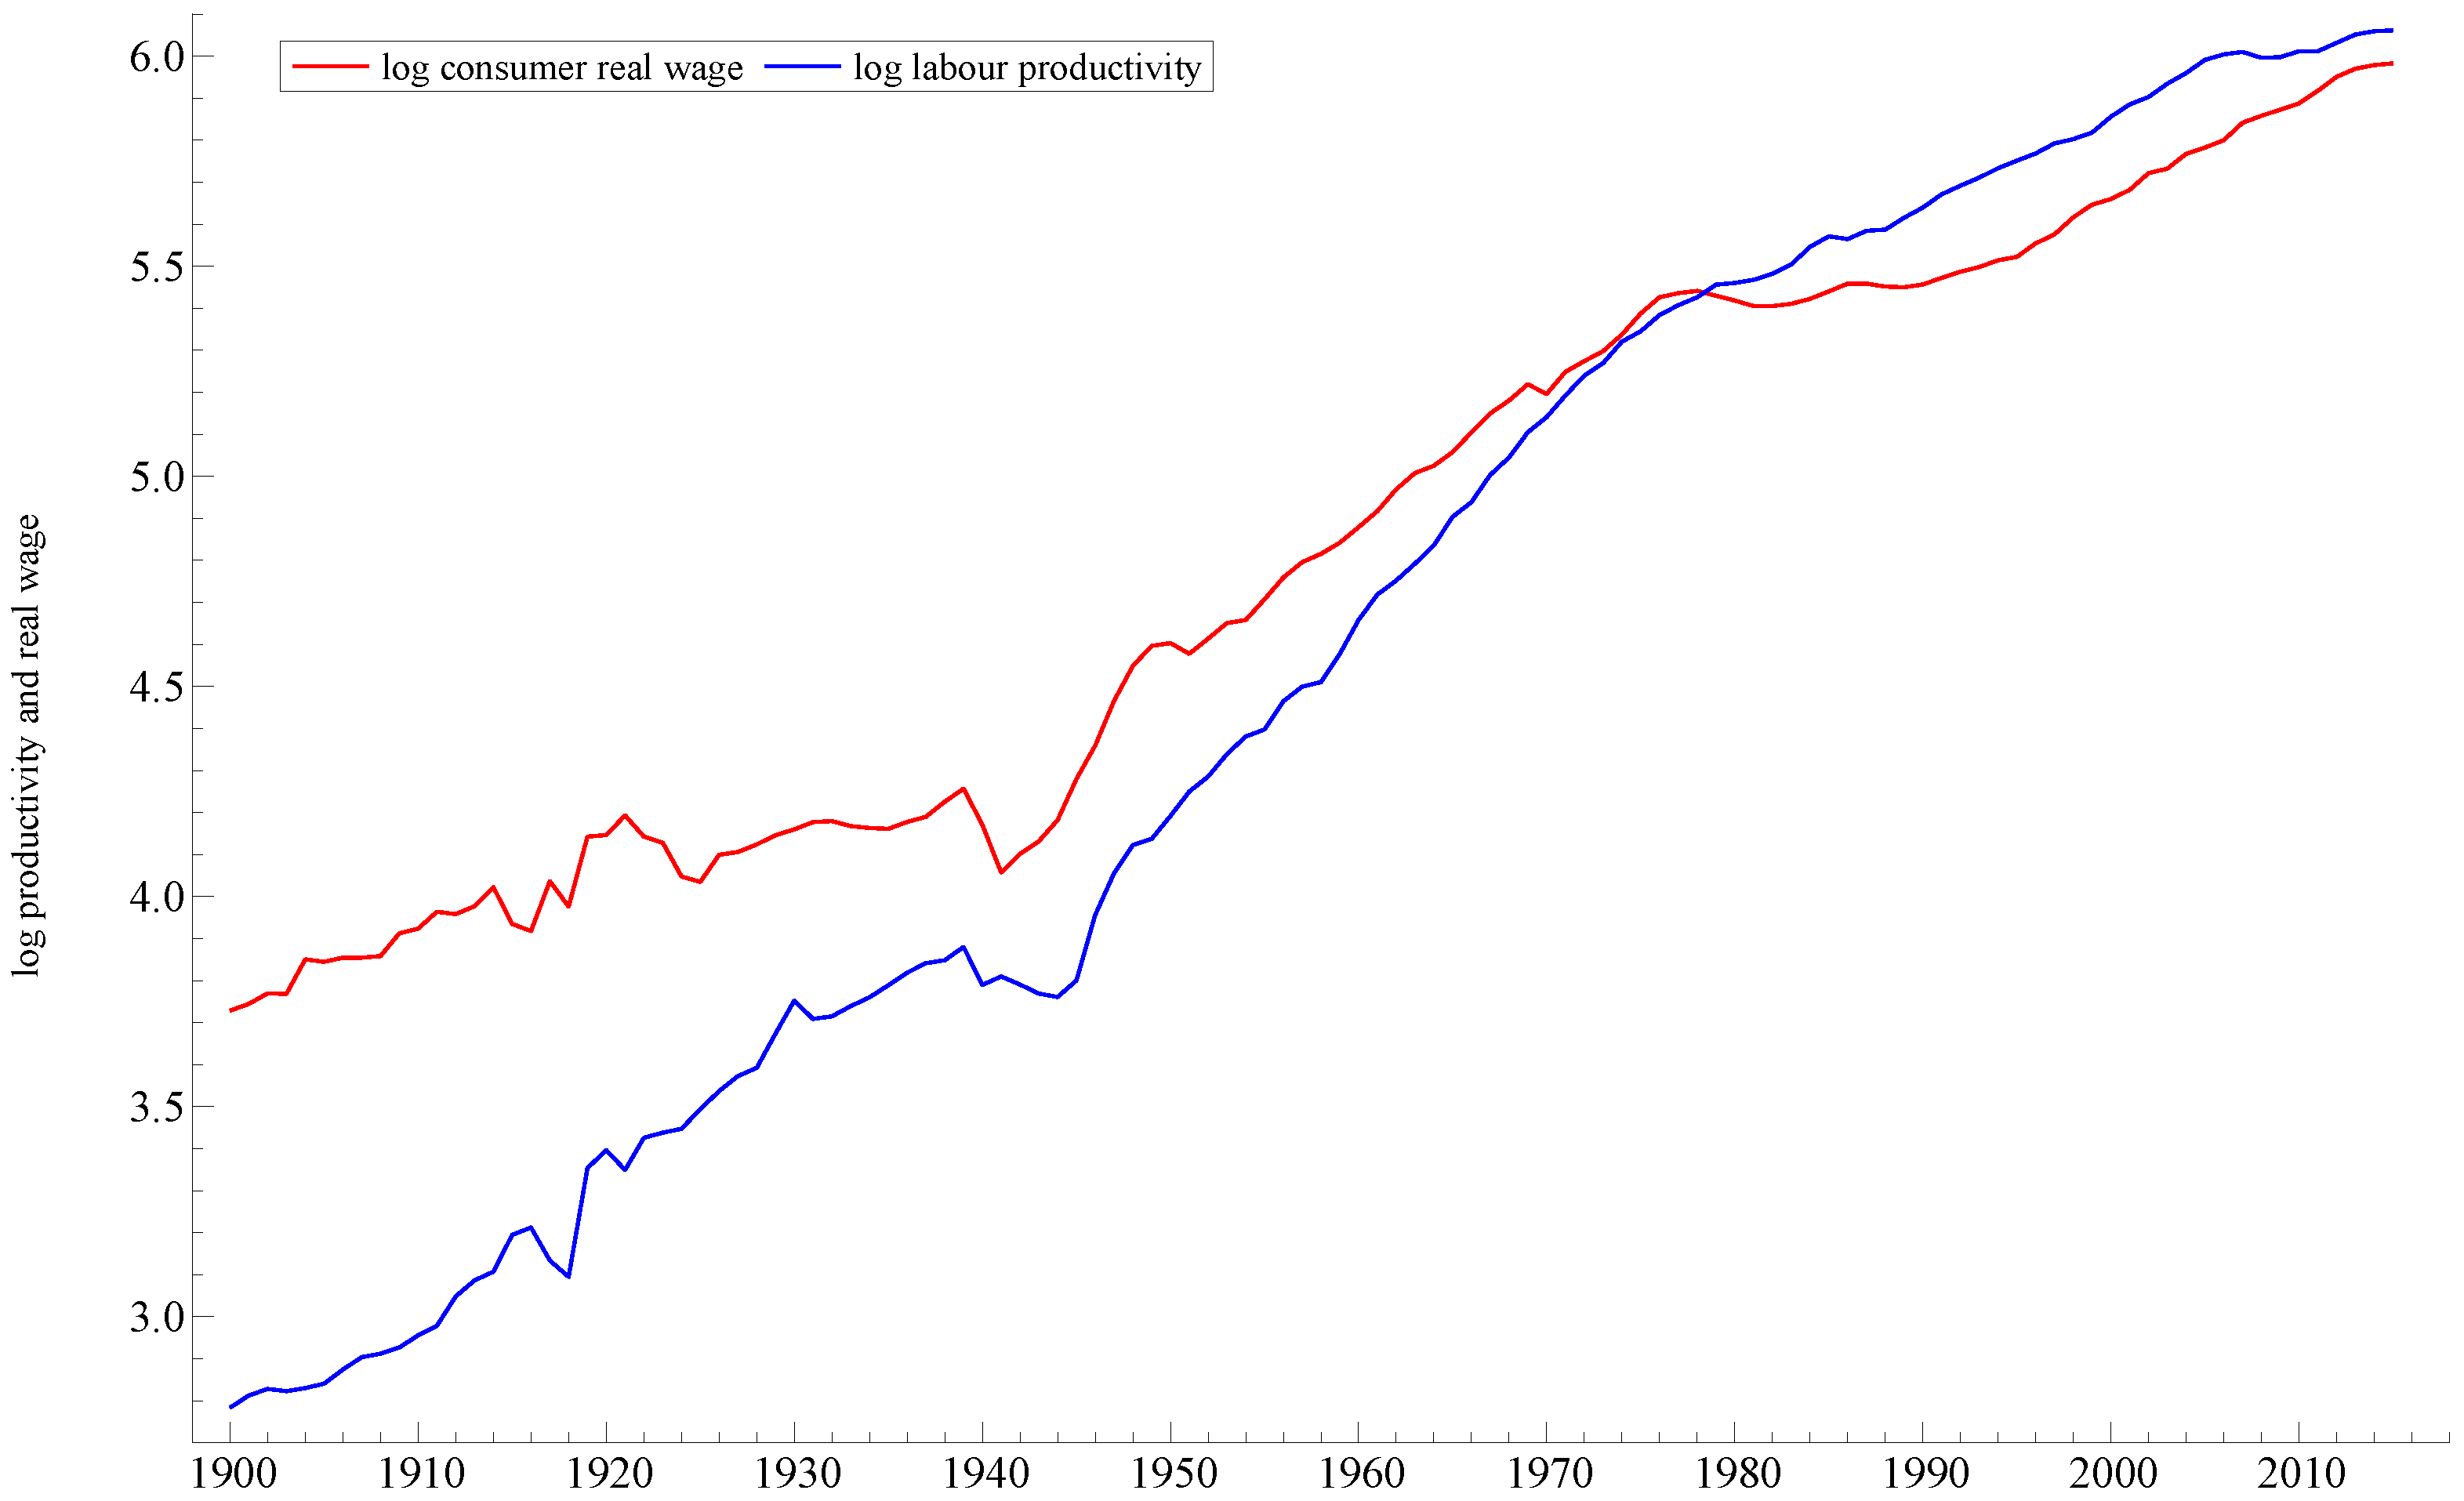
The relationship between labour productivity and the general wage level is nearly always close to the centre of discussion about wage formation. Often, and in particular in periods of practically full employment, the question is how to avoid that the growth in real wage costs, i.e., the producer real wage, does not exceed the growth in labour productivity, which could make the share of labour become so high that it harms necessary investments in the import and export competing sector. As mentioned above, the system with the manufacturing sector acting as the wage leading and norm setting sector, can be seen as an operation that solves that issue.
In many other countries, the focus is on another, related but nevertheless different, relationship, namely between the consumer real wage and labour productivity. There is evidence, across a number of countries, of consumer real wages falling short of productivity over the the last decades of our sample period, Haldane (2015) [
52]. For example, in the US, this has been apparent since the 1970s, and in the UK since the 1990s. In an econometric paper, Bårdsen and Nymoen (2009) [
53] modelled the US case by showing empirically that the trend in the wage level was weakly linked to the productivity level, and more strongly linked to a reference wage determined by the probability of getting a job elsewhere and the cost of living.
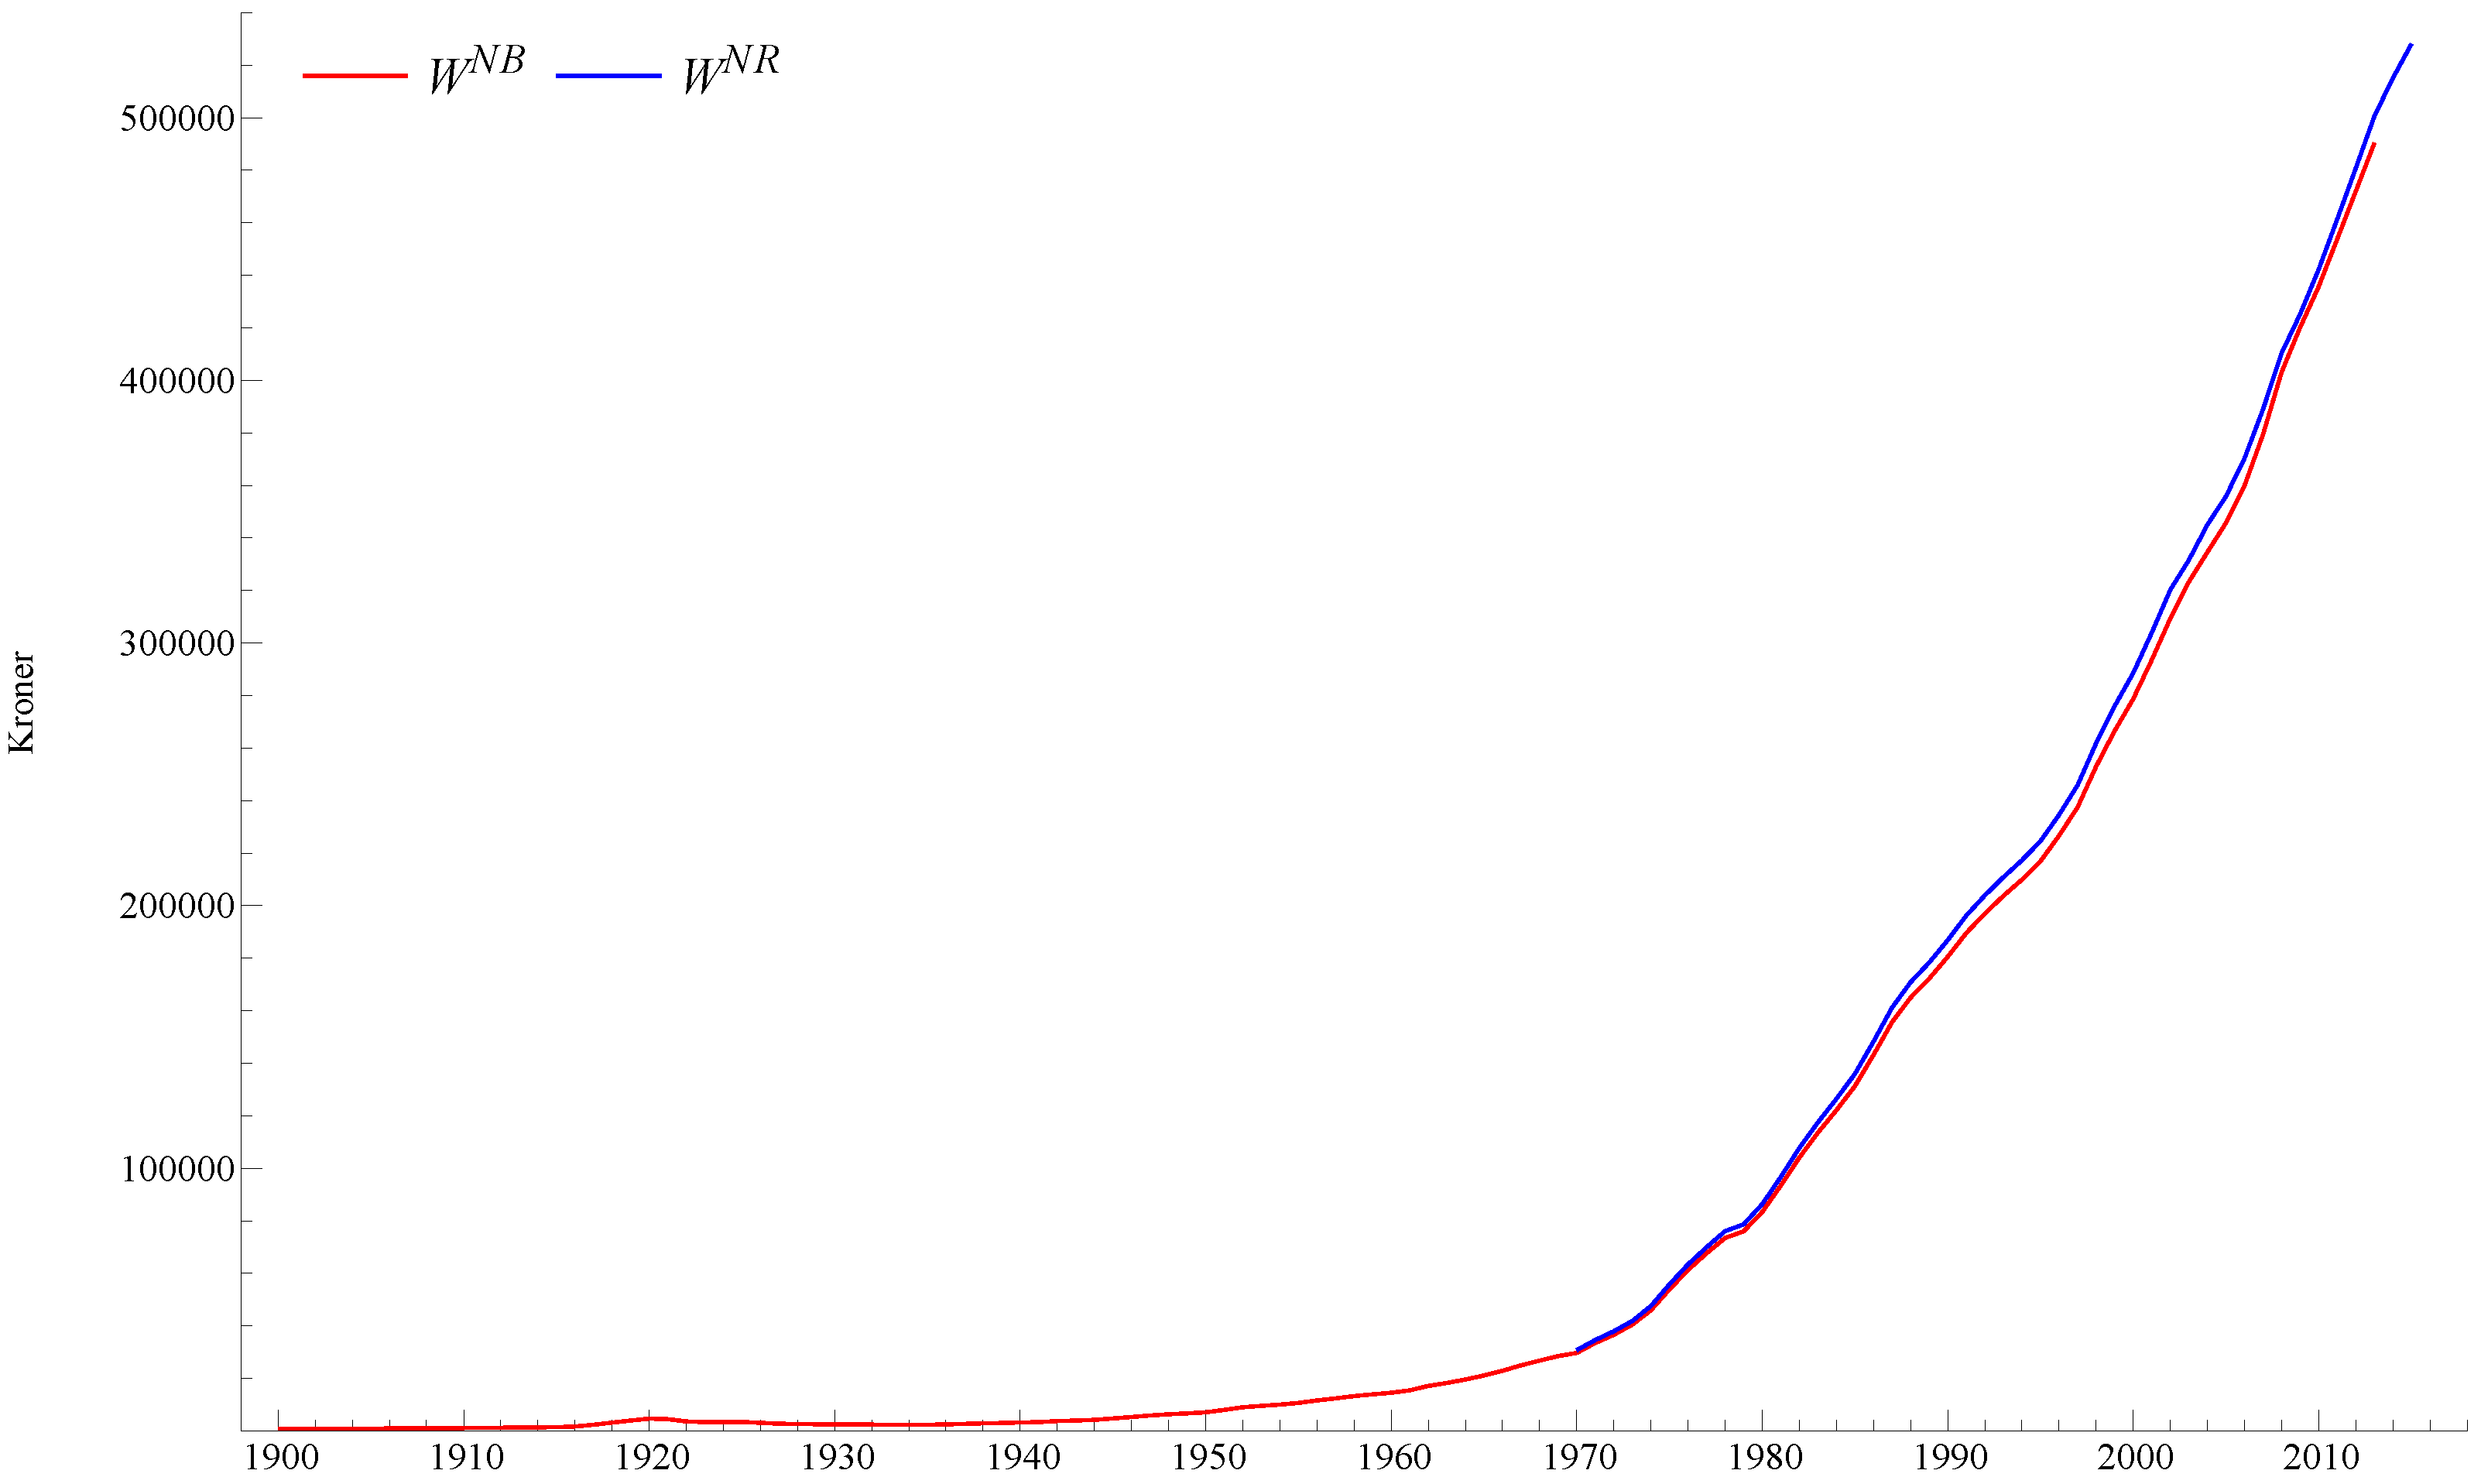
Another reason why the consumer real wage can drift away from productivity, perhaps most relevant for small open economies, is that by definition, the relative price of imports drives a wedge between the producer real wage and the consumer real wage. Hence if there are secular changes in the relative price of imports, a gap can open up between the consumer real wage and labour productivity, even if the producer real wage still tracks productivity. In Norway, this effect, due to fortunate terms of trade development, may have pushed the consumer real wage above the productivity trend at the start of the new millennium. In any case there are no traits in
Figure 9 of anything like the Anglo-American experience where labour has not shared in the fruits of the recent productivity growth, at least not so far.


