1. Introduction
Polymer electrolyte fuel cells (PEMFC) convert the chemical energy stored in hydrogen to electricity directly by the electrochemical reaction. They operate under lower temperature and have high efficiency and flexibility important for application in portable power sources and electric vehicles. Degradation of expensive platinum catalysts used in commercial power devices is currently under study in various academic and industrial organizations, which aim to increase the durability of polymer electrolyte membrane (PEM) fuel cells (FC). For understanding electrochemical mechanisms that cause the platinum surface degradation, we refer to [
1,
2,
3,
4,
5,
6] for diffusive models of platinum (Pt) degradation in a PEM catalyst layer (CL). One can find the related electrochemical modeling for nonlinear diffusion equations in [
7,
8,
9] and Butler–Volmer equations in [
10], multi-phase media with interface reactions in [
11,
12,
13,
14,
15], and mechanical degradation caused by cracks in [
16].
Holby and Morgan [
17] and further Li et al [
18] suggested the platinum degradation model based on the platinum ion (Pt
) dissolution:
and the platinum oxide (PtO) surface coverage:
For chemical study of oxidation reaction in fuel cells, we refer to [
19,
20]. The one-dimensional model for (
1) and (
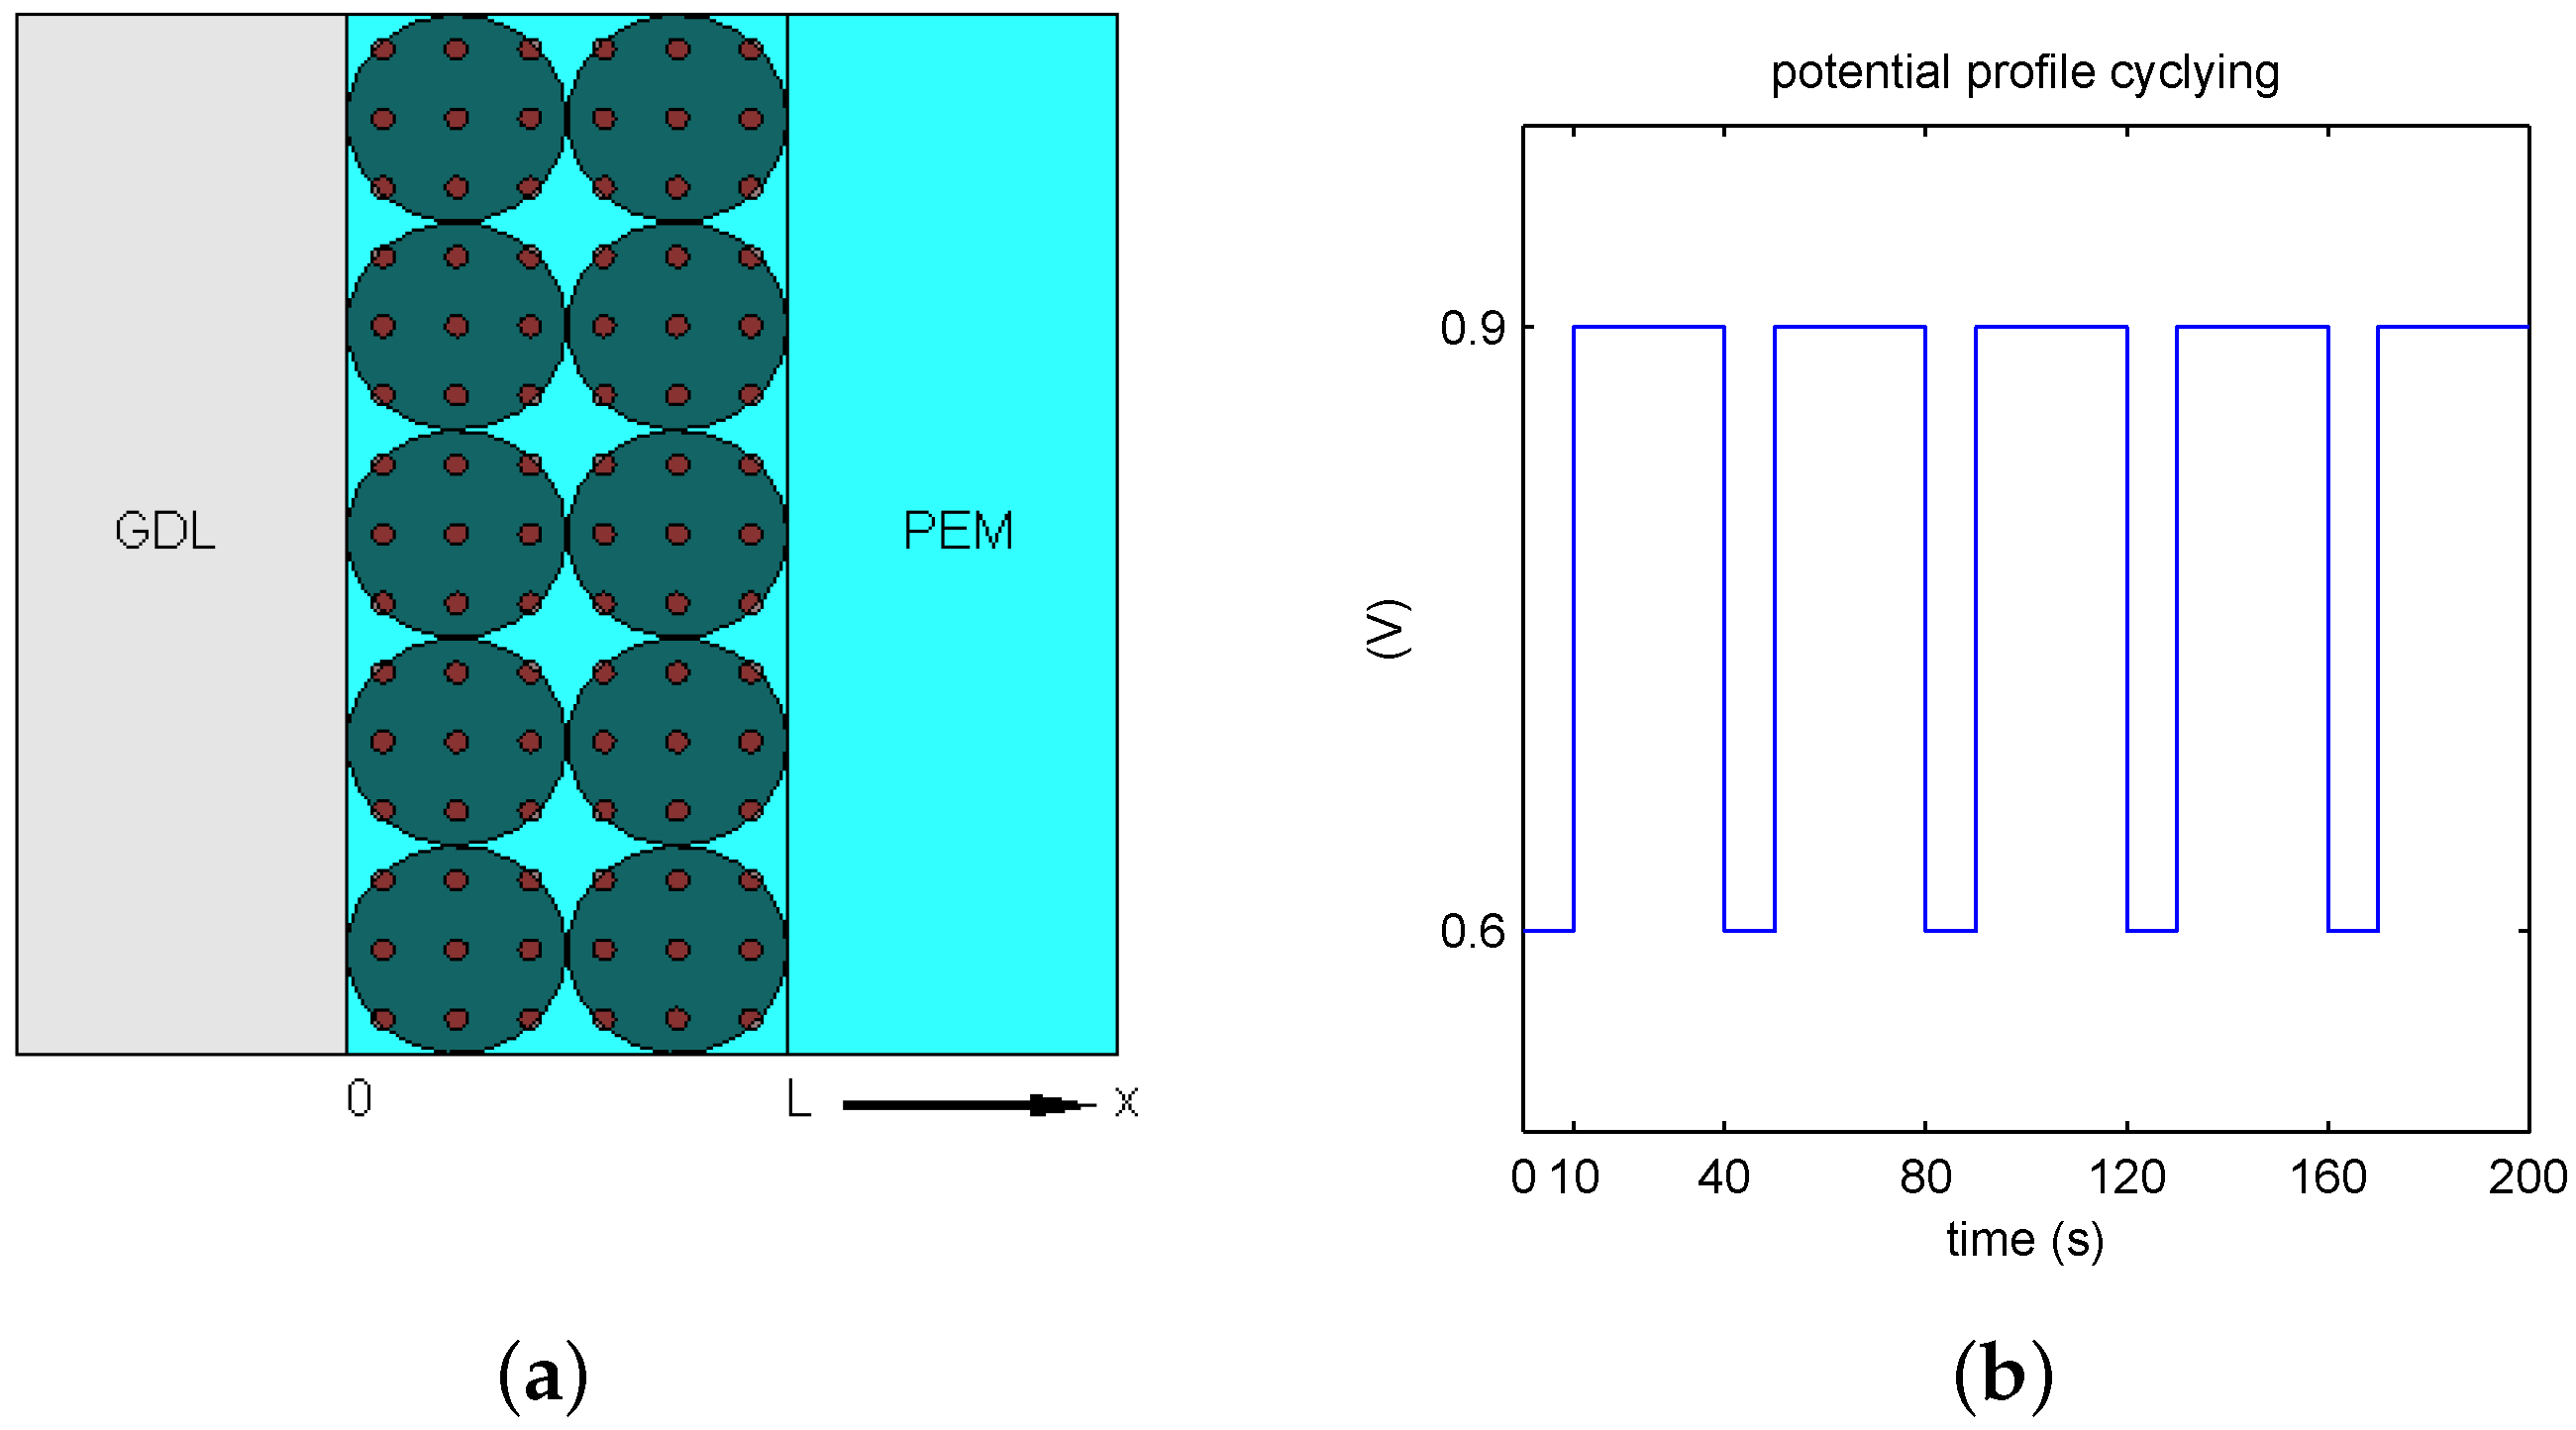
2) suggests the dissolution and diffusion into the ionomer membrane in one direction across CL, see sketch in
Figure 1a.
Based on the one-dimensional Holby–Morgan model, in [
21,
22] we investigated durability of PEMFC in the accelerated stress test (AST) under cycling electric potentials with various profiles: square used by Tennessee Tech University and the triangle developed by the U.S. Department of Energy and Nissan. Here, we study the non-symmetric square profile [
23] suggested recently by the European consortium on fuel cells and hydrogen joint undertaking. In each cycle of the period of 40 s, the electric potential level switches between
(V) during 10 s and
(V) during 30 s, as shown in
Figure 1b for five AST cycles within 200 s.
There are numerous studies on how operating conditions impact performance of PEMFC, e.g., we cite [
24,
25]. However, 30 input parameters in our degradation model include some fitting parameters characterizing the reference Pt ion concentration, bulk equilibrium voltage, and activation enthalpy for Pt dissolution and oxide formation. In the present study, we quantify the impact of the fitting parameters taken from the literature on the model output, which is the catalyst durability. The local sensitivity analysis is realized by a single parameter perturbation (the one-variable-at-a-time method). For the sensitivity index, the Pearson correlation coefficient (PCC) based on the covariance of input and output variables is argued in [
26].
2. Materials and Methods
The physical parameters are taken from [
22] and presented in
Table 1 for Pt particles in CL, where the temperature
T on the Kelvin scale corresponds to 80
C.
For platinum ion
formation and diffusion, and for platinum oxide PtO formation, the parameters are presented in
Table 2. The gas constant is
J/(mol × K), and the Faraday constant is
C/mol.
In
Table 3, we gather fitting parameters employed in the model.
In
Table 1 and the related discussion, the assumption of a perfectly deposited and regular catalyst layer is made; in
Figure 1a, a plane surface without roughness and 100% coverage of the support is assumed. The realistic catalyst layer usually produced commercially is irregular and has a partial coverage at Pt particles by ionomer and carbon support. Details of the physical model are described in our previous publications [
21,
22]. Here, we formulate governing equations for numerical simulation.
For time
, the electric potential difference
versus reference of 0 V is given by the square profile from
Figure 1b. The space variable
is set across the CL, where the left end at
meets the gas diffusion layer (GDL), and the right end at
confirms the interface with PEM, as sketched in
Figure 1a. We look for the unknown Pt ion concentration
(mol/cm
), particle diameter
(cm), and Pt oxide coverage ratio
satisfying
where the notation
(1/cm
), and
For physical consistency, the Pt ion concentration and the particle diameter should be positive, and the Pt oxide coverage ratio lies between 0 and 1. The reaction–diffusion Equations (
3)–(
5) are endowed with the initial condition:
and the mixed Neumann–Dirichlet boundary conditions:
which imply a no-flux condition at the GDL–CL interface, and zero concentration of dissolved ions at the CL–PEM interface.
Following [
17], the reaction rates in (
3)–(
5) are given by the modified Butler–Volmer equations, which describe the Pt ion dissolution (
1) by
in units of mol/(cm
s) and the Pt oxide coverage (
2) by
Equations (
8) and (
9) employ the auxiliary quantity
(mol/(cm
s)):
the quantity
(cm/s):
and the quantity
(C/J):
where the expression of
(J/cm
) is given by
All parameters employed in the system (
3)–(
13) are collected in
Table 1,
Table 2 and
Table 3.
To numerically solve the system (
3)–(
7) with nonlinear reactions of the exponential type given by (
8)–(
13), we suggest a variable time-step 4th order Runge–Kutta method. For the square voltage profile, a step-size is refined locally at the electric potential lift-off from
to
. In the numerical tests, we set the coarse time step to
s, and the uniform CL thickness spacing
(cm). The fine time
s was sufficient inside
-neighborhood of the electric potential
lift-off from 0.6 to 0.9 (V) at the time
s during each period, see
Figure 1b.
3. Results
We calculate the relative Pt mass ratio with the help of the particle diameter
d divided by the constant
from the initial condition in (
6) at
as follows:
such that
for decay. Ignoring stronger Pt mass loss near the membrane than at the GDL interface, we average this quantity over the CL thickness as
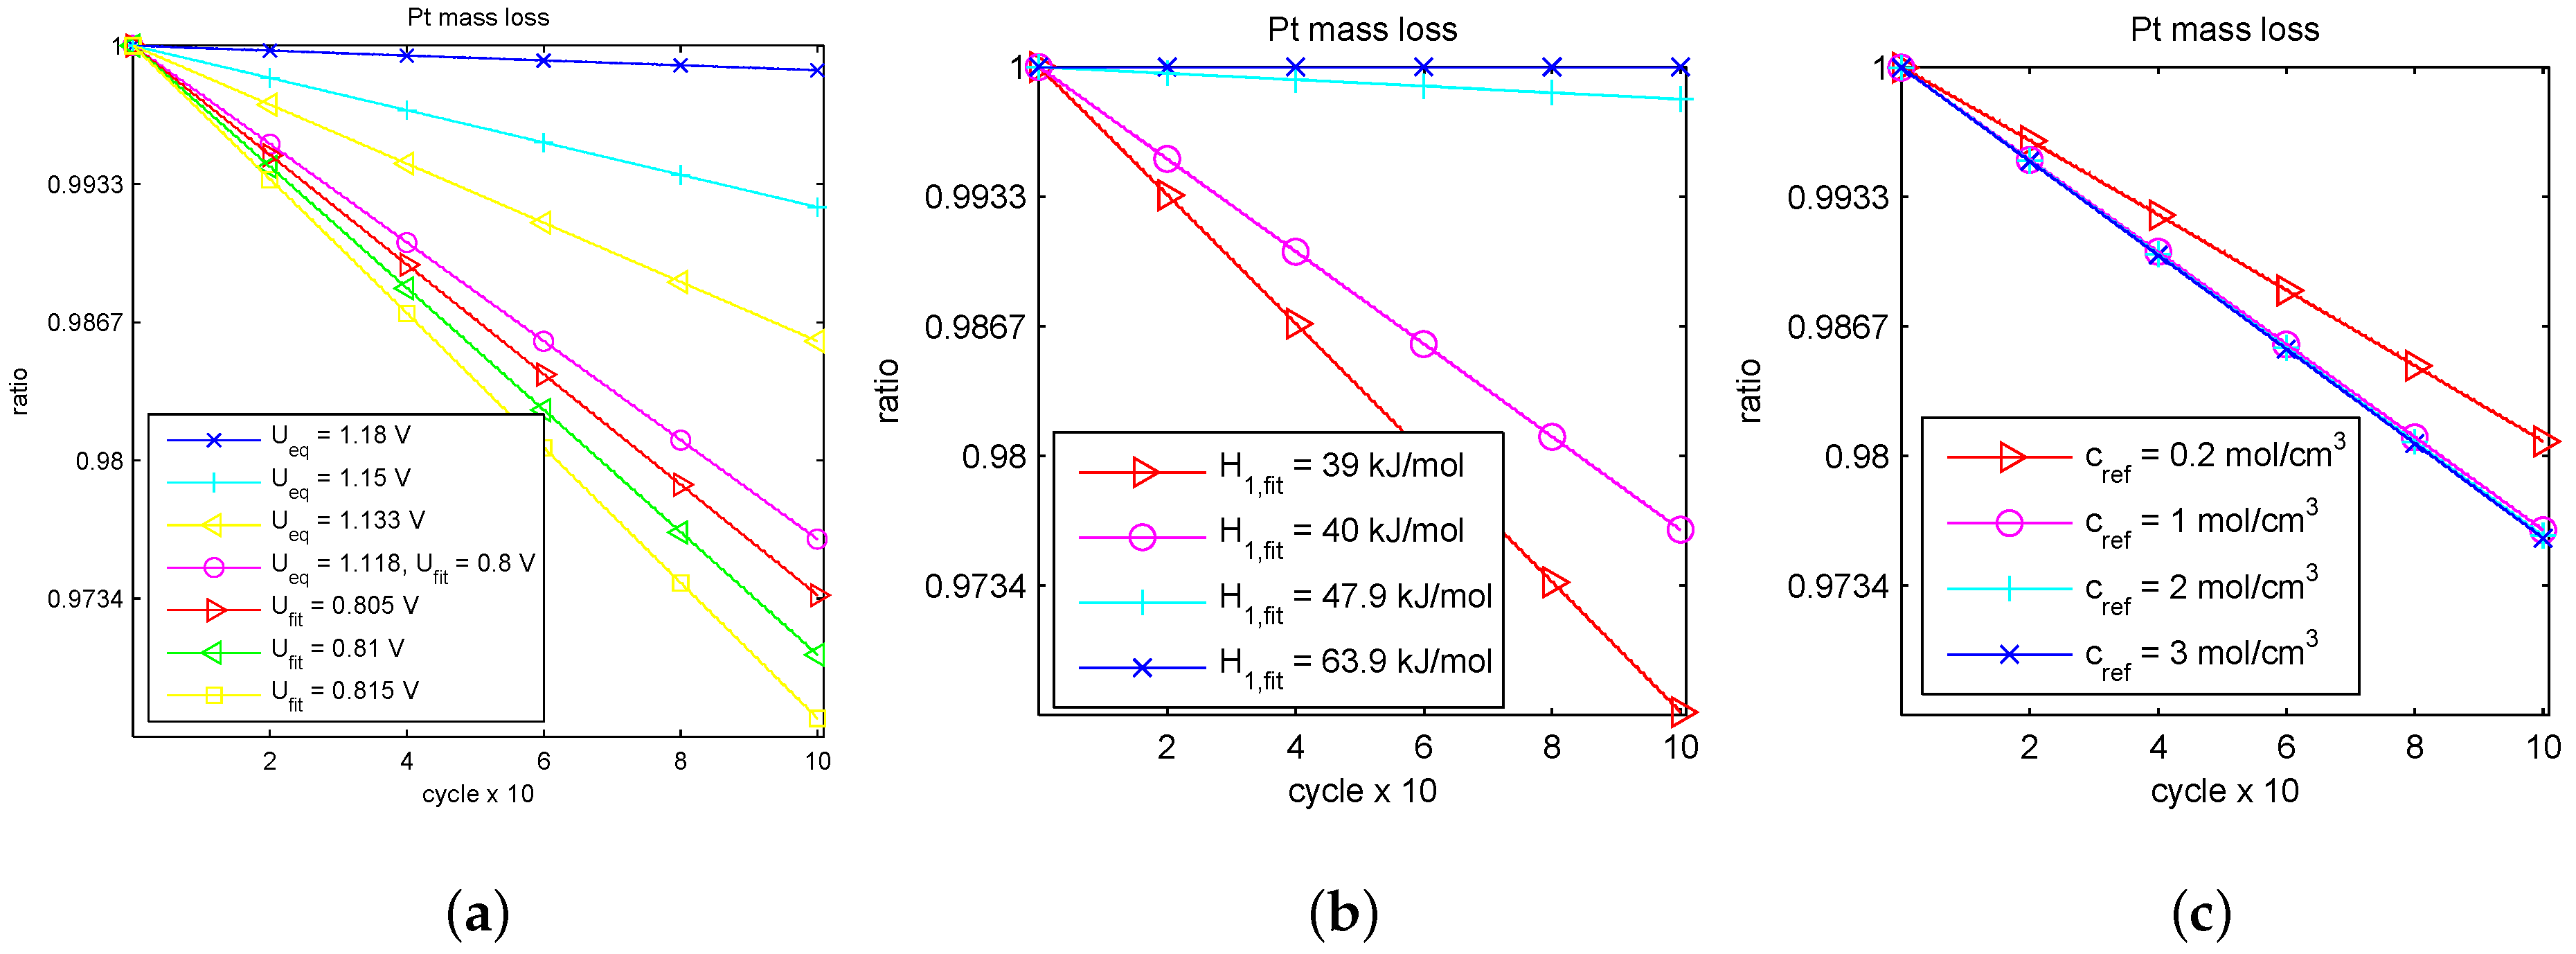
We investigated how different fitting parameters taken from [
6,
17,
18,
21] impact the platinum catalyst degradation within the model (
3)–(
13). We vary the bulk equilibrium voltage of Pt dissolution
(V) and oxide formation
(V), Pt dissolution activation enthalpy
(J/mol), reference ion concentration
(mol/cm
), while the value
given in
Table 3 was found unique. The corresponding lines of the averaged platinum mass ratio
on 100 cycles during 1 h 6 min 4 s are depicted in
Figure 2.
A decay in time of
affects the larger catalyst durability for smaller Pt mass loss rate, otherwise, drop for larger rate. Moreover, based on the linear decay seen in
Figure 2, we calculated the slope
and linearly extrapolated it with respect to a number of cycles up to
, when the catalyst is out of order. The lifetime prognosis is presented in
Table 4 in descending order with respect to the predicted number of live cycles and hours of work. The reference parameter values are marked in color here.
In
Table 4, we can observe essential differences in the lifetime prognosis when varying the fitting parameters.
4. Discussion
We compare the relative impact of the parameters by measuring the output
from variation of a specific input
X with the help of PCC
For the fitting parameters
from
Table 4, respective Pearson coefficients
are gathered in ascending order in
Table 5.
The magnitude characterizes sensitivity of the model to variation of a specific parameter X. A positive sign means that an increase of X increases the Pt mass loss and reduces lifetime. A negative sign implies a decrease of the platinum loss and raises lifetime.
From
Table 5, we conclude that the model is more sensitive to change of the Pt dissolution bulk equilibrium voltage
and Pt oxide formation bulk equilibrium voltage
and less sensitive when changing the Pt dissolution activation enthalpy
and reference Pt ion concentration
, whereas a decrease of
,
and an increase of
,
lengthen lifetime. These results are of interest for future studies to compare data of numerical simulations that can be found in the literature.
5. Conclusions
We presented the result of the variance-based sensitivity analysis for PEMFC cycling durability with respect to variation of the selected fitting parameters. Using regression analysis, we found that fitting parameters of Pt dissolution and oxide formation bulk equilibrium voltage have the highest tendency to degrade the PEM membrane for our modeling. Direct comparison of the numerical study with a real-time working model is little-known because rare data of protocols and operating conditions are freely available in the literature. The more accurate conditions for the modeling of prolonged cycling durability by varying temperature, relative humidity, ionomer volume fraction in cathode, Pt particle size, loading, and diffusion coefficient characterizing the platinum ions transport is the subject of a forthcoming work.


