Article

Multi-Classification of Lung Infections Using Improved Stacking Convolution Neural Network

by
Usharani Bhimavarapu
1,
Nalini Chintalapudi
2 and
Gopi Battineni
2,*
1
Department of Computer Science and Engineering, Koneru Lakshmaiah Education Foundation, Vaddeswaram 522302, Andhra Pradesh, India
2
Clinical Research Center, School of Medicinal and Health Products Sciences, University of Camerino, 62032 Camerino, Italy
*
Author to whom correspondence should be addressed.
Technologies 2023, 11(5), 128; https://doi.org/10.3390/technologies11050128
Submission received: 23 August 2023 / Revised: 11 September 2023 / Accepted: 15 September 2023 / Published: 17 September 2023
(This article belongs to the Special Issue Medical Imaging & Image Processing III)

Abstract

:
Lung disease is a respiratory disease that poses a high risk to people worldwide and includes pneumonia and COVID-19. As such, quick and precise identification of lung disease is vital in medical treatment. Early detection and diagnosis can significantly reduce the life-threatening nature of lung diseases and improve the quality of life of human beings. Chest X-ray and computed tomography (CT) scan images are currently the best techniques to detect and diagnose lung infection. The increase in the chest X-ray or CT scan images at the time of training addresses the overfitting dilemma, and multi-class classification of lung diseases will deal with meaningful information and overfitting. Overfitting deteriorates the performance of the model and gives inaccurate results. This study reduces the overfitting issue and computational complexity by proposing a new enhanced kernel convolution function. Alongside an enhanced kernel convolution function, this study used convolution neural network (CNN) models to determine pneumonia and COVID-19. Each CNN model was applied to the collected dataset to extract the features and later applied these features as input to the classification models. This study shows that extracting deep features from the common layers of the CNN models increased the performance of the classification procedure. The multi-class classification improves the diagnostic performance, and the evaluation metrics improved significantly with the improved support vector machine (SVM). The best results were obtained using the improved SVM classifier fed with the features provided by CNN, and the success rate of the improved SVM was 99.8%.

1. Introduction

Lung disease is a leading cause of death across the globe, and pneumonia, one of the most common infectious diseases, is also one of the leading causes of mortality worldwide [1]. Pneumonia is an infection that occurs in the lungs, and every year it affects approximately 7% of the global population, and four million patients face mortality risks [2]. Using imaging tests can help doctors diagnose abnormalities. However, lung disease is on the rise, making it difficult for doctors to diagnose it due to a shortage of radiologists. Early detection and diagnosis reduce life-threatening conditions and improve quality of life [3].
Respiratory system symptoms are the first indicator of pneumonia [4]. An X-ray of the chest, a CT scan, a blood gas analysis, and a complete blood image are all methods used to diagnose pneumonia. Medical professionals can view the internal structures of the body using chest X-rays and computed tomography (CT) images. It is possible for medical professionals to fail to diagnose minor lesions [5]. It has been shown that chest X-ray images and CT scans are sensitive to pneumonia and infectious diseases, like COVID-19 [6].
By using computer-aided diagnosis (CAD), diagnosis times can be reduced, and diagnostic convenience can be increased. Diagnostic performance is improved with CAD systems, which minimize misreading and allow medical professionals to provide precise diagnoses. Using CT scan images and chest X-ray images obtained from lung-infected disease patients, deep learning models have provided more efficient results than traditional models [7]. In this work, the proposed CAD system extracts the most efficient features of pneumonia and contributes positively to classification results. Image processing-based feature extraction is complex compared to deep learning models, and the performance of these models surpasses the traditional models.
The Infnet model [8] was focused on lung infection segmentation and failed in terms of clinical management as it frequently needed to classify and then segment the infected area for further treatment. Unet [9] segments the COVID-19 infected regions but fails to conduct the semantic segmentation in order to estimate clinical management, the robustness, and the performance. The transfer learning approach [10] segments the COVID-19 lung infection but fails to reduce the computational complications. The coronavirus pandemic affected many people across the world and created great challenges for international health management [11,12]. As such, continual screening, earlier diagnosis, and timely actions are significant for controlling the spread of disease, as well as for reducing mortality. An exact segmentation of all kinds of lung infections could help the health professionals or doctors to prescribe the correct specific treatment. CNN models evaluate many attributes of the mammalian visual context that were not visible and identified by radiologists [13].
CNN models achieve high accuracy for image datasets by adjusting weights and parameters [14,15]. In [16], the authors implemented the CNN model and achieved 70% classification accuracy. Similarly, the CNN model was implemented to classify pneumonia cases with 98% accuracy [17]. The Inception v3 [18,19] model also identified as a potential model to classify pneumonia [20]. Other studies implemented nine different transfer learning approaches to classify COVID-19 and pneumonia and achieved 95% accuracy [21]. Using EMCNet to extract the features and later applying the ensemble approach to classify COVID-19 cases achieved an accuracy of 98.91% [22]. Furthermore, transfer learning classifiers help to identify COVID-19 with an accuracy of 81% [23].
CNN models do have some restrictions, though. In order to attain observable performance, CNN models require extensive network training. Additionally, the dataset being used for training should include all the different sample variants so that the model can be simply generalized to previously unknown data, although this is not always attainable. Overfitting, which results in generalization mistakes, may happen if DL-based models are trained on a smaller dataset. To overcome this drawback, we proposed an improved kernel in the CNN, which reduces the overfitting.
Most state-of-the-art models focus on the binary classification of either pneumonia or COVID-19, and limited research on the multi-class classification of COVID-19 and pneumonia from a chest X-ray and CT scan images has been carried out. The major limitation of the existing works is prioritizing the dataset before feeding it to the classifier. This study proposed an improved kernel convolution function to improve accuracy and reduce complexity. Later, the proposed improved SVM can better classify the lesions and reduce the complexity, which increases accuracy.
Motivation
The detection of the infected lung regions from the chest X-ray and the CTscan images provides high potential for increasing classical healthcare planning to tackle lung diseases, like COVID-19. In the existing studies, the infected lung region is frequently unclear and, thus, it is very complicated for doctors and healthcare professionals to differentiate the normal images from the infected images. This motivated us to propose an approach for the identification of the lung infected areas in CT scan and chest X-ray images.
Research Contributions
  • We propose an improved integrated image enhancement approach to enhance the image contrast.
  • We propose an improved kernel in the stacking CNN to detect lung infection using CT scans and chest X-rays.
  • The proposed model is compared to the existing models utilizing the CT scan and chest X-ray images.
  • A comparison of the proposed model with other models shows that the proposed models have the highest performance.
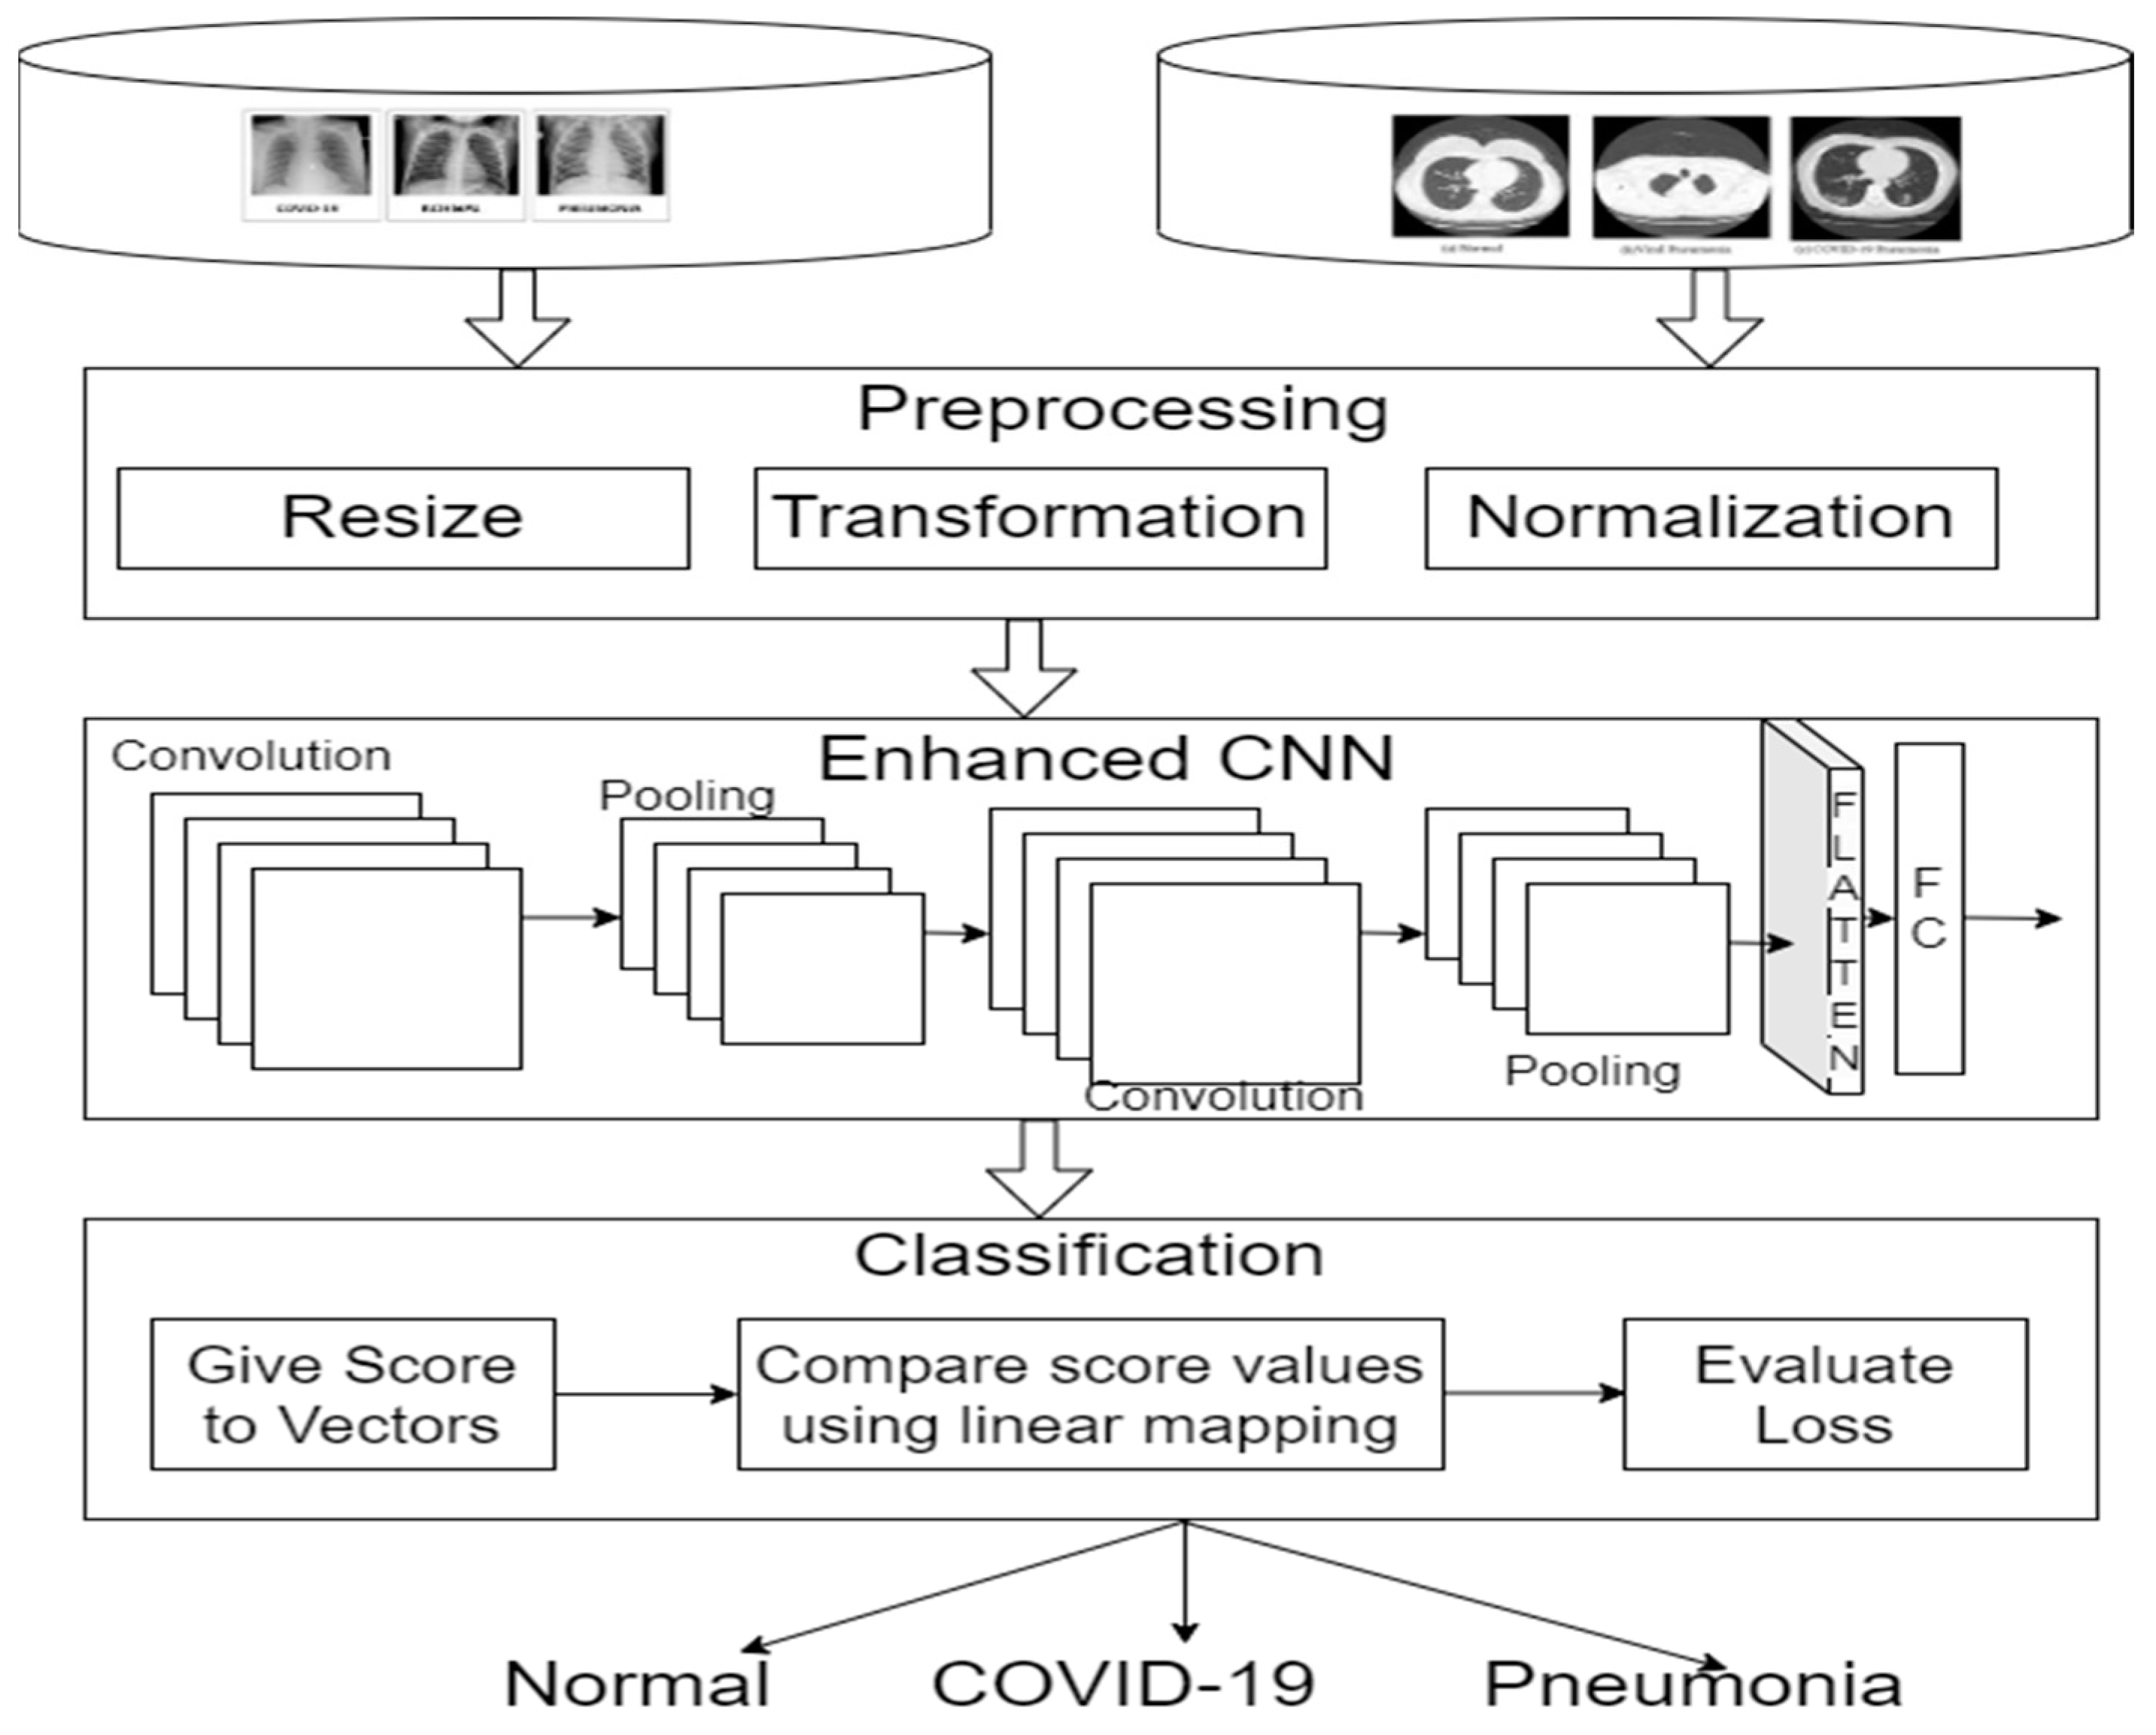
The rest of the paper is organised as follows. Section 2 describes the dataset collection and the proposed approach in detail. Results analysis and comparison with the existing models are presented in Section 3. Section 4 discusses the advantages of the proposed work. Section 5 concludes the proposed work and the future work needed to overcome the limitations of the proposed work.

2. Methods

We aim to categorize CT scans and chest X-rays into different severity categories in the current study. An automated system for assessing lung disease severity was discussed. According to current research, the modified CNN architecture improved the accuracy of lung disease classification. We divided the methodology into three phases: pre-processing, segmentation, and classification. In the data pre-processing phase, we proposed an enhanced Gaussian distribution to improve the lesions’ visual contents. In the segmentation phase, we proposed an enhanced CNN model to segment the lesions in the CT scan and chest X-ray images. After segmentation, we performed multi-class classification by implementing the improved SSVM. An illustration of the proposed approach flow can be found in Figure 1.

2.1. Dataset

CT scan images were collected with three different sources [24,25,26]. We removed the repeated images and unrelated body parts (e.g., head) that are not related to the lung. The cleaned final dataset contains 1043 CT scan images, and each class consists of pneumonia (n = 359), normal (n = 333), and COVID-19 (351) samples.
Additionally, 5935 chest X-ray images from two different source are collected [17,18]. We divided the training and testing data in the ratio of 85:15, which consist of 4747 for training and 1188 for testing. This training dataset consists of 3 classes: 63 images of COVID-19, 1266 normal, and 3418 pneumonia chest X-ray images. This testing dataset consists of 3 classes: 16 images of COVID-19, 317 of normal, and 855 of pneumonia chest X-ray images. Table 1 tabulates the splitting of training and testing sets of chest X-ray and CT scan datasets.

2.2. Data Pre-Processing

In this study we used the improved ensemble approach to enhance the images with the integration of two approaches of top hat filtering and a Wiener filter. Given a database of k images, it is represented as D k . Each image is defined as I k p , q with dimension PXQ, where P and Q have a value of 512. Figure 2 shows the unprocessed and the processed CT scan images. The mathematical operation of the top hat filtering is as follows:
I t p , q = I k p , q ( I k p , q o s )
where s represents a structuring element with value 21 and o denotes the opening operator.
Equation (1) improves the contrast of the image. Next, an improved Weiner filter is used to remove the noise in the medical images. The mathematical representation is as follows:
W m p , q = w ( p . q ) w p , q 2 + λ
where W p , q = e p 3 + q 3 2 s 2 ,   λ is constant with value 1, and W m is the minimized error for the Weiner filter.
Finally, to obtain the enhanced image for further processing, we integrate the results of Equations (1) and (2), as follows:
I e p , q = ( I t p , q + W m p , q ) I k p , q

2.2.1. Enhanced CNN

We developed an enhanced CNN model to detect lung illness accurately. The proposed model consists of convolution blocks and includes the improved kernel convolution function, drop-out layer, and dense layers. Figure 3 and Figure 4 show the overall enhanced stacked CNN and detailed convolution kernel functioning.
All layers in the proposed model receive input from the prior ones and pass along their feature mappings to all subsequent layers. Instead of adding the layer’s incoming and outgoing feature maps, the proposed method concatenates them. As a result, the proposed model is split up into dense blocks, where the filter numbers may change inside a block, but the feature map dimensions never change. The transition layers, which are the layers between the blocks, go through batch normalization in order to reduce the number of channels by 50%. However, the proposed model requires fewer parameters and allows feature reuse, which makes the networks smaller.
The proposed model encourages the reuse of features by creating dense relationships between layers inside a dense block. A robust feature transmission between layers is made possible by the dense connections, which also increase the gradient flow. The computational efficiency of the proposed model is also improved by the fact that it has many fewer trainable parameters. The bias and skewness caused by the asymmetric class distribution were reduced by proportionally adjusting the class weights. Additionally, early stopping was used to address the overfitting problem while preserving the convolution neural network’s generalization ability. Additionally, the last few layers of the proposed model were adjusted to better match the learnt high-level properties.
The deep feature map was extracted in the proposed model by concatenating the feature map outputs from the final convolutional layer of the sacked CNN models along the channels. To provide flexibility to the stacking model and reduce generalization error, we used a fully connected neural network as a meta-learner. The final scores were then calculated by concatenating the final feature maps and running them through the softmax activation.
To obtain the channels of the maps to the same depth, 1 × 1 pointwise convolution was first applied to each of these feature maps. These maps were then provided to five stacks as input feature embedding. The final output was then obtained by flattening the final feature map and running it through a dense layer with softmax activation. Stacking works by determining the biases in relation to a given training set. A final classification layer with Sigmoid activation and a few fully connected layers with rectified linear unit (ReLU) activation were added to the model to improve its performance on the dataset. To achieve a better outcome than the individual forecasts, we have combined the predictions from the sub-models in this case. We combined the CNN models into a single one by concatenating them, and we then added two dense layers with the softmax and ReLU activation functions.

Enhanced Kernel Convolution

In order to guarantee feature independence during stacking modelling, the deep features were extracted from trained models. The model can fit the training data more accurately according to the increased model complexity, which lowers the bias. The proposed models learn extensive independent aspects about the data by combining the deep feature maps, which enables the models to generalize more effectively on the test database. The proposed feature extractor’s depth-wise separable convolution requires fewer parameters, which reduces overfitting. The proposed model’s dense block enables improved gradient propagation and feature sharing. The proposed models have fewer parameters, since they used meta-learners after the convolutional layers. Algorithm 1 presents the enhanced kernel function algorithm.
The latent dimensions of the kernel weights are defined using the kernel weights as functions of the latent values. Each channel weight is represented by the proposed curves weighted sum, as follows:
w ( b ) = w ^ [ F 2 π e u + e u e u e u   b + A + C ] , b [ π , π ]
where b is the latent variable and is continuous, so the latent space becomes continuous, w(b) represents the kernel weights based on constant b, and F, A, and C are the matrices. The convolution operation is an integral operation from −π to π. Equation (5) is as follows:
x ( b ) = d n D w D n , b y D n T
The curve parameters can be obtained with the convolution operations. The ReLU activation function is used to process the features, and the operation becomes max (0,x(b)).
Algorithm 1: Enhanced Kernel Function
1. X = {}
2. for all F, A, C {Fj, Aj, Cj}
3. obtain the kernel convolution weights
4. w(b) < −w[F⊙ 2 π e u + e u e u e u (b + A) + C]
5. evaluate the convolution with the enhanced kernel weights
6. X(b) < − D n D w D n f b D n T
7. Discertize the dimensions of latent
8. For all b {b1, b2,…bn} do
9. X < −XU{}X(b)}
10. end for
11. end for
12. return list (X)

2.2.2. Classification

After extracting the features, the enhanced SVM classifies the lesions. Initially, the SVM calculates the score for all the extracted features by using linear mapping on feature vectors and uses this to evaluate the loss. The Algorithm 2 presents the improved SVM algorithm.
Algorithm 2: Improved SVM
  • Initialize the values in the training set.
  • Repeat for j = 1 to M
        •
    Calculate the loss using the enhanced regularization for all values of j
        •
    Compared the extracted regions in the liver images.
  • end for.
  • Repeat for every score vector j − 1 to M.
        •
    Compute the weight and bias.
        •
    argmax((w ∗ pj) + b)
  • end for.
  • Compute for all weights and finally evaluate the output.
The improved uses the linear mapping on extracted features to calculate the feature score to the parts of the region of interest used to differentiate the lesion types, which helps in the evaluation of loss function, which helps in obtaining the classification results.

3. Experimental Results

All experiments have been implemented on Keras. The data split was performed based on an 80:20 ratio, where 80% of the data were used for training and 20% for testing and implemented the proposed kernel convolution function in the CNN for the chest X-ray images and CT scan images. Three classes of chest X-ray or CT scan images were used, including healthy, COVID-19 affected, and patients with pneumonia.

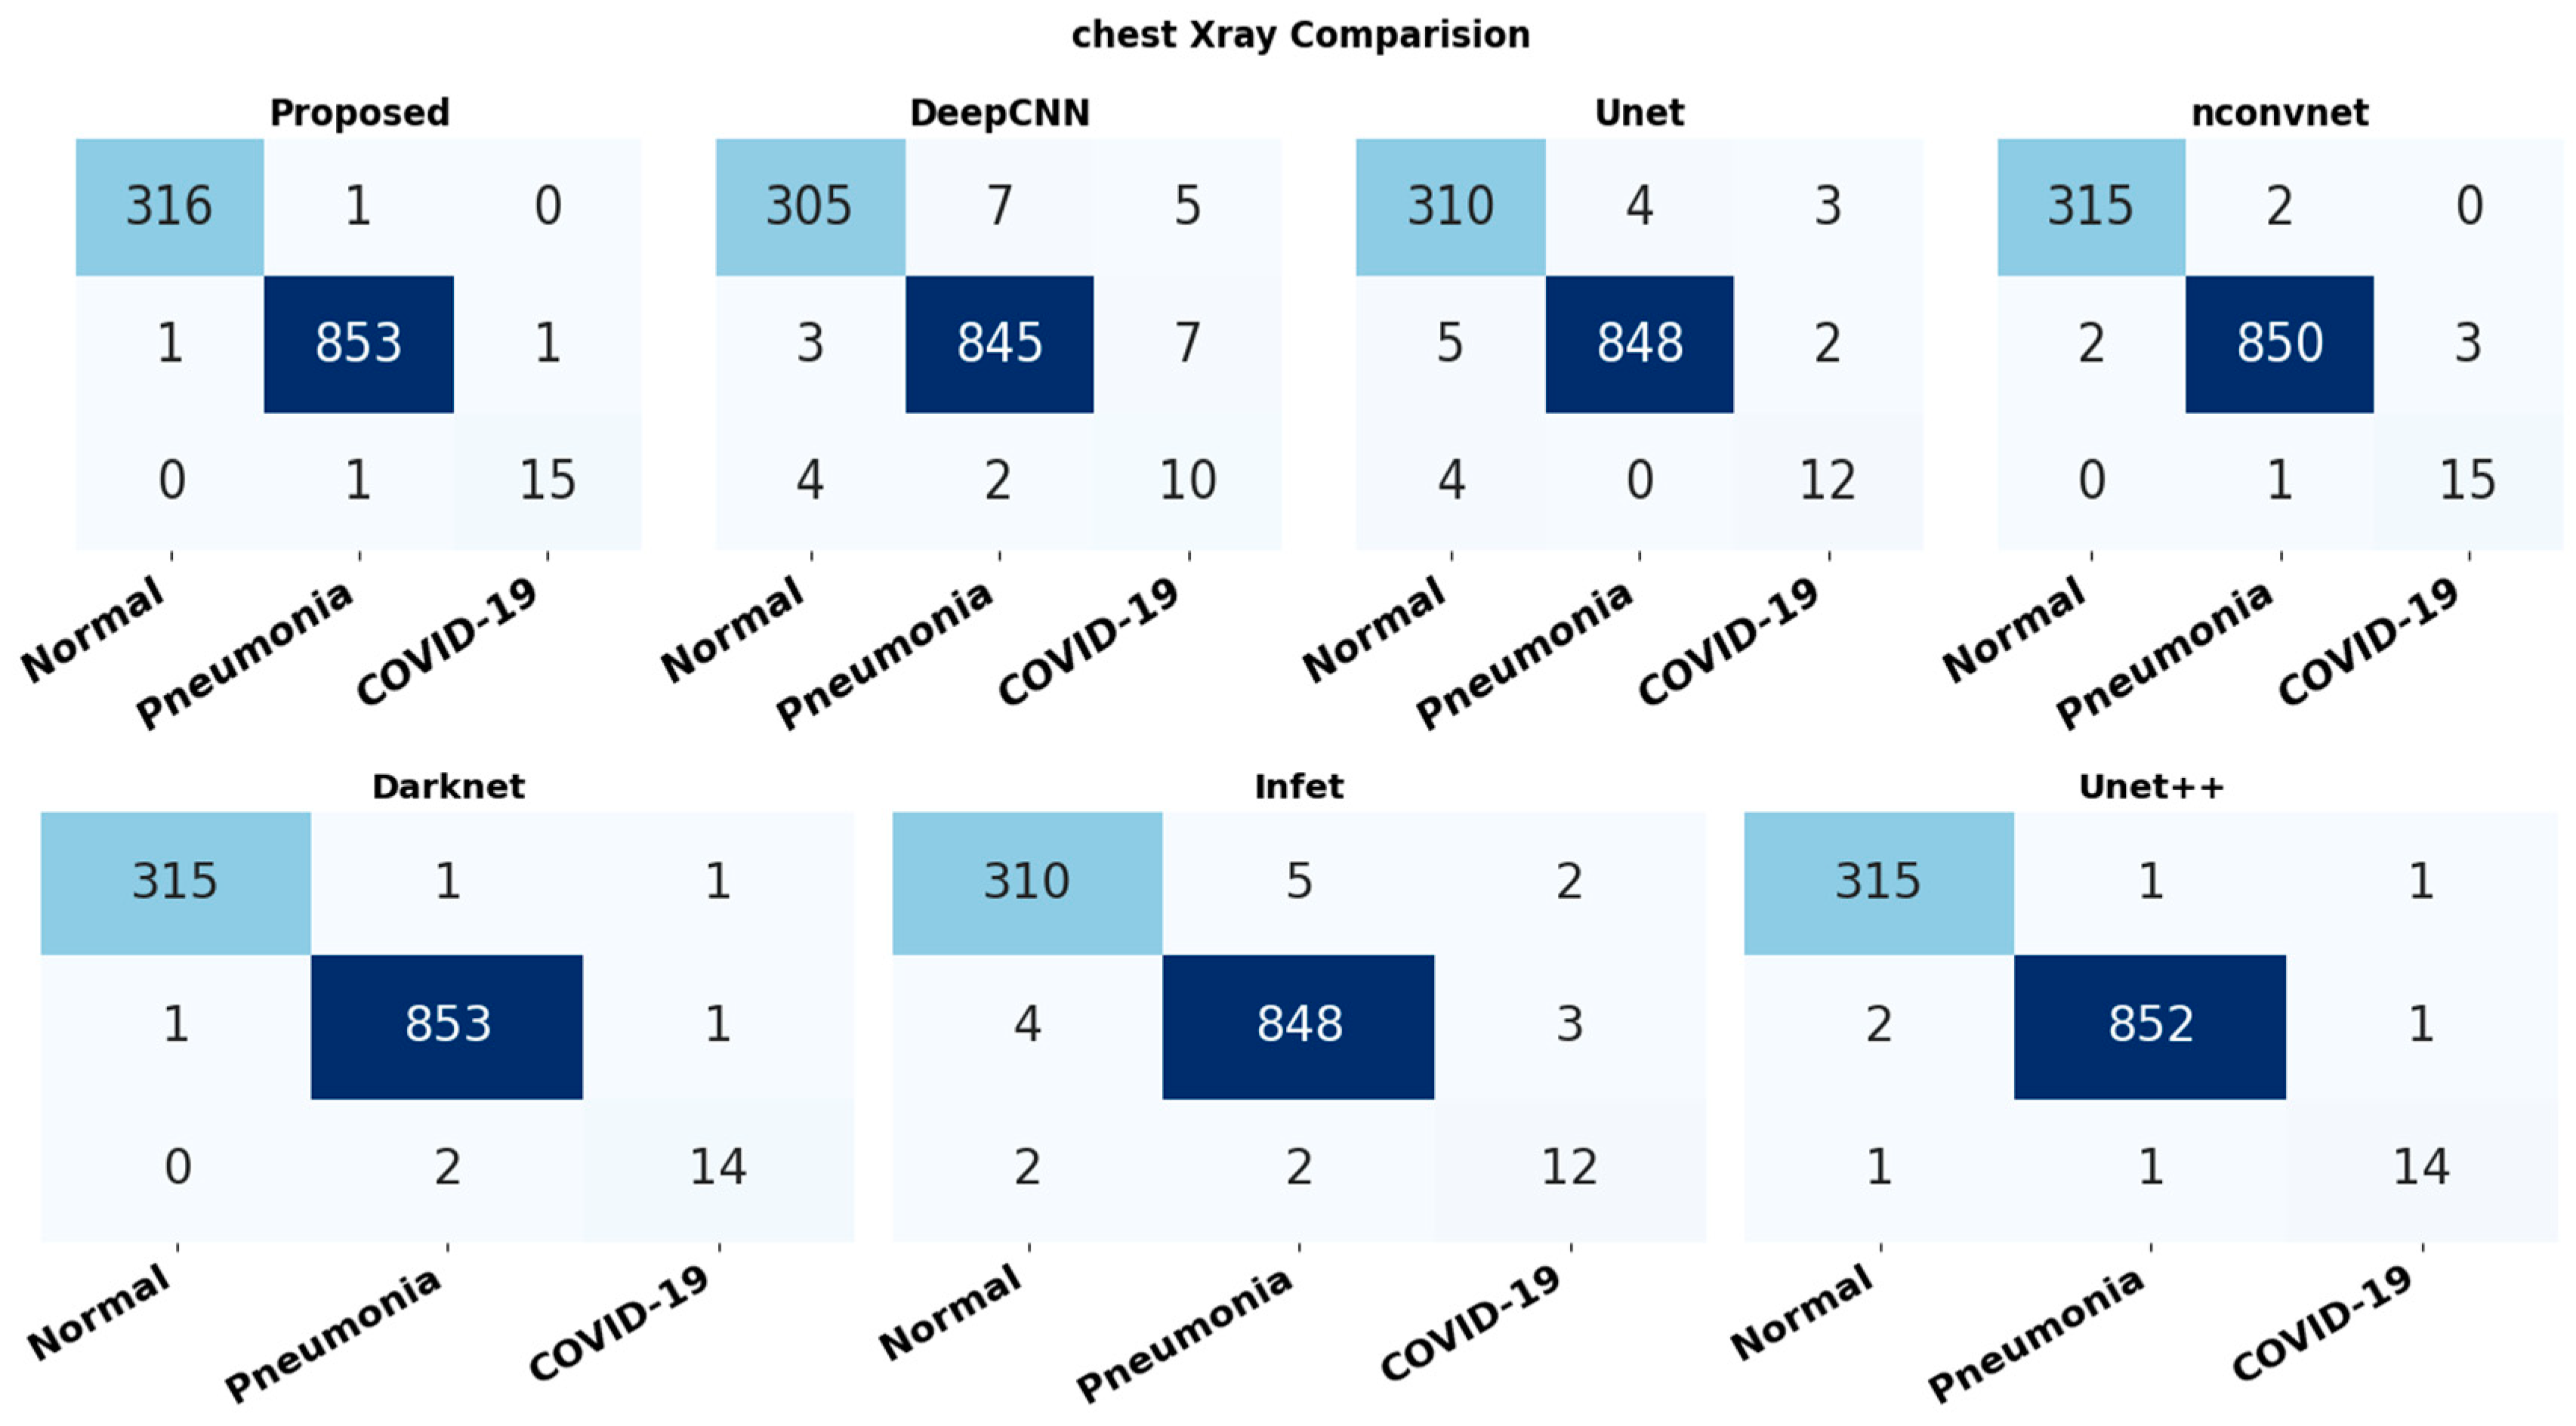
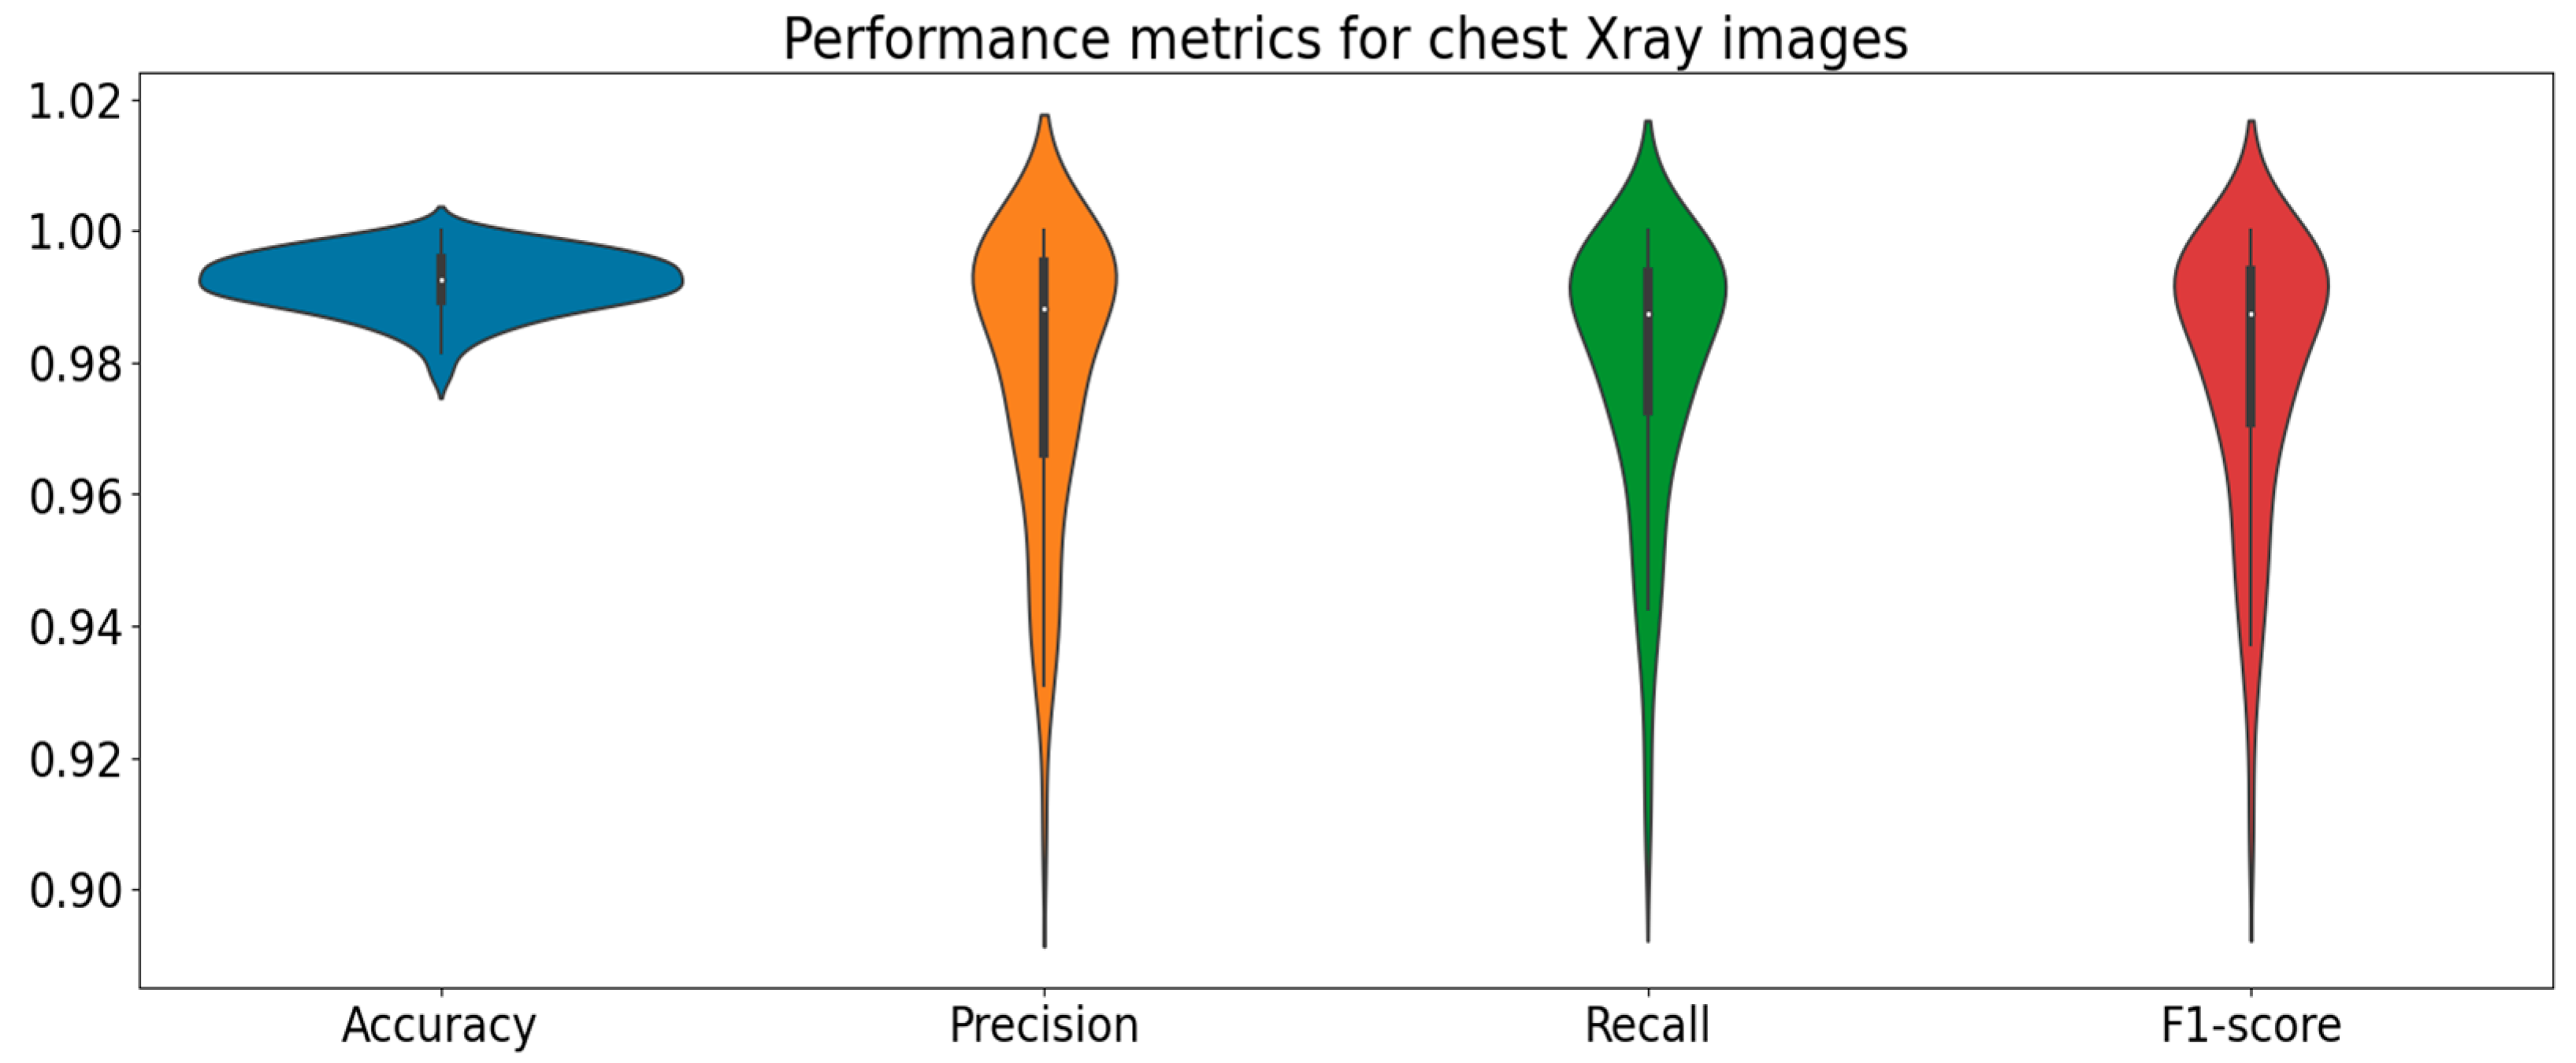
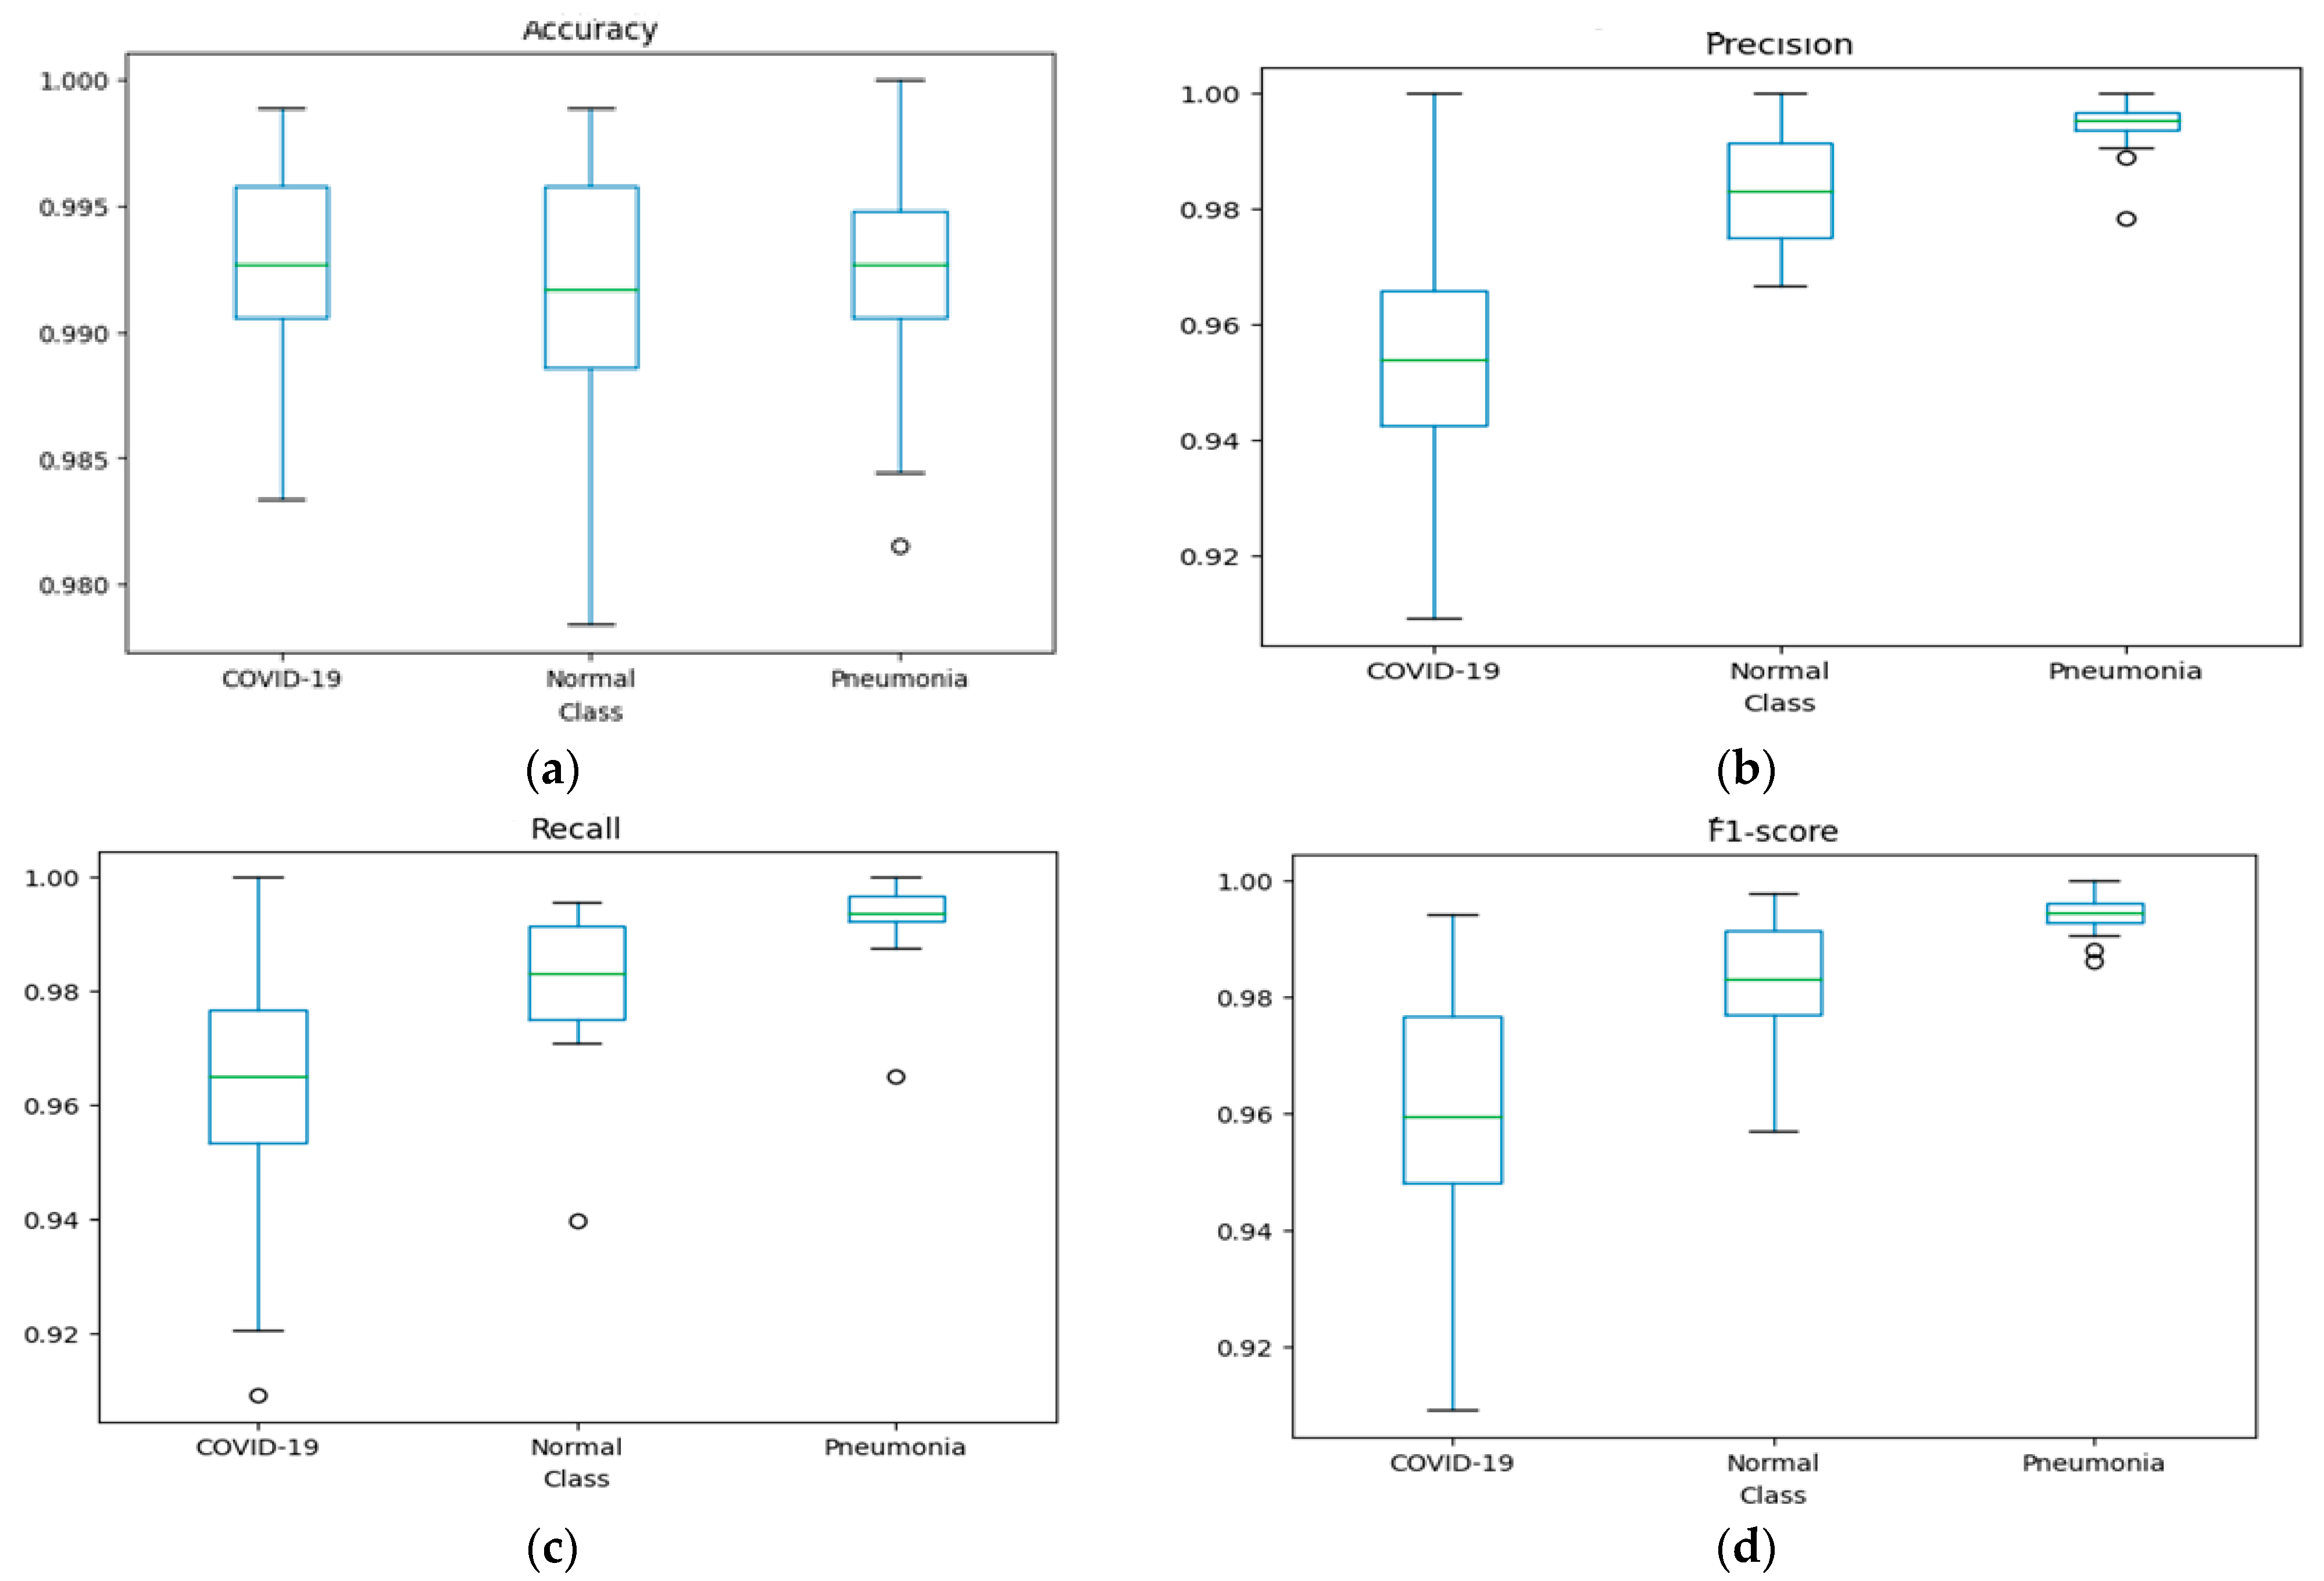
3.1. Evaluation of Chest X-ray Dataset

Figure 5 shows the confusion matrix for the chest X-ray dataset. The proposed model is compared with the existing models DeepCNN [27], Unet [9], nCONVnet [28], Darknet [29], infet [8], and Unet++ [30]. The proposed model accurately classifies 316 out of 317 and misclassifies 1 for the Normal class, accurately classifies 853 cases out of 855 and misclassifies 2 for Pneumonia class, and accurately classifies 15 out of 16 and misclassifies 1 for the COVID-19 class. The DeepCNN model accurately classifies 305 for the Normal class, accurately classifies 845 cases for Pneumonia class, and accurately classifies 10 for the COVID-19 class. The Unet model accurately classifies 310 for the Normal class, accurately classifies 848 cases for Pneumonia class, and accurately classifies 12 for the COVID-19 class. The nCONVnet model accurately classifies 315 for the Normal class, accurately classifies 850 cases for the Pneumonia class, and accurately classifies 15 for the COVID-19 class. The Darknet model accurately classifies 315 for the Normal class, accurately classifies 853 cases for the Pneumonia class, and accurately classifies 14 for the COVID-19 class. The infet model accurately classifies 310 for the Normal class, accurately classifies 848 cases for the Pneumonia class, and accurately classifies 12 for the COVID-19 class. The Unet++ model accurately classifies 315 for the Normal class, accurately classifies 852 cases for the Pneumonia class, and accurately classifies 14 for COVID-19 class. From Figure 5, we observed that the proposed model most accurately classifies the chest X-ray class followed by the Unet++ and Darknet models.
The overall performance of the chest X-ray dataset is shown in Figure 6. Each violin plot’s width corresponds to the frequency of the mean intensity. In general, the probability that the images have the corresponding mean intensity increases with the width of the violin plot. The intensity distribution still exhibits variance. The accuracy of the multi-class lung infection classification from the X-ray images is99.8%. These findings demonstrate how effectively the models identify lesions in chest X-ray images.
The individual classifier performance for the chest X-ray dataset is shown in Figure 7. The ISVM classifier shows the outstanding performance compared to the base classifiers of k-nearest neighbor (KNN), naïve Bayes (NB), random forest (RF), and the standard support vector machine (SVM).
The chest X-ray dataset consists of three classes, i.e., Normal (healthy), COVID-19 affected, and patients with pneumonia.
The individual class categorization performance for the chest X-ray dataset is shown in Figure 8.

3.2. Evaluation of CT Scan Dataset

Figure 9 shows the confusion matrix for the CT scan dataset. The proposed model is compared with the existing models DeepCNN [27], Unet [9], nCONVnet [28], Darknet [29], infet [8], and Unet++ [30]. The proposed model accurately classifies 67 out of 67 for the Normal class, accurately classifies 71 cases out of 72 and misclassifies 1 for the Pneumonia class, and accurately classifies 69 out of 70 and misclassifies 1 for the COVID-19 class. The DeepCNN model accurately classifies 60 for the Normal class, accurately classifies 63 cases for the Pneumonia class, and accurately classifies 61 for the COVID-19 class. The Unet model accurately classifies 64 for the Normal class, accurately classifies 68 cases for the Pneumonia class, and accurately classifies 67 for the COVID-19 class. The nCONVnet model accurately classifies 64 for the Normal class, accurately classifies 70 cases for the Pneumonia class, and accurately classifies 65 for the COVID-19 class. The Darknet model accurately classifies 65 for the Normal class, accurately classifies 68 cases for the Pneumonia class, and accurately classifies 67 for the COVID-19 class. The infet model accurately classifies 64 for the Normal class, accurately classifies 68 cases for the Pneumonia class, and accurately classifies 67 for the COVID-19 class. The Unet++ model accurately classifies 65 for the Normal class, accurately classifies 70 cases for the Pneumonia class, and accurately classifies 68 for the COVID-19 class. From Figure 9, we observed that the proposed model most accurately classifies the chest X-ray class, followed by the Unet++ model.
The overall performance of the CT scan dataset is shown in Figure 10. Each violin plot’s width corresponds to the frequency of the mean intensity. In general, the probability that the images have the corresponding mean intensity increases with the width of the violin plot. The intensity distribution still exhibits variance. The accuracy of the multi-class lung infection classification from the CT scan images is99.9%. These findings demonstrate how effectively the models identify lesions in CT scan images.
The individual classifier performance for the chest X-ray dataset is shown in Figure 11. The ISVM classifier shows an outstanding performance when compared to the the base classifiers, namely k-nearest neighbor (KNN), naïve Bayes (NB), random forest (RF), and the standard support vector machine (SVM).
The CT scan consists of three classes, i.e., Normal (healthy), COVID-19 affected, and patients with pneumonia. The individual class categorization performance for the CT scan dataset is shown in Figure 12.

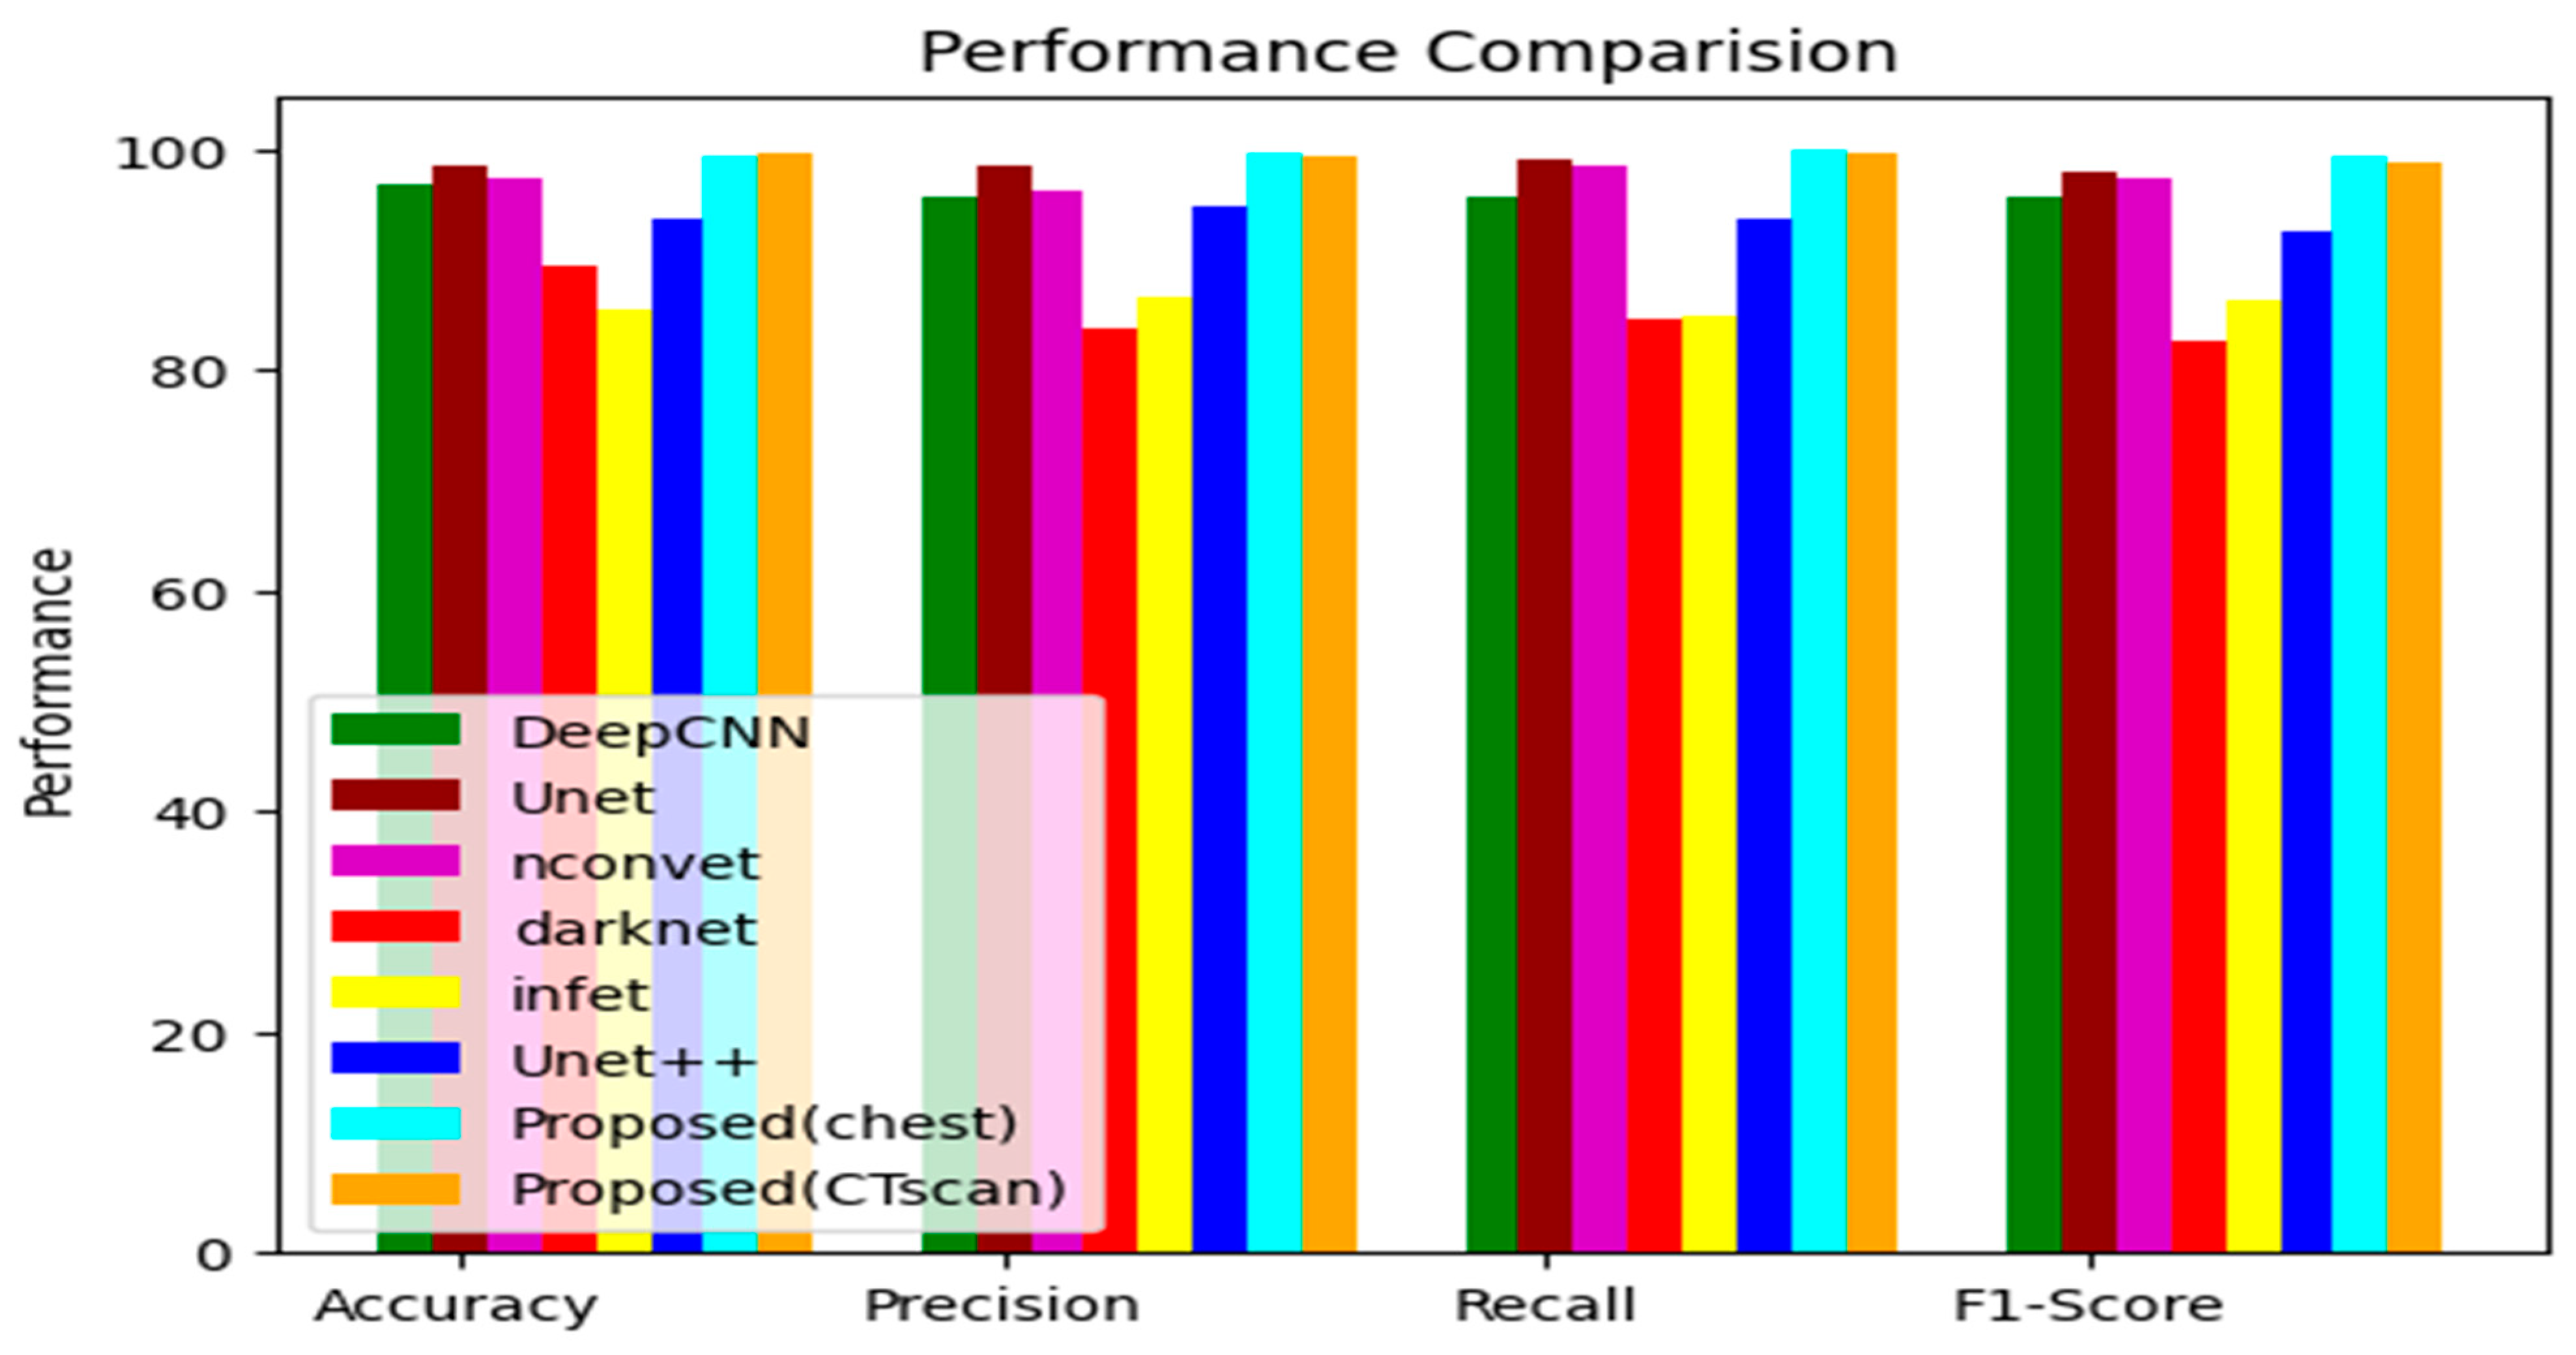
3.3. Performance Comparison

The model has been trained for 900 epochs on training data, and the proposed models are trained for 900 epochs with batch sizes of 64. To determine how well the proposed model would work and how often it would be used, every combination has been tested. This has been accomplished by combining various models results in stacking systems, which produces reliable forecasts while reducing the possibility of incorrect predictions.
The results of the comparison, which was performed in terms of accuracy, recall, precision, AUC, and F1 score, are displayed in Figure 13. The table shows that the suggested model exceeds all other models taken into consideration in terms of accuracy. The research of [27] and [28] likewise used CT scan and X-ray images, and achieved accuracy rates of 98.23% and 99.87%, respectively; however, they used binary categorization. The Darknet model was utilized in the study of [29], which solely used X-ray images, and 96.42% accuracy was attained. In contrast to our proposed work, which combined CT scan and X-ray images, the author of [8] reported an accuracy of 94.47% for the infet model. Our proposed work employed 5935 CT scan images and 1043 X-ray images and reached 99.9% and 99.8% accuracy, respectively, whereas the author of [30] used both CT scan and X-ray images and achieved 99.57% and 99.47% accuracy, respectively. Our proposed model, however, has the highest accuracy and precision values for the three-class categorization of chest CT images and X-ray images.
Figure 14 shows the computational complexity in terms of the number of parameters and the time. From Figure 14, it is observed that the proposed model exhibits a lower number of parameters and takes less time to process. Depth-wise separable convolution helps in reducing the parameters and improves the performance of the model.
Figure 15 shows the comparison results for models with and without image processing. We compared the performance metrics, i.e., the accuracy, precision, recall, and F1-score for the existing models, to the proposed model with and without image processing. For the proposed model, the accuracy without image processing is 98.46%, and with image processing it is 99.90%. The proposed model achieved the highest accuracy, followed by Unet++ with an accuracy of 99.57% with image processing and 98.26% without image processing.
Statistical test
To prove that the proposed model performs better than the existing approaches, we have performed the statistical hypothesis using the paired sample t-test [31]. The t-test finds the significant difference between the sets of observations. It only allows for testing the pairs of observations and a conclusion can be drawn. Therefore, we have compared all the independent DL models and the proposed model, selecting two at a time with the final stacking ensemble framework. The null hypothesis is assumed, as there exists no significant difference between the performance of the individual models and the stacked framework. On the other hand, an alternative hypothesis states there is a statistically significant difference between the performances of the two compared models. All the statistical trials are performed at a significance level of 5%, or the alpha is 0.05. The obtained p-values are shown in Table 2. From the resulting p-values, which are all less than 0.05, we reject our assumed null hypothesis. This proves that the better performance of the proposed model is statistically significant and not a result obtained by chance.

4. Discussion

Suppose that all of the features are connected to the final fully connected layer, which results in an increase in the complexity of the training set. To overcome this issue, we proposed kernel convolution functions used while training the model. The proposed kernel convolution function reduces the computational overhead and enhances the network compactness by regulating the number of feature maps. This study aimed to identify and classify lung infections based on chest X-ray and CT scan images from different datasets. The proposed kernel convolution functions outperform the existing predefined functions with an accuracy of 99.8%, a sensitivity of 99.9%, and a specificity of 99% on chest X-ray images and an accuracy of 99.9%, a sensitivity of 99.9%, and a specificity of 98% on CT scan images.
Initially, all the images in the dataset were of different sizes; the images were resized to 225 × 225 using the RGB color. The hyperparameters were tuned to optimize the proposed model. Model training can be accelerated, and the possibility of performance improved using the kernel convolution function. There is no ideal batch size; we implemented the experiments with various batch sizes. If we find the suitable batch size in addition to the suitable activation function and hidden layers, the model will yield a high performance. A batch size of 64 gives better results than batch sizes of 16 or 32. The batch size was set to 64 for the CT scan images because this study’s CT scan image dataset was large. From the previous studies, we observed that the batch sizes, in conjunction with the suitable activation function and hidden layer, will yield a high performance. The parameters adjusted to obtain the high-performance results are batch size (64), epochs (900), and learning rate (0.001).
Hammoudi et al. [32] extracted pneumonia features using deep learning models, namely Denset121, VGG16, VGG19, and Resnet50 for chest X-ray images, and classified them using the SVMRBF to achieve an accuracy of 97.88%, 97.88%, 97.88%, and 97.88%, respectively. Ibrahim et al. [33] implemented the Alexnet architecture via transfer learning and achieved a classification accuracy of 98.19%, a precision of 97.29%, a recall of 97.29%, and an F1-score of 97.29%.
One of the key limitations of the proposed approach is the small dataset, which is one of the study’s shortcomings. However, in the future, the proposed performance should be validated over a larger and more diversified dataset with more samples. We did not find an increased risk of pneumonia infections, such as bronchopneumonia, in patients with additional comorbidities. Future advancements of the suggested approach could include employing 3D CT scans to train 3D CNN ensemble models.

5. Conclusions

This study proposed an enhanced feature extraction technique to minimize the extraction error and an improved SVM classifier to classify the lesions using linear mapping. The proposed model results were proven to outperform all the state-of-the-art models. This study provided efficient accuracy results compared to the state-of-the-art models. The manual identification and differentiation of COVID-19, pneumonia, and normal chest X-rays and CT scans are time-consuming. The diagnostic results proved that the proposed model achieved satisfactory diagnostic performance, which significantly assists the medical professional in the decision-making process in the early stage of detection of the infection itself, and timely treatment can alleviate the transmission of the infection and decrease the risk of death. Automatic screening and differentiation of COVID-19, pneumonia, and normal chest X-ray and CT scan images will significantly reduce the effort of the medical professional and accelerate the diagnosis process.

Author Contributions

Conceptualization, U.B., N.C.; data curation, U.B.; funding acquisition, U.B., and G.B.; investigation, U.B., and N.C.; methodology, U.B., G.B. and N.C.; resources, U.B. and G.B. All authors have read and agreed to the published version of the manuscript.

Funding

This study didn’t receive any funding.

Institutional Review Board Statement

Not Applicable.

Informed Consent Statement

Not Applicable.

Data Availability Statement

Not Applicable.

Conflicts of Interest

The authors declare no conflict of interest.

References

  1. Sanchez, C.A.; Rivera-Lozada, O.; Lozada-Urbano, M.; Best-Bandenay, P. Herd immunity in older adults from a mid-dle-income country: A time-series trend analysis of community-acquired pneumonia mortality 2003–2017. Health Sci. Rep. 2023, 6, e1224. [Google Scholar] [CrossRef] [PubMed]
  2. Shen, Y.; Tian, Z.; Lu, D.; Huang, J.; Zhang, Z.; Li, X.; Li, J. Impact of pneumonia and lung cancer on mortality of women with hypertension. Sci. Rep. 2016, 6, 20. [Google Scholar] [CrossRef] [PubMed]
  3. Moses, D.A. Deep learning applied to automatic disease detection using chest X-rays. J. Med. Imaging Radiat. Oncol. 2021, 65, 498–517. [Google Scholar] [CrossRef]
  4. Ahuja, S.; Panigrahi, B.K.; Dey, N.; Rajinikanth, V.; Gandhi, T.K. Deep transfer learning-based automated detection of COVID-19 from lung CT scan slices. Appl. Intell. 2021, 51, 571–585. [Google Scholar] [CrossRef]
  5. Bharati, S.; Podder, P.; Mondal, M.R.H.; Podder, P.; Kose, U. A review on epidemiology, genomic characteristics, spread, and treatments of COVID-19. Data Sci. COVID-19 2022, 2, 487–505. [Google Scholar]
  6. Bai, H.X.; Hsieh, B.; Xiong, Z.; Halsey, K.; Choi, J.W.; Tran, T.M.L.; Pan, I.; Shi, L.-B.; Wang, D.-C.; Mei, J.; et al. Performance of radiologists in differentiating COVID-19 from non-COVID-19 viral pneumonia at chest CT. Radiology 2020, 296, E46–E54. [Google Scholar] [CrossRef]
  7. Rajaraman, S.; Candemir, S.; Thoma, G.; Antani, S. Visualizing and explaining deep learning predictions for pneumonia de-tection in pediatric chest radiographs. In Proceedings of the Medical Imaging 2019: Computer-Aided Diagnosis, San Diego, CA, USA, 17–20 February 2019; Volume 10950, pp. 200–211. [Google Scholar] [CrossRef]
  8. Fan, D.-P.; Zhou, T.; Ji, G.-P.; Zhou, Y.; Chen, G.; Fu, H.; Shen, J.; Shao, L. Inf-net: Automatic COVID-19 lung infection seg-mentation from ct images. IEEE Trans. Med. Imaging 2020, 39, 2626–2637. [Google Scholar] [CrossRef]
  9. Müller, D.; Soto-Rey, I.; Kramer, F. Robust chest CT image segmentation of COVID-19 lung infection based on limited data. Inform. Med. Unlocked 2021, 25, 100681. [Google Scholar] [CrossRef]
  10. Ranjbarzadeh, R.; Jafarzadeh Ghoushchi, S.; Bendechache, M.; Amirabadi, A.; Ab Rahman, M.N.; Baseri Saadi, S.; Aghamo-hammadi, A.; Kooshki Forooshani, M. Lung infection segmentation for COVID-19 pneumonia based on a cascade convolu-tional network from CT images. BioMed Res. Int. 2021, 2021, 5544742. [Google Scholar] [CrossRef]
  11. Li, L.; Qin, L.; Xu, Z.; Yin, Y.; Wang, X.; Kong, B.; Bai, J.; Lu, Y.; Fang, Z.; Song, Q.; et al. Using artificial intelligence to detect COVID-19 and community-acquired pneumonia based on pulmonary CT: Evaluation of the diagnostic accuracy. Radiology 2020, 296, E65–E71. [Google Scholar] [CrossRef]
  12. Gu, X.; Pan, L.; Liang, H.; Yang, R. Classification of bacterial and viral childhood pneumonia using deep learning in chest radiography. In Proceedings of the 3rd International Conference on Multimedia and Image Processing, Guiyang, China, 16–18 March 2018; pp. 88–93. [Google Scholar] [CrossRef]
  13. Mazurowski, M.A.; Buda, M.; Saha, A.; Bashir, M.R. Deep learning in radiology: An overview of the concepts and a survey of the state of the art with focus on MRI. J. Magn. Reson. Imaging 2019, 49, 939–954. [Google Scholar] [CrossRef]
  14. Milletari, F.; Ahmadi, S.A.; Kroll, C.; Plate, A.; Rozanski, V.; Maiostre, J.; Levin, J.; Dietrich, O.; Ertl-Wagner, B.; Bötzel, K.; et al. Hough-CNN: Deep learning for segmentation of deep brain regions in MRI and ultrasound. Comput. Vis. Image Underst. 2017, 164, 92–102. [Google Scholar] [CrossRef]
  15. Lee, S.; Lee, Y.H. Improving emergency department efficiency by patient scheduling using deep reinforcement learning. Healthcare 2020, 8, 77. [Google Scholar] [CrossRef] [PubMed]
  16. Zhang, J.; Xie, Y.; Li, Y.; Shen, C.; Xia, Y. COVID-19 screening on chest X-ray images using deep learning based anomaly detection. arXiv 2020, arXiv:2003.12338. [Google Scholar]
  17. Apostolopoulos, I.D.; Mpesiana, T.A. COVID-19: Automatic detection from x-ray images utilizing transfer learning with convolutional neural networks. Phys. Eng. Sci. Med. 2020, 43, 635–640. [Google Scholar] [CrossRef]
  18. Xia, X.; Xu, C.; Nan, B. Inception-v3 for flower classification. In Proceedings of the 2017 2nd International Conference on Image, Vision and Computing (ICIVC), Chengdu, China, 2–4 June 2017; IEEE: New York, NY, USA, 2017; pp. 783–787. [Google Scholar]
  19. Wang, C.; Chen, D.; Hao, L.; Liu, X.; Zeng, Y.; Chen, J.; Zhang, G. Pulmonary image classification based on inception-v3 transfer learning model. IEEE Access 2019, 7, 146533–146541. [Google Scholar] [CrossRef]
  20. Tsiknakis, N.; Trivizakis, E.; Vassalou, E.E.; Papadakis, G.Z.; Spandidos, D.A.; Tsatsakis, A.; Sánchez García, J.; López González, R.; Papanikolaou, N.; Karantanas, A.H.; et al. Interpretable artificial intelligence framework for COVID 19 screening on chest X rays. Exp. Ther. Med. 2020, 20, 727–735. [Google Scholar] [CrossRef]
  21. Sethy, P.K.; Behera, S.K.; Rath a, P.K.; Biswas, P. Detection of coronavirus disease (COVID-19) based on deep features and support vector machine. Int. J. Math. Eng. Manag. Sci. 2020, 5, 643–651. [Google Scholar] [CrossRef]
  22. Saha, P.; Sadi, M.S.; Islam, M.M. EMCNet: Automated COVID-19 diagnosis from X-ray images using convolutional neural network and ensemble of machine learning classifiers. Inform. Med. Unlocked 2021, 22, 100505. [Google Scholar] [CrossRef]
  23. Horry, M.J.; Chakraborty, S.; Paul, M.; Ulhaq, A.; Pradhan, B.; Saha, M.; Shukla, N. X-ray image based COVID-19 detection using pre-trained deep learning models. eng rXiv 2020. [Google Scholar] [CrossRef]
  24. SARS- CoV-2 Ct-Scan Dataset. Available online: https://www.kaggle.com/datasets/plameneduardo/sarscov2-ctscan-dataset (accessed on 20 May 2023).
  25. COVID-CT. Available online: https://github.com/UCSD-AI4H/COVID-CT (accessed on 20 May 2023).
  26. Rahimzadeh, M.; Attar, A.; Sakhaei, S.M. A fully automated deep learning-based network for detecting COVID-19 from a new and large lung CT scan dataset. Biomed. Signal Process. Control 2021, 68, 102588. [Google Scholar] [CrossRef] [PubMed]
  27. Abbas, A.; Abdelsamea, M.M.; Gaber, M.M. Classification of COVID-19 in chest X-ray images using DeTraC deep convolu-tional neural network. Appl. Intell. 2021, 51, 854–864. [Google Scholar] [CrossRef] [PubMed]
  28. Panwar, H.; Gupta, P.K.; Siddiqui, M.K.; Morales-Menendez, R.; Singh, V. Application of deep learning for fast detection of COVID-19 in X-rays using nCOVnet. Chaos Solitons Fractals 2020, 138, 109944. [Google Scholar] [CrossRef]
  29. Bhuiyan, M.R.; Khushbu, S.A.; Islam, M.S. A deep learning based assistive system to classify COVID-19 face mask for human safety with YOLOv3. In Proceedings of the 2020 11th International Conference on Computing, Communication and Networking Technologies (ICCCNT), Kānpur, India, 1–3 July 2020; pp. 1–5. [Google Scholar] [CrossRef]
  30. Shan, F.; Gao, Y.; Wang, J.; Shi, W.; Shi, N.; Han, M.; Xue, Z.; Shen, D.; Shi, Y. Lung infection quantification of COVID-19 in CT images with deep learning. arXiv 2020, arXiv:2003.04655. [Google Scholar]
  31. Ross, A.; Willson, V.L. Paired samples T-test. In Basic and Advanced Statistical Tests; Brill: Leiden, The Netherlands, 2017; pp. 17–19. [Google Scholar]
  32. Hammoudi, K.; Benhabiles, H.; Melkemi, M.; Dornaika, F.; Arganda-Carreras, I.; Collard, D.; Scherpereel, A. Deep learning on chest X-ray images to detect and evaluate pneumonia cases at the era of COVID-19. J. Med. Syst. 2021, 45, 75. [Google Scholar] [CrossRef] [PubMed]
  33. Ibrahim, A.U.; Ozsoz, M.; Serte, S.; Al-Turjman, F.; Yakoi, P.S. Pneumonia classification using deep learning from chest X-ray images during COVID-19. Cogn. Comput. 2021, 1, 1–13. [Google Scholar] [CrossRef]
Figure 1. Methodology flow.
Technologies 11 00128 g001
Figure 2. Image enhancement. (a) Unprocessed images and (b) processed images.
Technologies 11 00128 g002
Figure 3. Enhanced stacked CNN model.
Technologies 11 00128 g003
Figure 4. Convolution kernel functioning.
Technologies 11 00128 g004
Figure 5. Confusion matrix comparison for the proposed model with the existing models for the chest X-ray dataset.
Technologies 11 00128 g005
Figure 6. Performance of the complete chest ray dataset.
Technologies 11 00128 g006
Figure 7. Comparison of classifier performance on the chest X-ray dataset. (a) Accuracy; (b) precision; (c) recall; (d) F1-score.
Technologies 11 00128 g007
Figure 8. Class-wise performance on the chest X-ray dataset. (a) Accuracy; (b) precision; (c) recall; (d) F1-score.
Technologies 11 00128 g008
Figure 9. Confusion matrix comparison for the proposed model with the existing models for the CT scan dataset.
Technologies 11 00128 g009
Figure 10. Performance of the complete CT scan dataset.
Technologies 11 00128 g010
Figure 11. Comparison of classifier performance on the CT scan dataset. (a) Accuracy; (b) precision; (c) recall; (d) F1-score.
Technologies 11 00128 g011
Figure 12. Class-wise performance on the CT scan dataset. (a) Accuracy; (b) precision; (c) recall; (d) F1-score.
Technologies 11 00128 g012aTechnologies 11 00128 g012b
Figure 13. Performance comparison.
Technologies 11 00128 g013
Figure 14. Complexity comparison.
Technologies 11 00128 g014
Figure 15. Pre-processing comparison. (a) Accuracy; (b) precision; (c) recall; (d) F1-score.
Technologies 11 00128 g015aTechnologies 11 00128 g015b
Table 1. Dataset image distribution.
ClassChest X-rayCT Scan
TrainingTestingTrainingTesting
Normal126631726667
Pneumonia341885528772
COVID-19631628170
Total47471188834209
Table 2. Statistical test results.
Modelp-Value
DeepCNN0.01201
Unet0.01818
NCONVnet0.01217
Darknet0.00402
Infet0.00395
Unet++0.00245
Proposed (chest X-ray)0.00135
Proposed (CT scan)0.00129
Disclaimer/Publisher’s Note: The statements, opinions and data contained in all publications are solely those of the individual author(s) and contributor(s) and not of MDPI and/or the editor(s). MDPI and/or the editor(s) disclaim responsibility for any injury to people or property resulting from any ideas, methods, instructions or products referred to in the content.

