Article

Smart PV Monitoring and Maintenance: A Vision Transformer Approach within Urban 4.0

1
Center of Urban Systems (CUS), Mohammed VI Polytechnic University (UM6P), Ben Guerir 43150, Morocco
2
Urban and Regional Planning Community (CEAT), Ecole Polytechnique Fédérale de Lausanne (EPFL), 1015 Lausanne, Switzerland
*
Author to whom correspondence should be addressed.
Technologies 2024, 12(10), 192; https://doi.org/10.3390/technologies12100192
Submission received: 23 July 2024 / Revised: 18 August 2024 / Accepted: 23 August 2024 / Published: 7 October 2024

Abstract

:
The advancement to Urban 4.0 requires urban digitization and predictive maintenance of infrastructure to improve efficiency, durability, and quality of life. This study aims to integrate intelligent technologies for the predictive maintenance of photovoltaic panel systems, which serve as essential smart city renewable energy sources. In addition, we employ vision transformers (ViT), a deep learning architecture devoted to evolving image analysis, to detect anomalies in PV systems. The ViT model is pre-trained on ImageNet to exploit a comprehensive set of relevant visual features from the PV images and classify the input PV panel. Furthermore, the developed system was integrated into a web application that allows users to upload PV images, automatically detect anomalies, and provide detailed panel information, such as PV panel type, defect probability, and anomaly status. A comparative study using several convolutional neural network architectures (VGG, ResNet, and AlexNet) and the ViT transformer was conducted. Therefore, the adopted ViT model performs excellently in anomaly detection, where the ViT achieves an AUC of 0.96. Finally, the proposed approach excels at the prompt identification of potential defects detection, reducing maintenance costs, advancing equipment lifetime, and optimizing PV system implementation.

1. Introduction

Urban 4.0 involves the extensive digitization of urban infrastructure, applying intelligent technology to decrease financial costs, and enhancing the overall quality of life. Photovoltaic (PV) panel infrastructures, as crucial renewable sources to increase energy efficiency, require intelligent technology implementation [1]. In this context, the predictive maintenance of PV infrastructure, supported by advanced AI technologies such as deep learning (DL) models, offers significant advantages for infrastructure management and optimization [2]. Furthermore, PV infrastructure digitization enables continuous and accurate monitoring of PV system performance and sustainability [3,4].
The use of DL pre-trained models, such as the Vision Transformer (ViT) model [5] for anomaly detection, enables potential failures to be identified before they become critical [6]. This work adopts the ViT model as a recent innovation in DL, successfully adapted to computer vision, offering a new perspective [5].
In this regard, we present an intelligent PV monitoring and maintenance system based on the ViT model, which processes PV images and recognizes the PV status, i.e., anomaly or no-anomaly detection, and further PV details. Before we validate the accuracy of the adopted model, we analyze the strangeness and weaknesses of the ViT model and well-established CNN architectures [7]. This approach’s benefits include reduced maintenance costs, improved equipment lifetime, and optimized PV system performance [8]. Also, we developed a new real-time PV anomaly detection application as a software solution for detecting and predicting PV faults, especially as it satisfies the needs of the future smart city in Morocco (Benguerir) and its requirement for predictive maintenance [9]. Accurately and quickly detecting PV anomalies and issues presents considerable challenges for smart cities, like the variability of environmental conditions and the diversity of the anomalies requiring recognition and classification solutions [10]. Using Machine Learning (ML) models to classify PV defects involves several complex steps, including image preprocessing, image segmentation, feature extraction, feature selection, and image classification [11,12]. Each step requires meticulous selection of methods, techniques, and parameter tuning to ensure model compatibility and proper training [12]. In contrast, the ViT architecture includes all these image-processing steps [13].
To treat and analyze the PV image status, several processes were developed. The ViT model’s unique approach begins with image splitting into small patches. Therefore, the given patches learn the complex relationships between these segments, allowing a comprehensive understanding of the entire image to extract relevant features [5]. Unlike traditional ML models, the adopted model does not require explicit feature extraction and selection phases, as the model implicitly handles these processes before the anomaly classification step. Then, the used model was pre-trained on ImageNet, a large-scale image dataset [14]. This pretraining allows the ViT model to handle a wide range of anomalies and environmental conditions, ensuring high accuracy in anomaly detection without requiring extensive reconfiguration for each new type of defect or environmental variability. The ViT model’s robustness in handling various anomalies and environmental conditions provides a sense of reassurance regarding its adaptability and effectiveness. The pretraining on ImageNet provides the ViT model with a rich set of visual features, enabling it to detect anomalies in PV systems effectively [5,13]. Additionally, the ViT and the compared CNN architectures, i.e., Visual Geometry Group (VGG) [15], ResNet [16], and AlexNet [17], are based on ImageNet data processing, and PV reference data input to ensure robust performance across different anomaly types and environmental conditions.
The ViT model’s high accuracy in anomaly detection instills confidence in its performance. To complement our model, we developed a user-friendly web application that allows users to upload PV images and automatically detect anomalies, thus providing detailed information about the PV panel. This approach enhances the efficiency and sustainability of urban infrastructure and supports the goals of Urban 4.0, by enabling the intelligent, data-driven management of renewable energy resources. The ViT model’s ability to handle diverse visual data with high accuracy provides a sense of security regarding its adaptability and reliability in real-world applications. Thus, this work can be summarized into two key contributions:
  • An intelligent PV monitoring and maintenance system based on the ViT model, capable of processing images and detecting anomalies. The model demonstrated superior performance in a comparative study of several CNN architectures.
  • A novel real-time software application for detecting anomalies in PV panels.
The subsequent sections of this paper are organized as follows: Section 2 offers an extensive examination of previous research conducted on the same topic. Section 3 elaborates on the system architecture, specifically utilizing the Vision Transformer (ViT) paradigm. Section 4 explains the program and interface created to detect anomalies in photovoltaic (PV) systems automatically. Section 5 provides a detailed analysis of the datasets, experimental results, and discussion. Section 6 of the study provides an overview of the main findings and suggests possible directions for future research.

2. Related Work

Anomaly detection, a crucial study area in diverse fields, can prevent damages, optimize performance, and ensure safety and reliability. Anomalies, often called outliers or deviations, can indicate underlying issues, e.g., system malfunctions, security breaches, or process inefficiencies [18]. In the energy sector, particularly for PV systems, detecting anomalies is essential for maintaining operational efficiency and prolonging the lifespan of solar panels [19]. Accordingly, PV predictive maintenance systems for urban infrastructure have been a significant area of research, and several approaches have been proposed [19,20].
Several traditional ML methods, such as linear regression [21], support vector machines (SVM), and Random Forest [22,23], have been used for fault detection in PV systems [24]. However, they often require extensive feature engineering and exhibit low accuracy [24]. Deep learning (DL) models, especially convolutional neural networks (CNNs), have shown improved performance in image-based anomaly detection tasks [25]. However, models like VGG, ResNet, and AlexNet [15,16,17] face challenges in generalizing across varied environmental conditions and anomaly types [26]. Recurrent neural networks (RNNs) and their variants, such as Long Short-Term Memory (LSTM) networks [27], have also been explored for anomaly detection in PV systems due to their capability to handle time-series data [28]. Although LSTMs are suitable for capturing temporal dependencies, they may not perform as well as CNNs in image-based tasks, because they are not inherently designed for spatial feature extraction [29].
The adopted system employs the Vision Transformer (ViT), a DL transformer architecture widely used for computer vision and image treatments [30]. Transformer architectures like BERT [31], GPT [32], and T5 [33] have been successful in NLP tasks, while ViT (Vision Transformer) is effective for image processing [13].
Among the various ViT models, ViT-B-16 has been chosen for our study due to its balance between model complexity and performance [15,32]. The model divides images into small sections and learns the complex relationships between these sections, allowing them to capture long-range dependencies between image components more effectively than traditional CNNs [15]. ViT utilizes self-attention mechanisms to weigh the importance of different parts of the input data, enabling better handling of complex patterns and image component dependencies [5,15]. This process provides a notable advantage over classic CNNs, which rely on fixed-size convolutional kernels and may struggle with long-range dependencies [33]. While CNNs focus on local and hierarchical dependencies, making them adept at identifying minor localized defects, ViTs exploit global dependencies from the outset, thereby providing a powerful tool for capturing broader contextual anomalies [5].
Pretraining on large-scale datasets like ImageNet [14] enhances model performance by leveraging diverse visual features. Other datasets, such as COCO (Common Objects in Context) [34] and CIFAR-10 [35], are also used for pretraining but are more specific in their domains. ImageNet’s comprehensive nature makes it particularly suitable for tasks like PV anomaly detection, where anomalies are numerous and diverse. In this study, the ViT model pre-trained on ImageNet demonstrated superior performance in anomaly detection compared to VGG, ResNet, and AlexNet trained on the same dataset [29,36]. This highlights the ViT’s efficacy in capturing and generalizing visual features relevant to PV system anomalies [33].
The literature has widely discussed the integration of Internet of Things (IoT) technologies with AI for the real-time monitoring and predictive maintenance of PV systems [3,4]. These approaches promote continuous data collection and analysis, providing timely insights into the PV panels’ state. The proposed approach extends this by developing a web application that allows users to upload PV images, automatically detect anomalies, and provide detailed information about the PV panel, including its type, anomaly probability, and status.
While traditional ML methods, CNNs, and LSTMs have significantly contributed to the field of PV anomaly detection [23,26,29], they often struggle to generalize and handle diverse anomaly types. ViT, with its unique capabilities, addresses these limitations and provides a more effective and comprehensive solution for PV system control and maintenance, ensuring the robustness of the proposed approach.

3. The Adopted Architecture of the PV Panel Anomalies Detection System

In this section, we present the motivation for choosing the developed model. The approach is based principally on the improved version of deep neural network architectures, ViT. We begin with a detailed ViT architecture and a presentation of the adopted system components.

3.1. Context and Motivation

The ViT approach was developed to efficiently extract spatial features from images and overcome CNN limitations, i.e., their inability to capture long-range dependencies between distant regions or features within the same image and process global image information. Thus, the ViT offers attention mechanisms to model long-range relationships between different parts of an image and, subsequently, a global image [29,37].
The ViT architecture [5,37] is a complex system that can be broken down into five main steps, each of which is carried out by a significant set of executive neurons. This intricate process, as illustrated in Figure 1 and explained below, is a testament to the power of neural networks in computer vision.
  • Patching: Unlike CNNs, which process individual pixels or small pixel windows, ViT divides the input image into small and fixed-size patches Pn. Then, ViT converts each patch Pi into a vector Vi.
  • Linear Embedding: Here linear projection is applied to transform each patch vector Vi into an embedding Ei using the following equation:
Ei = WE × Vi + bE
where WE are the weight matrix and bE is the bias vector.
Precisely, this step involves passing the flattened patch vector through a fully connected (dense) layer, which maps the high-dimensional pixel data into a lower-dimensional embedding space to select the essential features of each patch. The resulting embeddings EN serve as the input tokens for the transformer model [37].
  • Adding Positional Embeddings: Since the patch order is important for spatial image understanding, positional embedding Epos are added to the patch embedding to retain spatial position information. Then, Zi = Ei + Epos,i, the sequence of patch embeddings, along with positional embeddings, is formed and prepared as the input for the transformer blocks Zi (for i = 1, …, n).
  • Transformer Blocks: Each transformer block consists of two main sub-layers.
    • Multihead Self-Attention layer allows the model to focus on different parts of the image simultaneously and to model the relationships between patches.
    • Feedforward Network (FFN) is a series of fully connected layers applied independently to each position [38].
The transformer block steps are repeated for a predefined number of layers.
  • Classification: At the end of the transformer network, the classification token (a specific vector VClass added to the patch embeddings) is extracted and passed through one or more fully connected layers to perform the final classification task. The ViT architecture is conceptually simpler than deep CNN architectures, as it avoids complex convolutions and successive downsampling. Moreover, the model can be pre-trained on large image databases, reserved for research work, and then adapted to various computer vision tasks with excellent knowledge transfer [37].

3.2. The Adopted System Architecture

This study aims to evaluate the performance of the ViT model for detecting anomalies in urban photovoltaic systems. Thus, the development process of the anomaly detection and classification system for PV panels follows the same steps (Figure 1), and Figure 2 describes the ViT projection on the developed detection system.

3.2.1. Image Preprocessing (I2P)

I2P is crucial in preparing data for training and classification with the Vit model. For this, a set of transformations is applied, i.e., resizing and normalization.
In the resizing step, each image was resized to a uniform size of 224 × 224 pixels, which is the correct size for computer vision models, enabling detailed analysis without compromising model performance. Resizing helps standardize the input dimensions, ensuring that all images are of the same size, which is necessary for batch processing. By resizing the images, we reduce the computational load and memory usage, which is essential for efficient training and inference [5].
Next, images are normalized using the means and standard deviations of the color channels in the ImageNet dataset, helping to stabilize learning convergence by scaling features to a comparable scale [13,36,39]. For DL models, normalization is critical because it helps stabilize learning by ensuring that the input features (pixels, in the case of images) fall within a range that promotes convergence during training.

3.2.2. Input Patching

This method processes the input data by dividing each solar panel image into several patches, as presented in Figure 3.
In our case, each patch is 16 × 16 pixels, which aligns with the conventional configuration of the ViT. This specific patch size balances the resolution of the details captured with the processing capabilities of the model. Importantly, this configuration is well suited for the specific characteristics of PV installations, as it allows the model to effectively capture and analyze small-scale features typical of common PV defects, such as microcracks, hotspots, and degradation patterns. The 16 × 16 patch size is fine enough to detect these localized anomalies while providing sufficient context for understanding the broader structural patterns within the panel. This balance is crucial for achieving high accuracy in detecting and classifying PV-specific defects.
By analyzing these patches, the model can effectively learn crucial local features that are key in identifying faults like cracks, discoloration, and other irregularities. Each patch is then projected into an embedding space using a linear layer. For 224 × 224 pixels as an image size, every patch is 16 × 16 pixels, then we have (224/16) × (224/16) = 196 patches.

3.2.3. Feature Extraction and Selection

After the patching phase, every patch represents a feature vector of 768 dimensions. These vectors then pass through the transform network, which modifies and interlinks features to produce a global representation of the image [13]. The following steps are performed to accurately extract and select pertinent features:
  • The multihead attention mechanism: in ViT enables the model to handle different aspects of information at various levels of detail, capturing both local and global dependencies within an image. Long-range dependencies refer to the relationships and interactions between distant parts of an image that are not immediately adjacent to each other. This capability allows the model to understand how features in one image area might affect or be related to those in another distant area. This dynamic focus across different patches of a PV image allows ViT to consider all relevant information, ensuring a comprehensive analysis of both intricate local details and broader global interactions. This capability makes it particularly suitable for detecting all types of anomalies, perfectly aligning them with the objectives of our application.
The attention mechanism focuses on specific patches for local dependencies, capturing fine details and anomalies, such as cracks, with exceptional precision. For example, a crack or microcrack in a photovoltaic panel can be detected by analyzing the surrounding pixels in a small patch. CNNs, with their robust convolutional filters, excel in capturing such local details and analyzing patterns like edges, textures, and small objects. However, CNNs primarily focus on local feature extraction and do not effectively address global dependencies, which limits their ability to understand the broader context and interactions within the entire panel, which is essential for identifying more complex or distributed anomalies.
When addressing global dependencies, the attention mechanism links distant patches across the image, providing a comprehensive understanding of how an anomaly in one region can influence other parts of the panel, such as the widespread impact of a hotspot. Even if a hotspot is localized, its effect can extend across the entire panel, which requires an understanding of its influence on distant patches, such as the connections between PV cells.
  • Class Token: A unique class token is appended to the sequence of patch embeddings during the input stage. This token accumulates and summarizes the image characteristics as it passes through the transformer layers. The class token acts as a repository of information and gathers insights from various patches. This mechanism allows the model to integrate and synthesize data from the entire image, leading to a unified representation that is essential for accurate classification.
  • Output Vector of the Class Token: After processing through the final transformer block, the output vector associated with the class token encapsulates the global representation of the PV image. This vector is then used for the classification task. It demonstrates that the model does not rely on isolated patch features but integrates them into a cohesive and comprehensive representation. This integration ensures that the classification decisions are based on a holistic image understanding, capturing local details, and overarching patterns.
  • Positional Encoding: Positional encodings are added to the patch embeddings before the transformer processes them to retain spatial information. This step ensures that the model knows the relative positions of the patches within the image, which is crucial for understanding the spatial context and relationships between different regions.
  • FNN: Each transformer layer includes a feedforward neural network that processes the output of the multihead attention mechanism. This network helps to refine and transform the extracted features, enhancing the model’s ability to capture complex patterns and representations within the data.
  • Layer Normalization and Residual Connections: Transformer layers incorporate layer normalization and residual connections, stabilizing the training process and enabling the model to learn more effectively. These components help maintain the integrity of the feature representations and support the extraction of high-quality features for classification.

3.2.4. Learning and Classification

The process of classifying and detecting PV panels incorporates several essential steps, leveraging ViT technology, as follows:
  • Initial training: The ViT model is First Trained on ImageNet [13], which is crucial as it equips the model with a deep understanding of various visual features, exploiting the attention method to capture complex spatial relationships between image elements [11,13].
  • Feature learning: The second phase is Feature Learning, where the ViT learns to identify and classify many objects in thousands of categories. This experience allows it to develop detailed and flexible visual representations that are used as a basis for more specific classification tasks.
  • Fin-tuning: Following the pretraining step Fine-Tuning [13] is used for anomaly detection. Generally, the model is particularly adjusted to detect anomalies in solar panels. This step requires replacing the model’s output layer with a new one to distinguish between various anomaly types.
  • The model is then trained on a dataset composed purely of images of solar panels, each annotated according to the presence or absence of anomalies. This process refines the model’s ability to recognize the often subtle signs of panel anomalies.

3.2.5. Detection and Deployment

After all the training, the model is tested on a separate dataset to assess its effectiveness in correctly identifying the anomalies. Once validated for its accuracy and reliability, the model is ready to be deployed in real-life applications to monitor the status of solar panels and automatically detect anomalies that could compromise their performance. The following section provides the necessary details for developing the software’s goal and functioning.

4. Software Application

To describe the developed software solution, we provide a flowchart illustrating the step-by-step execution of an application designed for PV panel detection using transformer-based analysis, as shown in Figure 4.
The system integrates a user-friendly interface with advanced analytical capabilities to ensure efficient and accurate monitoring of PV panels. Here is a detailed description of each stage depicted in Figure 4:
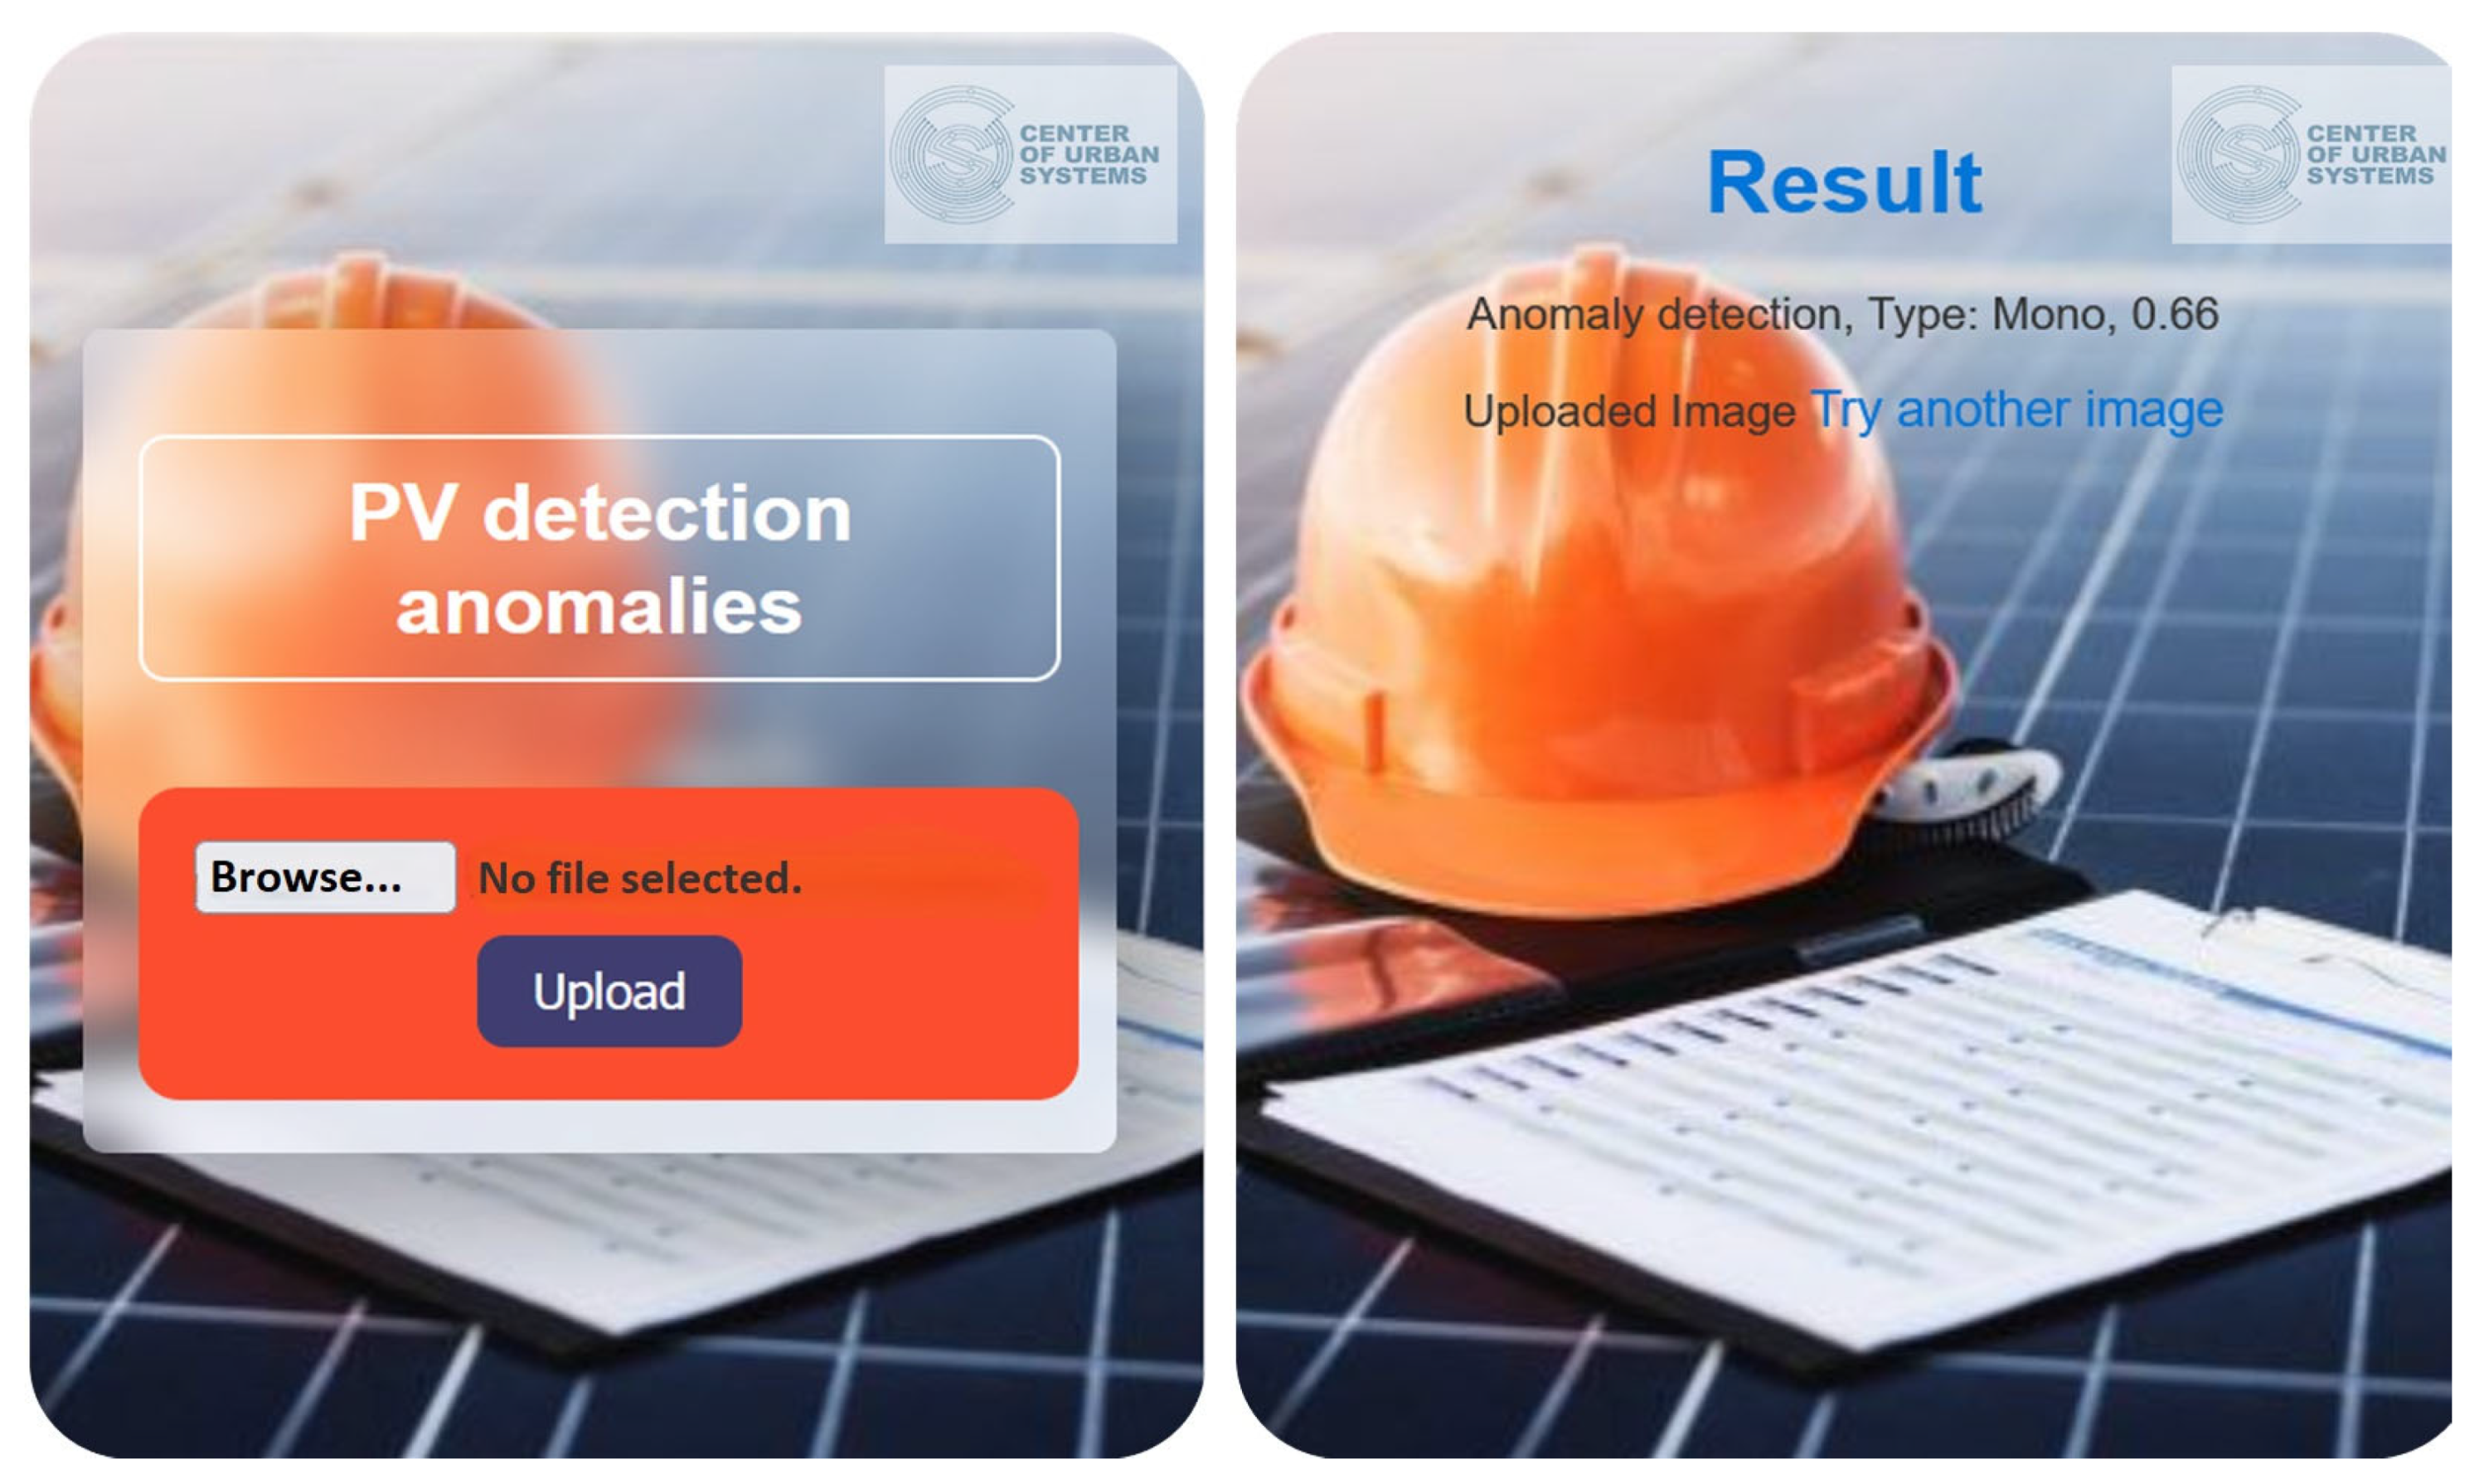
  • User Access and Initialization: As a first step (1), users access the application via the user interface. They initiate the process by loading a PV panel image.
  • Image Upload: In the next step (2), the system prompts for an image upload. The user selects and uploads a PV panel image to the system database.
  • Image Processing: The stored image is processed using the charged ViT model. The transformer blocks analyze the input to detect anomalies (step (3)). The analysis results are then sent back to the user interface.
  • Result Display: In the last step (4), users receive a detailed report on the PV panel’s condition, including:
    • Anomaly Detection: Indicates whether an anomaly is present or not.
    • Type Classification: Specifies the type of PV panel (mono or poly).
    • Defect Probability: Provides the probability of a detected anomaly, offering an in-depth understanding of the panel’s health.
For refinement, the application must use a database that contains precise information on the type of display. Therefore, the Experiment and Evaluation section provides more details regarding the database.
Figure 5 shows the developed application’s home and results pages. Users can upload PV panel images from their homepages to analyze their statistics. After processing, the application provides detailed results about the PV panel’s status on the results page. On the result page, we display a detailed analysis that includes the class of detected anomalies, classification of the PV panel, and probability of defects.
The proposed application’s description highlights the functionalities and steps of the developed software solution, showcasing its integration of user-friendly interfaces with powerful analytical tools for effective PV panel monitoring. The application provides a comprehensive solution for predictive PV panel maintenance, aligning with the goals of Urban 4.0, by enabling intelligent data-driven management of renewable energy resources [3]. Moreover, the solution enhances the efficiency and sustainability of urban infrastructure and supports the broader objective of transitioning to more intelligent and resilient energy systems.
Furthermore, as a recommended solution for smart cities (for example, the future smart city of Benguerir in Morocco) [9], the application has significant potential to minimize maintenance costs by enabling real-time monitoring and early detection of anomalies. This recommendation allows for timely and targeted maintenance actions, preventing minor issues from escalating to failures that require expensive repairs or replacements. Adopting predictive maintenance strategies optimizes the maintenance schedule, reducing the frequency of inspections and interventions while ensuring that the PV panels operate at peak efficiency [24,40]. Consequently, this results in significant cost savings over the lifecycle of PV systems, making renewable energy solutions more economically viable for urban infrastructures.
By leveraging advanced technologies such as ViT for anomaly detection, this application exemplifies the future of innovative city initiatives, emphasizing the importance of sustainability and cost-effectiveness in urban infrastructure management. Users can insert any image from the PV dataset, and the system will be capable of analyzing it, providing comprehensive results on the PV panel’s condition.

5. Experiment and Evaluation

To compare a set of systems based on CNN and ViT architectures for PV anomaly detection, experiments for all algorithms were conducted using a Dell system (Dell Inc., Raheen Business Park, Limerick, Ireland) equipped with an Intel (R) Core i7-CPU 1.70 GHz, and 8 GB of RAM.

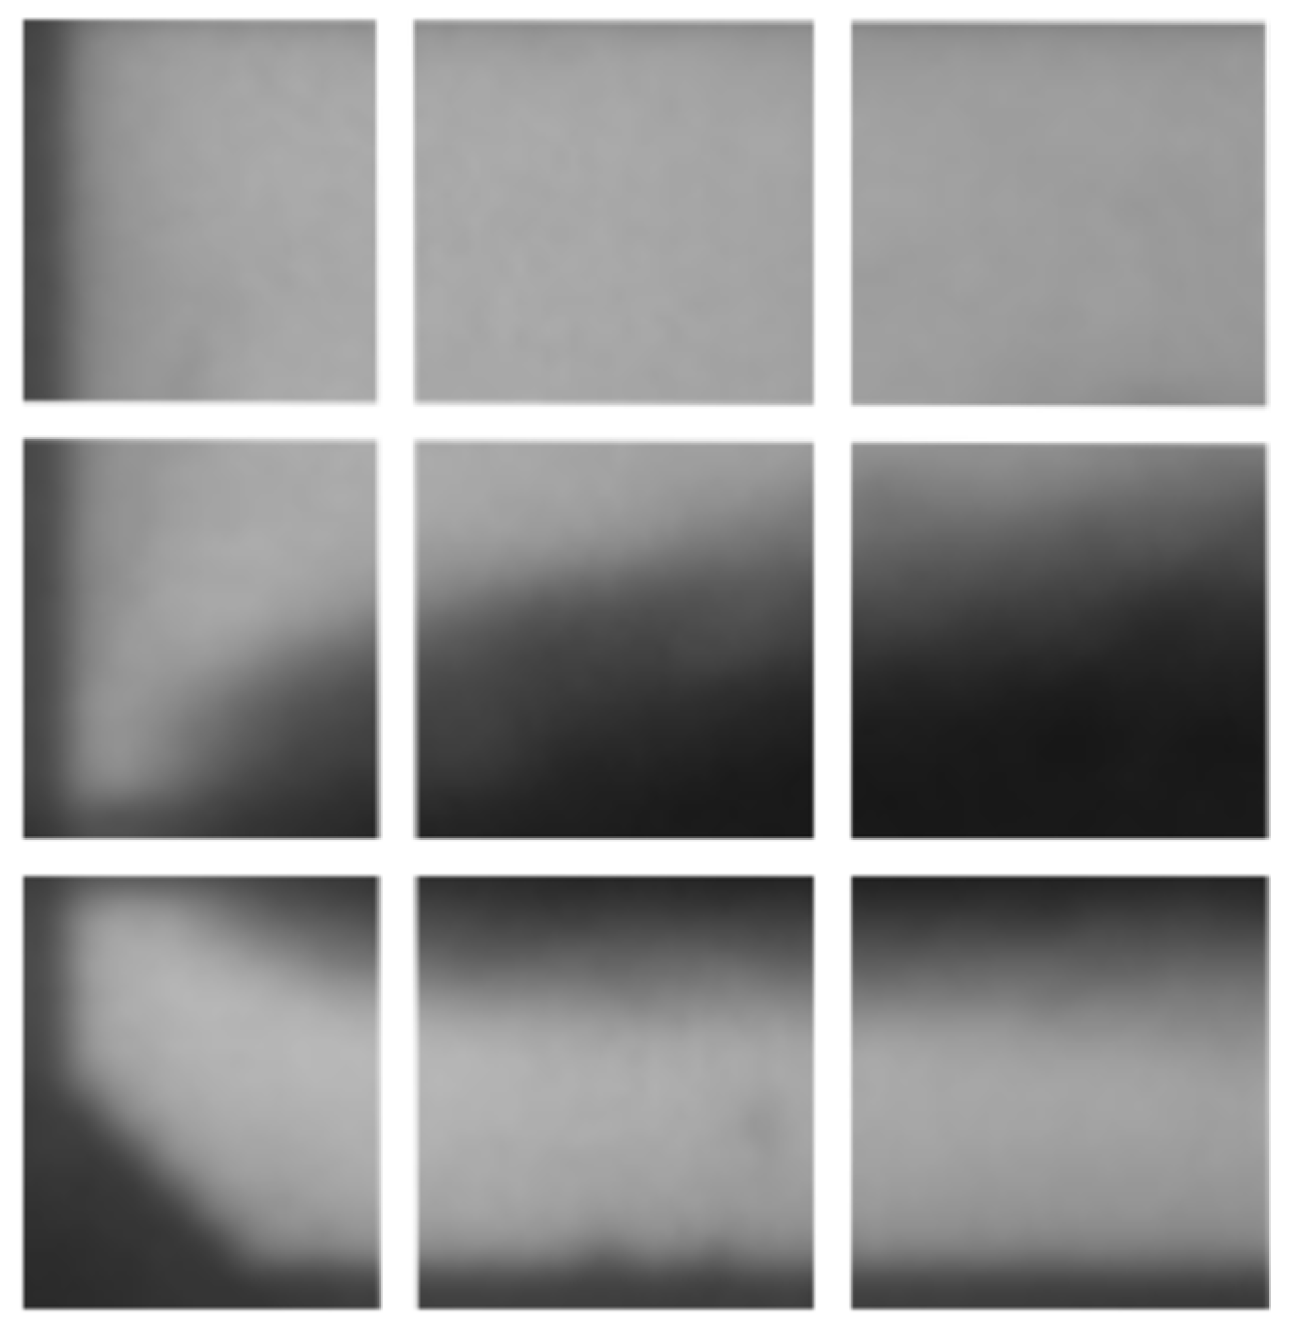
5.1. Electroluminescent PV Data Set

The systems were tested on benchmarked Electroluminescent (EL) PV image databases [41]. The EL PV dataset is produced when a solar panel receives an electric current, resulting in EL images. The panel emits near-infrared light, which is captured by infrared-sensitive cameras. EL PV image type helps identify microcracks, interruptions in cell contacts, and other internal defect scatterers. Also, the given images can identify PV cell defects that impact the electric redraw of a solar cell.

5.2. Data Analysis

The solar cell images, extracted from high-resolution EL images of PV modules, include 2624 samples of 300 × 300 pixels 8-bit gray-scale images. Figure 6 shows that each image has a probability P(A) of having an anomaly, where
P(A) ∈ [0,1]
According to the database and Figure 6, the four defect probability values are 0.0, 1.0, 0.33, and 0.66. Additionally, each PV image has a suitable type, i.e., monocrystalline (mono) or polycrystalline (poly) [42].
Figure 6a shows the predominance of images without anomalies (57.5%) and a significant data proportion with anomalies (42.5%). A defect probability distribution is shown on the pie chart in Figure 6a, where images with a defect probability of 0.66 occupy 4% of the data, those with a probability of 0.33 take 11.3%, and 1.0 as defect probability have a percentage of the low 27.2%.
The monocrystalline panels account for 40.9%, indicating a significant but lower proportion than polycrystalline (59.1%), as presented in Figure 6b.
By analyzing the percentage distribution of the database attributes, we can create a balance and good data diversity for the panel types and defect classes. These characteristics are appropriate for the suggested application and for forming robust and accurate models for detecting anomalies in photovoltaic panels. Also, using the given databases, the aim is to test the ViT model’s ability to capture long-range dependencies and global context in images. This capability must allow it to effectively detect complex anomalies, even in unbalanced data. This advantage over traditional CNN models also underscores their suitability for this application.
In Figure 7, we provide contingency tables to clarify the relationship between the program’s outputs, namely, the frequency of defects and the type of PV panel.
These tables are analytical tools for visually representing and examining the relationship between these two categorical variables. By arranging data in a matrix format, we can analyze the frequency distribution of faults among various panel types, uncovering trends that may not be readily evident from the original data.
The contingency tables show the distribution of observed frequencies of PV panel types (“mono” and “poly”) according to different classes of defect probability (Figure 7a). This presentation allows testing the null hypothesis that there is no association between the type of photovoltaic panel and the defect probability (i.e., the two variables are independent). This independence is determined by calculating the chi-square statistic (Chi2) and the p-value measure obtained using the chi-square distribution with the calculated degrees of freedom [43].
Moreover, the expected frequency distribution table (Figure 7b) determines whether there is a considerable difference between the observed data and what would be expected under the assumption of independence. This comparison permits the identification of a statistically significant relationship between PV panel type and defect probability. Indeed, the Chi2 calculated from the observed and expected data is 11.1435, and the p-value is 0.01097.
The p-value obtained, which is less than 0.05, indicates that we can reject the null hypothesis. This underscores the significant relationship between panel type and defect probability. The study reveals that certain panel types have a higher defect probability, enabling operators to plan preventive maintenance interventions more accurately.
For instance, if polycrystalline panels exhibit a high defect probability, targeted technical intervention can be swiftly implemented. This underscores the practical utility of the results of our study in streamlining and enhancing solar panel maintenance [6].

5.3. Experimental Design

In this section, we outline the experimental setup used to evaluate the performance of the Vision Transformer (ViT) model. A critical aspect of the experimental design is the careful selection and tuning of hyperparameters, which directly influences the model’s learning process and its ability to generalize to unseen data. Also, we present several metrics to analyze, evaluate, and compare CNN architectures and the ViT model.

5.3.1. ViT Hyperparameters

Table 1 presents the core hyperparameters that were configured for the ViT model. The number of epochs and batch size were chosen to ensure sufficient exposure to the training data. At the same time, the learning rate and optimizer were selected to balance the rapid convergence with stable learning. Additionally, regularization techniques, such as dropout and weight decay, have been applied to prevent overfitting and enhance the model’s generalizability [5].

5.3.2. ViT and CNNs Models Parameters

This subsection compares the ViT and CNN models, focusing on critical parameters, layer configurations, and computational complexity, as detailed in Table 2.
Looking at the table, we notice a variation in the number of parameters depending on the architecture chosen. The parameter column indicates the total number of learnable parameters within the model. This metric often correlates with the model’s capacity to learn complex patterns but also affects its computational cost [44].
For the ViT model with 12 Transformer layers, the total number of parameters is ~86 M (including classifier head), which is calculated in this way: 12 × 7,162,758 = 85,953,096 and 7,162,758 are the parameters for the three ViT layers.
To present the computational complexity, we use the FLOPs (Floating Point Operations) muser [45], which can indicate how resource-intensive the model is during training and inference. Thus, the FLOPs column (Table 2) shows the approximate number of floating-point operations required to make a single inference using the model.
Although ViT is more computationally demanding (more FLOPs and higher memory consumption), this is justified by the significant increase in model accuracy and reliability. Reliability is often more important than computational efficiency in critical applications, such as detecting anomalies in photovoltaic panels, making the extra cost acceptable.
Compared with AlexNet, VGG, and ResNet, which have simpler architectures, greater depth, and the ability to handle deeper networks, ViT outperforms these models by offering better overall performance. For example, while VGG and ResNet can offer good accuracy, their reliance on local feature extraction may limit their ability to compete with ViT for tasks that require global understanding.
The combination of high accuracy with a robust attention mechanism makes ViT the model of choice when performance is paramount, even at the expense of increased computational cost. This balance between performance and complexity is a strong argument for choosing ViT in scenarios where reliability is essential.

5.3.3. Performance Metrics

Several metrics are recommended to evaluate the detection system performance, such as recall, f-measure, and accuracy [21,46,47]. In this work, we are based on the accuracy, where the equation is as follows:
Accuracy = T P + T N T P + F P + T N + F N
where:
  • TP: True positive value occurs when the model correctly predicts the positive class.
  • FP: False positive value occurs when the model incorrectly predicts the positive class.
  • TN: True negative value occurs when the model correctly predicts the negative class.
  • FN: False negative value occurs when the model incorrectly predicts the negative class.
Also, the Receiver Operating Characteristic (ROC) and Area Under ROC Curve (AUC) are used in applications to improve the performance of the applied models. This curve represents the evolution of sensitivity depending on (1-specificity) [46], and the necessary equations to calculate the AUC values are as follows:
AUC = S e n s i t i v i t y + S p e c i f i c i t y 2
where:
Specificity = T N T N + F P
Recall = Sensitivity = T P T P + F N

5.4. Results and Discussion
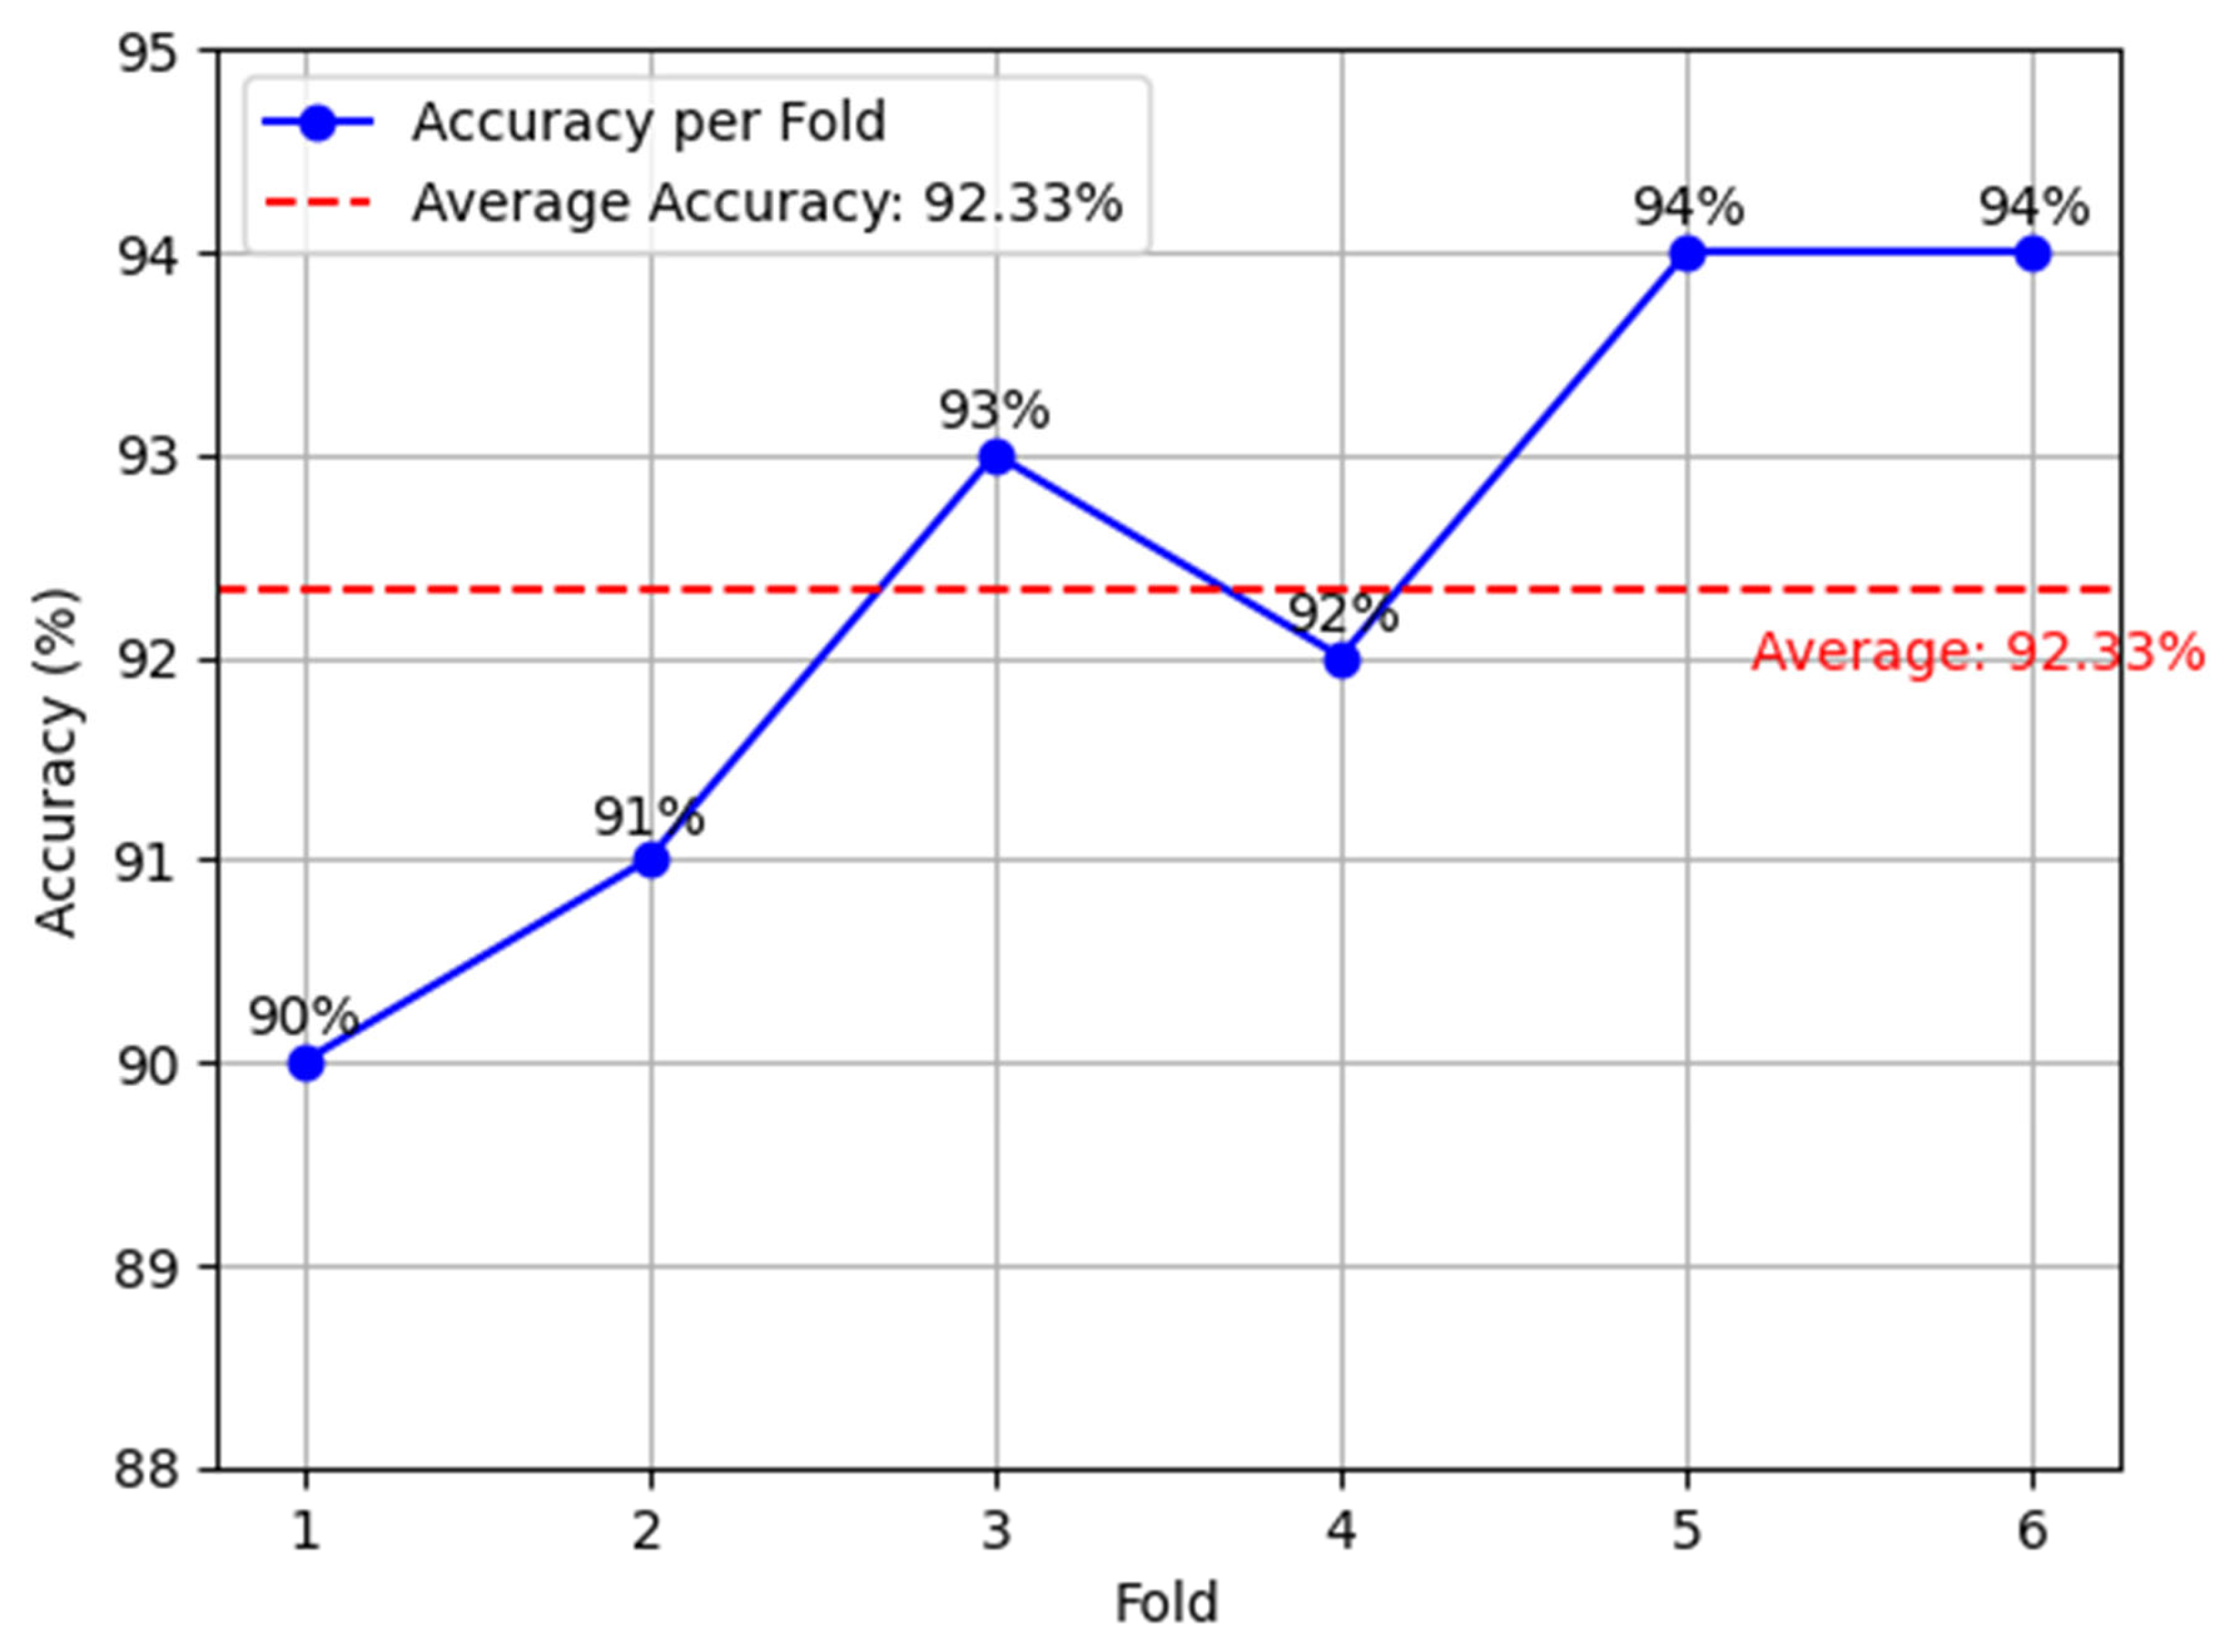
DL models have numerous corresponding architectures for each system, i.e., classification, recognition, and clustering. Moreover, advanced CNN architectures, such as ResNet, VGG, and AlexNet, are frequently used. In this respect, we propose a concrete comparison between the three architectures and the model adopted, which is ViT.

5.4.1. Results

In this section, we present the results of the developed systems and compare their performance with those of traditional models, including CNNs and other ML approaches. These findings underscore the effectiveness of our comparison, which emphasizes the superiority of the adopted model. Figure 8 illustrates the performance of each model, highlighting the accuracy and AUC in the context of PV panel anomaly detection.
To test the performance of the compared models, we used the same constraints.
Keeping the same EL PV panel database processing, the same neural network parameters and hyperparameters, e.g., number of epochs = 15, the same pretraining database (ImageNet), and the same data division (20% for testing and 80% for training), the ViT model showed the best performance, with a difference in accuracy and AUC of up to 22%.
It should be noted that we conducted the test several times, and the reported accuracy results reflect the average of our findings. Across these tests, the ViT model consistently achieved accuracy rates exceeding 92%, with 94% being the most dominant outcome. This high accuracy underscores ViT’s reliability in complex image classification tasks, particularly with more traditional CNN architectures. Although its computational cost is significant, it is justified by its superior performance and ability to capture global dependencies, making it a robust choice for mission-critical applications.
Also, we propose several literature results to show the accuracies of different PV detection anomaly systems aligned with our founding results. Table 3 provides a comparative study of the systems that use ML models and a set of CNN architectures. We note that the presented systems use the same ELPV Dataset.
Indeed, as described in the related work section, systems based on ML models show low performance. For example, for the system proposed by Deitsch et al. [23], the SVM shows an accuracy of 82%. Examining the complex process of the adopted system is necessary to determine the usefulness of the other models. For this, we have combined the performances of CNN systems, e.g., the system proposed by the authors of [23] achieves an accuracy of 88%, SeMaCNN has a 92.5% accuracy, and the lightweight CNN [26] presents an accuracy of 93%. Furthermore, the performance of the provided CNNs is less promising for adoption. Therefore, the adopted ViT model highlights its robustness (over 94% accuracy) as a significant advantage over the performance of traditional ML and CNN approaches.
Thus, this analysis provides an overview of the performance of our system and positions it favorably compared to existing methods in the literature, supporting its effectiveness and potential impact in real-world applications.
It is recommended to use cross-validation [49] for the model evaluation of various data parts (instead of simply dividing the data into 80% learning and 20% test sets) to minimize evaluation variance, overcome overfitting problems, and mitigate the effects of data imbalance [5] in complex systems.
Therefore, we present our results using 6-fold cross-validation, as shown in Figure 9, to split the dataset into six subsets of equal size for a more solid estimate of our accuracy and to avoid several shortcomings. Furthermore, each subset is used once as a validation set, while the remaining five subsets constitute the training set. The operation is repeated six times, each of the six subsets being used exactly once as validation data, and the model performance will be the average over the six subsets.
When we analyze the plot results in Figure 9, we observe that the accuracy of the individual models varied from 90% to 94%. This relatively narrow range suggests that the model is stable and does not depend strongly on data division. The given accuracies indicate that the risk of overfitting has been reduced, and the model adopted is generalized and works well on the entire dataset.
Also, the average accuracy of 92.33% signifies that, on average, the model correctly classified more than 92% of the instances in the six different folds of the cross-validation.
Furthermore, for each fold, the accuracies are coherent, and the highest (folds 5 and 6), 94%, could imply that the data in these folds are more representative of the training data or that the model generated well on these specific sets.
To provide a complete assessment of the model’s performance, in addition to the accuracy metrics, we propose the ROC (Receiver Operating Characteristic) curve and the AUC (Area Under the Curve) analysis. These metrics illustrate the model’s ability to distinguish between positive and negative classes at different classification thresholds. Indeed, the results obtained prove in advance the robustness of the model developed, as shown in Figure 10.
The ROC curve results are consistent with the cross-validation results (stable accuracy above a certain number of folds), proving the sufficiency of the six folds for cross-validation.
Distinguishing between anomaly and no-anomaly classes is a critical metric in the PV anomaly detection context, and an AUC of 0.96 indicates excellent model performance with a high ability to differentiate between them.

5.4.2. Discussion

The results presented in this paper show that the ViT model outperforms the traditional CNN-based and ML-based approaches for PV anomaly detection. The ViT model’s AUC of 96% demonstrates its superior ability to distinguish between anomalous and non-anomalous PV panels. This high performance is mainly due to the model’s self-attention mechanism, which is a unique feature that allows it to capture long-range dependencies and global contextual information. This capability, which is not present in CNNs that primarily focus on local feature extraction, enables the ViT model to understand the relationships between different parts of the PV panel, leading to its high accuracy [37].
Research in this field has explored various models for PV anomaly detection. For instance, Deitsch et al. [23] used a light CNN architecture for the automatic classification of defective PV module cells in electroluminescence (EL) images, achieving an accuracy of 93%. Similarly, Deitsch et al. [23] employed a Support Vector Machine (SVM) approach and reported an accuracy of 82.44%. While these models showed reasonable performance, their accuracy and generalization capabilities were lower than those demonstrated by the ViT model, which stands out as a superior choice for PV anomaly detection, achieving 96% AUC and 94% accuracy.
In another study, Korovin et al. [48] employed an extended CNN classifier for fault detection in PV systems, and their performance system achieved an accuracy of 92,5%. Although this approach benefits from ensemble learning techniques, combining multiple models to improve accuracy and robustness still falls short compared to the ViT model’s performance.
The ViT model’s robustness is further validated through a six-fold cross-validation process, demonstrating a consistent accuracy of 90% to 94% across different folds. This suggests that the model can generalize well on unseen data, which is a crucial factor for real-life applications. The ViT model’s stable performance and high average accuracy of 92.33% across different cross-validation folds further underscores its reliability and robustness, making it a good tool for real-world PV anomaly detection. The high average accuracy of 92.33% confirms the ViT model’s reliability despite its significant computational cost and consumption. This high accuracy means that the ViT model can reliably detect anomalies in PV systems, potentially preventing system failures and improving the overall system efficiency.
Exploring hyperparameter optimization and additional data integration would enhance the model’s performance and robustness. However, this study demonstrates that all processes in our approach are coherent. Moreover, based solely on ViT’s capabilities for preprocessing, feature treatment, and classification tasks, we presented a competitive PV monitoring and maintenance system, underscoring the ViT model’s significance in the field.
Other models require extensive preprocessing and feature engineering, making them less efficient compared to the end-to-end learning capability of the ViT model [28,50].
For example, Almadhor et al. [50] discussed the fundamentals of recurrent neural networks (RNN) and LSTM networks, highlighting their application in various domains, including anomaly detection. Similarly, Zulfauzi et al. [28] implemented a probabilistic anomaly detection approach for solar forecasting using DL techniques and achieved promising results. Nonetheless, the complexity of integrating probabilistic models with real-time monitoring systems poses challenges. In contrast, the ViT model, with its straightforward architecture and high accuracy, offers a more efficient and advantageous solution for future applications.

6. Conclusions

This study exploits the performance and benefits of vision transformers to detect anomalies as part of a comprehensive approach to the monitoring and predictive maintenance of PV systems. Therefore, our approach is based on advanced neural network techniques for image analysis and user-friendly web application design, allowing intelligent control and monitoring of the desired systems.
Compared with popular CNN and ML models, the ViT model pre-trained on the ImageNet dataset, which executes all the main system processes, e.g., whether for the images themselves or the features or classification tasks, has demonstrated superior performance in anomaly detection, achieving an AUC of 96% (and 94% as accuracy). In the same context, the performance obtained highlights the effectiveness of ViT in capturing complex visual features and the percentage of anomalies.
Furthermore, the results of our extensive experimentation, including cross-validation, show that the ViT model maintains its robustness and reliability for different data subsets. This is critical for real-world applications, where variability in data and conditions influences the model’s performance.
By accurately detecting anomalies early, the ViT model enables proactive maintenance, thereby reducing the likelihood of severe faults that could lead to costly repairs or replacements. The model’s ability to capture local and global dependencies ensures that even subtle and distributed anomalies are identified, thus minimizing downtime and enhancing the reliability of PV installations. This capability not only prolongs the lifespan of the equipment but also maximizes energy production, translating directly into cost savings for the industry. Furthermore, the efficiency of the ViT model in processing large datasets and providing accurate predictions reduces the need for frequent manual inspections. This automation lowers labor costs and allows resources to be allocated more efficiently. The overall impact is a more streamlined operation, in which maintenance efforts are targeted precisely where needed, leading to significant cost savings and improved returns on investment for PV system operators. These benefits underscore the value of integrating advanced models like ViT into industrial applications, where the balance between high accuracy, operational efficiency, and cost-effectiveness is crucial.
Indeed, we must display more precision on the detected anomaly while using another database is recommended in this work, but with the given performance, our application will have a significant potential to reduce maintenance costs, extend the lifespan of equipment, and optimize the overall performance of PV systems in line with the broader objectives of Urban 4.0.
As future work or areas for improvement, we can explore the integration of Internet of Things (IoT) devices and edge computing to improve real-time monitoring capabilities. We can also expand the dataset by increasing the size and diversity of the training dataset, including different types of PV panel images and precise anomaly types with more environmental conditions.
An exciting prospect is the potential of hybrid models that combine CNNs and transformers. These models promise significant improvements in relevant feature captions and precise anomaly detection in PV systems. By addressing these areas, future research will continue to push the boundaries of PV anomaly detection, contributing significantly to the development of more intelligent and resilient urban infrastructure in the era of urbanization.

Author Contributions

Conceptualization, M.B.; methodology, M.B.; software, M.B.; validation, R.A., E.B.D. and S.A.E.A.; formal analysis, M.B., R.A., I.S. and E.B.D.; investigation, M.A., R.A., J.C. and M.H.; resources, J.C., E.B.D. and S.A.E.A.; data curation, R.A., I.S. and M.A.; writing—original draft preparation, M.B.; writing—review and editing, M.B., S.A.E.A., M.A., I.S. and M.H.; visualization, R.A., J.C., E.B.D., S.A.E.A., M.A., I.S. and M.H.; supervision, J.C. All authors have read and agreed to the published version of the manuscript.

Funding

This research received no external funding.

Institutional Review Board Statement

Not applicable.

Informed Consent Statement

Not applicable.

Data Availability Statement

The data supporting the reported results can be found in the repository linked to the code used in this study at the following URL: https://github.com/zae-bayern/elpv-dataset.

Conflicts of Interest

The authors declare no conflicts of interest.

References

  1. Musarat, M.A.; Sadiq, A.; Alaloul, W.S.; Abdul Wahab, M.M. A systematic review on enhancement in quality of life through digitalization in the construction industry. Sustainability 2022, 15, 2022. [Google Scholar] [CrossRef]
  2. Fathi, M.; Naderpour, M. Intelligent Urban Infrastructures: Realizing the Vision of Urban 4.0. J. Urban Technol. 2018, 25, 1–17. [Google Scholar]
  3. Zanella, A.; Bui, N.; Castellani, A.; Vangelista, L.; Zorzi, M. Internet of Things for Smart Cities. IEEE Internet Things J. 2014, 1, 22–32. [Google Scholar] [CrossRef]
  4. Haight, R.; Haensch, W.; Friedman, D. Solar-powering the Internet of Things. Science 2016, 353, 124–125. [Google Scholar] [CrossRef]
  5. Dosovitskiy, A. An image is worth 16x16 words: Transformers for image recognition at scale. arXiv 2020, arXiv:2010.11929. [Google Scholar]
  6. Mansouri, M.; Trabelsi, M.; Nounou, H.; Nounou, M. Deep learning-based fault diagnosis of photovoltaic systems: A comprehensive review and enhancement prospects. IEEE Access 2021, 9, 126286–126306. [Google Scholar] [CrossRef]
  7. Haripriya, P.; Parthiban, G.; Porkodi, R. A study on CNN architecture of VGGNET and Resnet fordicom image classification. Neuro Quantology 2022, 20, 2027. [Google Scholar]
  8. Hashem, I.A.T.; Usmani, R.S.A.; Almutairi, M.S.; Ibrahim, A.O.; Zakari, A.; Alotaibi, F.; Alhashmi, S.M.; Chiroma, H. Urban computing for sustainable smart cities: Recent advances, taxonomy, and open research challenges. Sustainability 2023, 15, 3916. [Google Scholar] [CrossRef]
  9. Khalifi, H.; Riahi, S.; Cherif, W. Smart Cities and Sustainable Urban Development in Morocco. Ingénierie Des Systèmes D’information 2024, 29, 741. [Google Scholar] [CrossRef]
  10. Le, M.; Nguyen, D.K.; Dao, V.D.; Vu, N.H.; Vu, H.H.T. Remote anomaly detection and classification of solar photovoltaic modules based on deep neural network. Sustain. Energy Technol. Assess. 2021, 48, 101545. [Google Scholar] [CrossRef]
  11. Gao, Y.; Liu, J. Vision Transformers for Anomaly Detection in Solar Energy Systems. IEEE Trans. Ind. Inform. 2021, 17, 8465–8474. [Google Scholar]
  12. Tina, G.M.; Ventura, C.; Ferlito, S.; De Vito, S. A state-of-art-review on machine-learning based methods for PV. Appl. Sci. 2021, 11, 7550. [Google Scholar] [CrossRef]
  13. Khan, S.; Naseer, M.; Hayat, M.; Zamir, S.W.; Khan, F.S.; Shah, M. Transformers in Vision: A Survey. ACM Comput. Surv. (CSUR) 2021, 54, 200. [Google Scholar] [CrossRef]
  14. Deng, J.; Dong, W.; Socher, R.; Li, L.-J.; Li, K.; Li, F.-F. ImageNet: A Large-Scale Hierarchical Image Database. In Proceedings of the 2009 IEEE Conference on Computer Vision and Pattern Recognition, Miami, FL, USA, 20–25 June 2009; pp. 248–255. [Google Scholar]
  15. Zakaria, N.; Hassim, Y.M.M. A Review Study of the Visual Geometry Group Approaches for Image Classification. J. Appl. Sci. Technol. Comput. 2024, 1, 14–28. [Google Scholar]
  16. Dhillon, A.; Verma, G.K. Convolutional neural network: A review of models, methodologies and applications to object detection. Prog. Artif. Intell. 2020, 9, 85–112. [Google Scholar] [CrossRef]
  17. Chen, L.; Li, S.; Bai, Q.; Yang, J.; Jiang, S.; Miao, Y. Review of image classification algorithms based on convolutional neural networks. Remote Sens. 2021, 13, 4712. [Google Scholar] [CrossRef]
  18. Bibri, S.E. The eco-city and its core environmental dimension of sustainability: Green energy technologies and their integration with data-driven smart solutions. Energy Inform. 2020, 3, 4. [Google Scholar] [CrossRef]
  19. Chandola, V.; Banerjee, A.; Kumar, V. Anomaly detection: A survey. ACM Comput. Surv. (CSUR) 2009, 41, 15. [Google Scholar] [CrossRef]
  20. de Oliveira, L.G.; Aquila, G.; Balestrassi, P.P.; de Paiva, A.P.; de Queiroz, A.R.; de Oliveira Pamplona, E.; Camatta, U.P. Evaluating economic feasibility and maximization of social welfare of photovoltaic projects developed for the Brazilian northeastern coast: An attribute agreement analysis. Renew. Sustain. Energy Rev. 2020, 123, 109786. [Google Scholar] [CrossRef]
  21. Ebnou Abdem, S.A.; Chenal, J.; Diop, E.B.; Azmi, R.; Adraoui, M.; Tekouabou Koumetio, C.S. Using Logistic Regression to Predict Access to Essential Services: Electricity and Internet in Nouakchott, Mauritania. Sustainability 2023, 15, 16197. [Google Scholar] [CrossRef]
  22. Amiri, A.F.; Oudira, H.; Chouder, A.; Kichou, S. Faults detection and diagnosis of PV systems based on machine learning approach using random forest classifier. Energy Convers. Manag. 2024, 301, 118076. [Google Scholar] [CrossRef]
  23. Deitsch, S.; Christlein, V.; Berger, S.; Buerhop-Lutz, C.; Maier, A.; Gallwitz, F.; Riess, C. Automatic classification of defective photovoltaic module cells in electroluminescence images. Sol. Energy 2019, 185, 455–468. [Google Scholar] [CrossRef]
  24. De Benedetti, M.; Leonardi, F.; Messina, F.; Santoro, C.; Vasilakos, A. Anomaly detection and predictive maintenance for photovoltaic systems. Neurocomputing 2018, 310, 59–68. [Google Scholar] [CrossRef]
  25. Al-Mashhadani, R.; Alkawsi, G.; Baashar, Y.; Alkahtani, A.A.; Nordin, F.H.; Hashim, W.; Kiong, T.S. Deep learning methods for solar fault detection and classification: A review. Sol. Cells 2021, 11, 12. [Google Scholar]
  26. Akram, M.W.; Li, G.; Jin, Y.; Chen, X.; Zhu, C.; Zhao, X.; Khaliq, A.; Faheem, M.; Ahmad, A. CNN based automatic detection of photo-voltaic cell defects in electroluminescence images. Energy 2019, 189, 116319. [Google Scholar] [CrossRef]
  27. Sherstinsky, A. Fundamentals of recurrent neural network (RNN) and long short-term memory (LSTM) network. Phys. D Nonlinear Phenom. 2020, 404, 132306. [Google Scholar] [CrossRef]
  28. Zulfauzi, I.A.; Dahlan, N.Y.; Sintuya, H.; Setthapun, W. Anomaly detection using K-Means and long-short term memory for predictive maintenance of large-scale solar (LSS) photovoltaic plant. Energy Rep. 2023, 9, 154–158. [Google Scholar] [CrossRef]
  29. Maurício, J.; Domingues, I.; Bernardino, J. Comparing vision transformers and convolutional neural networks for image classification: A literature review. Appl. Sci. 2023, 13, 5521. [Google Scholar] [CrossRef]
  30. Islam, K. Recent advances in vision transformer: A survey and outlook of recent work. arXiv 2022, arXiv:2203.01536. [Google Scholar]
  31. Devlin, J.; Chang, M.-W.; Lee, K.; Toutanova, K. BERT: Pre-training of Deep Bidirectional Transformers for Language Understanding. In Proceedings of the 2019 Conference of the North American Chapter of the Association for Computational Linguistics: Human Language Technologies, Minneapolis, MN, USA, 2–7 June 2019; Volume 1, pp. 4171–4186. [Google Scholar]
  32. Herrmann, C.; Sargent, K.; Jiang, L.; Zabih, R.; Chang, H.; Liu, C.; Krishnan, D.; Sun, D. Pyramid adversarial training improves vit performance. In Proceedings of the IEEE/CVF Conference on Computer Vision and Pattern Recognition, New Orleans, LA, USA, 18–24 June 2022; pp. 13419–13429. [Google Scholar]
  33. Lin, Z.; Wang, H.; Li, S. Pavement anomaly detection based on transformer and self-supervised learning. Autom. Constr. 2022, 143, 104544. [Google Scholar] [CrossRef]
  34. Lin, T.-Y.; Maire, M.; Belongie, S.; Hays, J.; Perona, P.; Ramanan, D.; Zitnick, C.L.; Dollár, P. Microsoft COCO: Common Objects 575 in Context. In Proceedings of the European Conference on Computer Vision (ECCV) 2014, Zurich, Switzerland, 6–12 September 2014; pp. 740–755. [Google Scholar]
  35. Sharma, G.; Jadon, V.K. Classification of image with convolutional neural network and TensorFlow on CIFAR-10 dataset. In Innovations in VLSI, Signal Processing and Computational Technologies, Proceedings of the International Conference on Women Researchers in Electronics and Computing, Jalandhar, India, 21–23 April 2023; Springer Nature: Singapore, 2023; pp. 523–535. [Google Scholar]
  36. Krizhevsky, A.; Sutskever, I.; Hinton, G.E. ImageNet classification with deep convolutional neural networks. Commun. ACM 2017, 60, 84–90. [Google Scholar] [CrossRef]
  37. Huo, Y.; Jin, K.; Cai, J.; Xiong, H.; Pang, J. Vision transformer (Vit)-based applications in image classification. In Proceedings of the 2023 IEEE 9th International Conference on Big Data Security on Cloud (BigDataSecurity), Proceedings of the IEEE International Conference on High Performance and Smart Computing, (HPSC) and IEEE International Conference on Intelligent Data and Security (IDS), New York, NY, USA, 6–8 May 2023; pp. 135–140. [Google Scholar]
  38. Bounabi, M.; Elmoutaouakil, K.; Satori, K. A new neutrosophic TF-IDF term weighting for text mining tasks: Text classification use case. Int. J. Web Inf. Syst. 2021, 17, 229–249. [Google Scholar] [CrossRef]
  39. Rastegari, M.; Ordonez, V.; Redmon, J.; Farhadi, A. Xnor-net: Imagenet classification using binary convolutional neural networks. In Computer Vision–ECCV 2016, Proceedings of the European Conference on Computer Vision, Amsterdam, The Netherlands, 11–14 October 2016; Springer International Publishing: Cham, Switzerland, 2016; pp. 525–542. [Google Scholar]
  40. Hammoudi, Y.; Idrissi, I.; Boukabous, M.; Zerguit, Y.; Bouali, H. Review on maintenance of photovoltaic systems based on deep learning and internet of things. Indones. J. Electr. Eng. Comput. Sci. 2022, 26, 1060–1072. [Google Scholar]
  41. Buerhop-Lutz, C.; Deitsch, S.; Maier, A.; Gallwitz, F.; Berger, S.; Doll, B.; Hauch, J.; Camus, C.; Brabec, C.J. A Benchmark for Visual Identification of Defective Solar Cells in Electroluminescence Imagery. In Proceedings of the European PV Solar Energy Conference and Exhibition (EU PVSEC), Brussels, Belgium, 24–28 September 2018. [Google Scholar] [CrossRef]
  42. Dobrzański, L.A.; Szczęsna, M.; Szindler, M.; Drygała, A. Electrical properties mono-and polycrystalline silicon solar cells. J. Achiev. Mater. Manuf. Eng. 2013, 59, 67–74. [Google Scholar]
  43. Agresti, A. Categorical Data Analysis; John Wiley & Sons: Hoboken, NJ, USA, 2012; Volume 792. [Google Scholar]
  44. Bengio, Y.; Goodfellow, I. Deep Learning; MIT Press: Cambridge, MA, USA, 2016. [Google Scholar]
  45. He, K.; Zhang, X.; Ren, S.; Sun, J. Deep Residual Learning for Image Recognition. In Proceedings of the IEEE Conference on Computer Vision and Pattern Recognition (CVPR), Las Vegas, NV, USA, 27–30 June 2016; pp. 770–778. [Google Scholar]
  46. Bounabi, M.; Moutaouakil, K.E.; Satori, K. A comparison of text classification methods using different stemming techniques. Int. J. Comput. Appl. Technol. 2019, 60, 298–306. [Google Scholar] [CrossRef]
  47. Abdem, S.A.E.; Azmi, R.; Diop, E.B.; Adraoui, M.; Chenal, J. Identifying determinants of waste management access in Nouakchott, Mauritania: A logistic regression model. Data Policy 2024, 6, e29. [Google Scholar] [CrossRef]
  48. Korovin, A.; Vasilev, A.; Egorov, F.; Saykin, D.; Terukov, E.; Shakhray, I.; Zhukov, L.; Budennyy, S. Anomaly detection in electroluminescence images of heterojunction solar cells. Sol. Energy 2023, 259, 130–136. [Google Scholar] [CrossRef]
  49. Kohavi, R. A study of cross-validation and bootstrap for accuracy estimation and model selection. IJCAI 1995, 14, 1137–1145. [Google Scholar]
  50. Almadhor, A. Proactive Monitoring, Anomaly Detection, and Forecasting of Solar Photovoltaic Systems Using Artificial Neural Networks. Ph.D. Dissertation, Daniel Felix Ritchie School of Engineering and Computer Science, Electrical and Computer Engineering, Denver, CO, USA, 2019. [Google Scholar]
Figure 1. Detailed diagram of the ViT architecture for anomaly detection in PV images.
Technologies 12 00192 g001
Figure 2. The applied process of the PV anomaly detection system using ViT.
Technologies 12 00192 g002
Figure 3. PV image patching example.
Technologies 12 00192 g003
Figure 4. Process Flow of the Software Application for PV Anomaly Detection.
Technologies 12 00192 g004
Figure 5. Example Screen of the User Interfaces for the PV Anomaly Detection Application.
Technologies 12 00192 g005
Figure 6. Distribution of Electroluminescent PV Images by: (a) PV Panel Type; (b) Anomaly Presence and Defect Probability.
Technologies 12 00192 g006
Figure 7. Contingency Tables Showing the Relationship Between PV Panel Type and Defect Probability: (a) Observed Frequency Distribution of Defects by Panel Type; (b) Expected Frequency Distribution of Defects by Panel Type.
Technologies 12 00192 g007
Figure 8. Performance Comparison of CNN and ViT Models for PV Anomaly Detection Systems.
Technologies 12 00192 g008
Figure 9. Accuracy variation of the ViT model using six-fold cross-validation.
Technologies 12 00192 g009
Figure 10. ROC Curve for the ViT-Based PV Anomaly Detection System.
Technologies 12 00192 g010
Table 1. ViT Hyperparameters.
HyperparameterValueDescription
Number of Epochs15Number of times the entire dataset passes through the model.
Batch Size32Number of samples per gradient update.
Learning Rate0.001Step size for updating the model weights.
OptimizerAdamAlgorithm to adjust weights during training
Loss FunctionCross-EntropyMeasures the difference between the predicted and true labels.
Dropout Rate0.1Fraction of units to drop during training to prevent overfitting.
Weight Decay0.01Regularization term added to the loss function.
Table 2. Analysis of ViT and CNNs models: Parameters, Computational Complexity, and Layer Depth.
ModelParameters (Million)FLOPsDepth (Layers)Comments
ViT~86 M
  • Multihead Self-Attention layer: ~2 M parameters
  • FFN layer: ~5 M parameters
  • Layer Normalization and Embeddings: 1536 parameters)
~17.6 GFLOPs12Very powerful for capturing global dependencies but highly resource-intensive [5].
AlexNet~60 M~725 MFLOPs8Less complex, suitable for simpler architectures [7].
VGG~138 M~15.5 GFLOPs16Very complex in terms of parameters, with a high computational cost [7].
ResNet~25.5 M~4.1 GFLOPs50Good depth with increased efficiency thanks to residual blocks [5].
Table 3. Performance accuracy of several ML and DL approaches for PV anomaly detection.
Reference Approach Result (Accuracy)
Deitsch et al. [23]SVM82.44%
Deitsch et al. [23]CNN88.42%
Akram et al. [26]light CNN93%
Korovin et al. [48]SeMaCNN92.5%
Our approachViT94%
Disclaimer/Publisher’s Note: The statements, opinions and data contained in all publications are solely those of the individual author(s) and contributor(s) and not of MDPI and/or the editor(s). MDPI and/or the editor(s) disclaim responsibility for any injury to people or property resulting from any ideas, methods, instructions or products referred to in the content.

