Article

Wireless Dynamic Sensor Network for Water Quality Monitoring Based on the IoT

by
Mauro A. López-Munoz
,
Richard Torrealba-Melendez
*,
Cesar A. Arriaga-Arriaga
,
Edna I. Tamariz-Flores
,
Mario López-López
,
Félix Quirino-Morales
,
Jesus M. Munoz-Pacheco
and
Fernando López-Marcos
Faculty of Electronics Sciences, Autonomous University of Puebla, Puebla 72570, Mexico
*
Author to whom correspondence should be addressed.
Technologies 2024, 12(11), 211; https://doi.org/10.3390/technologies12110211
Submission received: 26 September 2024 / Revised: 15 October 2024 / Accepted: 21 October 2024 / Published: 23 October 2024
(This article belongs to the Special Issue IoT-Enabling Technologies and Applications)

Abstract

:
Water is a critical resource for human survival worldwide, and its availability and quality in natural reservoirs such as lakes and rivers must be monitored. In that way, wireless dynamic sensor networks can help monitor water quality. These networks have significantly advanced across various sectors, including industrial automation and environmental monitoring. Moreover, the Internet of Things has emerged as a global technological marvel, garnering interest for its ability to facilitate information visualization and ease of deployment—the combination of wireless dynamic sensor networks and the Internet of Things improves water monitoring and helps to care for this vital resource. This article presents the design and deployment of a wireless dynamic sensor network comprising a mobile node outfitted with multiple sensors for remote aquatic navigation and a stationary node similarly equipped and linked to a server via the IoT. Both nodes can measure parameters like pH, temperature, and total dissolved solids (TDS), enabling real-time data monitoring through a user interface and generating a database for future reference. The integrated control system within the developed interface enhances the mobile node’s ability to survey various points of interest. The developed project enabled real-time monitoring of the aforementioned parameters, with the recorded data being stored in a database for subsequent graphing and analysis using the IoT. The system facilitated data collection at various points of interest, allowing for a graphical representation of parameter evolution. This included consistent temperature trends, neutral and alkaline zone data for pH levels, and variations in total dissolved solids (TDS) recorded by the mobile node, reaching up to 100 ppm.

1. Introduction

Water is one of the essential resources for human survival, as well as the life of all species on Earth. Health and hygiene are vital components of humankind’s sustainability, and any country’s progress comes from a clean, pollution-free, and hazard-free environment. One of the United Nations’ goals is to provide clean drinking water and improved sanitation by 2030 [1]. Another critical challenge of the UN is to guarantee the availability of water, its sustainable management, and sanitation for all. Nevertheless, millions still suffer from the lack of safe drinking water and proper sanitation despite the progress made by some countries like Greece, Iceland, Germany, Singapore, and Kuwait [2,3]. Inadequate water treatment plans and distribution networks lead to low-quality water, which is prone to pollution [4,5]. For that reason, water monitoring becomes essential to ensure that the citizens of any nation can lead a healthy life [6]. Thus, experts worldwide have started several research projects to remotely preserve and manage such an invaluable asset’s quality [7,8,9]. Monitoring water quality is a critical public health issue, as numerous statistics link mortality and diseases to contaminated water [10]. The presence of bacteria and viruses in water supplies, primarily due to inadequate disinfection processes, poses a significant health risk, leading to the spread of diseases [11]. In Mexico, limited access to clean water and poor water quality are major public health concerns that can cause substantial health issues, including diarrheal diseases and other waterborne illnesses [12]. It is estimated that 88% of diarrhea cases are attributed to contaminated water, mainly affecting children [13]. This issue underscores the critical need for enhanced water supply and sanitation systems to prevent disease and protect public health, particularly in vulnerable communities [14]. Improving water quality in Mexico is a matter of public health and a crucial step towards sustainable development and social well-being.
Wireless sensor networks (WSNs) and the Internet of Things (IoT) are transforming our approach to monitoring and managing various aspects of life. This monitoring includes recreation, drinking water, fishing, agriculture, industry, and environmental conditions, particularly water quality [15,16,17,18,19,20]. These paradigms, the IoT and WSNs, enable the deployment of networks of nodes equipped with sensors to gather data on critical parameters such as pH, total dissolved solids (TDS), turbidity, conductivity, and temperature, which are essential for all water bodies, especially those intended for human or animal consumption [21,22]. The integration of the IoT allows for the seamless transmission and processing of these data, enabling real-time monitoring and analysis [23,24]. Although many works report using WSNs for water quality monitoring, a variant of these networks, the dynamic sensor network (WDSN), has not been used for such a purpose. In the WDSN, one or more nodes permit mobility inside the network. This WDSN has been employed in smart city applications like transport monitoring [25]. The mobility permitted by the WDSN is ideal for monitoring water quality in a wide range of applications. This mobility extends the reach of measurements over vast bodies of water, facilitates node placement in challenging locations, and minimizes the number of static nodes in the network.
Traditional water monitoring systems, while effective, are often time-consuming and costly and require specialized equipment and trained personnel [26]. In contrast, the proposed system in this paper offers real-time monitoring capabilities, enabling tracking of critical parameters such as temperature and pH and the relationship with ammonium content [27]. Additionally, parameters like turbidity and conductivity, closely related to TDS, can be approximated from TDS measurements, offering further insights into the water’s quality [28,29,30]. The system presented in this work is vital for detecting parameters that deviate from established standards, such as those outlined in NOM-127-SSA1-2021, which specifies permissible limits for human water consumption in Mexico [31,32].
Designing a wireless dynamic sensor network for water quality monitoring is a multifaceted challenge that involves hardware design, software programming, and data management. Developing a WDSN with just two nodes—one stationary and one mobile—presents a cost-effective and efficient solution for monitoring several points within a target area. The mobile node’s ability to move and collect data from different locations is particularly advantageous, as it provides a more comprehensive overview of the water quality. Of greater significance, this mobility is crucial for identifying and responding to localized changes in water conditions that could indicate potential environmental issues [33]. Employing LabVIEW® for the interface is an excellent way to manage data, providing robust real-time monitoring and control tools. Integrating OneDrive for cloud storage and Excel for data analysis ensures that the collected data are secure and easily accessible for further analysis. Macros for optional graphing in Excel are a thoughtful addition, providing a quick visual representation of the data trends over time. This system could serve as a valuable tool for environmental scientists and local authorities in maintaining the health of aquatic ecosystems.
The main aim of the work is to design a two-node WDSN for water quality monitoring, and its implementation demonstrates the potential of combining WDSN and IoT technologies for environmental surveillance, which has yielded significant conclusions. The network proved effective, with one node being mobile, thus enabling the monitoring of multiple points of interest. The data were systematically stored in a database, ensuring that historical trends could be analyzed, which is vital for long-term environmental monitoring strategies. Moreover, developing a LabVIEW®-based interface enabled real-time monitoring, allowing immediate data visualization and analysis. This interface also provided the means to control the mobile node remotely, enhancing the system’s flexibility and responsiveness. Such systems are instrumental in safeguarding water resources and serve as a blueprint for future innovations in environmental monitoring technology. The proposed wireless dynamic sensor network based on the IoT allows the measurement of variables to be performed in natural environments and in real-time, and the collected data are stored in a database. Moreover, the use of the IoT allows real-time monitoring without being on site. Finally, it is important to mention that this paper presents a communication model based on the WDSN and IoT to monitor water quality.
This study begins with a review of the state of the art in WSNs and WDSNs, followed by the methodology used to develop the project. This includes descriptions of the sensors employed and the data acquisition system, as well as the mobile node steering system, the implemented communication, data management, and the design of the terminals that make up the developed WDSN. Subsequently, the system’s implementation in a body of water is explained, followed by the presentation of the results obtained and a discussion thereof. The work concludes with a section on conclusions and future work.

Related Works

According to the literature [34], various water quality monitoring technologies are available today. Due to their relevance in water monitoring, some of these technologies have been utilized in the projects listed below in Table 1. These applications demonstrate the progress in design and the ability to interpret the collected information over time.
Table 1 showcases four studies where the primary goal is to monitor water quality. These studies have notable similarities; for instance, they all monitor a water body’s pH and temperature. In references [8,10,16], the sensor-equipped nodes are fixed stations consisting of one to four nodes that form a wireless sensor network (WSN) to monitor water quality. In [10,16], WiFi is employed to store the collected data in the cloud, whereas in [8], GSM technology is used to send alerts to the user when the levels exceed the defined system standards. Furthermore, ref. [17] illustrates the development of a mobile prototype based on an open-source design, which can navigate a water body while tethered by a cable to a computer, transmitting the recorded data using the Ethernet protocol.
Each reviewed system presents significant differences, such as the technologies used to transmit the collected data—WiFi, GSM, LoRa, and Ethernet—and the number of nodes in the utilized network. Specifically, ref. [8] represents the sole fixed monitoring system, and ref. [17] features a unique mobile node connected to a computer. These variations highlight the diverse approaches to water quality monitoring, reflecting the adaptability of technology to different environmental conditions and monitoring needs. Integrating various communication technologies like WiFi and GSM could enable real-time data acquisition and alert systems, enhancing the responsiveness of water quality monitoring frameworks. Meanwhile, the development of mobile prototypes, as seen in [17], opens new avenues for dynamic and comprehensive water body analysis, potentially revolutionizing the field of environmental monitoring.
The wireless dynamic sensor network (WDSN) proposed stands out in the field of sensor technology by addressing certain gaps that other systems have not considered. Unlike related works, the WDSN uniquely combines a static terminal with a fully wireless mobile station, enhancing flexibility and coverage. Each terminal is equipped with the most commonly used pH, temperature, and total dissolved solids (TDS) sensors, which are strategically utilized to correlate with other parameters. This synergy provides a broader spectrum of information than other systems, including conductivity and turbidity derived from the TDS sensor and ammonium concentration based on pH readings. The proposed work also features the integration of a graphical interface designed for real-time monitoring of parameters and control of the mobile node. This interface is responsible for processing the data collected by each node, ensuring a seamless and efficient user experience. Undoubtedly, the WDSN represents a significant contribution to the current state of the art, pushing the boundaries of environmental monitoring and data acquisition.

2. Methodology

2.1. Water Quality Monitoring Sensors

This study used various sensors for water quality detection, including pH, total dissolved solids (TDS), and temperature. Moreover, the proposed system can approximate the water’s turbidity and conductivity levels from the TDS sensor measurement, and the ammonium concentration from the pH levels.
The potential of hydrogen, or pH, measures the concentration of hydrogen ions (H+) to determine the acidity or alkalinity of a solution. Its scale is logarithmic because it can vary across extensive ranges, and it goes from 0 to 14, with 0 being the most acidic, 14 the most alkaline, and 7 neutral [38]. The pH is measured using various methods, such as chemical indicators, reactive strips, or electronic meters based on glass electrodes. This last method was used for this work, and the selected sensor is the PH-4502C (no brand data, China), as shown in Figure 1a.
In order to characterize the pH sensor, standard solutions, also known as buffers, are used with fixed values of 4.01, 6.86, and 9.18 pH units at room temperature (approximately 25 °C). Given that the sensor has an analog output of 0 V to 5 V, a gain of 0.522 was implemented with resistive elements, aiming to have an appropriate output signal for the analog-to-digital converter (ADC) of the ESP32 DEVKIT V1 development board. A program was developed to obtain the voltage for each of the buffers, and since the sensor has linear behavior, the characteristic curve of Figure 1b was obtained, whose equation is described in (1).
y P H = 12.925 x + 34.1252
where x is the voltage read and y P H is the obtained pH value.
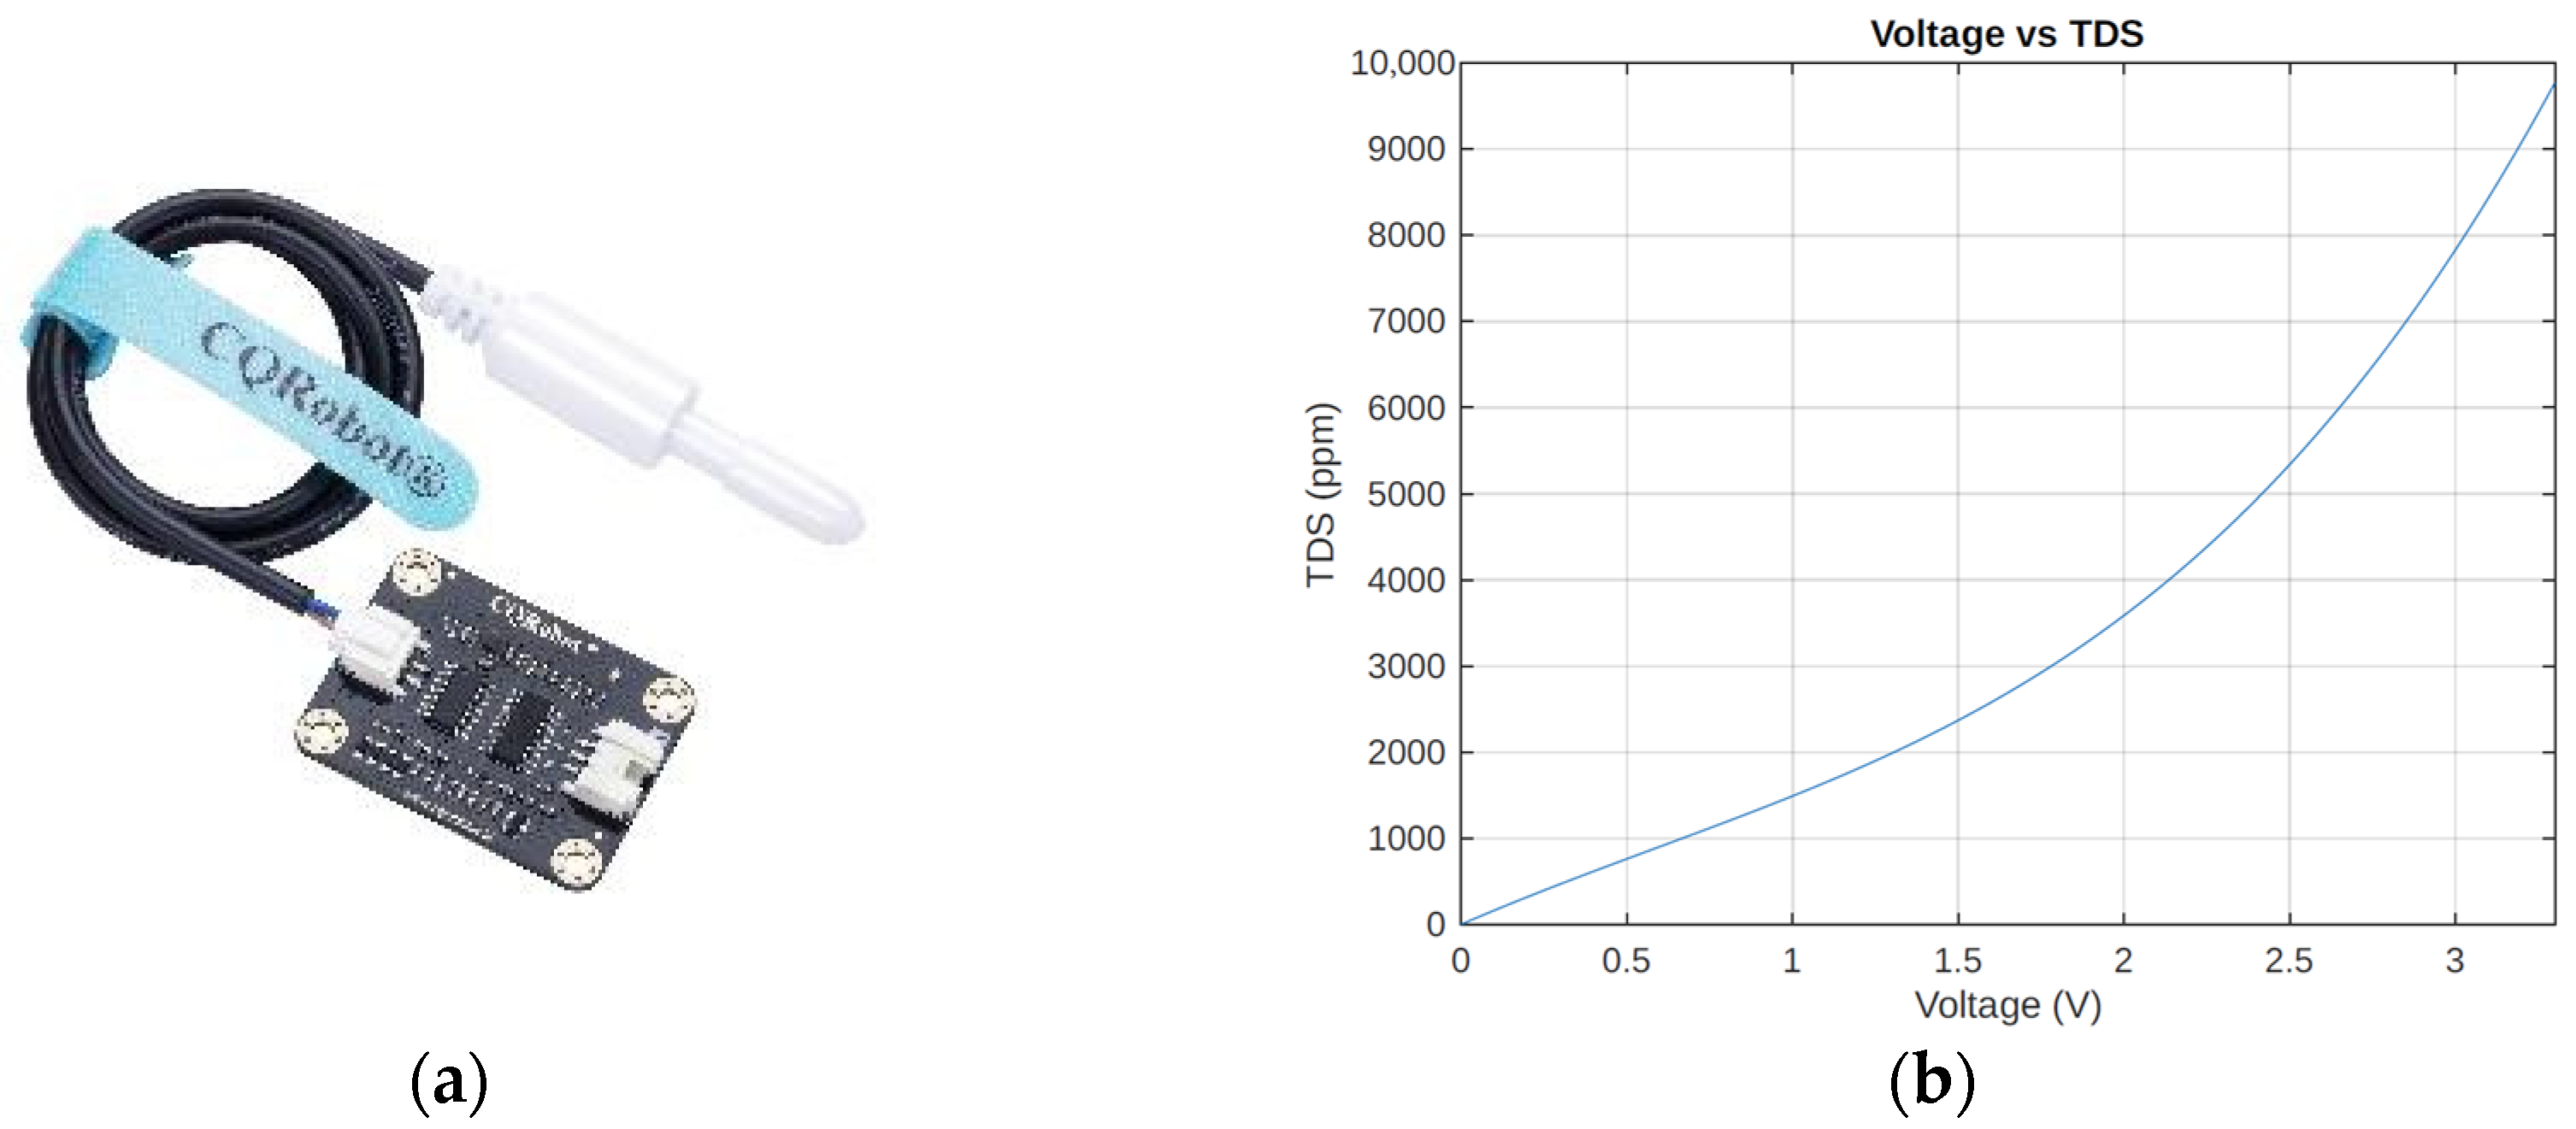
Total dissolved solids (TDS) is the measure of all organic and inorganic substances dissolved in a specific liquid, which indicates the proportion of various solids. Total dissolved solids is expressed in milligrams per liter (mg/L) or parts per million (ppm) [39]. TDS is used to assess the quality of drinking water, wastewater, natural waters, and treated waters [40]. For this study, the CQRSENTDS01 sensor, (CQRobot, China), shown in Figure 2a was employed.
The characteristic curve of the total dissolved solids sensor behavior, as shown in Figure 2b, illustrates how the concentration of solids measured in parts per million (ppm) increases with the voltage. In this case, a microcontroller program was also used, but its validation was based on the equation provided in the sensor’s specification sheet [41]. In (2), the function that describes the curve of this sensor is shown.
y T D S = 266.84 x 3 511.72 x 2 + 1750.78 x
where x is the voltage read and y T D S is the obtained TDS value.
On the other hand, water temperature is one of the most crucial parameters, as it directly influences water’s physical, chemical, and biological properties [42]. Some factors that affect this property include climate, solar radiation, depth, altitude, and the flow rate of water bodies. The DS18B20 digital thermometer (Maxim Integrated, San Jose, CA, USA) was used for this work. It provides 9- to 12-bit (configurable) temperature readings, which indicate the device’s temperature. Information is sent to/from the DS18B20 over the 1-Wire protocol [43], so only one wire (and ground) needs to be connected from a central microprocessor to a DS18B20. Power for reading, writing, and performing temperature conversions can be derived from the data line itself, and there is no need for an external power source.

2.2. Data Acquisition and Steering Control Systems

The proposed WDSN consists of 2 nodes equipped with sensors to monitor water parameters. Each node is composed of 3 sensors: pH, temperature, and TDS, two batteries of 3.7 V as a power source, and an ESP32 Devkit v1 development board to compute all data and control the system. In the case of the dynamic node, it incorporates two actuators for navigating on water.
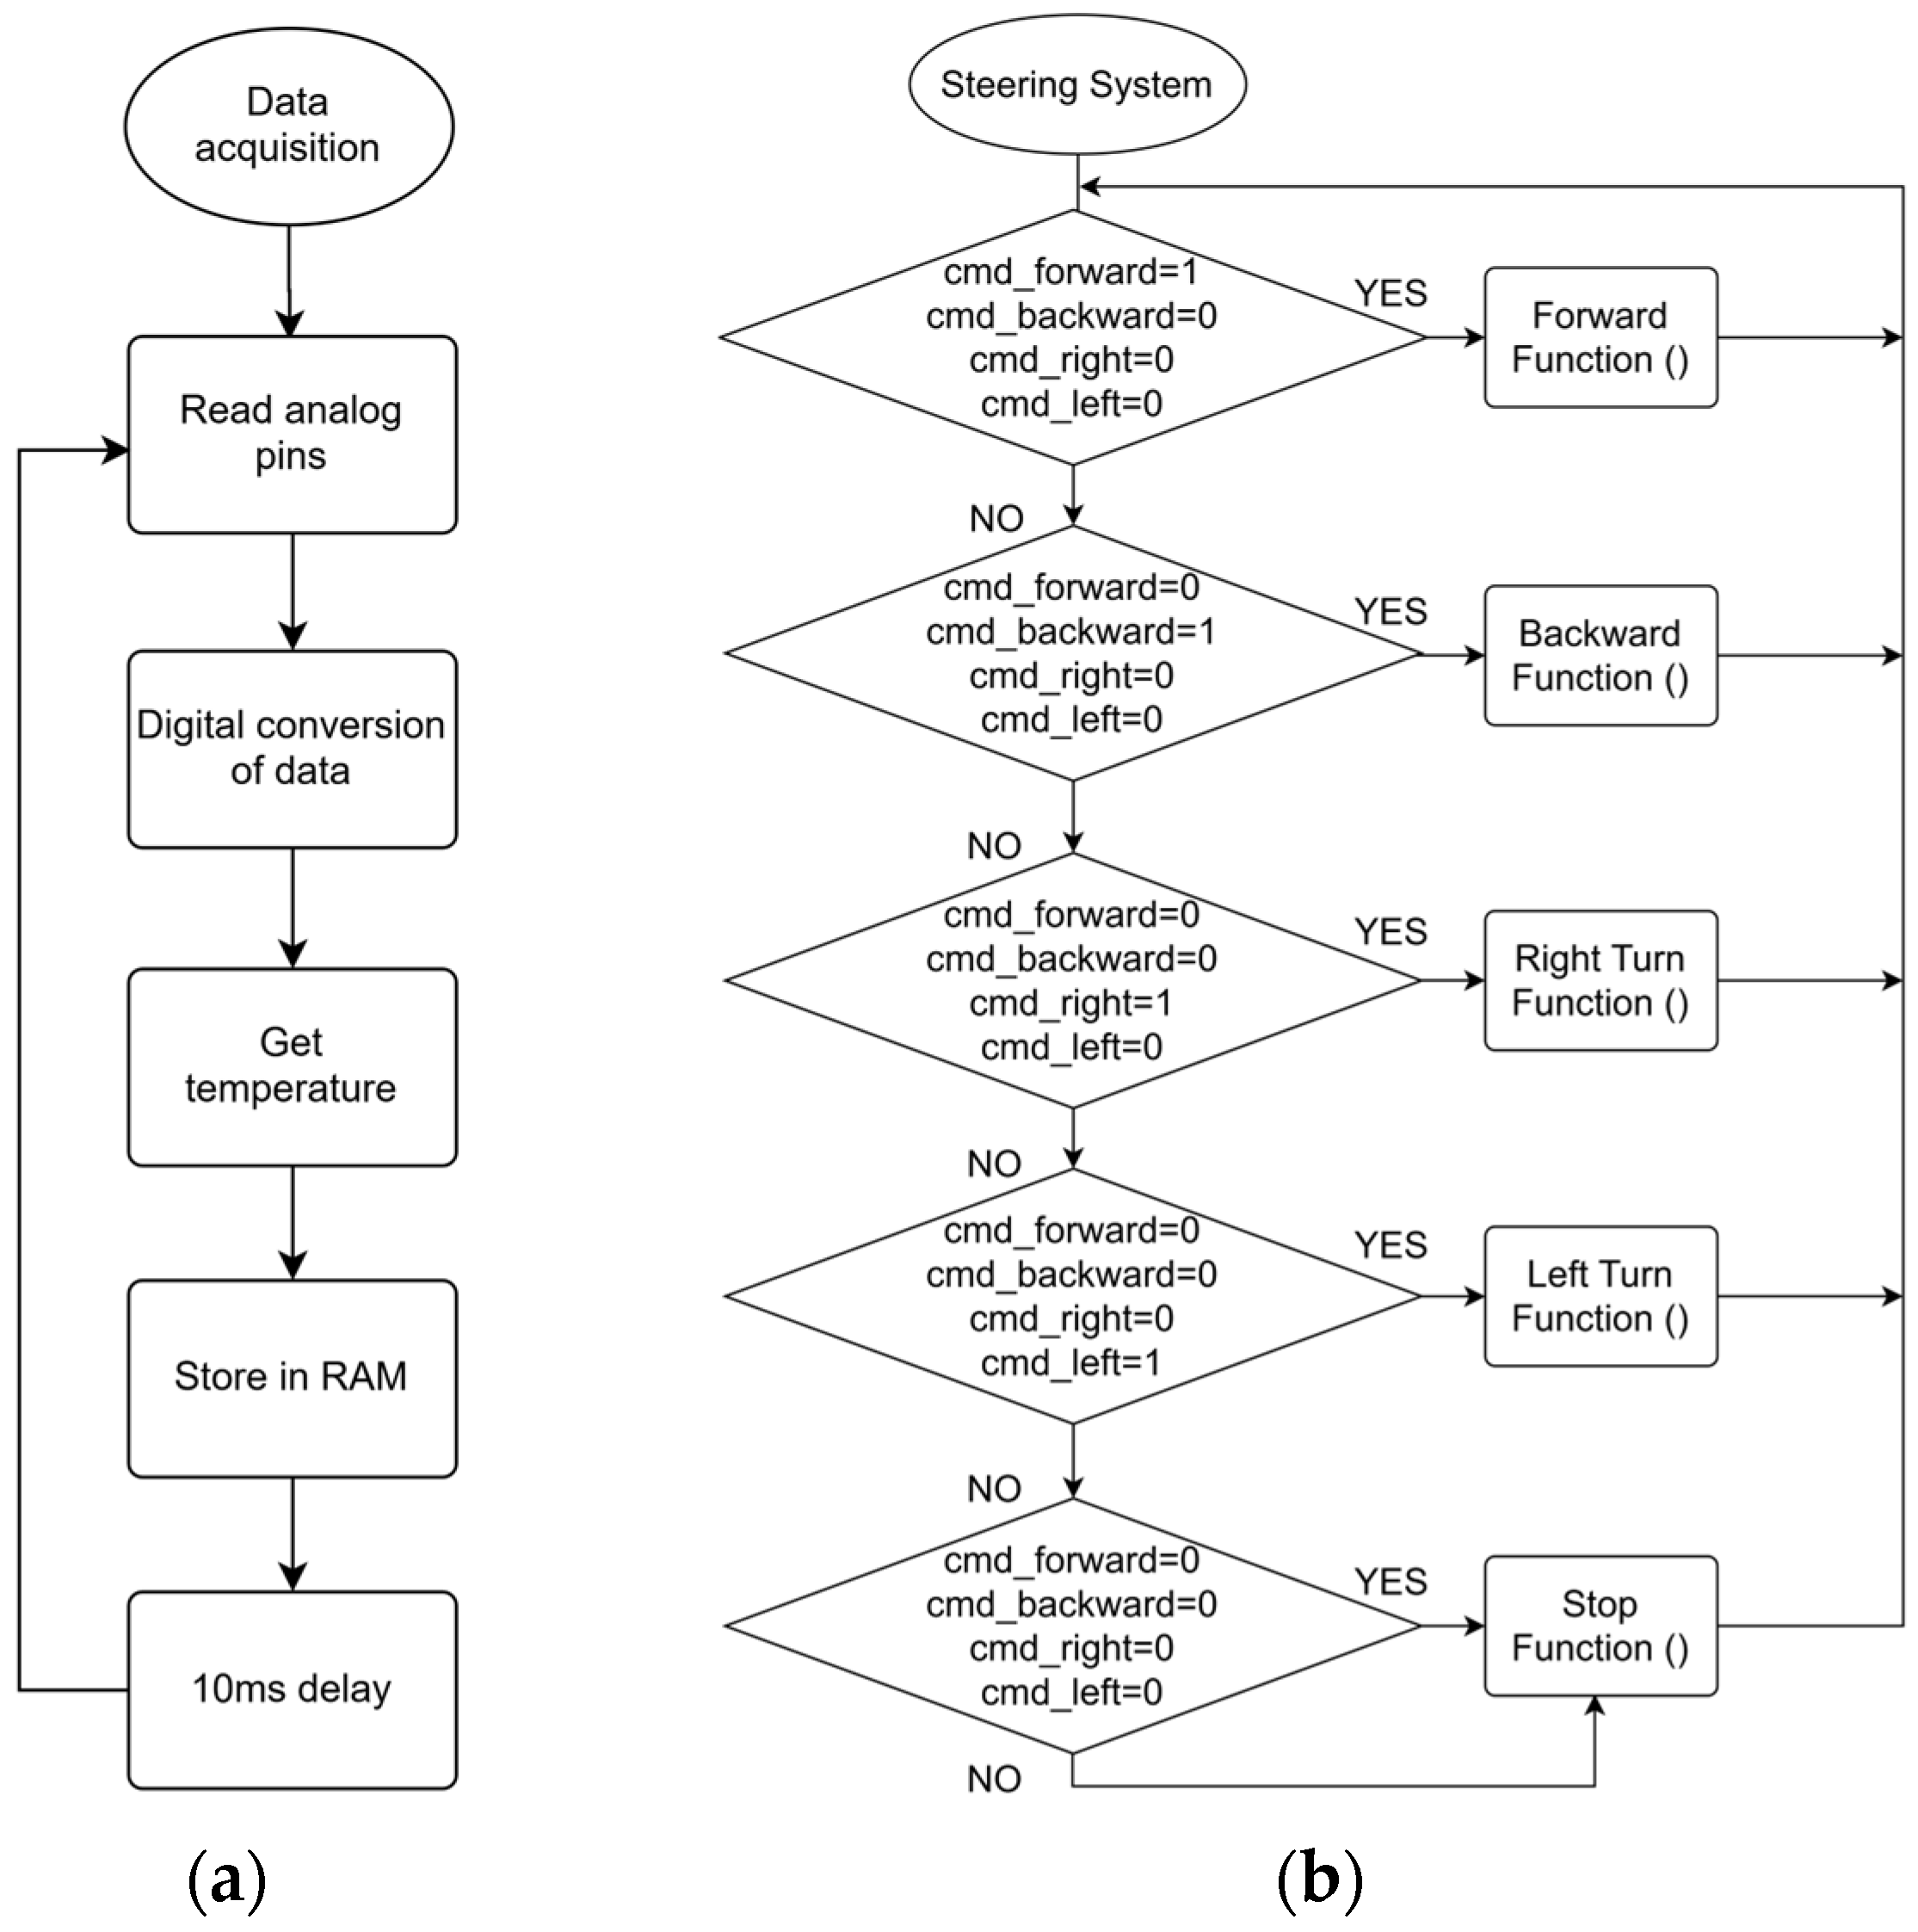
In order to acquire readings from the measurement environment, both the static and mobile nodes operate by means of a microcontroller-based system. This system utilizes the analog-to-digital converter of the ESP32 devkit v1 for the pH and TDS sensors, while the temperature sensor is connected to a digital pin. The aim is to optimize energy consumption and delegate the processing load to the developed graphical interface. This approach not only streamlines the data collection process but also enhances the efficiency of the monitoring system by reducing the power requirements and allowing for real-time data processing through a user-friendly interface. In Figure 3a, the flow chart of the data acquisition system is shown.
Figure 3b illustrates the intricacies of the steering control system, highlighting its capability to maneuver the mobile node in four distinct directions, each governed by its own variable. This level of control is crucial for positioning the vehicle at various points of interest, thereby ensuring comprehensive area coverage. Moreover, the inclusion of a ‘Stop’ function provides operators with the flexibility to halt the vehicle’s movement at precise moments, enhancing the precision of its operations. The steering mechanism is regulated through a graphical interface designed to facilitate seamless interaction between the user and the vehicle’s navigational controls. This interface enables efficient and practical monitoring tasks. More detailed information about the graphic interface will be provided in later sections.

2.3. Communication Model for WDSN

The wireless dynamic sensor network design is illustrated by means of a communication model in Figure 4, showcasing its two-node architecture. The mobile node, a vehicle equipped with sensors and actuators, navigates water bodies, enabling the monitoring of various locations with a single device. It employs the ESP-NOW communication protocol native to the development board for transmitting parameter readings to the static node. The ESP-Now protocol operates in the ISM band of 2.45 GHz. This protocol also receives commands to control the actuators’ direction.
Conversely, the static node uses the same protocol to receive data from the mobile node while sending directional commands. The static node has sensors identical to the dynamic node but lacks actuators. It communicates with a local server on a PC via the Modbus TCP/IP protocol, relaying information gathered from both nodes. A graphical interface runs on the PC, allowing real-time monitoring of parameters from each node and providing controls for the vehicle’s direction. Additionally, the proposed interface stores the reading parameter in an automatically generated Excel database hosted on Microsoft’s cloud for future access and analysis.

2.3.1. Communication Channel on OPC Servers

Implementing the server involves using an OPC server [44] and establishing a communication channel linked to the Internet. A new device is added; in this instance, the static node receives all the sampled parameters before sending them to the server. Additionally, the Figure 5a shows how the IP address assigned to the microcontroller-based system is defined to receive the desired data. This setup is crucial for ensuring efficient and reliable data exchange between the microcontroller and server, facilitating real-time monitoring and control over the network. The static node acts as an intermediary, collecting data from various sensors and instruments before packaging it for transmission to the server, where it can be further processed and managed.
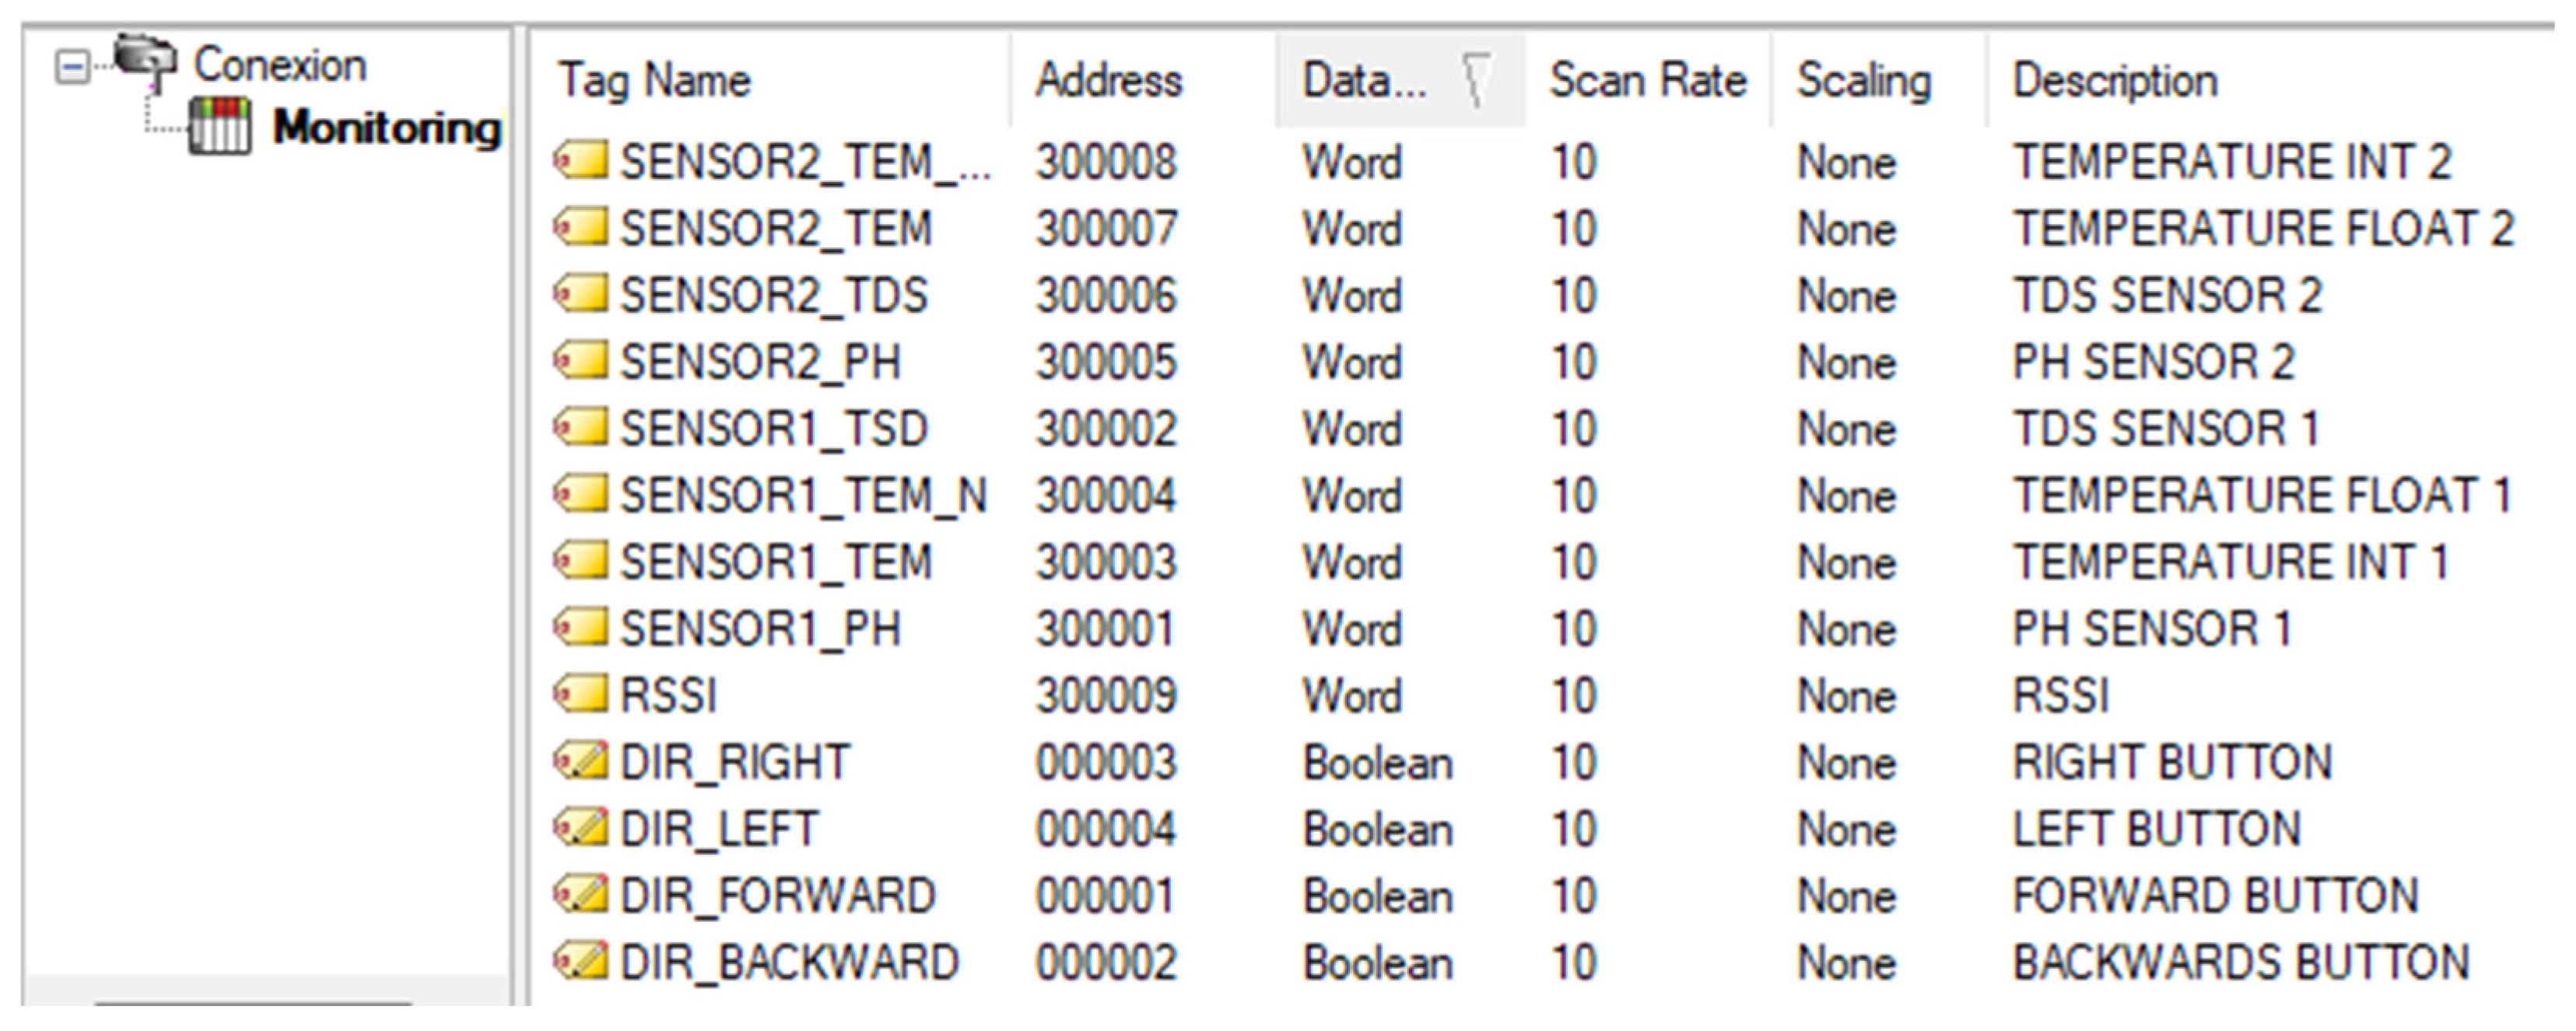
In the configuration window, under the ‘Ethernet’ section, the communication port is set to match the one designated in the static node’s communication system, typically port 502 as shown in Figure 5b. The next step involves creating labels for each parameter, allowing for independent variables for each reading from the microcontroller, simplifying data management. Moreover, the data type, register address, and read/write permissions are defined for each tag. The ‘WORD’ data type is selected for static node variables, with read-only permissions assigned register numbers ranging from 300,001 to 300,004. Conversely, the same data type and permissions apply for mobile node variables, particularly those monitoring water quality.
Additionally, tags linked to RSSI are established to approximate the distance between nodes, and Boolean-type tags are used for directional commands to control the designed vehicle. These Boolean tags have read and write permissions and are assigned register numbers from 000001 to 000004, which is adequate for maneuvering in all directions. Figure 6 illustrates the fully configured connection channel, ready to be linked with the system to receive monitored data and control the actuators of the mobile node.
Figure 6 illustrates the server in operation, displaying readings transmitted from the microcontroller. The received values for pH and total dissolved solids are the digitized readings from the sensors, which range from 0 to 4096. Here, 0 represents 0 V, and 4096 corresponds to 3.3 V, the maximum value the 12-bit ADC integrated into the microcontroller can accept. Additionally, temperature data are represented in both their integer and decimal parts. It is also noted that the directional command values vary only between zero and one, as these are logical values used to activate or deactivate the actuators of the mobile node.

2.3.2. Node Communication Systems

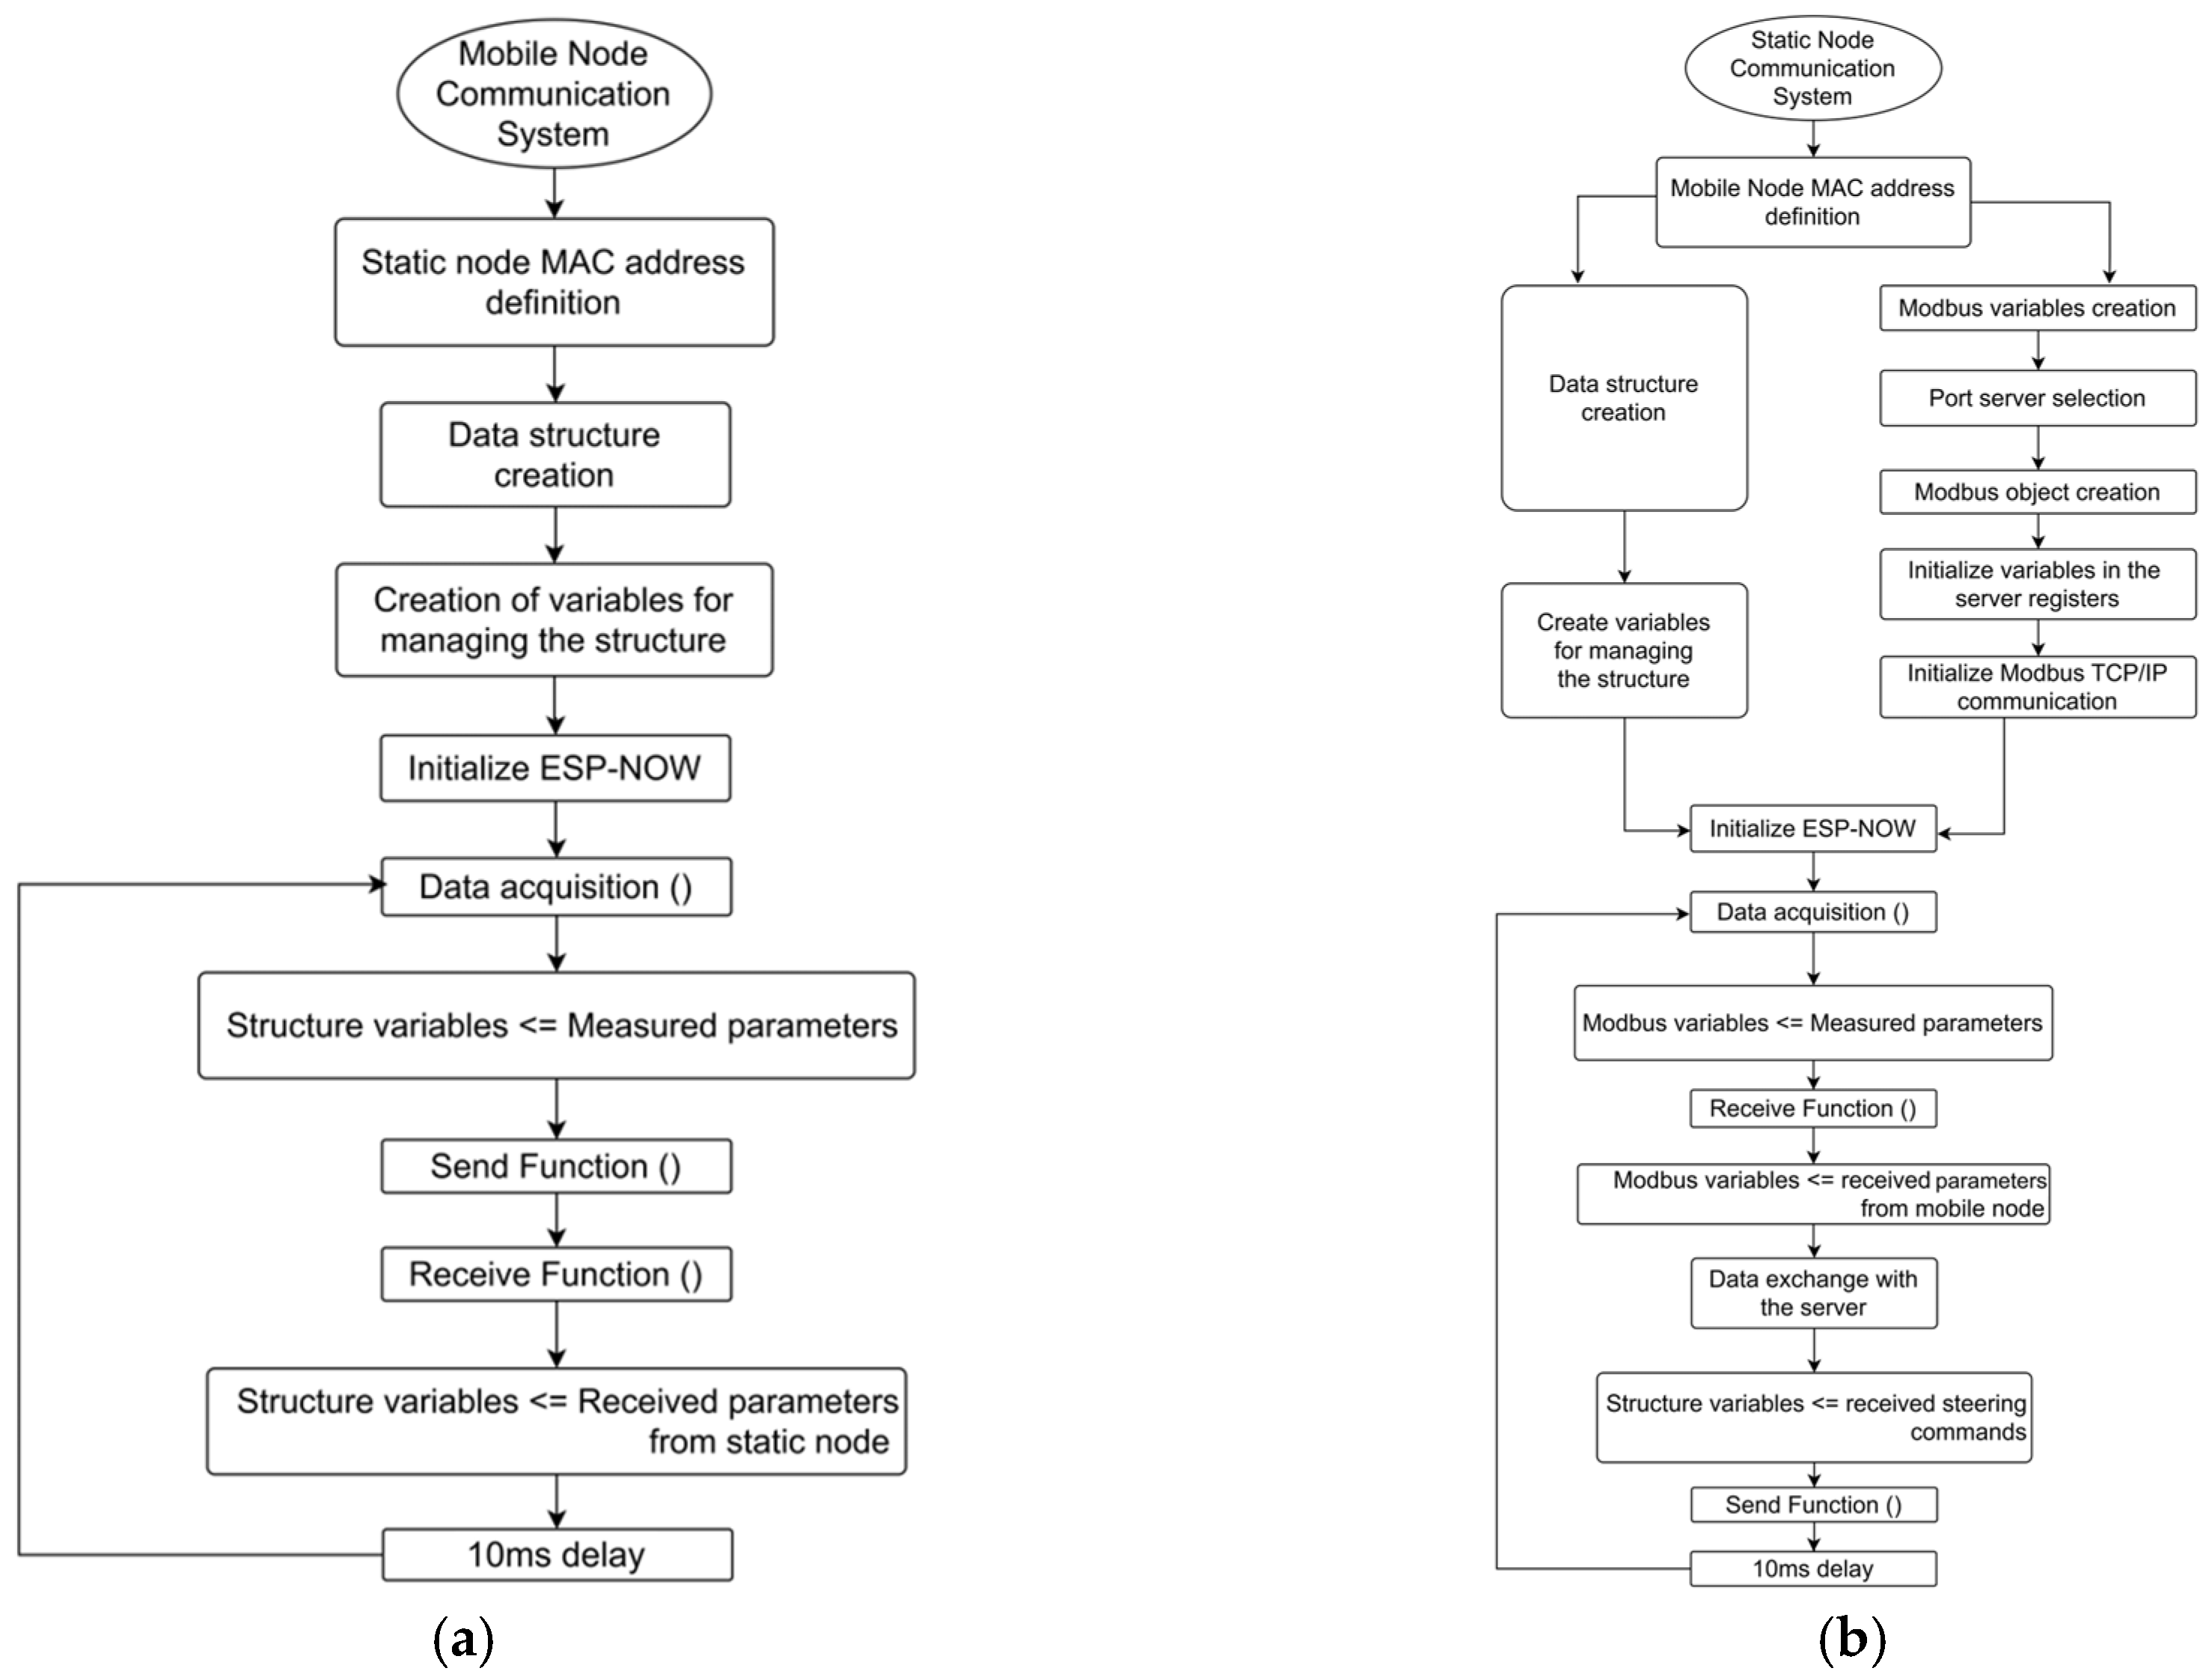
In the developed wireless dynamic sensor network (WDSN), each node has a communication system that enables it to interact with the other and send and receive data from the graphical interface. Both mobile and static nodes are integrated into this system, ensuring constant connectivity. This setup allows the mobile node to receive directional commands while simultaneously transmitting sensor readings. Similarly, the static node can issue directional commands and receive data that the mobile node captures. In Figure 7a, the diagram illustrates the mobile communication system.
On the other hand, the static node communicates with another node. It connects with the server hosted on the PC. This integration includes a communication system based on the Modbus TCP/IP protocol. Figure 7b presents a diagram that describes the operation of the static node’s communication system. This setup allows for robust and reliable data exchange, ensuring that the static node can effectively transmit information to the server and coordinate with other nodes in the network. Moreover, Modbus TCP/IP, a widely adopted protocol, facilitates interoperability and integration with various industrial systems and devices.

2.3.3. Network Sizing

In order to evaluate the range of the network, distance estimation was employed using the received signal strength indicator (RSSI), which operates under the principle that signal strength decreases as the distance between the transmitter and receiver increases. Consequently, tests were conducted in an open field, collecting 20 RSSI measurements for each distance. These measurements allowed for calculating the average RSSI for each distance, creating Table 2, which illustrates the correlation between signal intensity and distance that can be appreciated in Figure 8 in better detail. This method is crucial for designing robust wireless networks, ensuring optimal signal coverage and connectivity across varying distances.
From the results obtained, and considering a standard deviation of 1.4284, a network range of 15 m was determined. This dimension ensures efficient communication between mobile and static nodes and data transmission and reception with little to no loss, as shown in the packet loss column in the table. Such a measure is crucial for maintaining the integrity and optimal performance of the system. Ensuring minimal data loss is essential in network design, as it directly impacts the reliability and effectiveness of communication. The chosen network range reflects a strategic balance between coverage and quality, providing a robust system operation framework for the payload of 9 bytes required in the system for sending and receiving data from each sensor and directional commands.

2.4. Data Management

Data management is conducted using LabVIEW® [45], where variables are defined for each tag generated on the server, which are then interlinked. Notably, the creation of independent tags allows for the received data to be stored and manipulated more effortlessly, as there is no need to add extra algorithms to identify which parameter each piece of data corresponds to. This approach simplifies the data handling process, making it more efficient and less prone to errors, as each data point is directly associated with a unique identifier.
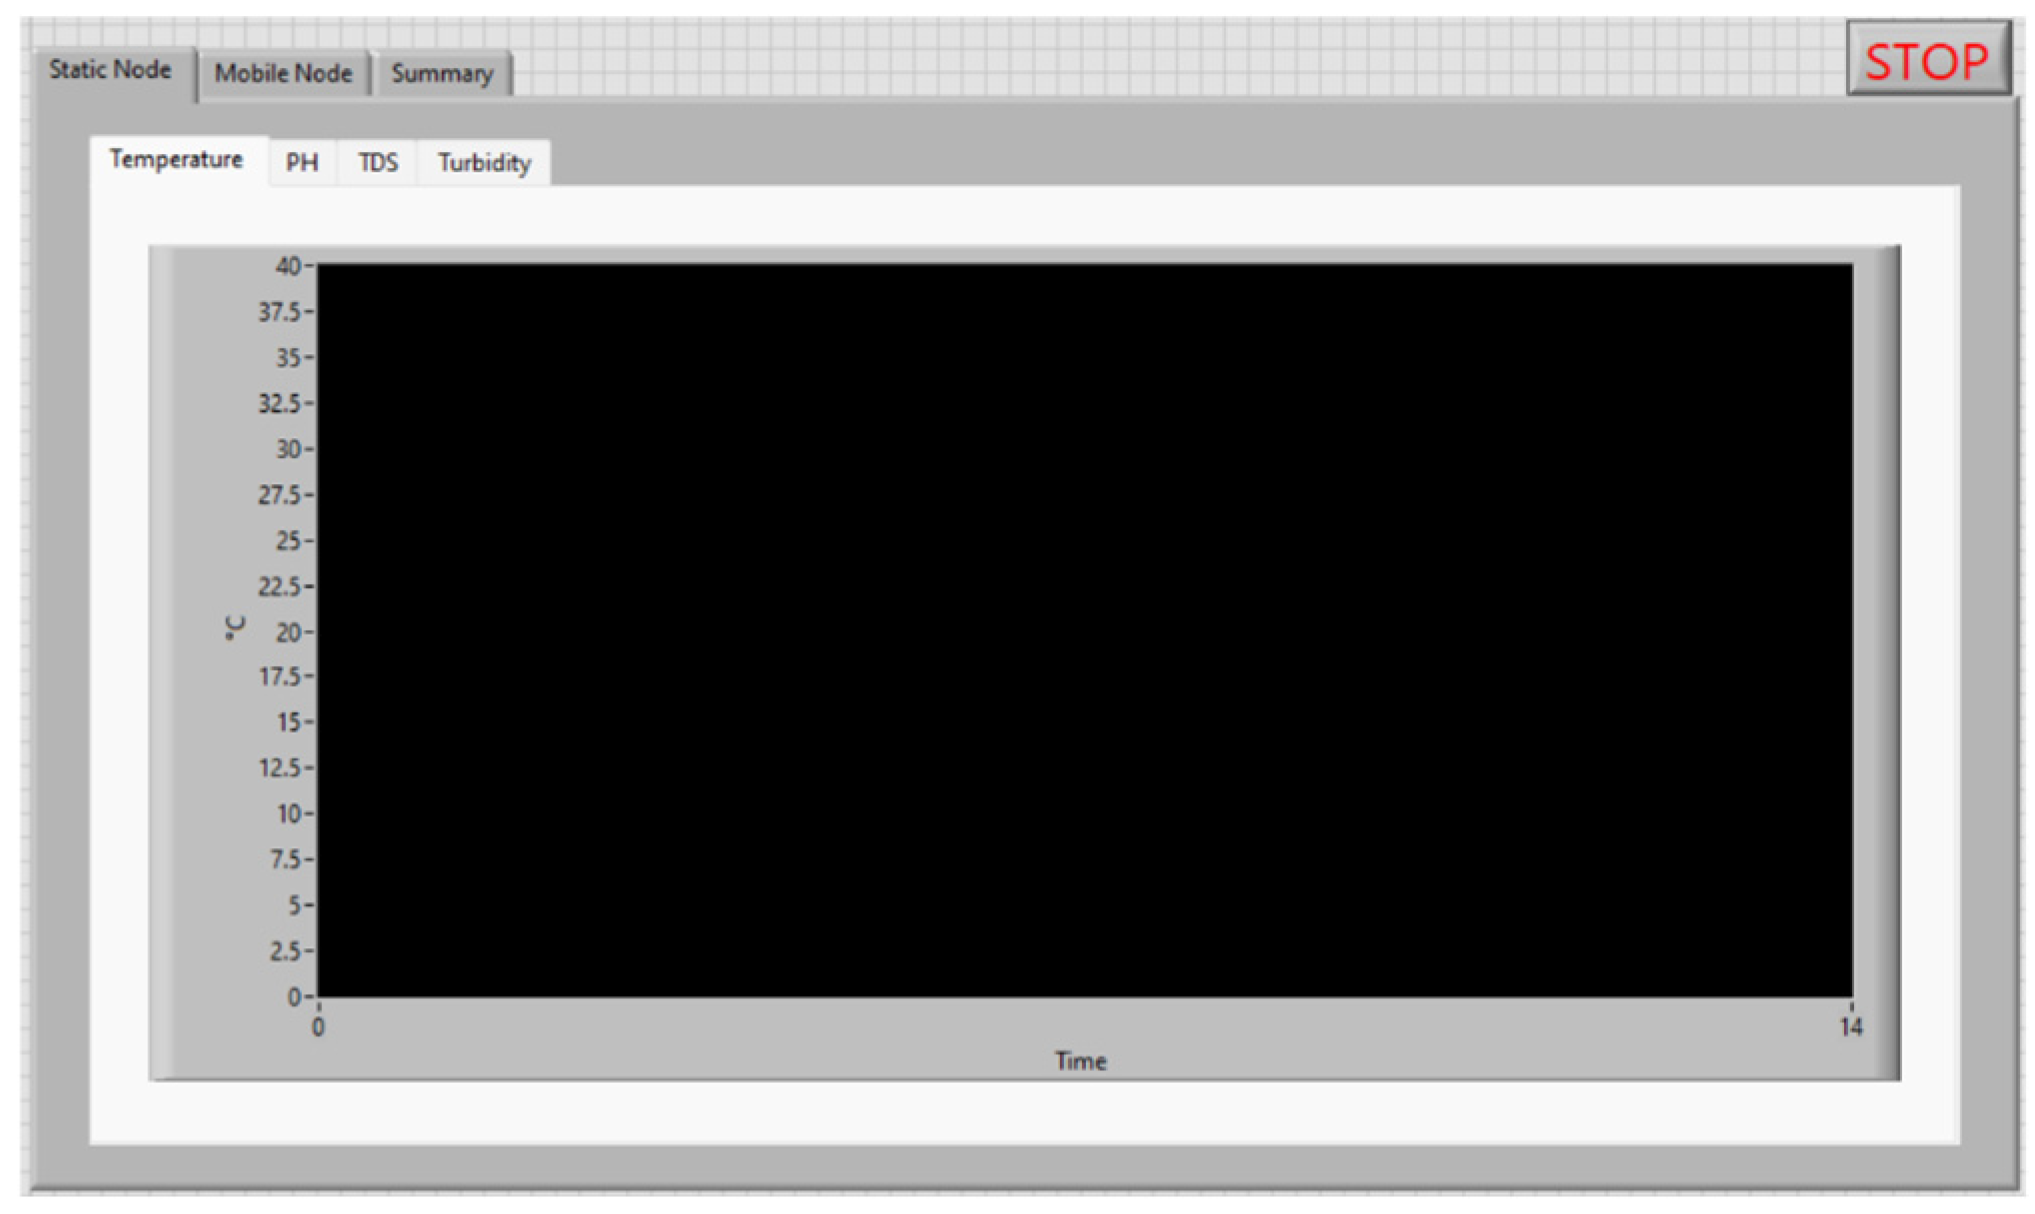
Figure 9 illustrates the front panel of the graphical interface, which features three tabs for navigating through the graphs of the four main parameters monitored by both the static and mobile nodes, in addition to a summary tab. For each node, four tabs correspond to each monitored parameter: pH, temperature, total dissolved solids, and turbidity. Each graph has a customized scale that enhances the visualization of the parameter’s progression over time. This intuitive design allows for efficient monitoring and analysis, providing a user-friendly experience for observing and interpreting the dynamic environmental data collected by the nodes.
On the other hand, Figure 10 displays the selected summary tab, which presents information derived from measurements taken for each node. It is evident from this tab that the water quality is determined based on the total dissolved solids index and the World Health Organization (WHO) standards, in alignment with the Mexican regulation NOM-127-SSA1-2021 [31,32]. Additionally, drawing on the sources above, the tab details ammonium concentration as a function of the measured pH levels and electrical conductivity determined according to the referenced equivalence. Furthermore, graphical indicators are included to assist in identifying the recorded levels.
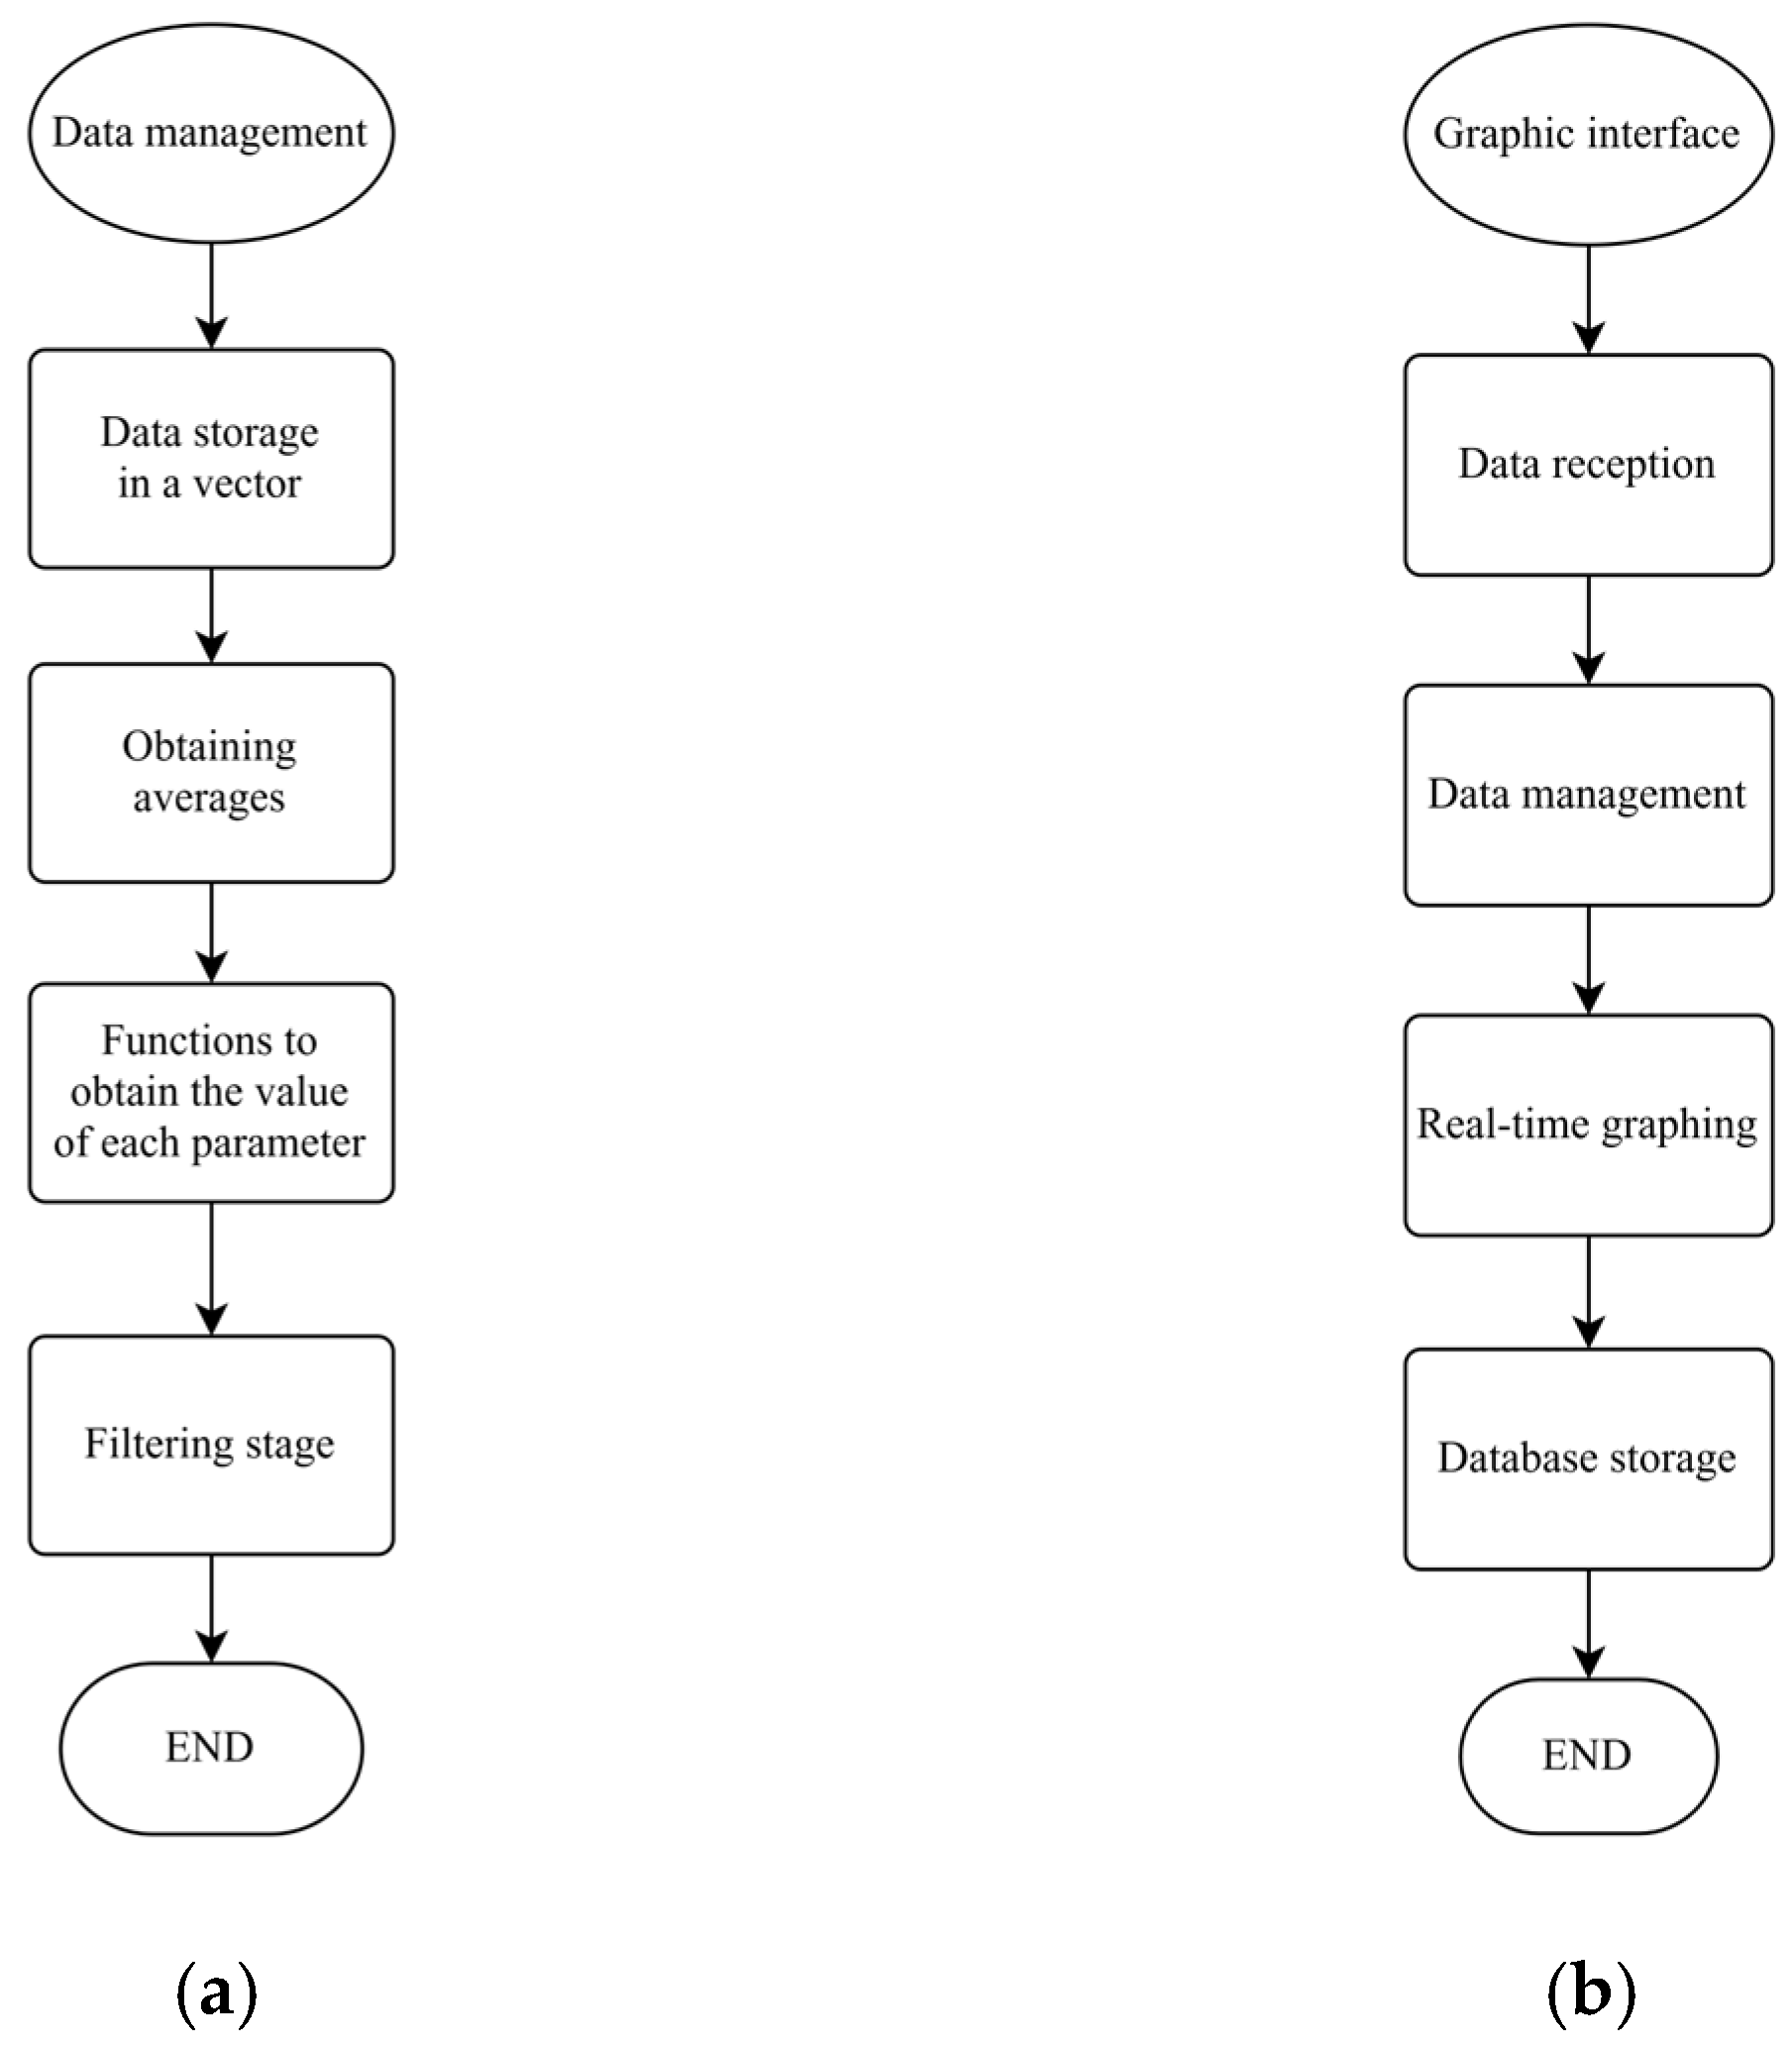
The flowchart in Figure 11a shows the data management processes behind the graphical interface. This diagram illustrates the stages of data collection and adjustment of the received information. The diagram in Figure 11b also provides a comprehensive view of the interface’s full functionality. These visual aids are crucial for comprehending the intricate steps involved in managing data, from initial collection to final presentation in the user interface. They serve as a roadmap, guiding the way through the complex system, ensuring that every piece of data is accurately captured and appropriately processed for optimal performance and usability of the interface.

2.5. Prototype Designing Process

This section outlines the design processes followed for the conceptualization and construction of the static and mobile terminals, the detailed electrical schematics, and the designed printed circuit board (PCB). This meticulous approach ensures that each aspect of the terminal design is carefully considered, from the initial sketches to the final assembly, providing a robust framework for developing high-quality, reliable terminals.

2.5.1. Static Node CAD Model

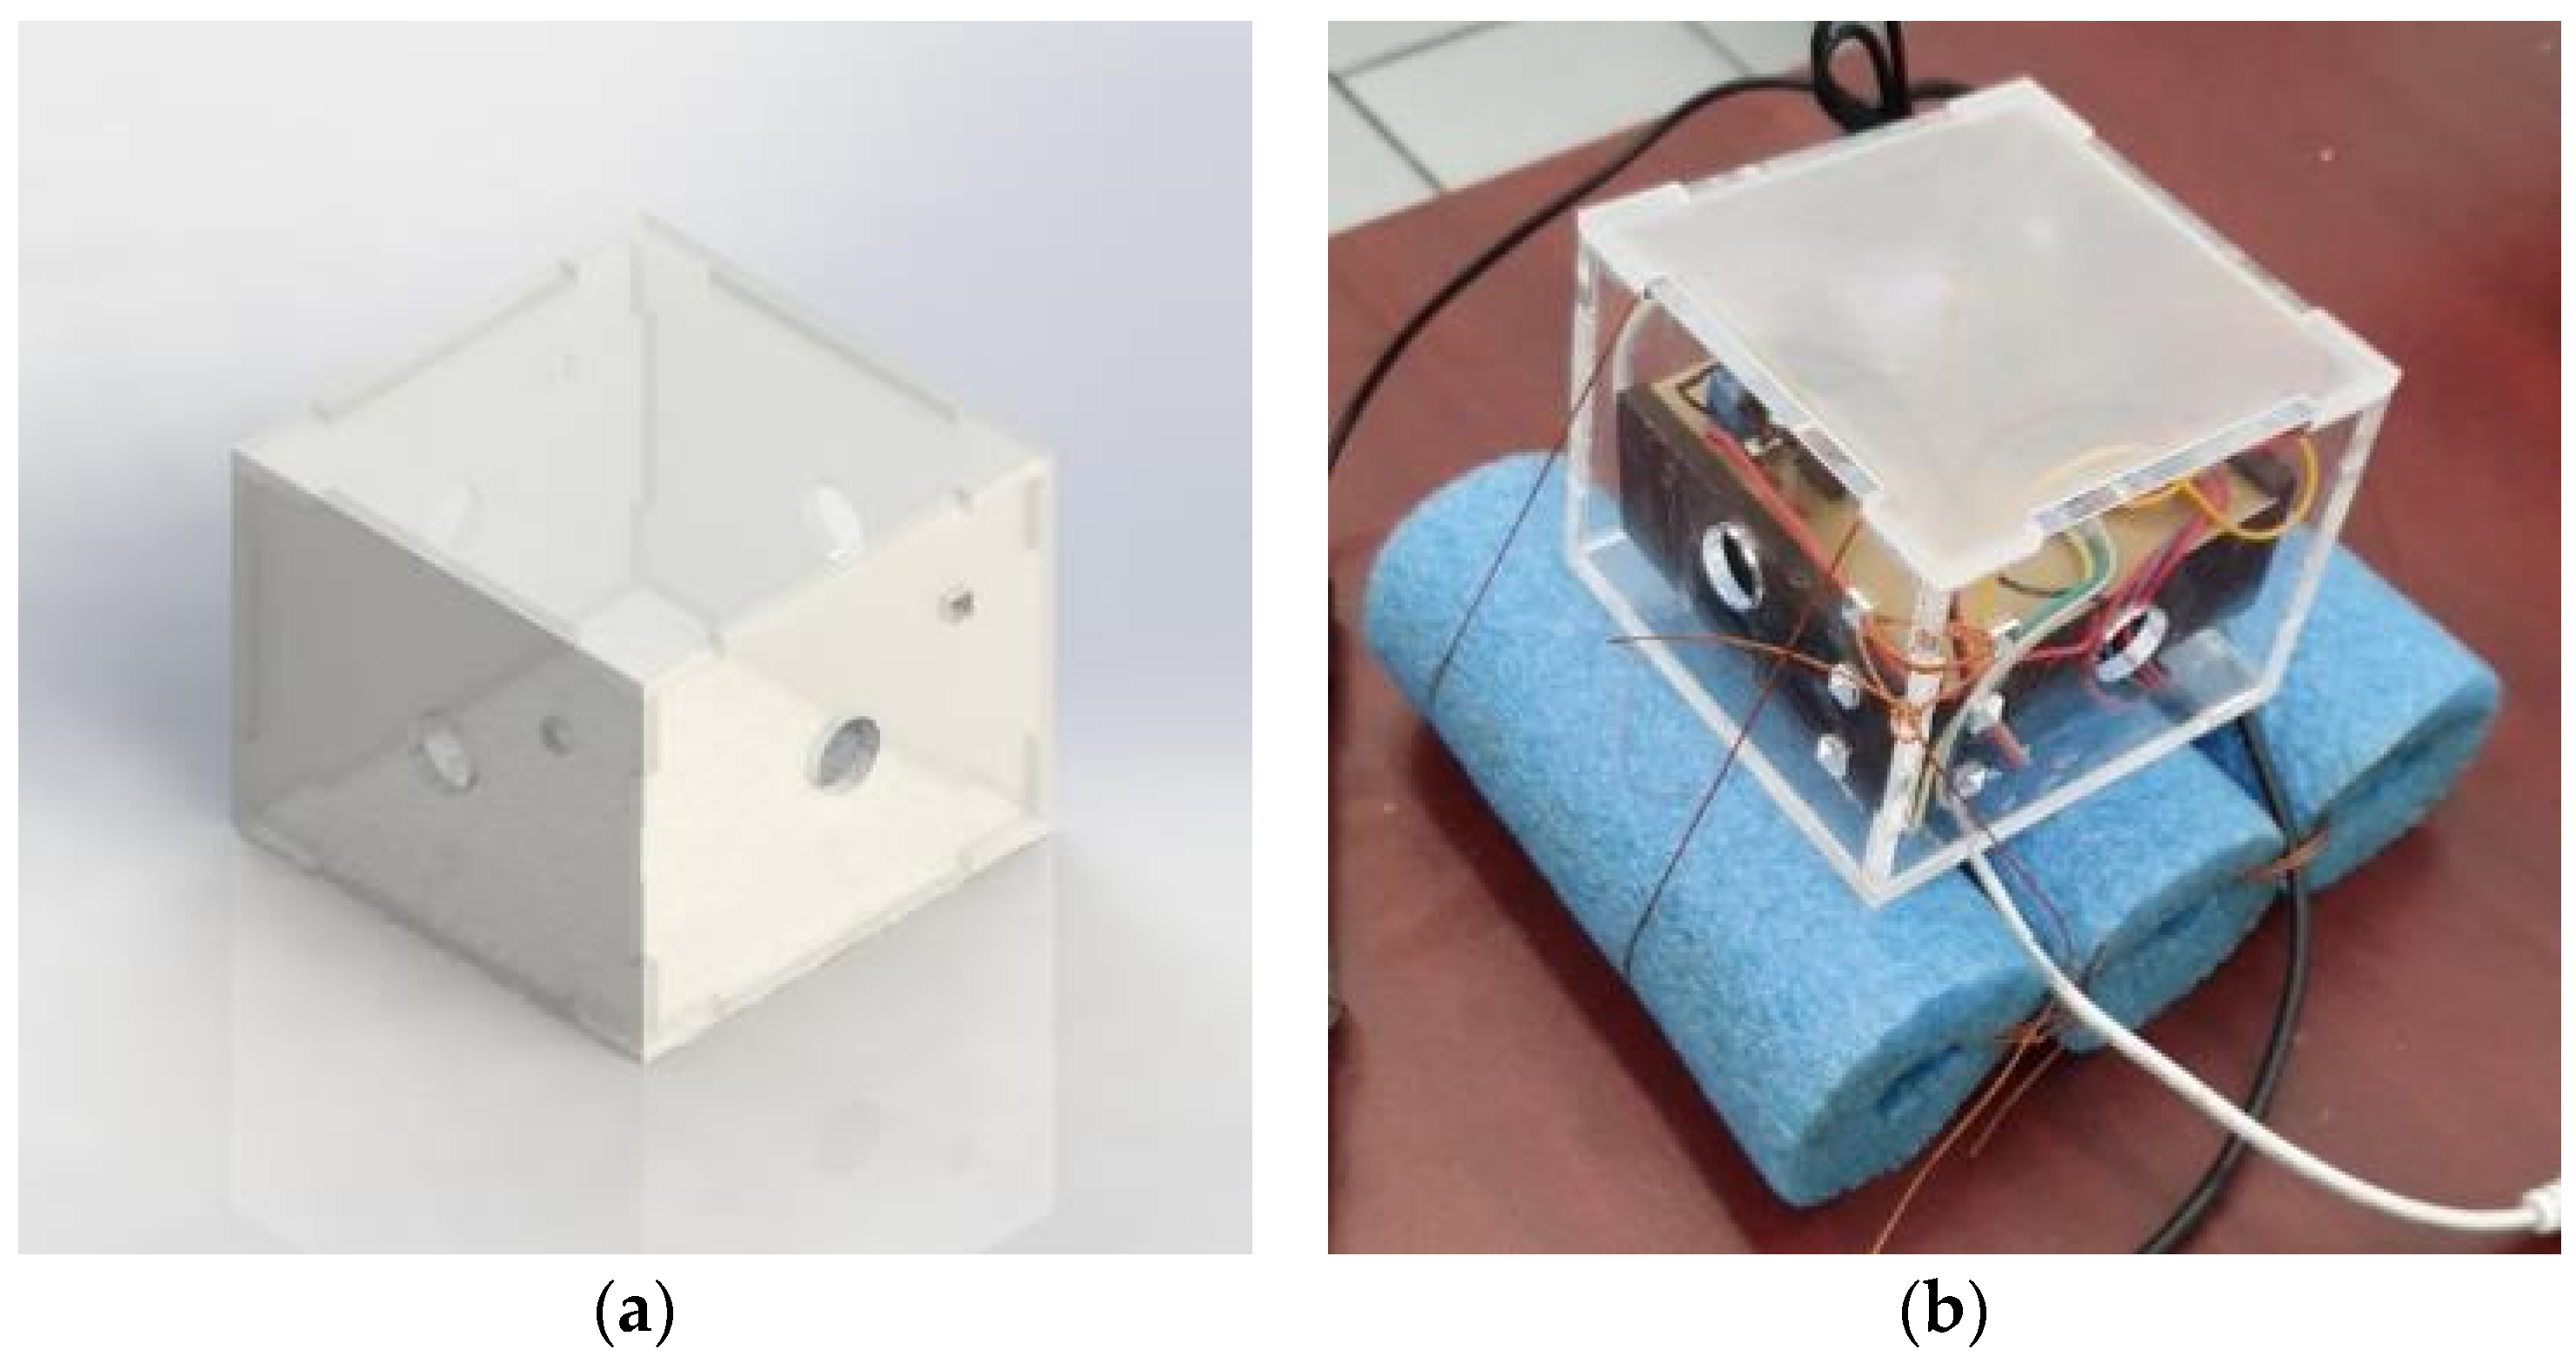
The prototype developed was a static node model, taking the form of a prism measuring 14 cm in width and length with a height of 10 cm. This compact design was engineered to house a microcontroller-based system and three selected sensors for pH, total dissolved solids, and temperature. Additionally, it incorporated a power bank consisting of two rechargeable 18,650 batteries, each with a voltage of 3.7 V. The CAD model of the assembled prism is presented in Figure 12a.
As shown in Figure 12a, the static terminal features slots on each of its lateral faces, designed to facilitate the reading of parameters using the selected sensors. Additionally, it includes extra square openings intended for the use of security ties, thereby securing each sensor to prevent excessive movement and disconnections from the system. The terminal was crafted using 4-mm thick acrylic, and after placing the developed system inside the prism, the cables of each sensor were secured, and both the prism and each hole were sealed. This effectively isolated the non-waterproof part of the system. Figure 12b displays the fully assembled static node outfitted with the water quality monitoring system.

2.5.2. Mobile Node CAD Model

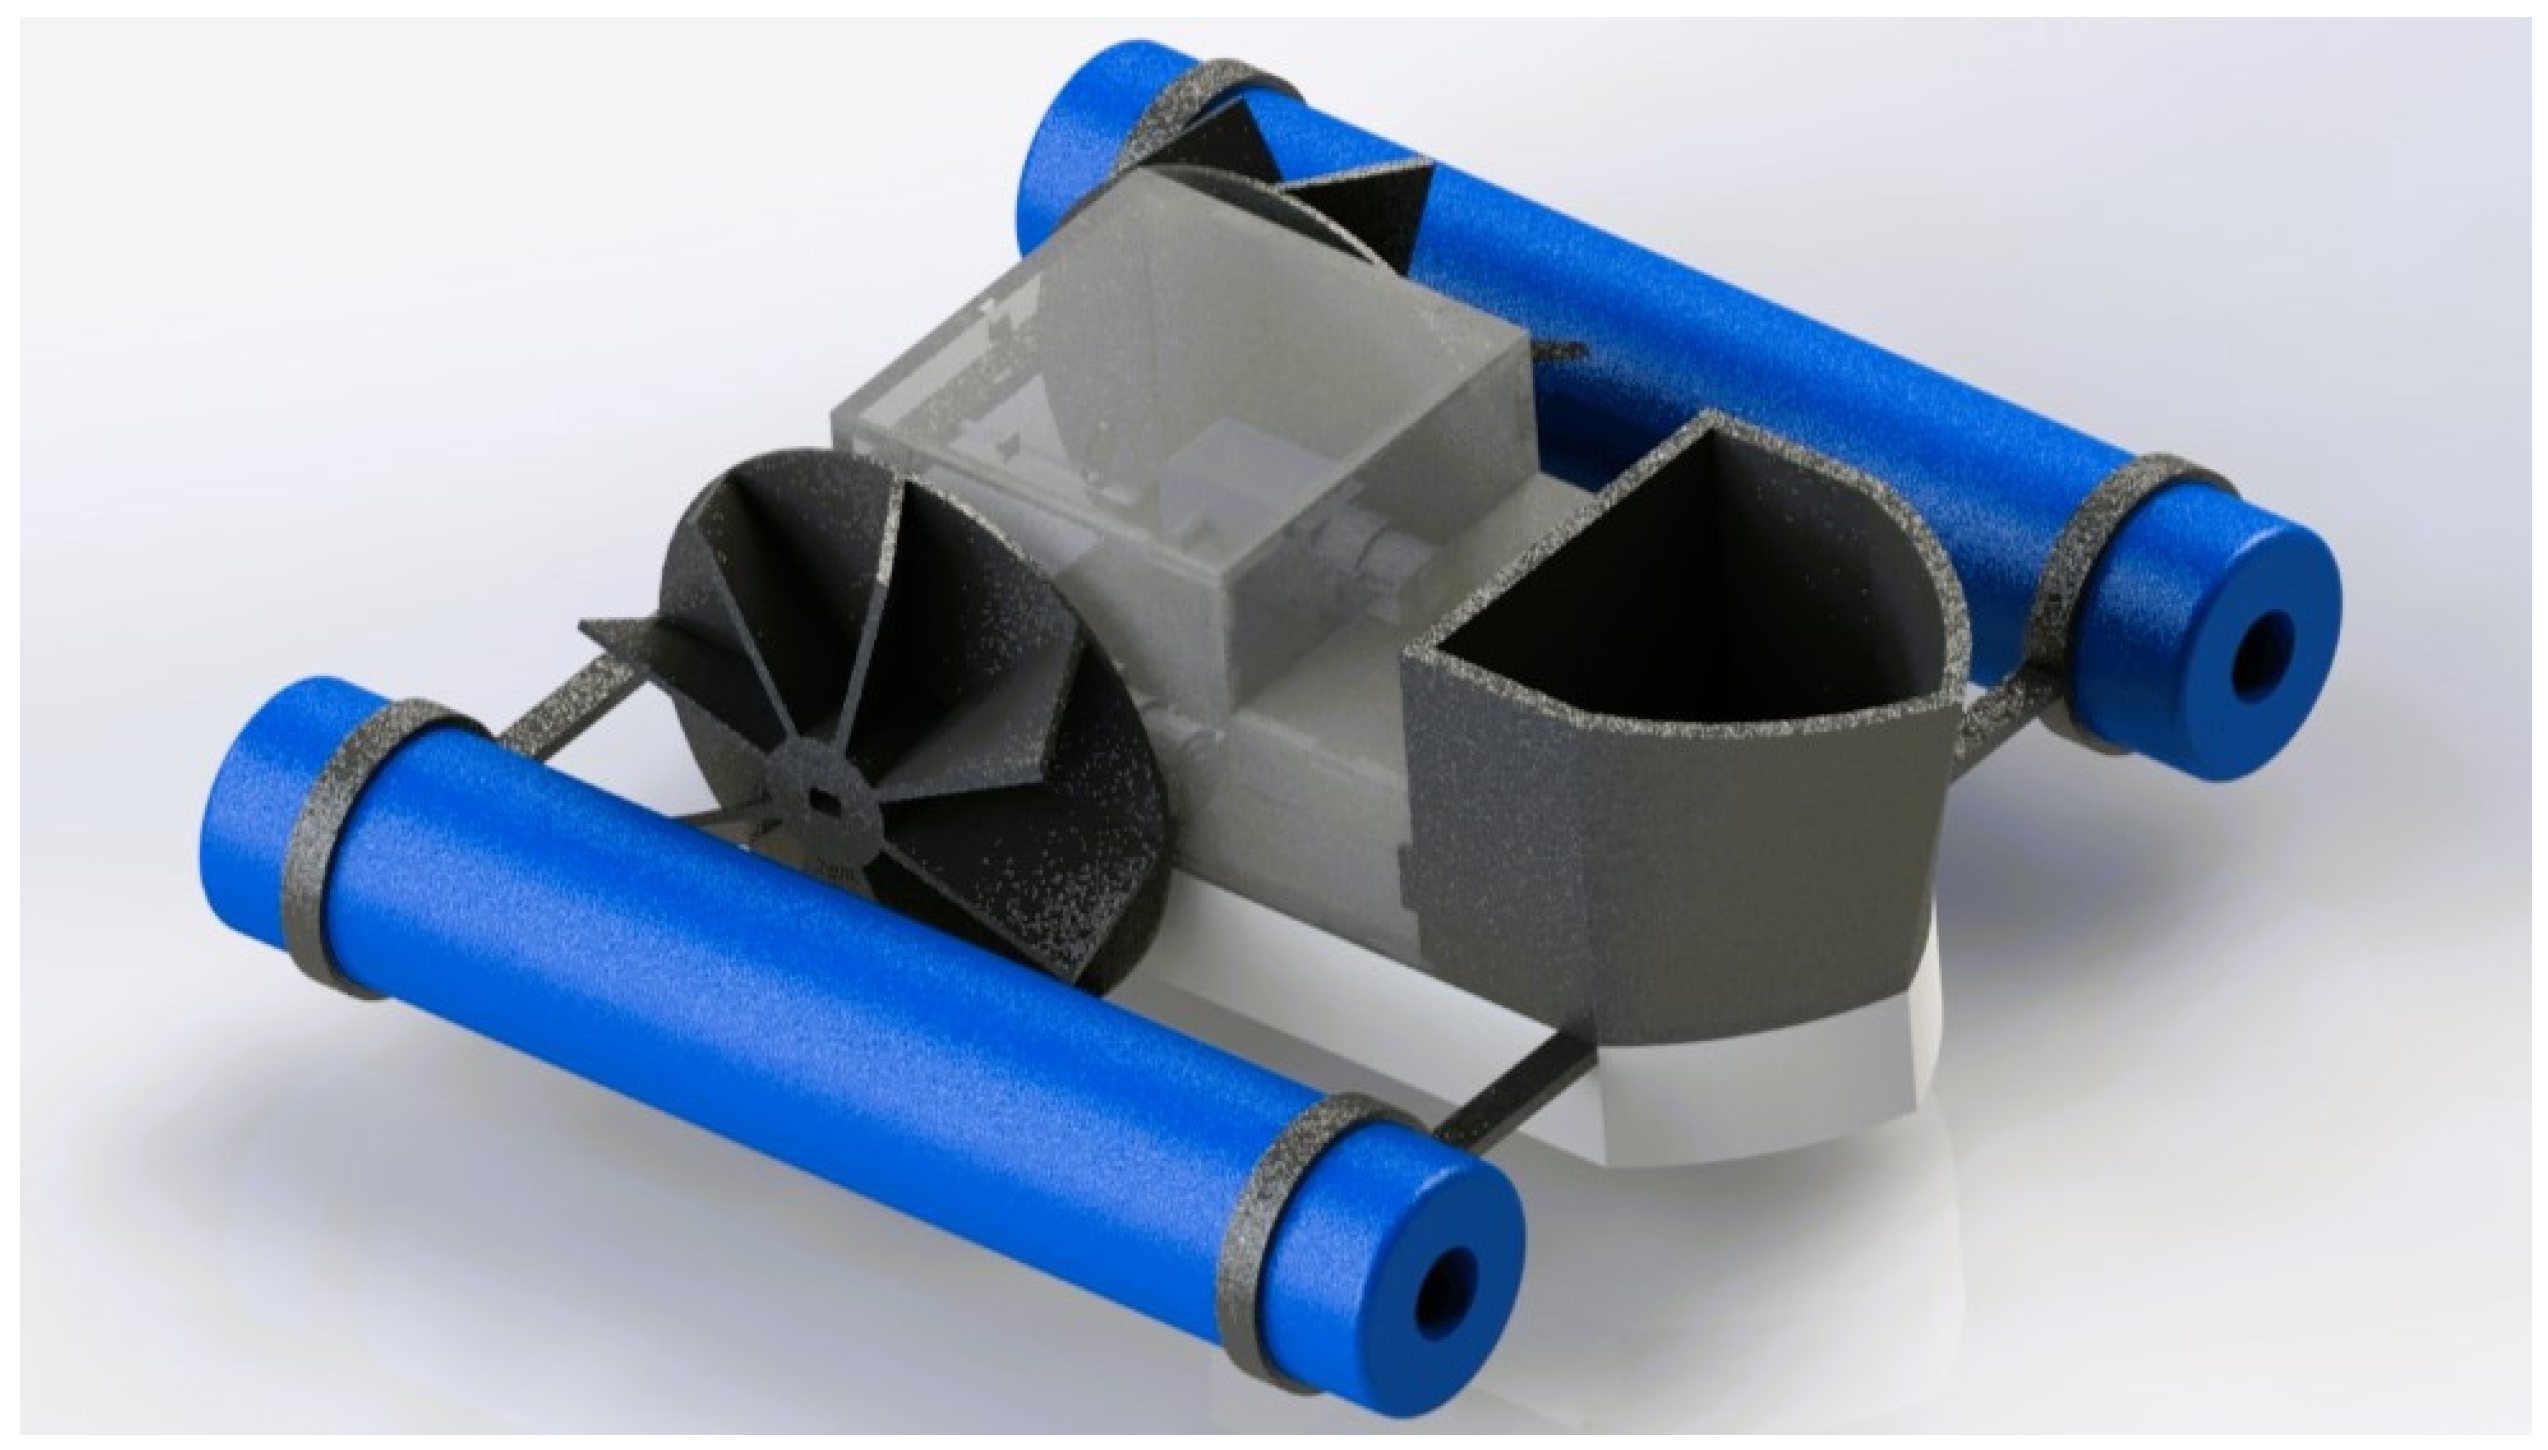
In this case, a thorough review of aquatic vehicles was conducted for the development of the mobile node prototype. This review led to the selection of specific models deemed suitable for the project, while others were discarded due to their lack of suitability. Following the preliminary model analysis, consideration was given regarding integrating the sensors and the accessibility of the actuators, ensuring they did not compromise the energy bank. This bank consists of two rechargeable 18,650 batteries, each providing 3.7 V. Consequently, the design chosen was inspired by an aquatic rover, which is detailed below in Figure 13. This rover design is expected to enhance the prototype’s functionality by ensuring efficient navigation and operation in aquatic environments, leveraging the selected sensors and actuators, all while being powered sustainably by the energy bank.
Figure 13 shows that the vehicle’s blades are angled at 35 degrees to enhance movement and significantly reduce water splashing. Furthermore, they feature a design that offers additional protection against dirt and water exposure. This feature is achieved by means of the inner wall of each blade, ensuring that the vehicle remains free from leaks from the engine conduit to the blades. This innovative approach improves the vehicle’s performance in wet conditions and contributes to its longevity by preventing potential water damage to critical components.

2.5.3. Electrical Schematic and PCB Layout

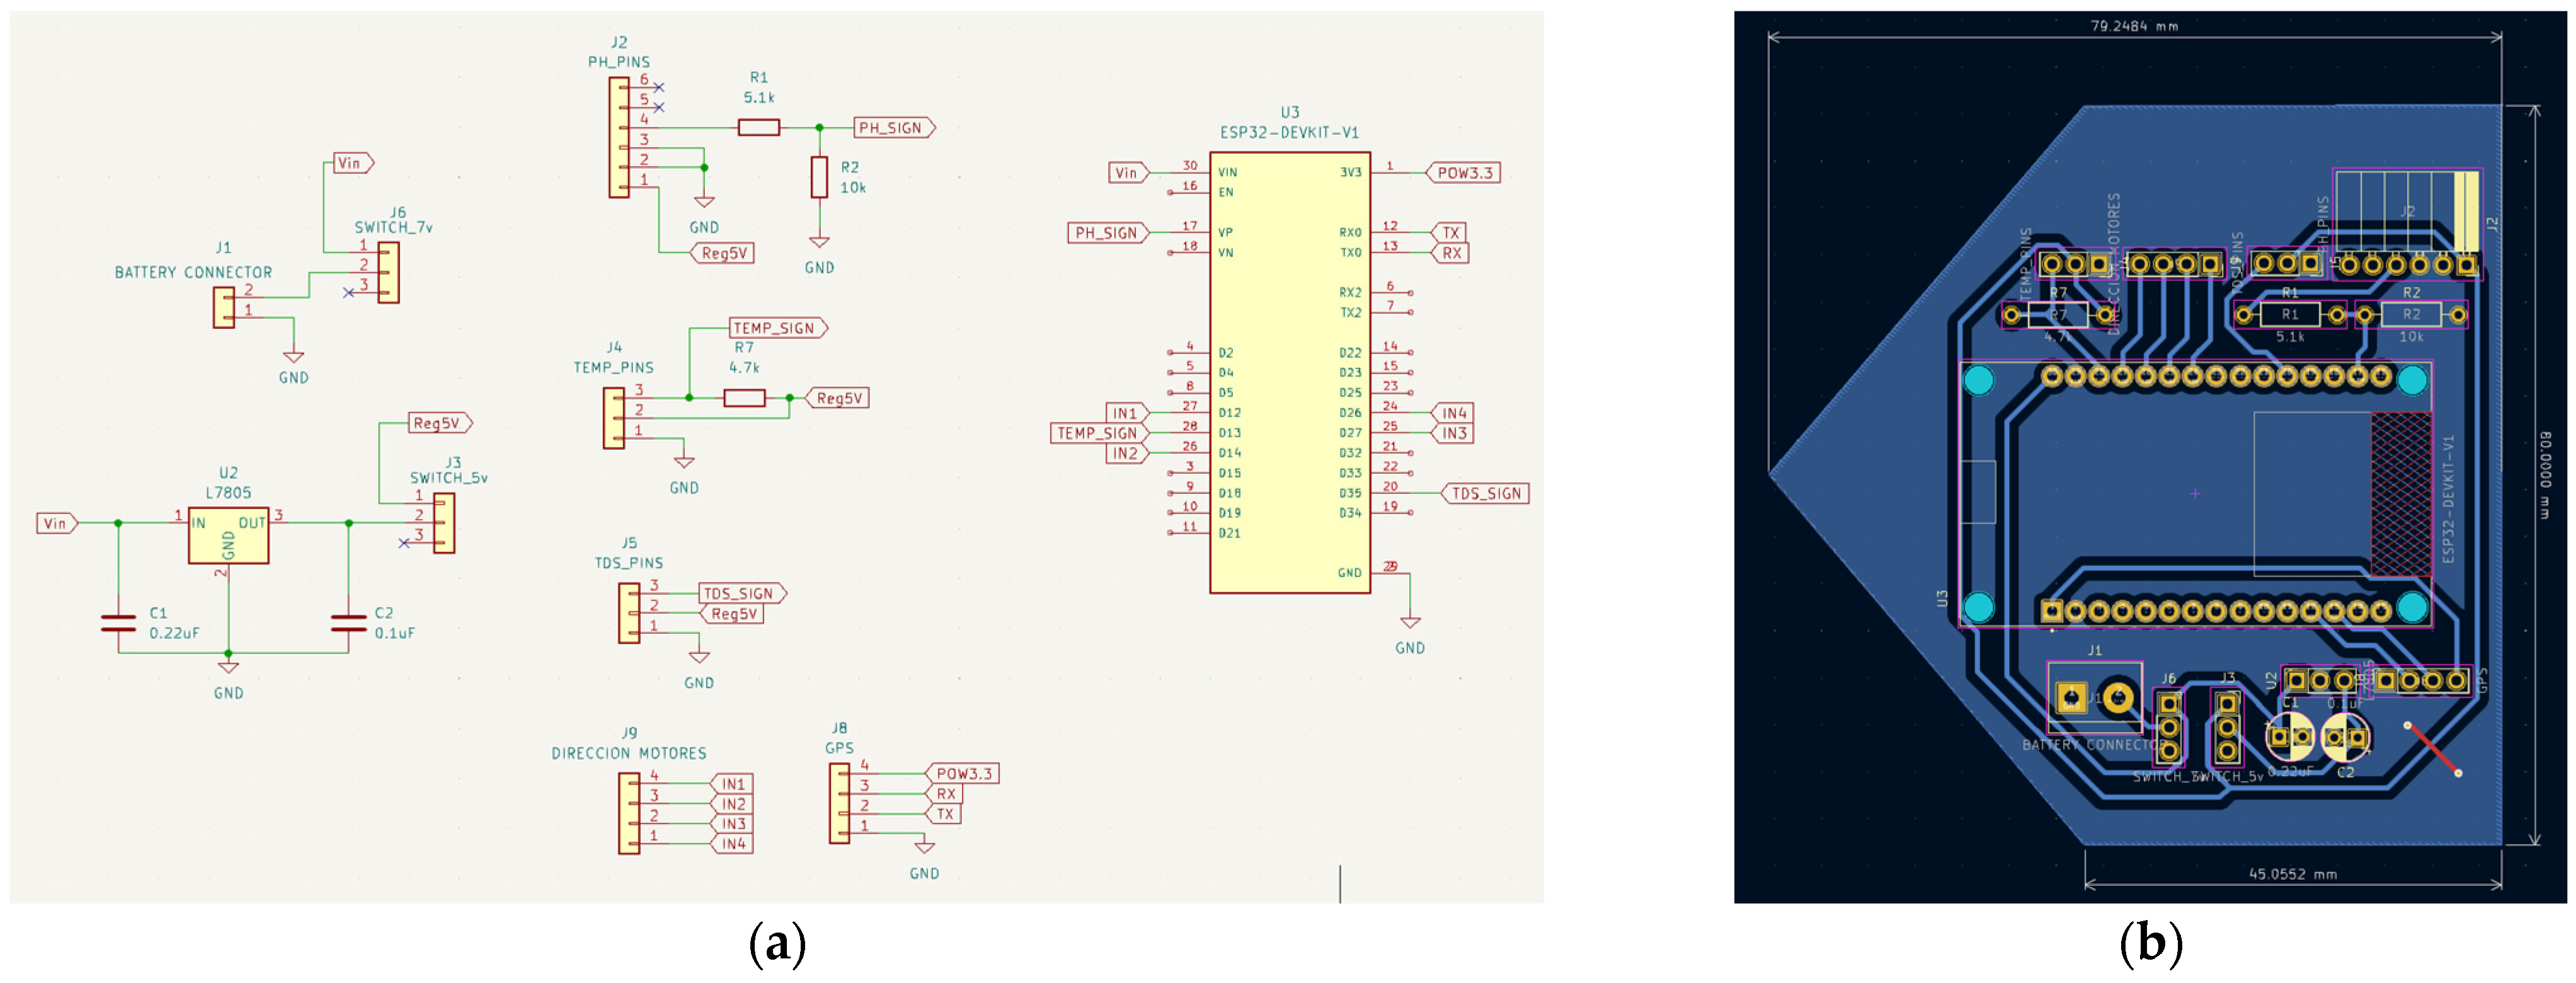
The electrical schematic of the developed system was meticulously crafted using KiKad 7.0 software, an open-source platform renowned for its high-performance schematic design and PCB layout capabilities. An L7805 voltage regulator was employed to provide the necessary voltage to the sensors without causing damage. Furthermore, a gain of 0.5 was implemented at the output of the pH sensor to ensure an appropriate signal for processing by the microcontroller. Figure 14a illustrates the schematic of the mobile node, detailing all the components used in the system, and in Figure 14b, its designed PCB layout is presented. At the core, the electrical scheme of the static node is identical to that of the mobile node. However, they differ because the mobile node includes components to connect actuators, which are absent in the static node.
Furthermore, concerning the printed circuit board (PCB) design, the static node features a rectangular shape, while the mobile node’s PCB is tailored to fit the bow of the constructed boat. This distinction in design and functionality reflects each node’s specific roles within a more extensive system, through the mobile node’s adaptability to movement and the static node’s stable configuration. Integrating these nodes within the system allows for a harmonious operation, ensuring each node performs optimally according to its designated function.

3. Implementation

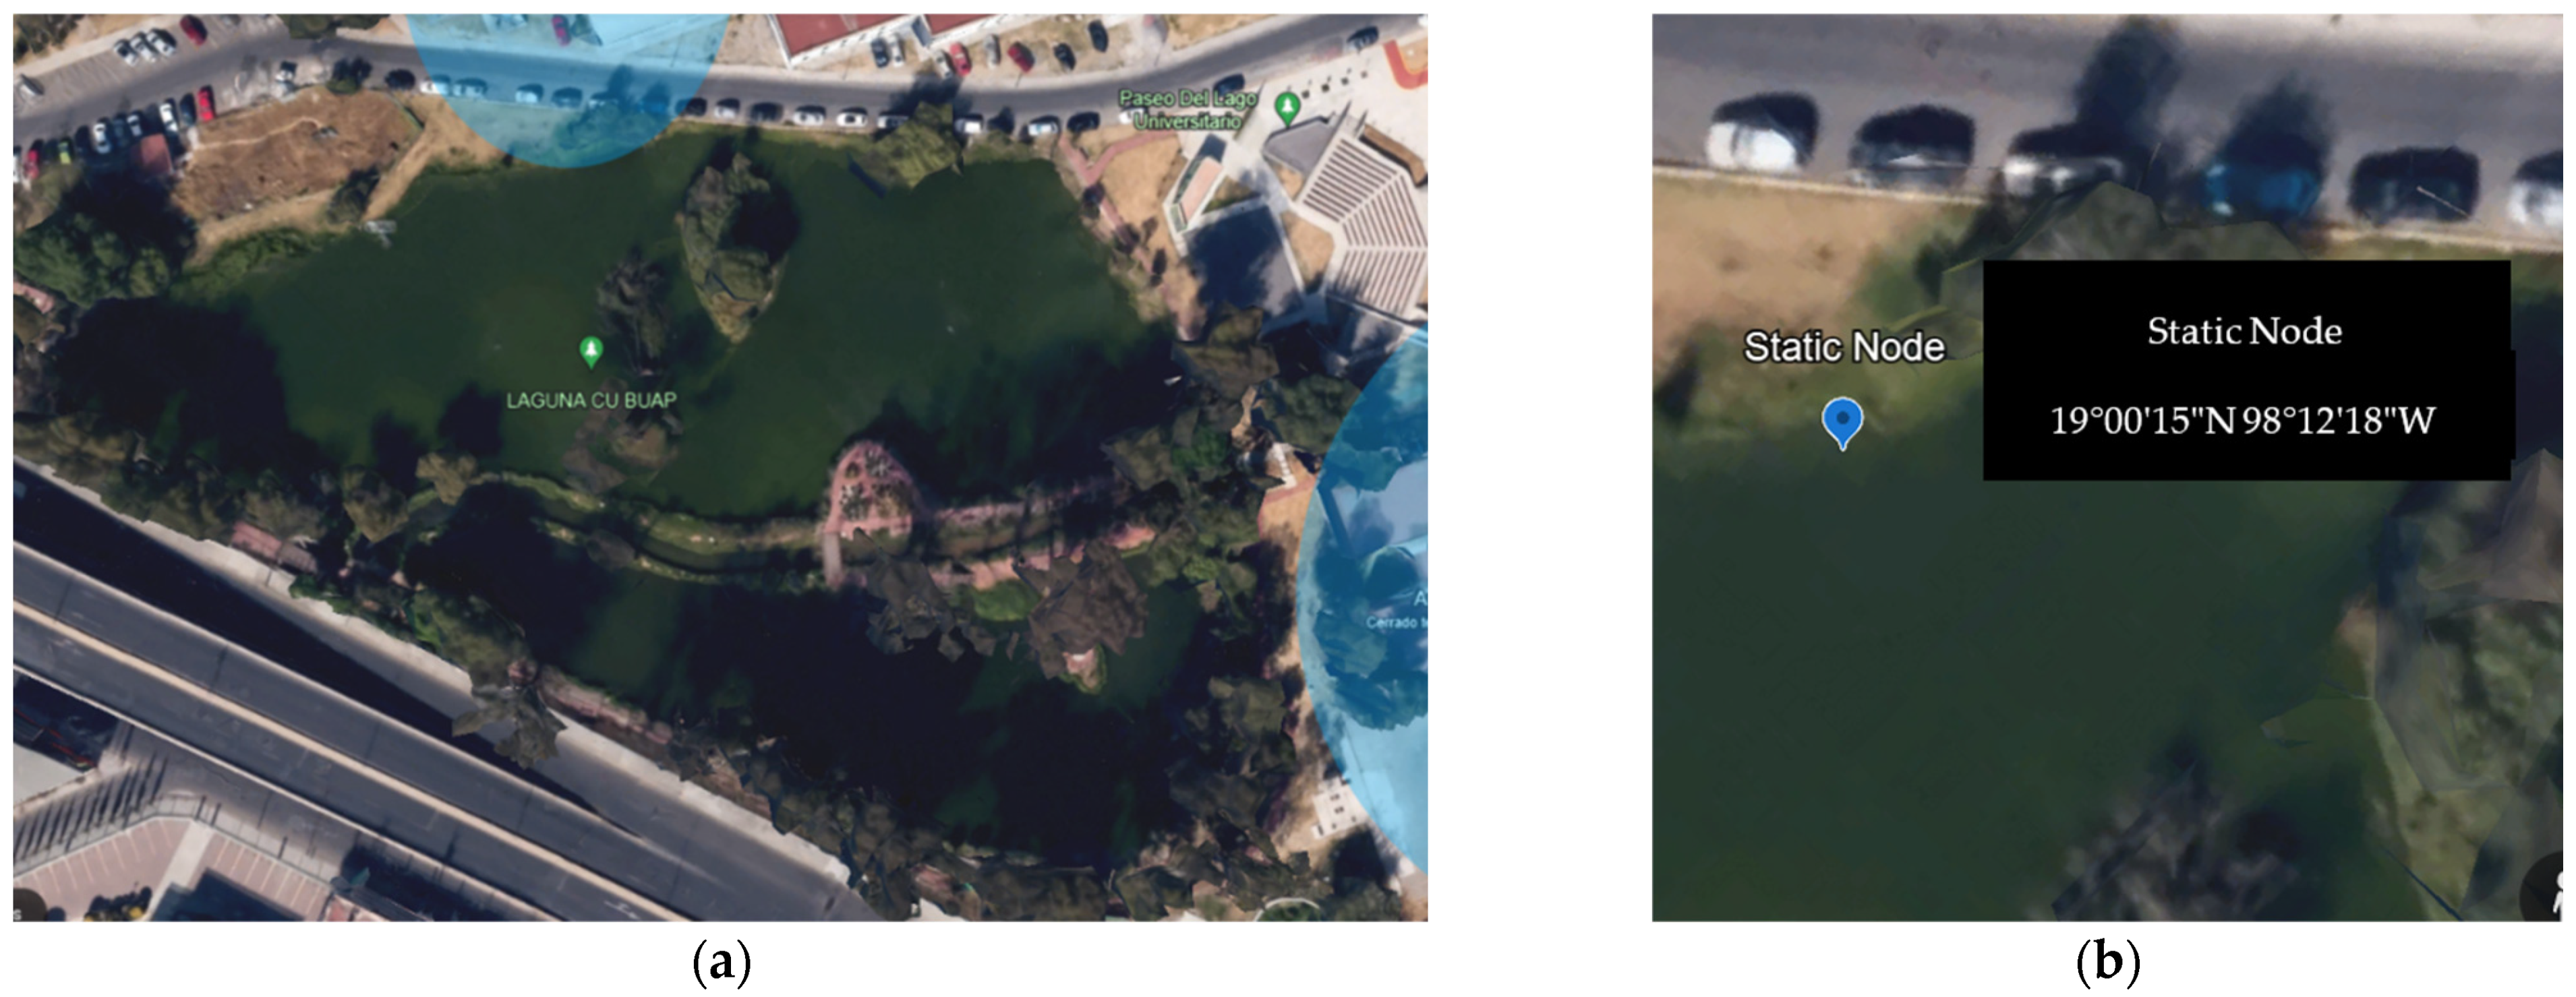
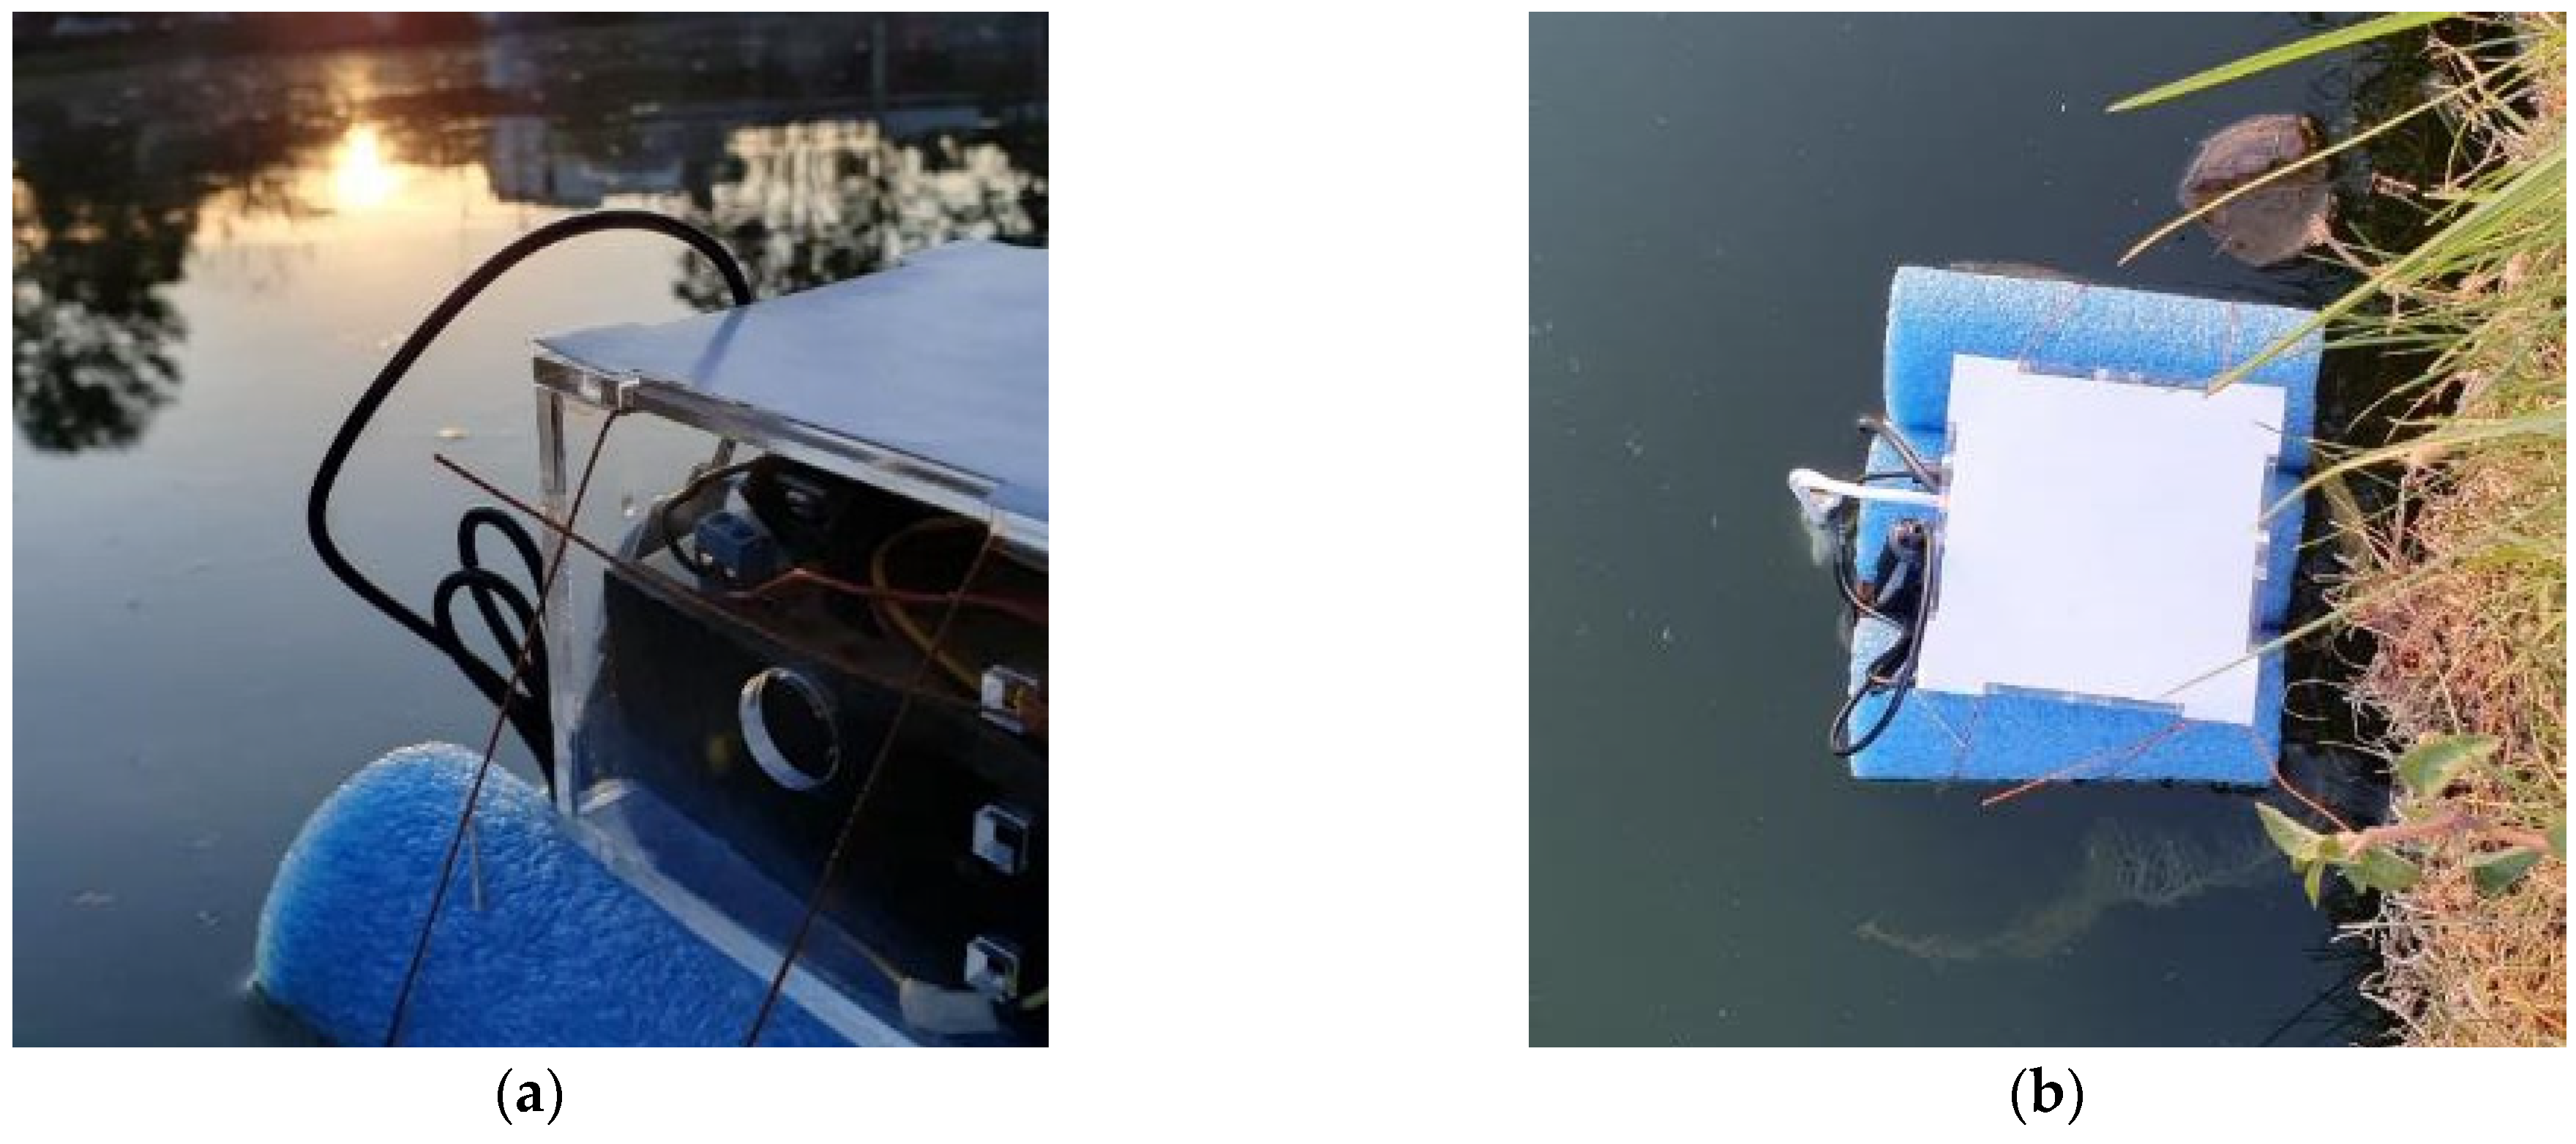
The proposed WSDN was implemented in a natural environment. It was deployed in a small lagoon on the CU-BUAP campus in Puebla, Mexico (Figure 15). Before installing the static node, an internet coverage check was imperative to ensure connectivity to the server hosted on a PC. The internet coverage map, depicted in Figure 15a, illustrates the extent of connectivity across the area, while Figure 15b pinpoints the approximate location where the static terminal was established. As can be seen, the coverage in the lagoon area, marked in blue, is sufficient for positioning the static node. This WiFi coverage allows for connecting with the interface using IoT technology. Furthermore, the performance of the mobile node is not compromised, as its connection to the fixed node is maintained without the need for both to be connected to the Internet. In Figure 15b, the coordinates obtained from Google Earth for the location of the fixed terminal can also be seen. Additionally, as mentioned earlier, Figure 16a,b display the fixed node at the coordinates.
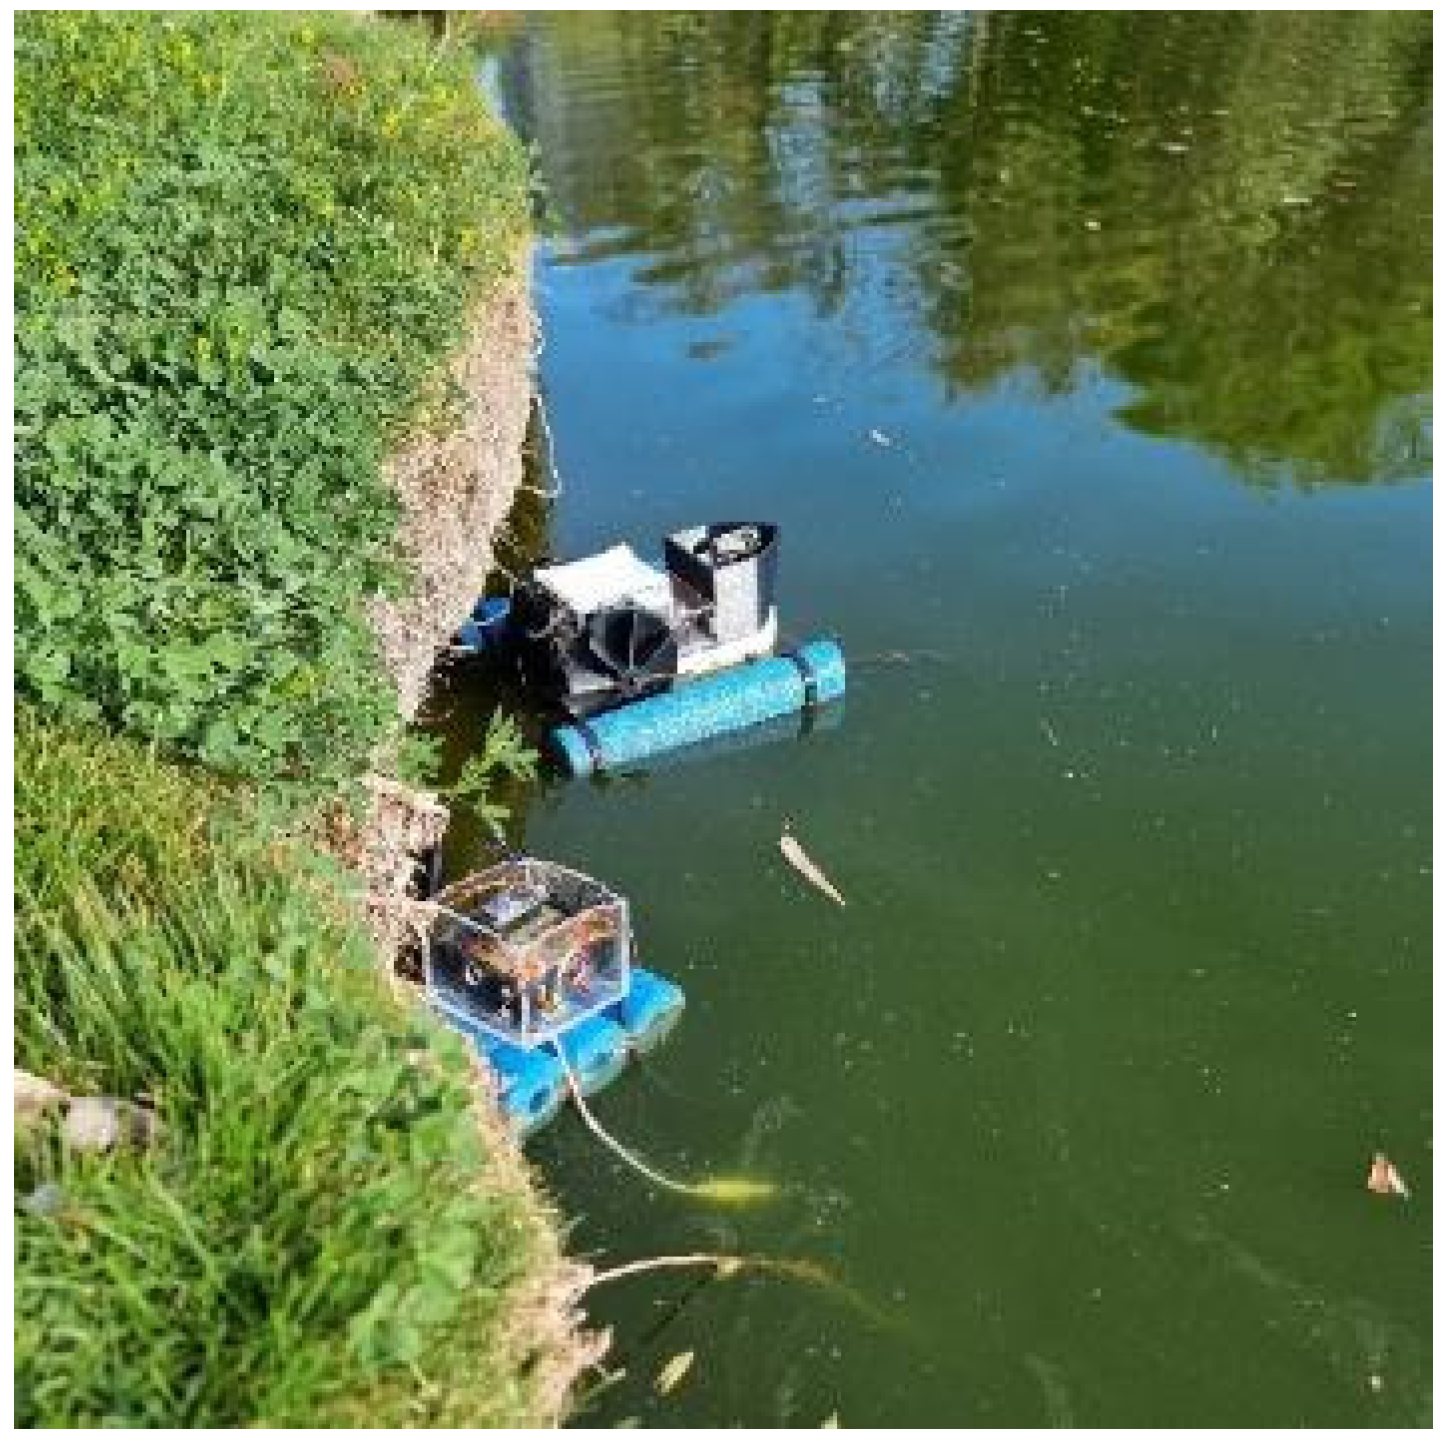
The next step involved utilizing the Internet of Things (IoT) to connect the fixed node to the graphical interface. This process is developed in the sections titled Communication Channel on OPC Servers and Data Management. Once communication was established, the designed vehicle was placed in the body of water; the device was powered on, and its connection to the other node was verified, thanks to LED indicators integrated into both systems. Figure 17 illustrates the vehicle and the fixed node prepared for operation.
Once communication was established between each of the nodes, the graphical interface was initiated, and the remote desktop application was utilized on a smartphone. This setup allowed for the visualization of water parameter behaviors and control of the vehicle’s movement. This method was chosen because it offers greater independence for real-time monitoring. Additionally, during the execution of the remote desktop, other phone functions can be used, such as the camera, which enhances the overall functionality and user experience.
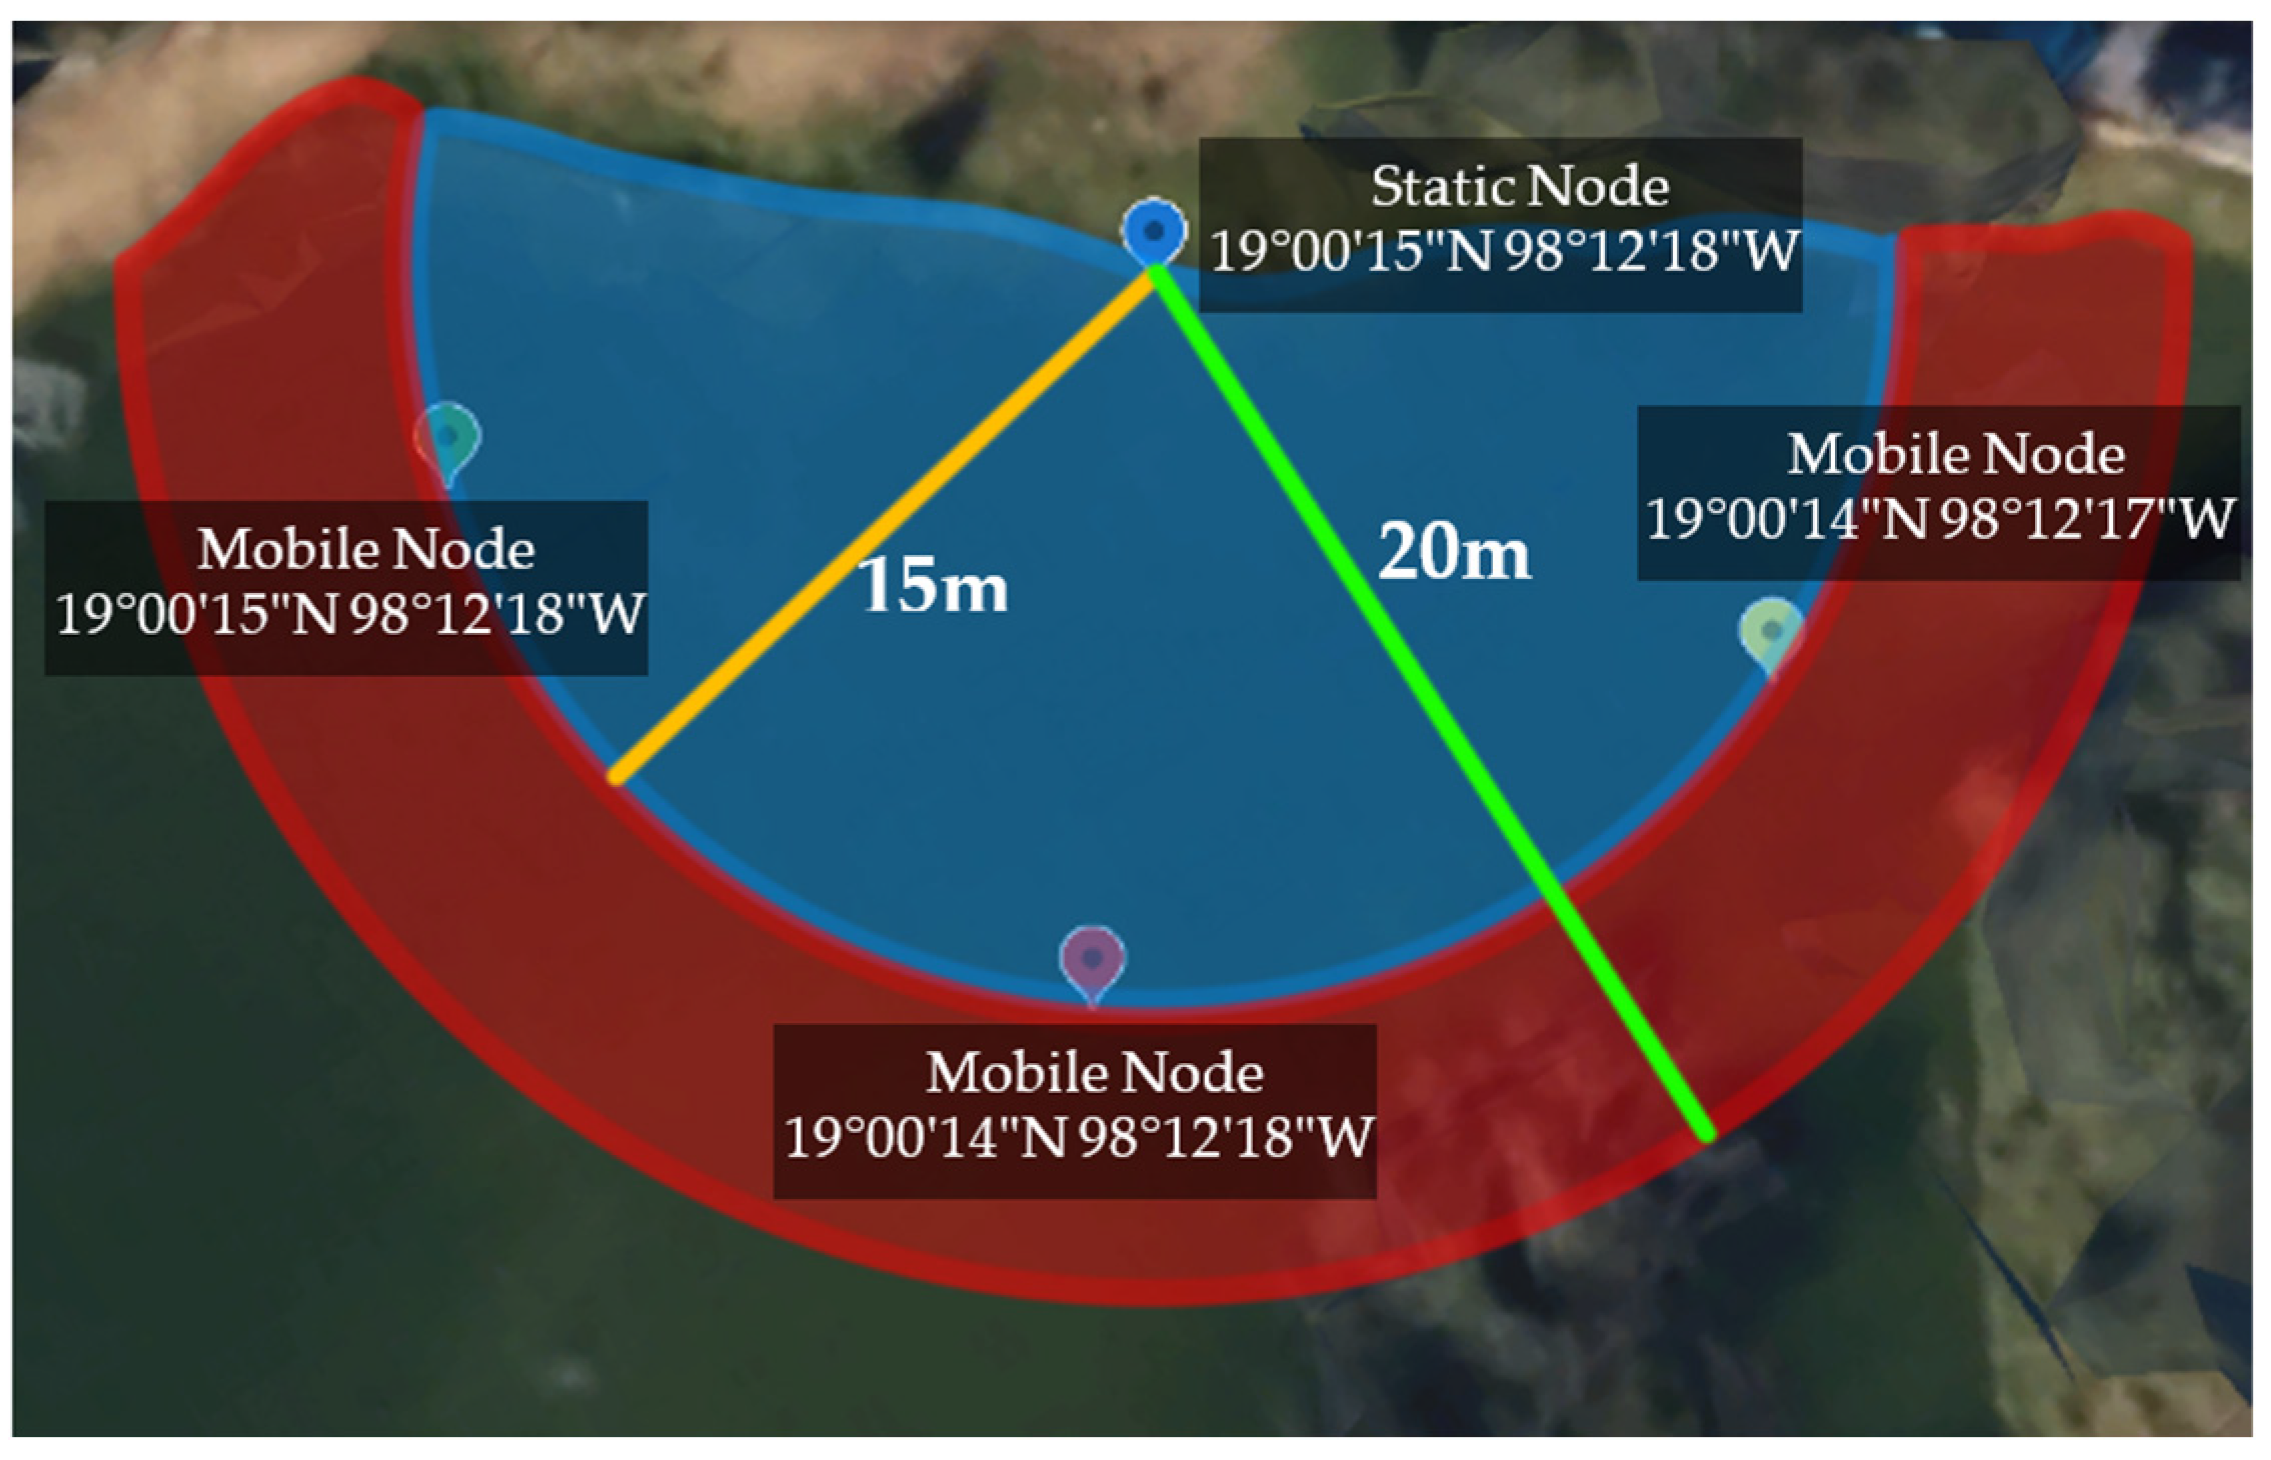
The mobile node was activated once the wireless dynamic sensor network (WDSN) communication was verified. This was achieved through the graphical interface, and with a drone’s and Google Earth’s assistance, its position was determined. Figure 18 illustrates the optimal coverage area, considering the network sizing that had been previously carried out. This process highlights the integration of various technologies to ensure precise monitoring and control within the network’s designated area.
Figure 18 illustrates two distinct zones: the blue zone, indicating good signal quality, as denoted by the RSSI, and the red zone, where the signal strength is poor. This delineation confirms that the network range is appropriate, providing an optimal coverage area with a radius of 15 m for peak performance and extending up to a 20-m radius where performance diminishes, characterized by data loss and connection issues. Furthermore, the figure highlights the three primary locations of the mobile node deployment, along with their approximate coordinates.
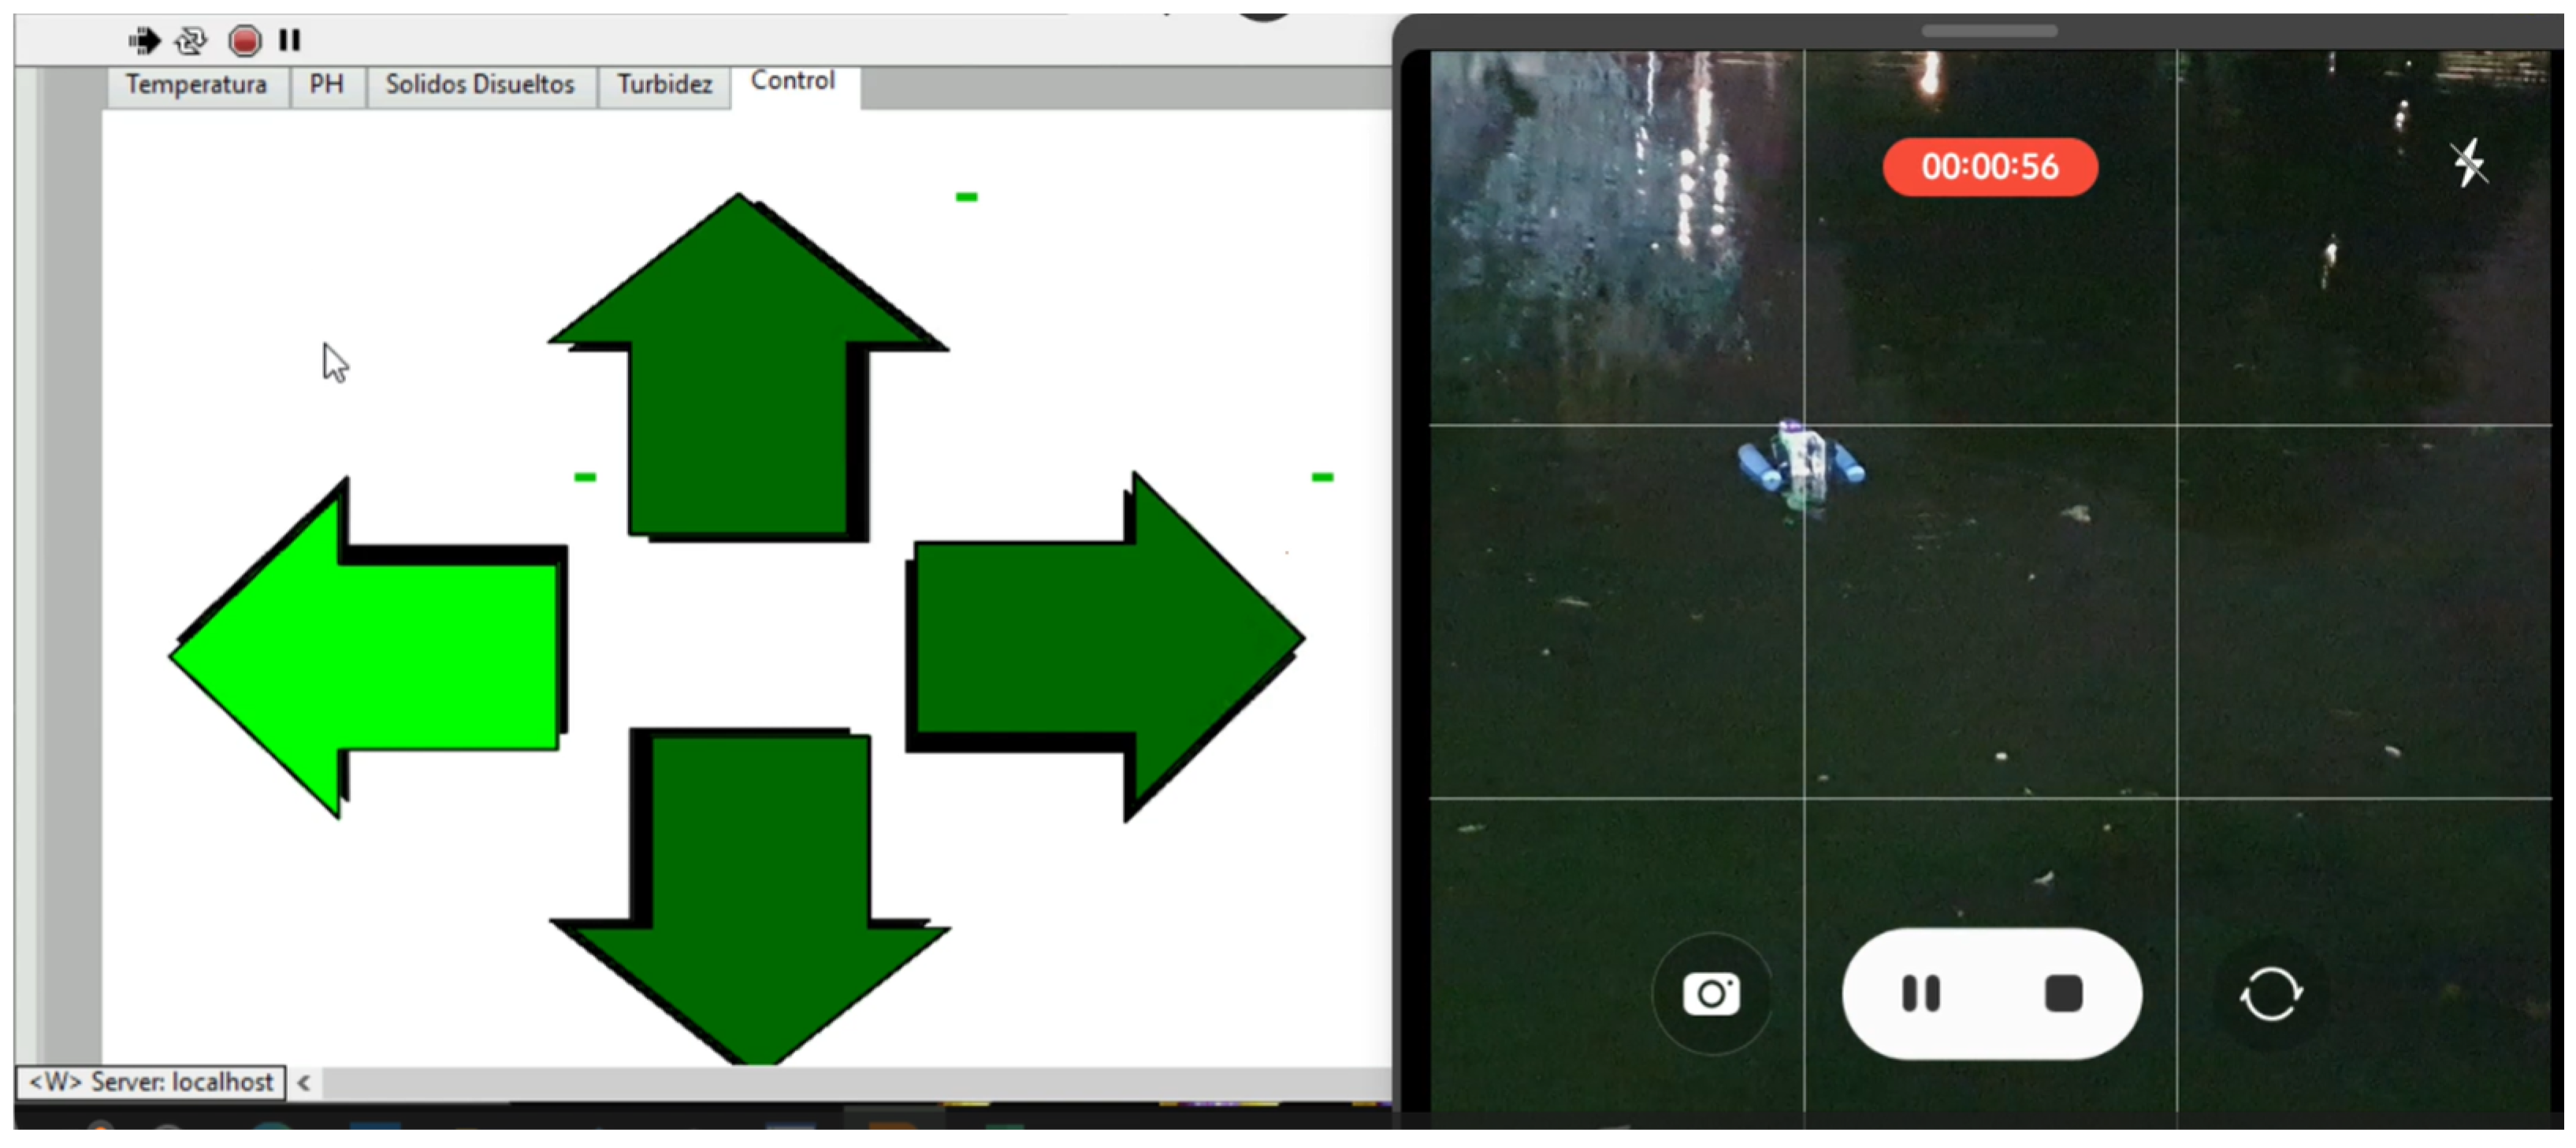
The sampling procedure was as follows: initially, the graphical interface controls were used to position the mobile node at the point of interest. Once the desired position was achieved, the actuators were halted, and the button to commence monitoring both nodes was pressed. After the desired duration had elapsed, the directional control was employed again to move the mobile node to the next point and repeat the process as necessary. Figure 19 illustrates a screenshot taken from the smartphone, which controls the vehicle while the camera is active.

4. Results and Discussion

In order to assess the network’s performance, samples were collected over a five-day period. During this time, consistent conditions were maintained, meaning similar points of interest were monitored simultaneously each day. The monitoring time intervals were capped at five minutes, indicating that measurements were taken simultaneously between the mobile and static nodes within this timeframe. Furthermore, specialized instruments were employed to obtain a reference.
During the five-day monitoring period, two data sets were selected for analysis; the one presented as follows to the set that gathered information from two points of interest, identified as P2 on the map in Figure 18, and the static node, on 29 February, 4 and 5 March. Thanks to the database generated throughout the monitoring process, figures were obtained. These figures display various parameters with curves representing each node for every day, charted during the same hours. This visual representation compares the nodes’ performance and behavior over the selected days, providing valuable insights into the monitored phenomena. The curves obtained are represented in Figure 20, Figure 21, Figure 22 and Figure 23.
Figure 20 illustrates that on 29 February, the mobile and static nodes recorded 20.91 °C and 20.8 °C, respectively, with variations not exceeding 0.3 °C. Conversely, the temperature curves for March 4th show both nodes’ readings closely overlapping, averaging 21.64 °C and 21.57 °C. The most significant variation occurred on March 5th, not exceeding 0.5 °C. These observations suggest that, following Oliveira et al. [46], the temperature of a body of water remains relatively stable, with significant fluctuations only over extended periods. This stability is crucial for the aquatic ecosystem, as abrupt temperature changes can affect biological processes.
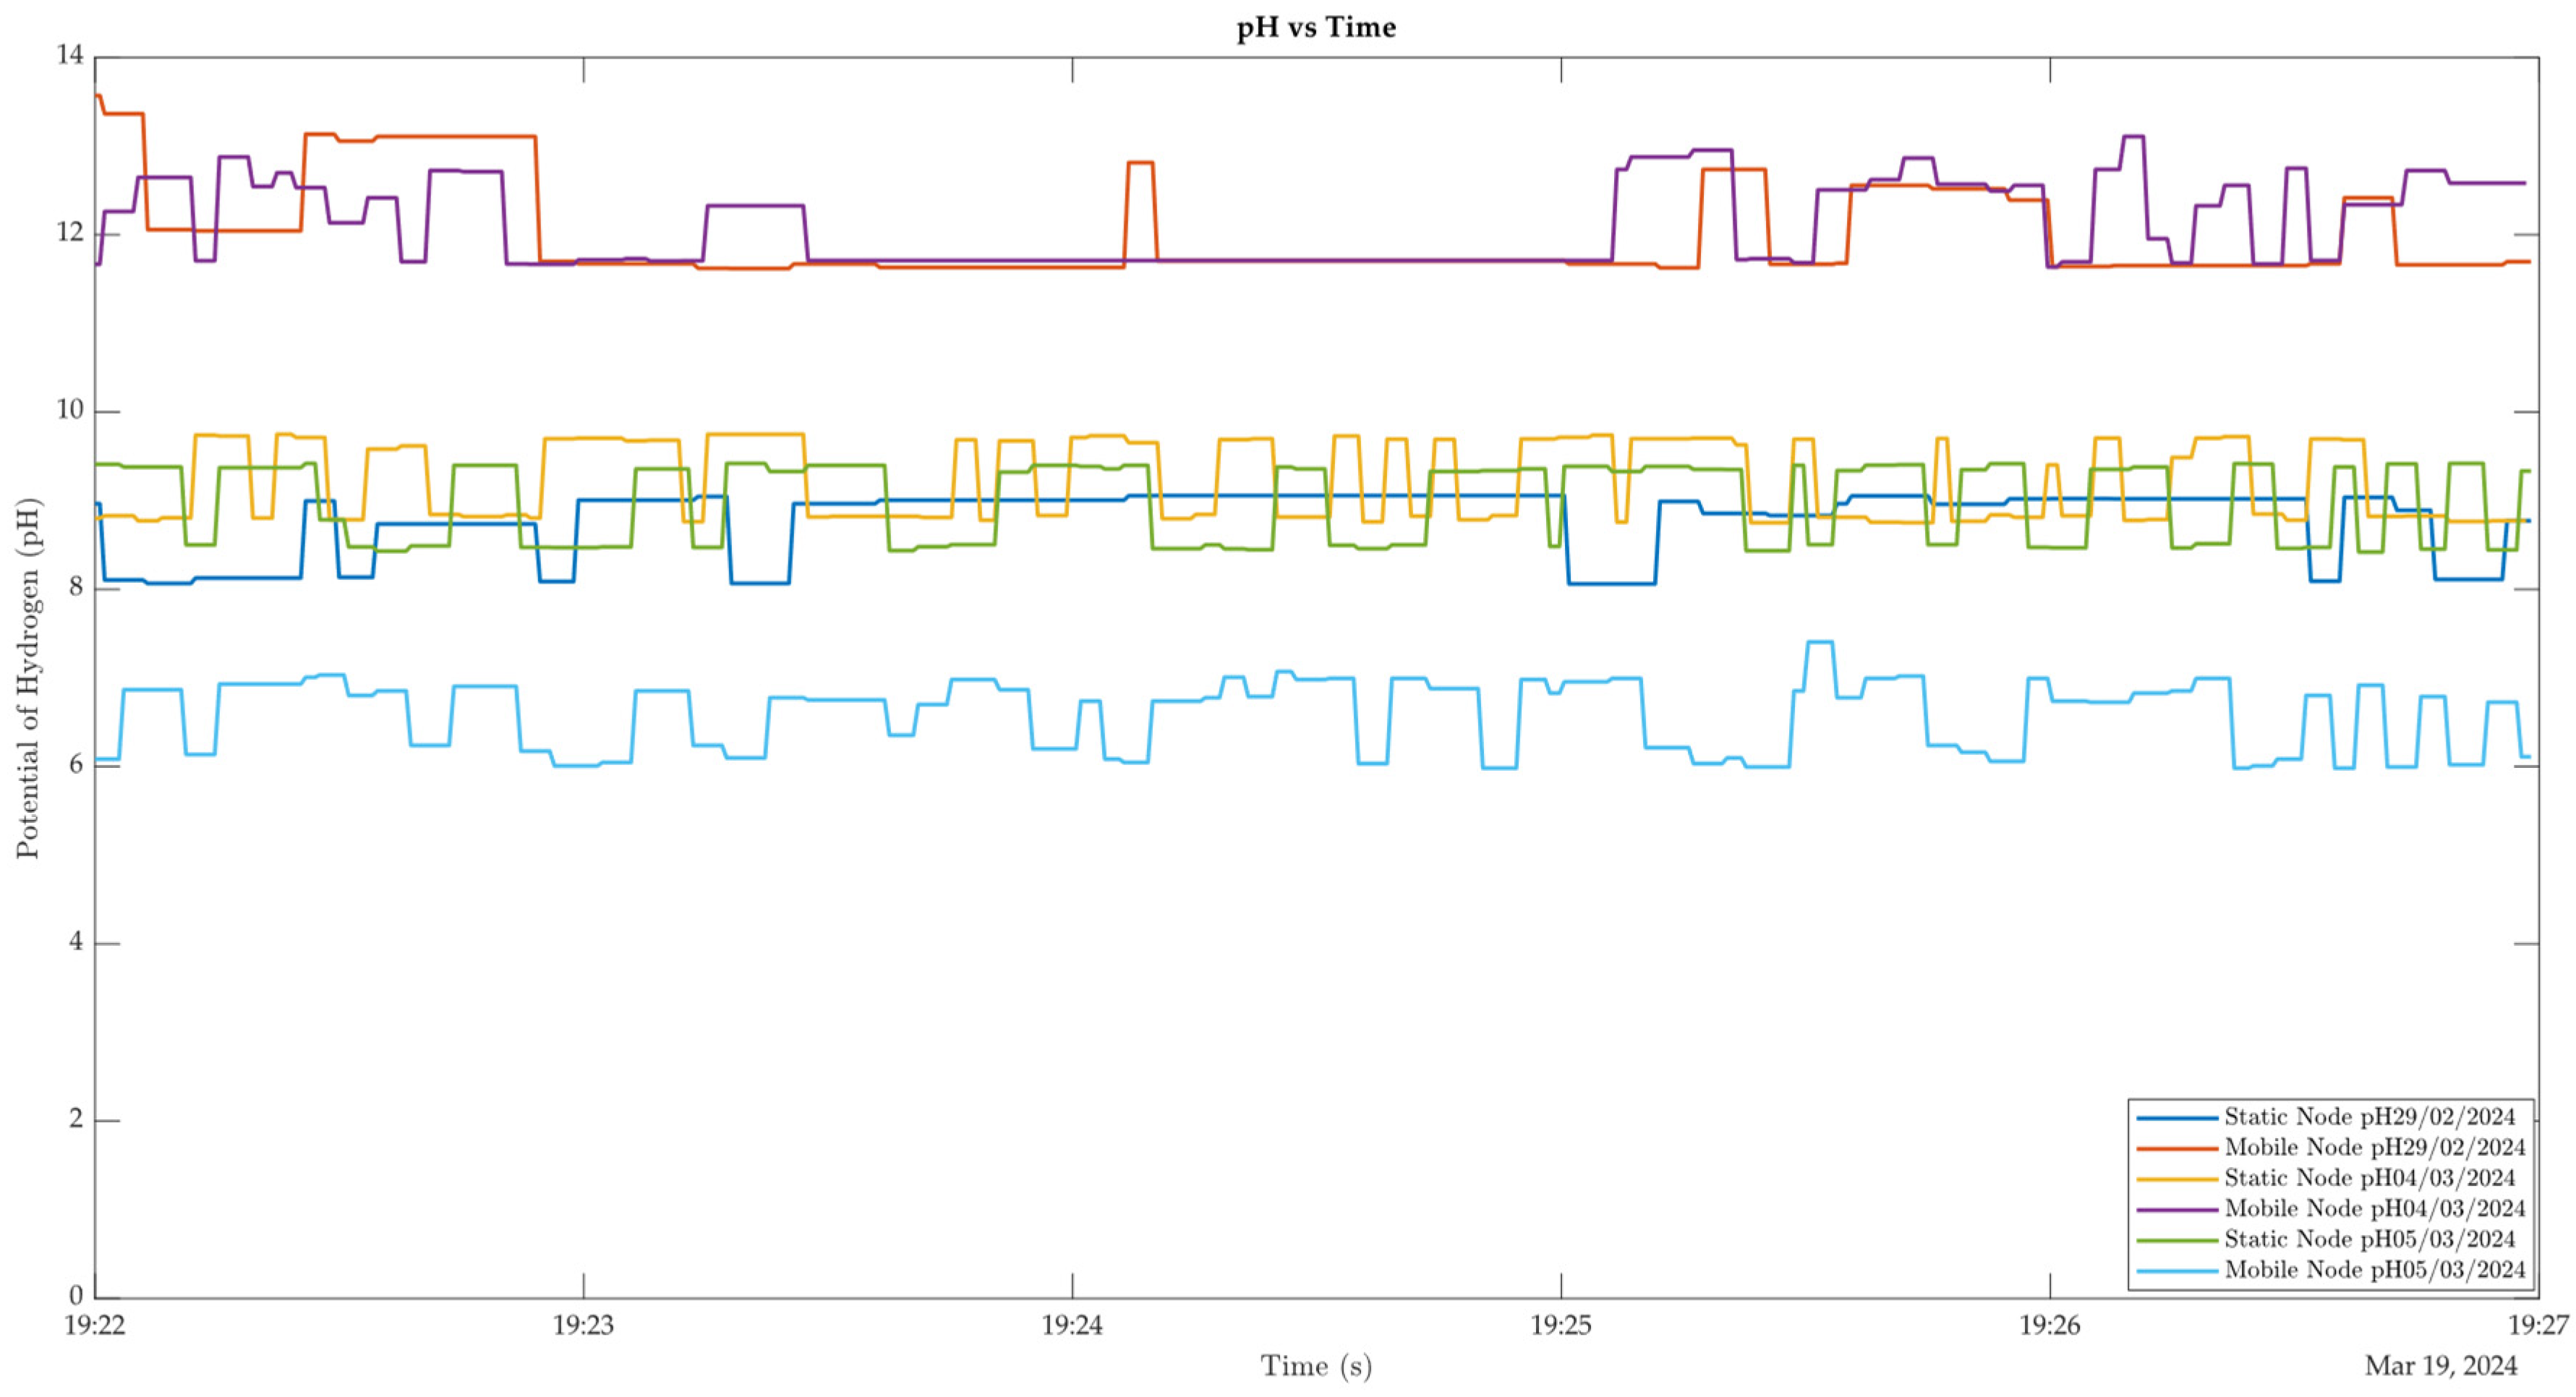
As depicted in Figure 21, the pH records exhibit a consistent trend with respect to the static node. Over the three days of sampling, the individual curves did not fluctuate beyond one pH level; collectively, they did not exceed a two-level variation, establishing an overall pH trend of 9. In contrast, significant variations were observed with the mobile node. The February 29th and March 5th readings were similar, indicating a pH between 12 and 13. However, on March 4th, the recorded potential was neutral, with an average of 6.5. These findings suggest that while the static node provides a stable pH measurement, the mobile node is subject to more pronounced fluctuations, which could be attributed to its varying locations and the environmental conditions it encounters.
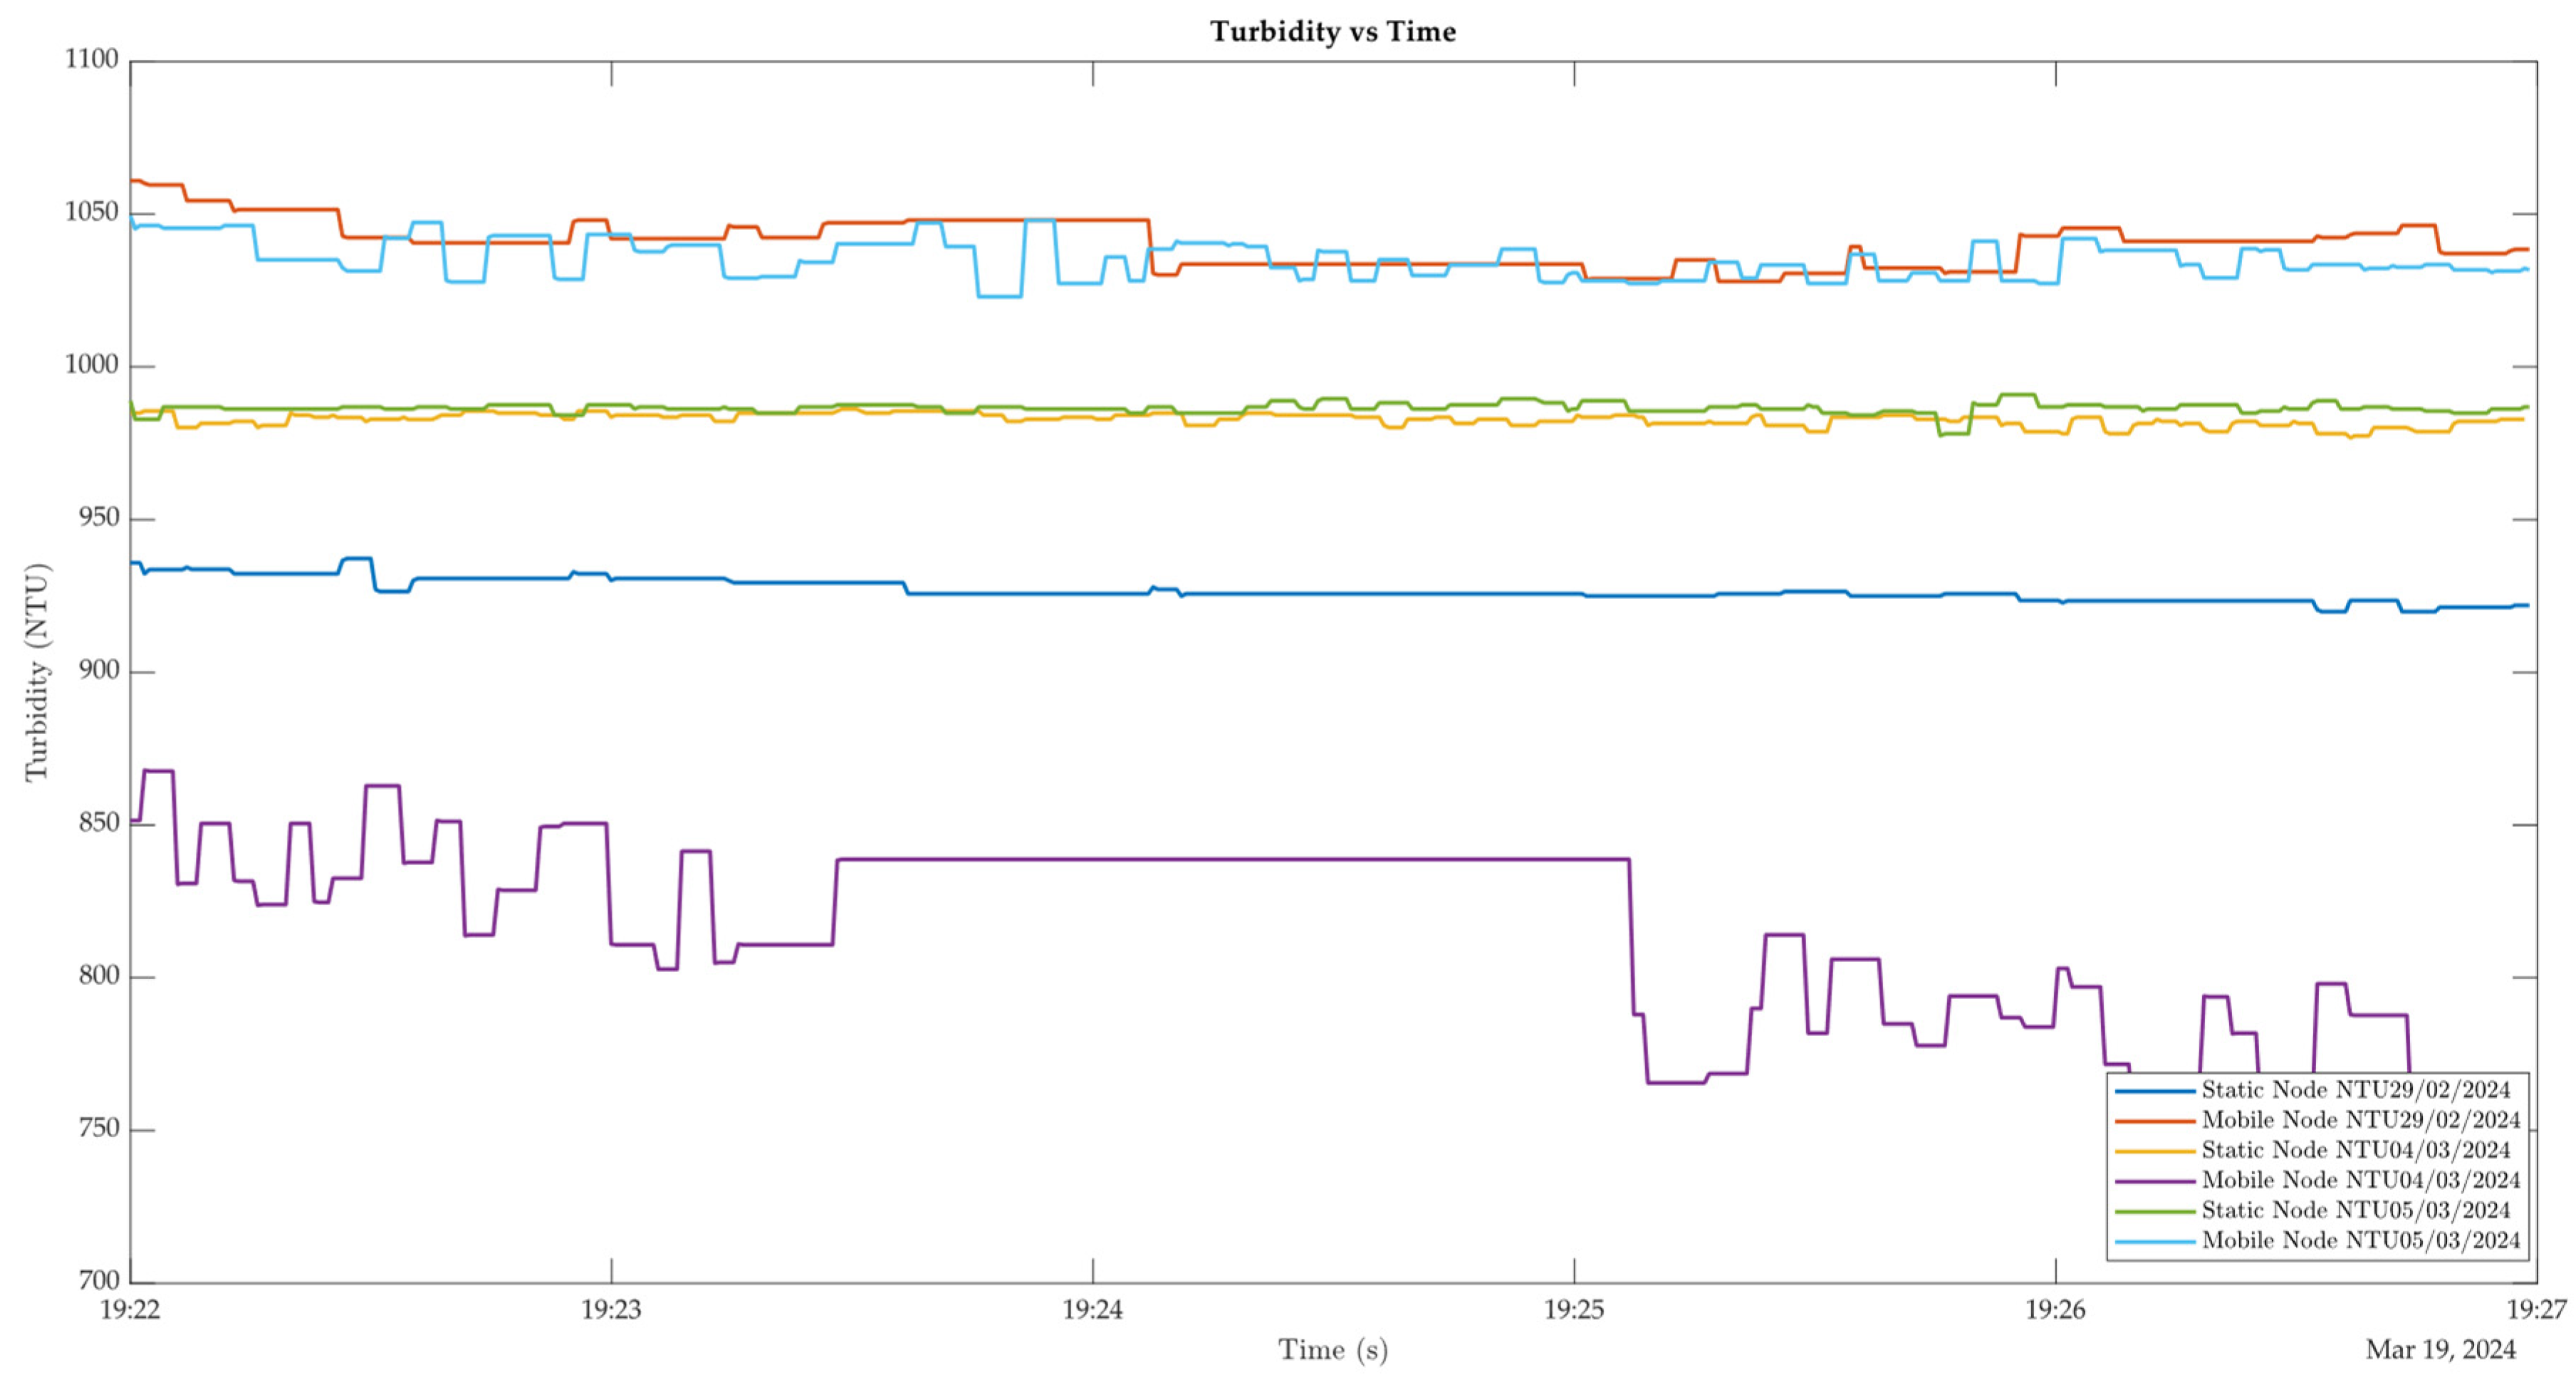
The turbidity graph in Figure 22 illustrates the turbidity curves recorded by the wireless dynamic sensor network (WDSN). It is observed that the static node displayed similar turbidity readings on March 4th and 5th, with values around 980 NTU, which are comparable to those recorded on February 29th, where the readings were slightly lower, approximately 930 NTU. Conversely, the mobile node showed consistent readings on February 29th and March 5th, with an average turbidity of 1050 NTU. These measures contrast with the readings of March 4th, where the mobile node recorded the lowest trend, dropping to 800 NTU. These findings suggest that while there is a general consistency in turbidity readings, noticeable fluctuations could be attributed to various environmental factors or the inherent variability in the mobile node’s path and sampling locations.
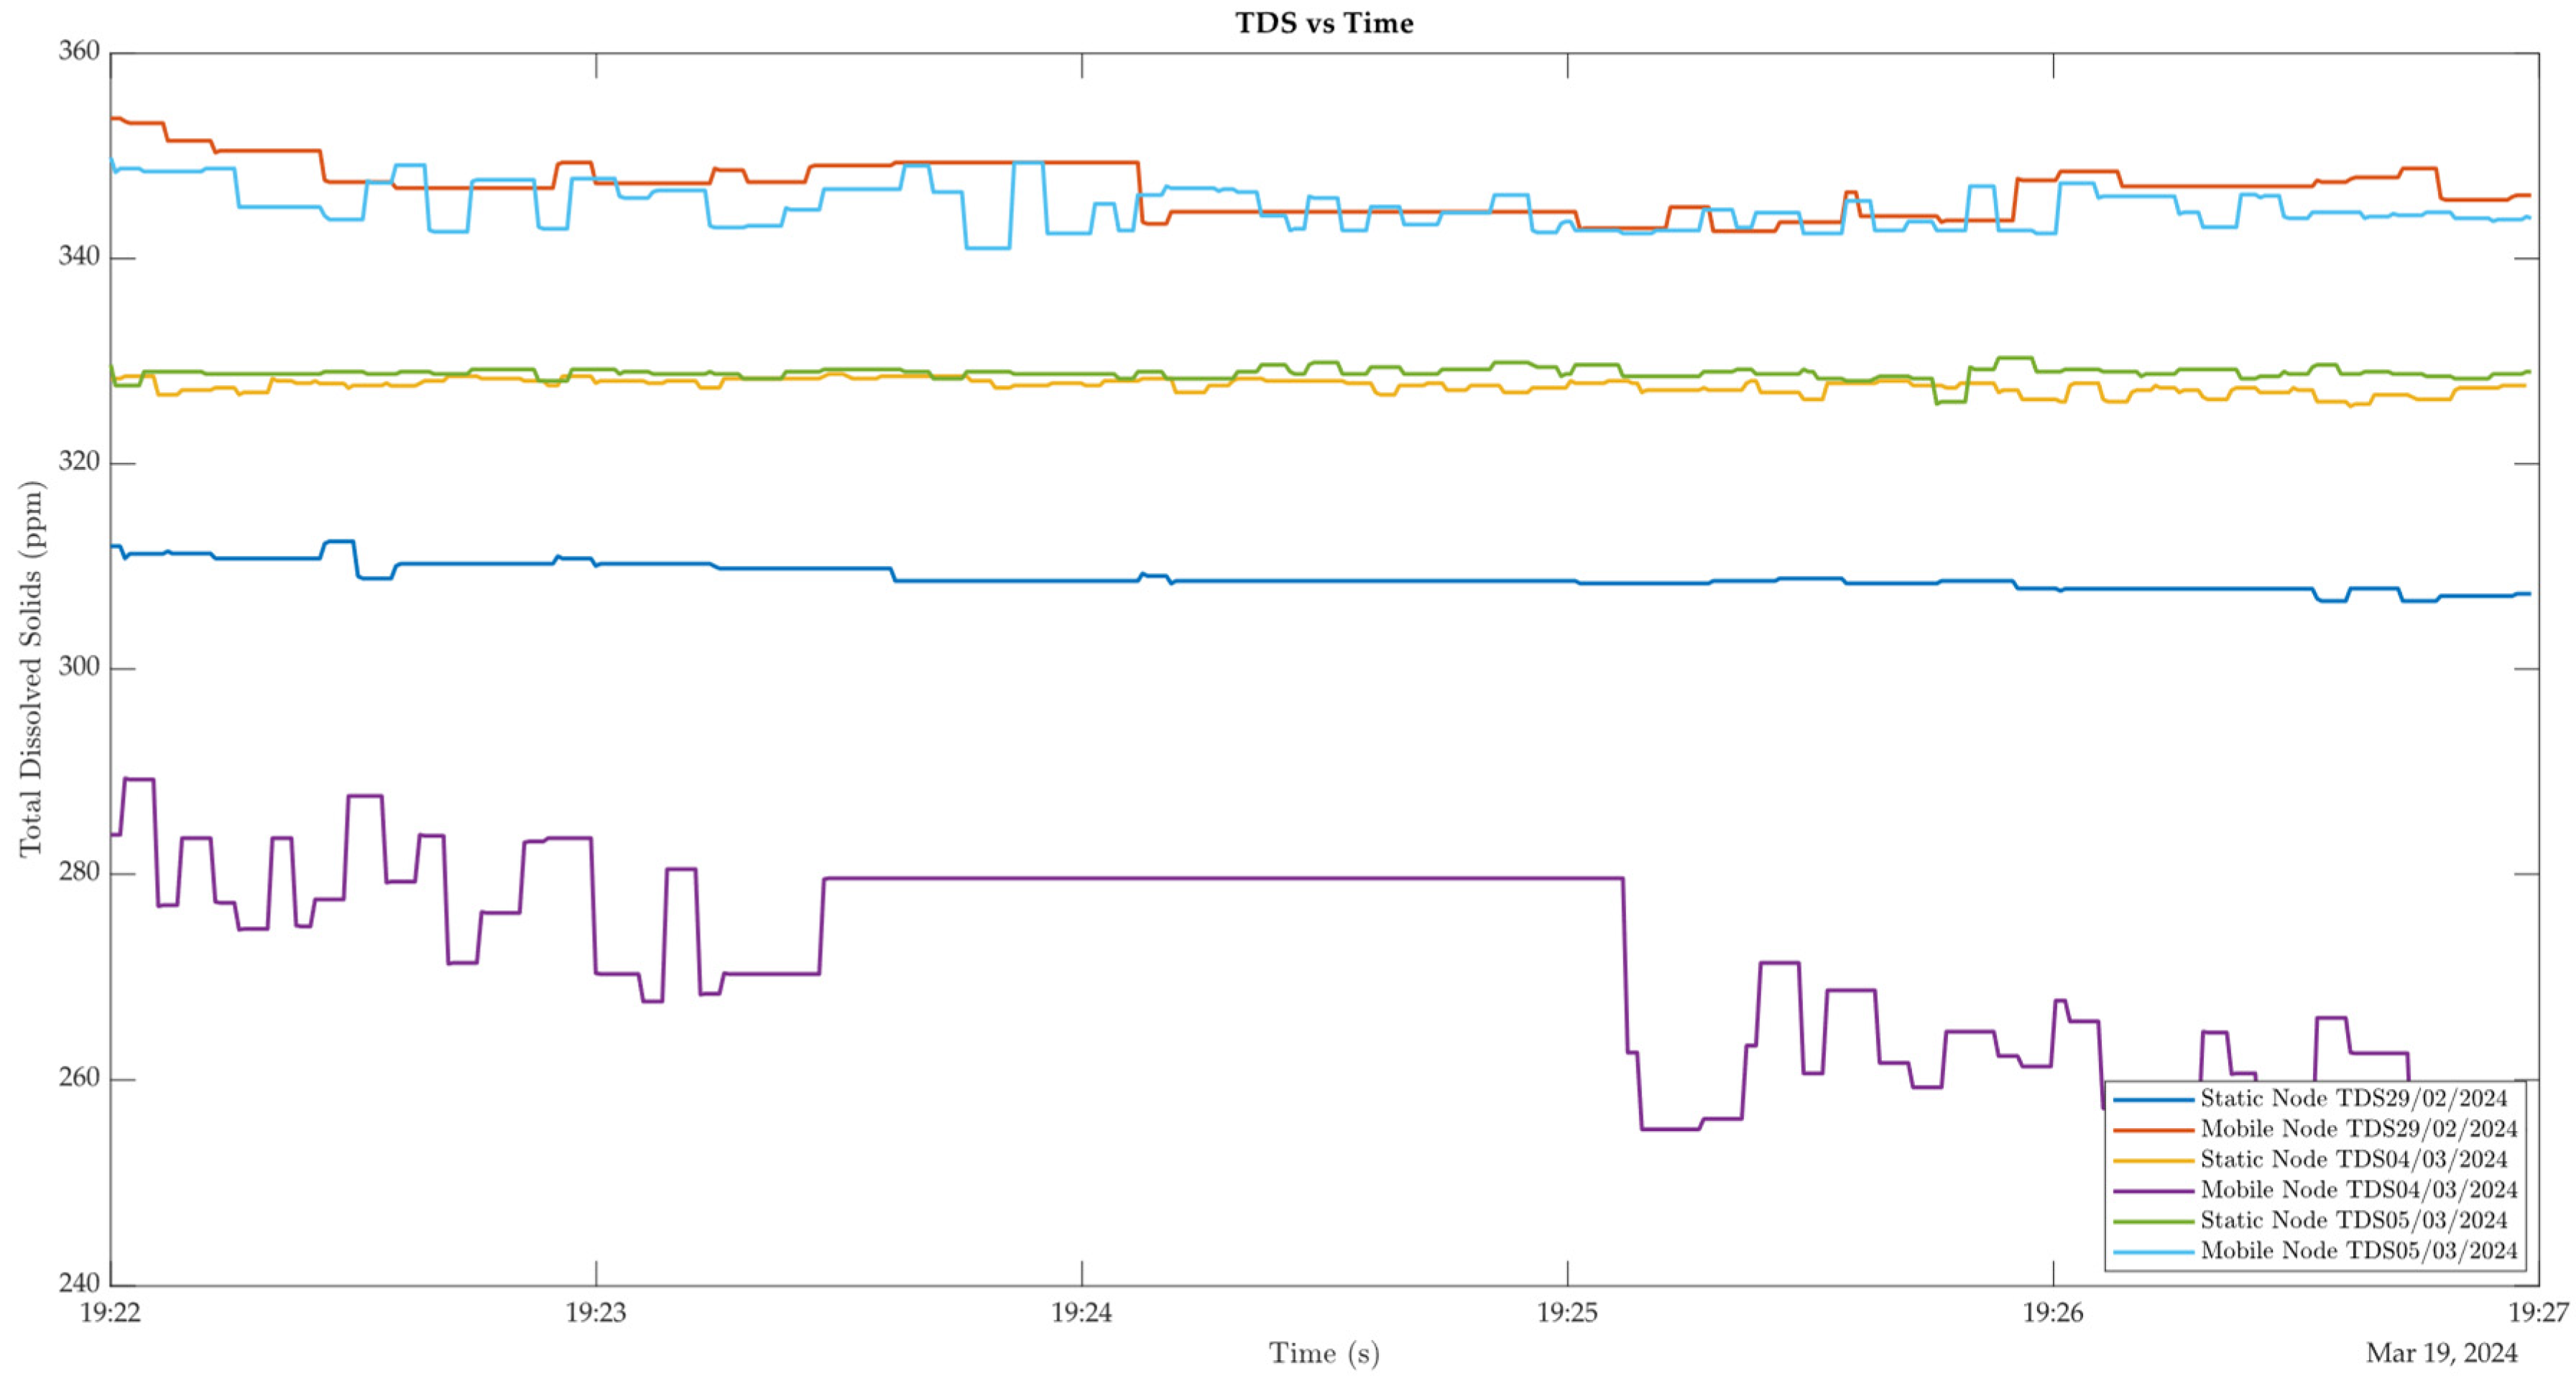
The TDS graph in Figure 23 illustrates that the total dissolved solids (TDS) trends are proportional to those observed in the turbidity graph. This correlation is indicative of the interdependent nature of these parameters. Consequently, in terms of TDS, the water quality adheres to the standards set by the World Health Organization (WHO) and the Mexican standard NOM-127-SSA1-2021, indicating it is generally good and maintains a temperature conducive to aquatic life. However, it is deemed unsuitable for human consumption due to exceeding the permissible levels of pH and turbidity.

5. Conclusions

The wireless dynamic sensor network (WDSN) developed has significantly advanced environmental monitoring. It is considered an innovative network in water quality monitoring, particularly due to the addition of a dynamic node, unlike traditional monitoring systems where every node is fixed or even human supported. Its unique two-node system, comprising a stationary and a mobile node, has demonstrated an efficient approach to water quality assessment by covering multiple points of interest with minimal infrastructure. Integrating the Internet of Things (IoT) has further enhanced the system’s capabilities, enabling real-time data acquisition, remote server communication, and cloud-based data storage. The user-friendly graphical interface facilitates the visualization of water parameters and allows for the remote operation of the mobile node. The system’s effectiveness is evidenced by its ability to maintain water quality within internationally and locally accepted standards in Mexico, as observed in the lagoon study. The correlation of various parameters provides a holistic understanding of the water body’s condition, underscoring the system’s potential as a model for future aquatic ecosystem monitoring endeavors. This project’s success marks a promising step forward in applying similar technologies to safeguard and study aquatic environments globally. The introduction of a dynamic node improves the monitoring.
The advantages of WSN, particularly WDSN, include the ability to monitor multiple points of interest with just two nodes: one stationary and one mobile. The IoT enhances this system by enabling data storage in a database, real-time visualization, and control over the mobile node. The combination of WDSN and IoT offers significant benefits, although the choice between IoT or WDSN may vary depending on the specific application. However, employing both technologies together leverages their individual strengths for a more robust monitoring solution.
The implementation of the developed project yielded significant data regarding the monitored parameters. Notably, the temperature of the monitored water body exhibited minor variations of less than 1 °C during the sampled days, confirming its thermal capacity to maintain stability over short periods. Regarding pH levels, the static node’s readings showed consistency with an average alkaline level of pH 9, while the mobile node detected both neutral and alkaline zones. Total dissolved solids (TDS) trends peaked at 350 ppm, with lows of 270 ppm, indicating good water quality. However, turbidity levels exceeded the limits set by the WHO and Mexican standards, rendering the water unsuitable for human consumption despite its satisfactory TDS quality. Furthermore, the collected data are also valuable for making informed decisions about the water body’s maintenance.
While the total dissolved solids index provides important information and compliance with WHO guidelines is essential, as Mexican law mandates, it is also necessary to account for other elements. Factors such as microbiological pollutants, heavy metals, and concentrations of nitrates and nitrites are critical in assessing water safety. However, the scope of this research is confined to just four parameters, a limitation that must be acknowledged before making decisions regarding water use.
The development of the current dynamic system has significantly advanced the monitoring and analysis of water bodies, providing a robust platform for integrating emerging technologies. Including GPS ports with serial communication allows the vehicle to be automated, fully enabling more efficient and autonomous operations. The system’s ability to monitor key parameters such as temperature, total dissolved solids, and pH, along with indirect turbidity, conductivity, and ammonium concentration measurements, has established a solid foundation for future expansion.
One way to enhance the coverage of the WDSN and enable large-scale monitoring of water bodies is to consider integrating a couple of additional dynamic nodes, as well as static ones, if necessary. Furthermore, the deployment of external antennas should be considered, as they can significantly broaden the network’s reach while minimizing the number of nodes required. This strategic expansion is essential for the advancement of environmental monitoring and resource management.
Integrating additional sensors is a priority, as it would increase the number of monitored parameters and improve the accuracy of water quality assessments. This is crucial for the early identification of environmental issues and the implementation of corrective measures. Additionally, transitioning to open-source software for the user interface promises to facilitate system distribution and adoption, allowing for broader collaboration and continuous improvement through the open-source community.

Author Contributions

Conceptualization, M.A.L.-M., R.T.-M., C.A.A.-A., E.I.T.-F., M.L.-L., J.M.M.-P., F.Q.-M. and F.L.-M.; methodology, M.A.L.-M., R.T.-M., C.A.A.-A., E.I.T.-F. and M.L.-L.; software, M.A.L.-M.; validation, M.A.L.-M., R.T.-M., C.A.A.-A., E.I.T.-F., M.L.-L., J.M.M.-P., F.Q.-M. and F.L.-M.; formal analysis, M.A.L.-M., R.T.-M., C.A.A.-A., E.I.T.-F. and M.L.-L.; investigation, M.A.L.-M., R.T.-M., C.A.A.-A., E.I.T.-F. and M.L.-L.; resources, M.A.L.-M., R.T.-M., C.A.A.-A., E.I.T.-F., M.L.-L., J.M.M.-P., F.Q.-M. and F.L.-M.; data curation M.A.L.-M., R.T.-M. and C.A.A.-A., writing—original draft preparation, M.A.L.-M., R.T.-M., C.A.A.-A. and E.I.T.-F., writing—review and editing, M.A.L.-M., R.T.-M., C.A.A.-A., E.I.T.-F., M.L.-L., J.M.M.-P., F.Q.-M. and F.L.-M.; visualization, M.A.L.-M., R.T.-M., C.A.A.-A., E.I.T.-F. and M.L.-L.; supervision, M.A.L.-M., R.T.-M., C.A.A.-A., E.I.T.-F. and M.L.-L.; project administration, M.A.L.-M., R.T.-M. and C.A.A.-A. All authors have read and agreed to the published version of the manuscript.

Funding

This research received no external funding.

Data Availability Statement

The original contributions presented in the study are included in the article, further inquiries can be directed to the corresponding author.

Conflicts of Interest

The authors declare no conflict of interest.

References

  1. Al Jazeera. Al Jazeera Staff. 22 March 2022. Available online: https://www.aljazeera.com/news/2022/3/22/infographic-which-countries-have-the-safest-drinking-water-interactive (accessed on 4 March 2024).
  2. Drasovean, R.; Murariu, G. Water Quality Parameters and Monitoring Soft Surfece Water Quality Using Statistical Approaches. In Promising Techniques for Wastewater Treatment and Water Quality Assessment; Intech Open: London, UK, 2021; pp. 217–230. [Google Scholar]
  3. Wiryasaputra, R.; Huang, C.-Y.; Lin, Y.-J.; Yang, C.-T. An IoT Real-Time Potable Water Quality Monitoring and Prediction Model Based on Cloud Computing Architecture. Sensors 2024, 24, 1180. [Google Scholar] [CrossRef] [PubMed]
  4. Chhipi-Shrestha, G.; Mian, H.R.; Mohammadiun, S.; Rodriguez, M.; Hewage, K.; Sadiq, R. Digital water: Artificial intelligence and soft computing applications for drinking water quality assessment. Clean Techn. Environ. Policy 2023, 25, 1409–1438. [Google Scholar] [CrossRef]
  5. Tazoe, H. Water quality monitoring. Anal. Sci. 2023, 39, 1–3. [Google Scholar] [CrossRef] [PubMed]
  6. Ullo, S.L.; Sinha, G.R. Advances in Smart Environment Monitoring Systems Using IoT and Sensors. Sensors 2020, 20, 3113. [Google Scholar] [CrossRef] [PubMed]
  7. Uddin, M.G.; Nash, S.; Olbert, A.I. A review of water quality index models and their use for assessing surface water quality. Ecol. Indic. 2021, 122, 107218. [Google Scholar] [CrossRef]
  8. Atiast, A.A.; Aljafaar, K.D. Automation system for monitoring the quality of water sources to maintain their sustainability using microcontrollers. In Proceedings of the International Conference of Electrical, Computer and Energy Technologies (ICECET), Prague, Czech Republic, 20–22 July 2022; pp. 1–4. [Google Scholar]
  9. Islam, M.A.; Khan, R.H.; Syeed, M. A Smart and Integrated Surface Water Monitor System Architecture: Bangladesh Perspective. In Proceedings of the International Conference on Computing Advancements, Dhaka, Bangladesh, 10–12 January 2020. [Google Scholar]
  10. Chen, S.L.; Chou, H.S.; Huang, C.H.; Chen, C.Y.; Li, L.Y.; Huang, C.H.; Chen, Y.Y.; Tang, J.H.; Chang, W.H.; Huang, J.S. An Intelligent Water Monitoring IoT System for Ecological Environment and Smart Cities. Sensors 2023, 23, 8540. [Google Scholar] [CrossRef]
  11. La salud Pública Depende en Gran Medida del Acceso y Calidad del Agua. Gobierno de México, 13 July 2021. Available online: https://www.gob.mx/imta/es/articulos/la-salud-publica-depende-en-gran-medida-del-acceso-y-calidad-del-agua (accessed on 20 April 2024).
  12. Alertan Riesgo para 30 Millones de Mexicanos por Consumo de Agua de Mala Calidad. 25 April 2023. Available online: https://www.infobae.com/mexico/2023/04/25/alertan-riesgo-para-30-millones-de-mexicanos-por-consumo-de-agua-de-mala-calidad/ (accessed on 25 April 2024).
  13. El 70% del Agua que Consumimos está Contaminada: Agua en México. NACION, 17 June 2021. Available online: https://lasillarota.com/nacion/2021/6/17/el-70-del-agua-que-consumimos-esta-contaminada-agua-en-mexico-284428.html (accessed on 20 May 2024).
  14. Calidad del Agua en México. Gobierno de México, 28 February 2024. Available online: https://www.gob.mx/conagua/articulos/calidad-del-agua (accessed on 25 April 2024).
  15. Mohseni, F.; Saba, F.; Mirmazloumi, S.M.; Amani, M.; Mokhtarzade, M.; Jamali, S.; Mahdavi, S. Ocean water quality monitoring using remote sensing techniques: A review. Mar. Environ. Res. 2022, 18, 105701. [Google Scholar] [CrossRef] [PubMed]
  16. Imran, L.B.; Latif, R.M.A.; Farhan, M.; Aldabbas, H. Smart City Based Autonomous Water Quality Monitoring System Using WSN. Wirel. Pers. Commun. 2020, 115, 1805–1820. [Google Scholar] [CrossRef]
  17. MYadav, M.; Preety Saxena, E.; Das, A. Smart Agriculture System Using Artificial Intelligence and Internet of Things. In Reshaping Intelligent Business and Industry: Convergence of AI and IoT at the Cutting Edge; Wiley: Hoboken, NJ, USA, 2024; pp. 403–418. [Google Scholar]
  18. Parri, L.; Parrino, S.; Peruzzi, G.; Pozzebon, A. LoRaWAN Network Infrastructure for the Remote Monitoring of Offshore Sea Farms. In Proceedings of the 2020 IEEE International Instrumentation and Measurement Technology Conference (I2MTC), Dubrovnik, Croatia, 25–28 May 2020; pp. 1–6. [Google Scholar]
  19. Rani, S.; Koundal, D.; Kavita; Ijaz, M.F.; Elhoseny, M.; Alghamdi, M.I. An Optimized Framework for WSN Routing in the Context of Industry 4.0. Sensors 2021, 21, 6474. [Google Scholar] [CrossRef] [PubMed]
  20. Adu-Manu, K.S.; Engmann, F.; Sarfo-Kantanka, G.; Baiden, G.E.; Dulemordzi, B.A. WSN Protocols and Security Challenges for Environmental Monitoring Applications: A Survey. Sensors 2022, 2022, 1628537. [Google Scholar] [CrossRef]
  21. Prapti, D.R.; Mohamed Shariff, A.R.; Che Man, H.; Ramli, N.M.; Perumal, T.; Shariff, M. Internet of Things (IoT)-based aquaculture: An overview of IoT application o water quality monitoring. Rev. Aquac. 2022, 14, 979–992. [Google Scholar] [CrossRef]
  22. Feng, C.; Yuan, J.; Sun, Y.; You, J. Design of Water Quality Monitoring System. In Proceedings of the International Conference on Artificial Intelligence and Computer Engineering (ICAICE), Beijing, China, 23–25 October 2020. [Google Scholar]
  23. Chowdury, M.S.U.; Emran, T.B.; Ghosh, S.; Pathak, A.; Alam, M.M.; Absar, N.; Andersson, K.; Hossain, M.S. IoT Based Real-time River Water Quality Monitoring System. Procedia Comput. Sci. 2019, 155, 161–168. [Google Scholar] [CrossRef]
  24. Budiarti, R.P.N.; Tjahjono, A.; Hariadi, M.; Purnomo, M.H. Development of IoT for Automated Water Quality Monitoring System. In Proceedings of the International Conference on Computer Science, Information Technology, and Electrical Engineering (ICOMITEE), Jember, Indonesia, 16–17 October 2019. [Google Scholar]
  25. Roque-Cilia, S.; Tamariz-Flores, E.I.; Torrealba-Meléndez, R.; Covarrubias-Rosales, D.H. Transport tracking through communication in WDSN for smart cities. Measurement 2019, 139, 205–212. [Google Scholar] [CrossRef]
  26. Pasika, S.; Gandla, S.T. Smart water quality monitoring system with cost-effective using IoT. Heliyon 2020, 6, e04096. [Google Scholar] [CrossRef] [PubMed]
  27. Stephens, E. Understanding The PH Level Of Ammonia: Importance, Monitoring, And Correcting Methods. AquaWorldHub, 7 March 2024. Available online: https://aquaworldhub.com/ph-level-of-ammonia/ (accessed on 18 April 2024).
  28. What Is NTU. TECNOCONVERTING Engineering. Available online: https://www.tecnoconverting.com/technical-articles/what-is-ntu/ (accessed on 20 March 2024).
  29. Conductivity (EC) vs Total Dissolved Solids (TDS)—What’s the Difference? Atlas Scientific, 4 March 2024. Available online: https://atlas-scientific.com/blog/conductivity-vs-tds/ (accessed on 18 April 2024).
  30. Tomas, L. How to Convert Tds to Conductivity. SCIENCING, 5 December 2020. Available online: https://sciencing.com/convert-conductivity-concentration-6925703.html (accessed on 17 April 2024).
  31. WHO. Guidelines for Drinking-Water Quality: Fourth Edition Incorporating the First and Second Addenda; World Health Organization: Geneva, Switzerland, 2022. [Google Scholar]
  32. NOM-127-SSA1-2021; Agua para uso y Consumo Humano. Límites Permisibles de la Calidad del Agua. Secretaría de Salud, Diario Oficial de la Federación: México City, Mexico, 2022.
  33. Hameed, M.S.; Ramya, E.; Pillai, L.; Kirubavathy, K.J.; Shylesh, D.D.; Bai, V.T.; Jaganathan, R. Realtime Monitoring System for Surface Water Quantity and Analyzing of Water Quality Using Microcontroller. J. Pharm. Negat. Results 2022, 13, 442–447. [Google Scholar]
  34. Goblirsch, T.; Mayer, T.; Penzel, S.; Rudolph, M.; Borsdorf, H. In Situ Water Quality Monitoring Using an Optical Multiparameter Sensor Probe. Sensors 2023, 23, 9545. [Google Scholar] [CrossRef] [PubMed]
  35. Singh, Y.; Walingo, T. Smart Water Quality Monitoring with IoT Wireless Sensor Networks. Sensors 2024, 24, 2871. [Google Scholar] [CrossRef] [PubMed]
  36. Chen, S.T.; Lin, S.S.; Lan, C.W.; Chou, T.I. Design and development of a LoRa based water quality monitoring system. In Proceedings of the International Symposium on Intelligent Signal Processing and Communication Systems (ISPACS), Hualien, Taiwan, 16–19 November 2021. [Google Scholar]
  37. Prabowo, O.M.; Tresnawati, Y.; Kusumastuti, D. Design of Water Quality Monitoring System using Remote Operated Vehicle. In Proceedings of the International Conference on ICT for Smart Society (ICISS), Bandung, Indonesia, 19–20 November 2020. [Google Scholar]
  38. Caballero, B.; Finglas, P.M.; Toldrá, F. pH: Principles and Measurements. In Encyclopedia of Food and Health; Elsevier: Amsterdam, The Netherlands, 2016; pp. 333–338. [Google Scholar]
  39. Christian, G.D.; Dasgupta, P.K.; Schug, K.A. Analytical Objectives, or: What Analytical Chemists Do. In Analytical Chemistry; Wiley: Hoboken, NJ, USA, 2014; pp. 2–216. [Google Scholar]
  40. Sugiharto, W.H.; Susanto, H.; Prasetijo, A.B. Real-Time Water Quality Assessment via IoT: Monitoring pH, TDS, Temperature, and Turbidity. Ingénierie Systèmes Inf. 2023, 28, 823–831. [Google Scholar] [CrossRef]
  41. Ocean: TDS (Total Dissolved Solids) Meter Sensor for Raspberry Pi and Arduino. CQ Robot Online Shop. Available online: https://www.cqrobot.com/index.php?route=product/product&product_id=1122 (accessed on 21 May 2024).
  42. Chakraborty, S.K. Water: Its Properties, Distribution, and Significance. In Riverine Ecology; Springer: Chennai, India, 2021; pp. 23–55. [Google Scholar]
  43. 1-Wire Protocol. Arduino, 10 October 2022. Available online: https://docs.arduino.cc/learn/communication/one-wire/ (accessed on 21 April 2024).
  44. OPC Servers. National Instruments. Available online: https://www.ni.com/es/support/downloads/software-products/download.opc-servers.html#305861 (accessed on 21 May 2024).
  45. LabVIEW. National Instruments. Available online: https://www.ni.com/es-mx/support/downloads/software-products/download.labview.html#477380 (accessed on 12 April 2024).
  46. de Oliveira, P.M.; de Souza, J.I.; da Silva, J.A.; Longo, R.L. Temperature Dependence of Hydrogen Bond Networks of Liquid Water: Thermodynamic Properties and Structural Heterogeneity from Topological Descriptors. J. Phys. Chem. B 2023, 127, 2250–2257. [Google Scholar] [CrossRef] [PubMed]
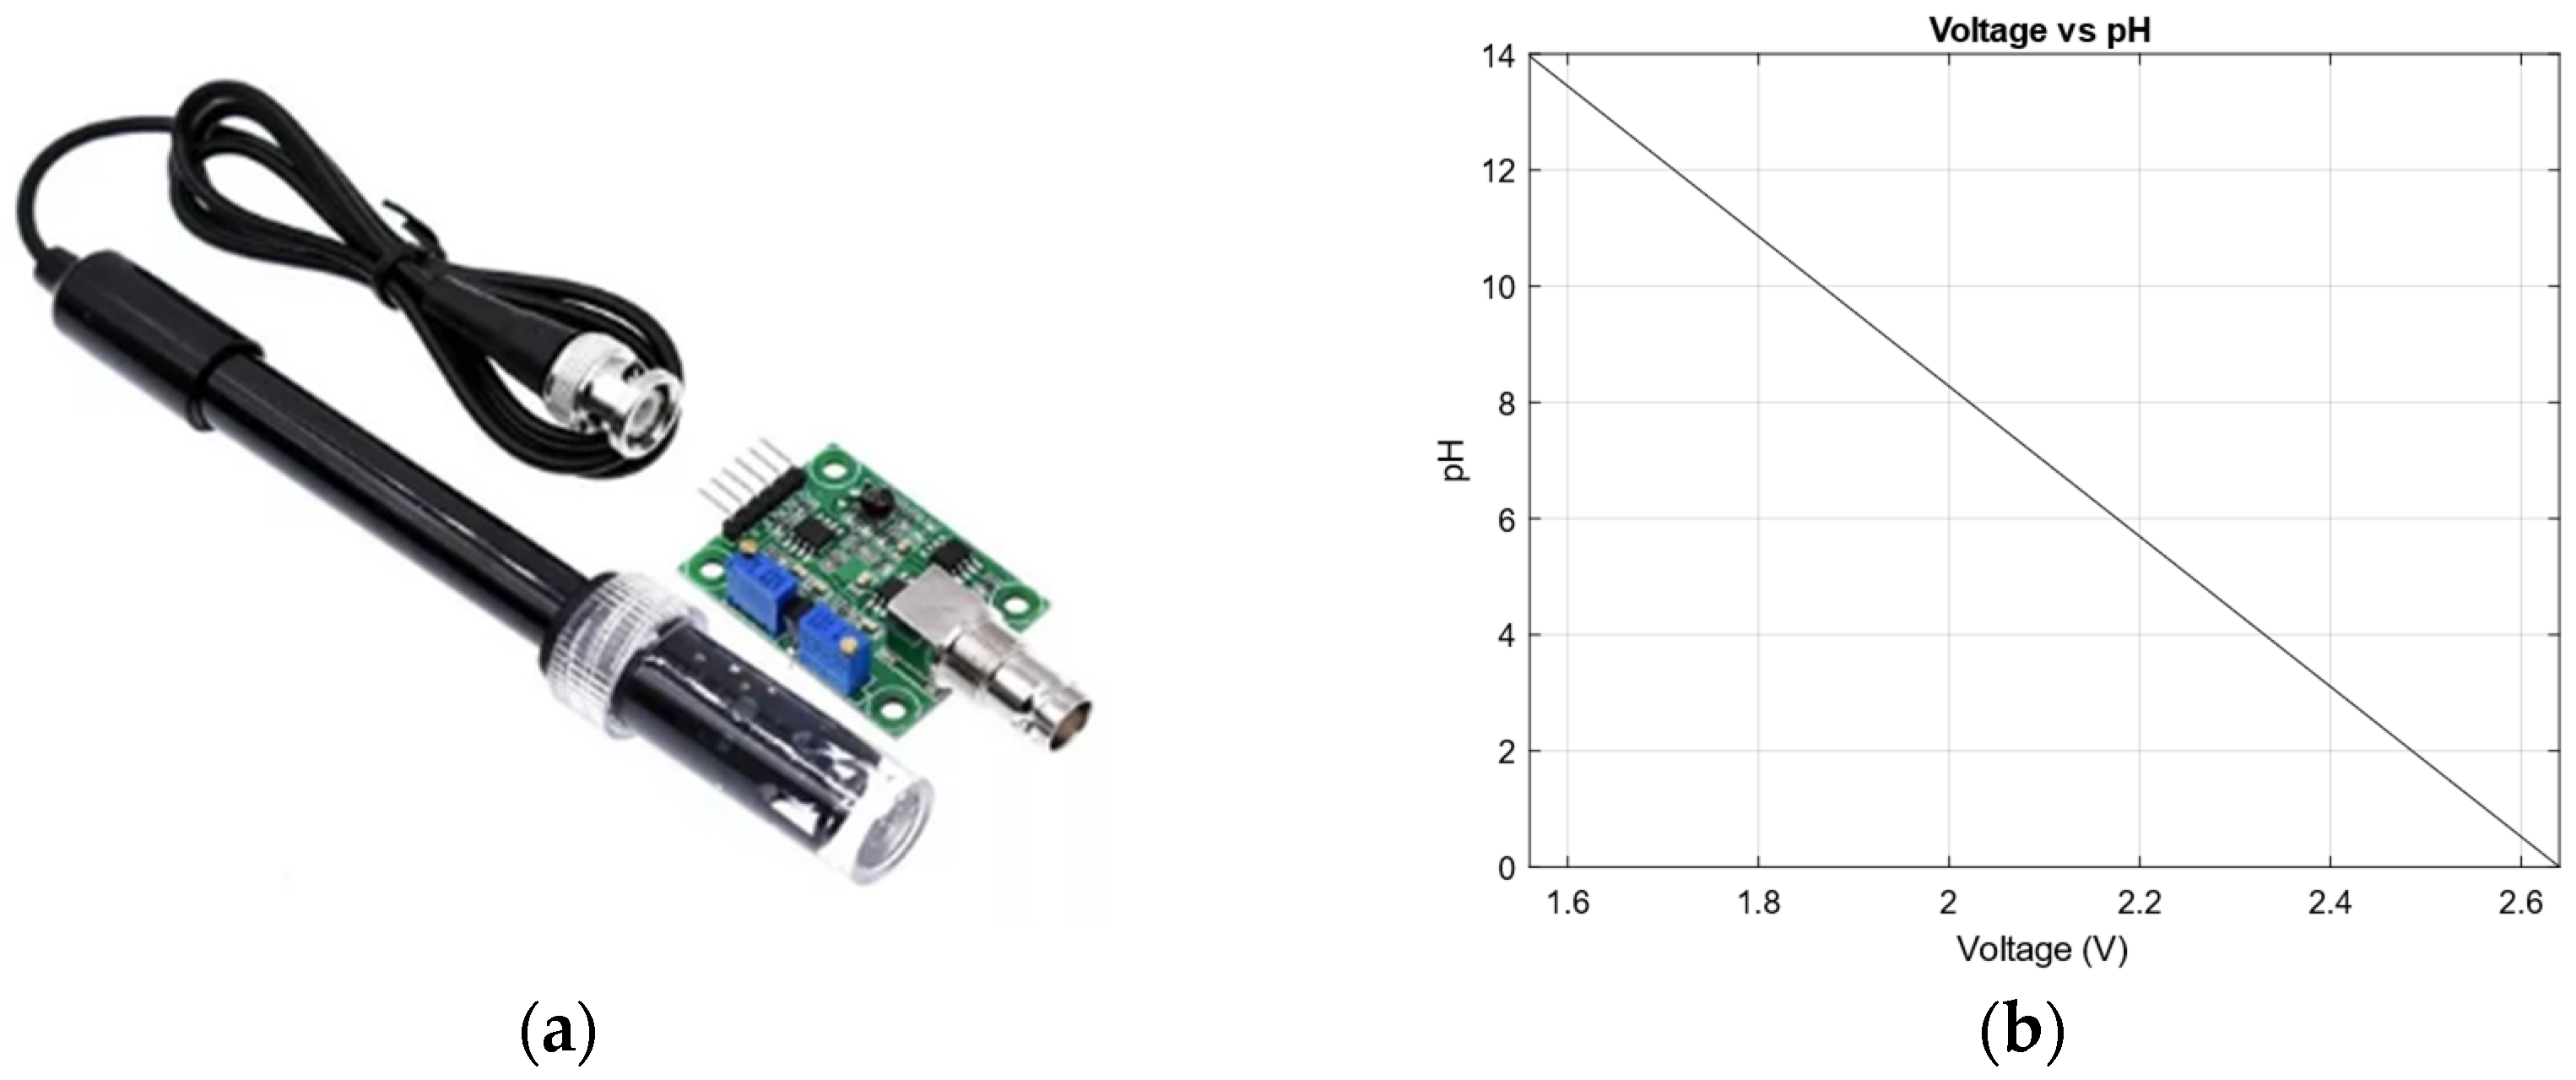
Figure 1. (a) pH sensor; (b) pH sensor characteristic curve.
Technologies 12 00211 g001
Figure 2. (a) TDS sensor (CQRADS1115); (b) TDS sensor characteristic curve.
Technologies 12 00211 g002
Figure 3. (a) Operation logic of the acquisition system of both nodes; (b) Steering system of the mobile node.
Technologies 12 00211 g003
Figure 4. WDSN communication model diagram.
Technologies 12 00211 g004
Figure 5. (a) Device name assignment in the created communication channel and static node IP definition; (b) Definition of communication port.
Technologies 12 00211 g005
Figure 6. Communication channel, device, and tags created.
Technologies 12 00211 g006
Figure 7. (a) Mobile node communication system; (b) Static node communication system.
Technologies 12 00211 g007
Figure 8. RSSI behavior at different distances.
Technologies 12 00211 g008
Figure 9. Front panel of the graphical interface.
Technologies 12 00211 g009
Figure 10. Summary tab of the mobile node.
Technologies 12 00211 g010
Figure 11. (a) Flowchart that describes data management; (b) Graphical interface operational description.
Technologies 12 00211 g011
Figure 12. (a) Static node rendered model; (b) fully assembled static node.
Technologies 12 00211 g012
Figure 13. Mobile node rendered model.
Technologies 12 00211 g013
Figure 14. (a) Mobile node electrical schematic; (b) Mobile node PCB design.
Technologies 12 00211 g014
Figure 15. (a) WiFi network coverage area with internet access marked by the blue zones on the map; (b) Approximate location of the static node.
Technologies 12 00211 g015
Figure 16. (a) Static node located at coordinates 19°00′15″ N, 98°12′18″ W; (b) Plan view of the static node.
Technologies 12 00211 g016
Figure 17. Static and mobile nodes on a body of water.
Technologies 12 00211 g017
Figure 18. WDSN coverage area and location of the mobile node.
Technologies 12 00211 g018
Figure 19. Vehicle control is designed using a remote desktop from a smartphone where the camera is activated.
Technologies 12 00211 g019
Figure 20. Temperature, pH, NTU, and TDS registered on 29 February 2024, 4 March 2024, and 5 March 2024 from 19:22 to 19:26 h.
Technologies 12 00211 g020
Figure 21. pH registered on 29 February 2024, 4 March 2024, and 5 March 2024 from 19:22 to 19:26 h.
Technologies 12 00211 g021
Figure 22. NTU registered on 29 February 2024, 4 March 2024, and 5 March 2024 from 19:22 to 19:26 h.
Technologies 12 00211 g022
Figure 23. TDS registered on 29 February 2024, 4 March 2024, and 5 March 2024 from 19:22 to 19:26 h.
Technologies 12 00211 g023
Table 1. Related works in recent years.
Consulted ReferenceYearMonitored ParametersContributionPros and Cons
[35]2024pH
Ammonium
Conductivity
Turbidity
A wireless sensor network (WSN) with two nodes was designed to monitor a water treatment plant, where IA techniques were integrated to predict concentrations of water parameters.Pros:
IA technique integration
Tested in a water treatment plant
Cons:
Challenges in deployment in harsh environments
Limited accuracy in real-time data delivery
No mobile nodes were implemented.
[10]2023pH
Temperature
Turbidity
Dissolved oxygen
Soil moisture
Liquid level
A wireless sensor network (WSN) with four nodes designed to monitor ecological wetlands within smart cities. It facilitates the collection and storage of environmental data in a database. Pros:
Good area coverage, thanks to 4 nodes
Cloud backup
Tested in ecological wetlands
Cons:
More energy consumption
No mobile nodes were implemented.
No real-time monitoring enabled
[8]2022pH
Temperature
Turbidity
Dissolved oxygen
The developed system comprises a single fixed node that monitors water quality and sends alerts using GSM technology.Pros:
Alerts for the user
Visual representation (LEDs) for parameters read
Cons:
No cloud backup
Just one node
No real-time monitoring enabled
Tested in a non-natural environment
[36]2021pH
Temperature
Dissolved oxygen
Salinity
Liquid level
A WSN was designed to monitor a fishpond, utilizing the LoRa protocol for sensor nodes; it features cloud backup for the recorded parameters.Pros:
Long range area coverage
Cloud backup
Tested in a fishpond
Cons:
Additional device required for cloud uploading
No real-time monitoring enabled
No mobile nodes implemented
[37]2020pH
Temperature
Total dissolved solids
The system is based on one mobile wired node using the Ethernet protocol, and the gateway is connected to the server using the same protocol.Pros:
A mobile node implemented
Real-time monitoring
Tested in a natural environment
Cons:
Wired system
Just one node
Table 2. Average RSSI corresponding to reference distances.
Distance (m)Average RSSI (dB)Packet Loss
3−510/100
6−600/100
9−640/100
12−750/100
15−826/100
18−10039/100
21−11088/100
Disclaimer/Publisher’s Note: The statements, opinions and data contained in all publications are solely those of the individual author(s) and contributor(s) and not of MDPI and/or the editor(s). MDPI and/or the editor(s) disclaim responsibility for any injury to people or property resulting from any ideas, methods, instructions or products referred to in the content.