Article

Integrated System of Reverse Osmosis and Forward Pressure-Assisted Osmosis from ZrO2 Base Polymer Membranes for Desalination Technology

1
Nuclear Technologies Institute (NTI), King Abdulaziz City for Science and Technology (KACST), P.O. Box 6086, Riyadh 11442, Saudi Arabia
2
Chemical Engineering & Pilot Plant Department, Engineering and Renewable Energy Research Institute, National Research Centre, 33 El-Bohouth St., Dokki, Giza P.O. Box 12622, Egypt
3
Water Pollution Research Department, Environment and Climate Change Research Institute, National Research Centre, 33 El-Bohouth St., Dokki, Giza P.O. Box 12622, Egypt
*
Authors to whom correspondence should be addressed.
Technologies 2024, 12(12), 253; https://doi.org/10.3390/technologies12120253
Submission received: 5 November 2024 / Revised: 28 November 2024 / Accepted: 3 December 2024 / Published: 6 December 2024
(This article belongs to the Section Innovations in Materials Processing)

Abstract

:
In this work, reverse osmosis and forward osmosis membranes were prepared using base cellulosic polymers with ZrO2. The prepared membranes were rolled on the spiral-wound configuration module. The modules were tested on a pilot unit to investigate the efficiency of the RO membrane and the hydraulic pressure effect on both sides of the FO membranes. The RO membrane provided a rejection of 99% for the seawater desalination, and the brine was used as a draw solution for the FO system. First, seawater was used as a draw solution to indicate the best hydraulic pressure, where the best one was 3 bar for the draw solution side, and 2 bar for the feed side, where the water flux reached 48.89 L/m2·h (LMH) with a dilution percentage of 80% and a low salt reverse flux of 0.128 g/m2·h (gMH) after 5 h of operation time. The integrated system of RO and forward-assisted osmosis (PAO) was investigated using river water as a feed and RO brine as a draw solute, where the results of PAO indicate a high-water flux of 68.6 LMH with a dilution of 93.2% and a salt reverse flux of 0.18 gMH. Therefore, using PAO improves the performance of the system.

1. Introduction

Membrane separation technology is a viable and energy-efficient substitute for traditional methods, and it is widely used in many different applications [1]. Membrane separation types depend on the separation mechanism and the size of separated particles, so it is classified into various types such as reverse osmosis, nanofiltration, ultrafiltration, microfiltration, and forward osmosis. This type of membrane is called the pressure-driving process which depends on the affected pressure as a driving force [2].
Reverse osmosis has made significant strides as a quicker and more cost-effective method of desalinating brackish and saltwater. The efficient RO membrane prepared can help increase productivity and reduce the system’s required energy [3]. Blending polymeric membranes can be carried out between two polymers or polymers with nanoparticles such as cellulose acetate (CA) with polyvinylchloride (PVC), polyvinylalcohol (PVA), polyacrylonitrile (PAN) and polyvinylidene fluoride (PVDF) [4]. Nanoparticles such as TiO2, ZnO, Mn2O3, etc. [5], or blending between polymeric additives such as pore formers like polyethylene glycol and polyvinylpyrrolidone (PVP) [6]. A new generation of membranes with improved anti-fouling qualities, strong rejection capabilities for pollutants, and increased resistance to oxidizing (chlorine, ozone, etc.) and microbiological agent attacks are the result of recent advancements in membrane features [7,8]. Polymer blending is therefore the most effective method for changing the membrane’s characteristics whenever necessary, and it can be regarded as a low-cost conventional technology [9,10].
Through the utilization of abundant seawater resources, pressure-retarded osmosis (PRO) and forward osmosis (FO), two osmotically driven membrane technologies, can sustainably produce water or power [10]. Osmosis, the spontaneous passage of water over a semipermeable membrane that is impenetrable to salt, provides the basis for these procedures. An osmotic low pressure diluted feed solution diffuses into a concentrated draw solution with a higher osmotic pressure. Importantly, water may pass through the membrane without the need for hydraulic pressure thanks to FO [11]. Since the FO system merely uses pressure to overcome flow resistance in the membrane module and pipe wall, it may be less costly than the RO process because it does not rely on hydraulic pressure. Because of this, the FO method is beginning to show promise as a long-term substitute for traditional pressure-driven procedures [12,13].
To address the present flux constraints in forward osmosis (FO), the idea of pressure-assisted osmosis (PAO) has shown promise by increasing the water flux due to the enhancement of osmotic and hydraulic driving forces. The problem in PAO is fouling, especially when using wastewater in a feed side, where the drawn water flow is impacted by the harmful extra resistance to water penetration caused by the compaction of the foulant cake caused by the applied pressure [14,15]. Since osmosis is the process by which water moves from feed to draw solution through the FO membrane, which relies on the osmotic pressure differential between the two streams as its driving power instead of the hydraulic pressure differential, as in RO, pressure-retarded osmosis (PRO) and pressure-assisted osmosis (PAO) can be considered processes between FO and RO, where the pressure is applied but in different directions. The effect of the pressure in PRO is in the opposite direction of the osmotic pressure, while PAO is in the same direction, accordingly, the hydraulic pressure differential (ΔP) and the osmotic pressure difference (Δπ) add up to the driving power of these systems. Therefore, Δπ for FO, ΔP for RO, ΔP-Δπ for PRO, and Δπ + ΔP for PAO are the net driving forces of each osmosis system [16].
The novelty of this work is based on the integration between two main processes: pressure-retarded osmosis (PRO) using low pressure in the draw solution side (less than osmotic pressure), and pressure-assisted osmosis (PAO) by applying low pressure in the feed side to enhance and increase the productivity of the process. Also, using ZrO2 in membrane preparation enhances membranes’ anti-fouling properties, leading to enhancement in water flux and dilution percentage.
In this work, the assisted pressure was used on both sides of the FO unit to enhance the water flux through the membrane, the integrated system of RO and PAO was investigated using brine as a draw solution from the RO unit and river water as a feed for the FO unit.

2. Materials and Methods

2.1. Materials

Cellulose acetate (CA, 100,000 gmol−1), cellulose triacetate (CTA, 43.6 wt% acetyl) and polyvinyl alcohol were obtained from Sigma Aldrich (Taufkirchen, Germany). Ethanol, N-methyl pyrrolidine, and dimethyl formamide were purchased from Acros Organics (made in Madison, WI, USA). The 1,2,3,4 butane tetracarboxylic acid (BTCA) was provided by Merck made in Darmstadt, Germany (purity > 99%). ZrOCl2·8H2O, KOH, and sodium hydroxide were purchased from Sigma Aldrich made in Germany. The 1,4-dioxane, methanol (high purity), and acetone (HPLC) were purchased from Across Organics (made in USA).

2.2. Preparation of Membranes and Module Fabrication

The fabrication of RO and FO membranes was carried out using the immersion phase inversion method. ZrO2 nanoparticles were first prepared by dissolving 0.1 M of ZrOCl2·8H2O in 100 mL of water and then adding 0.2 M of KOH. After stirring well, the solution was put in a Teflon-lined sterilized container and put in the oven for 16 h at 180 °C [17]. In the membrane preparation steps, NPs were first dispersed in the solvent using an ultrasonic homogenizer for 1 h. After that, the polymers were added and stirred by a mechanical stirrer for 24 h.
For the RO membrane, cellulose acetate (CA) and polyvinyl alcohol (PVA) were added in N-methyl pyrrolidine with 24 wt.% and 6 wt%, respectively, incorporating this with 0.3 wt% of ZrO2 NPs in the polymeric solution. For the FO membrane, cellulose triacetate (CTA) of 12 wt% was dissolved in the mixture of acetone and dioxane with the ratio of 1.5 and 5 wt% of methanol incorporation with 0.05 wt% of ZrO2 NPs in the polymeric solution.
All prepared membranes were cast on the large-scale non-woven polyester support with a width of 50 cm and thickness of 200 µm and were cast on a continuous casting machine located in the National Research Centre in Egypt to prepare large-scale membranes which were fabricated to a spiral-wound membrane module in 4021 type modules as shown in Figure 1. A perforated tube (made of polyethylene) of length 50 cm, feed spacer, and permeate carrier was purchased from Holykem Company, Hangzhou, China to be used in spiral-wound fabrication. The fabrication machines of spiral-wound modules were located in the National Research Centre, Egypt.
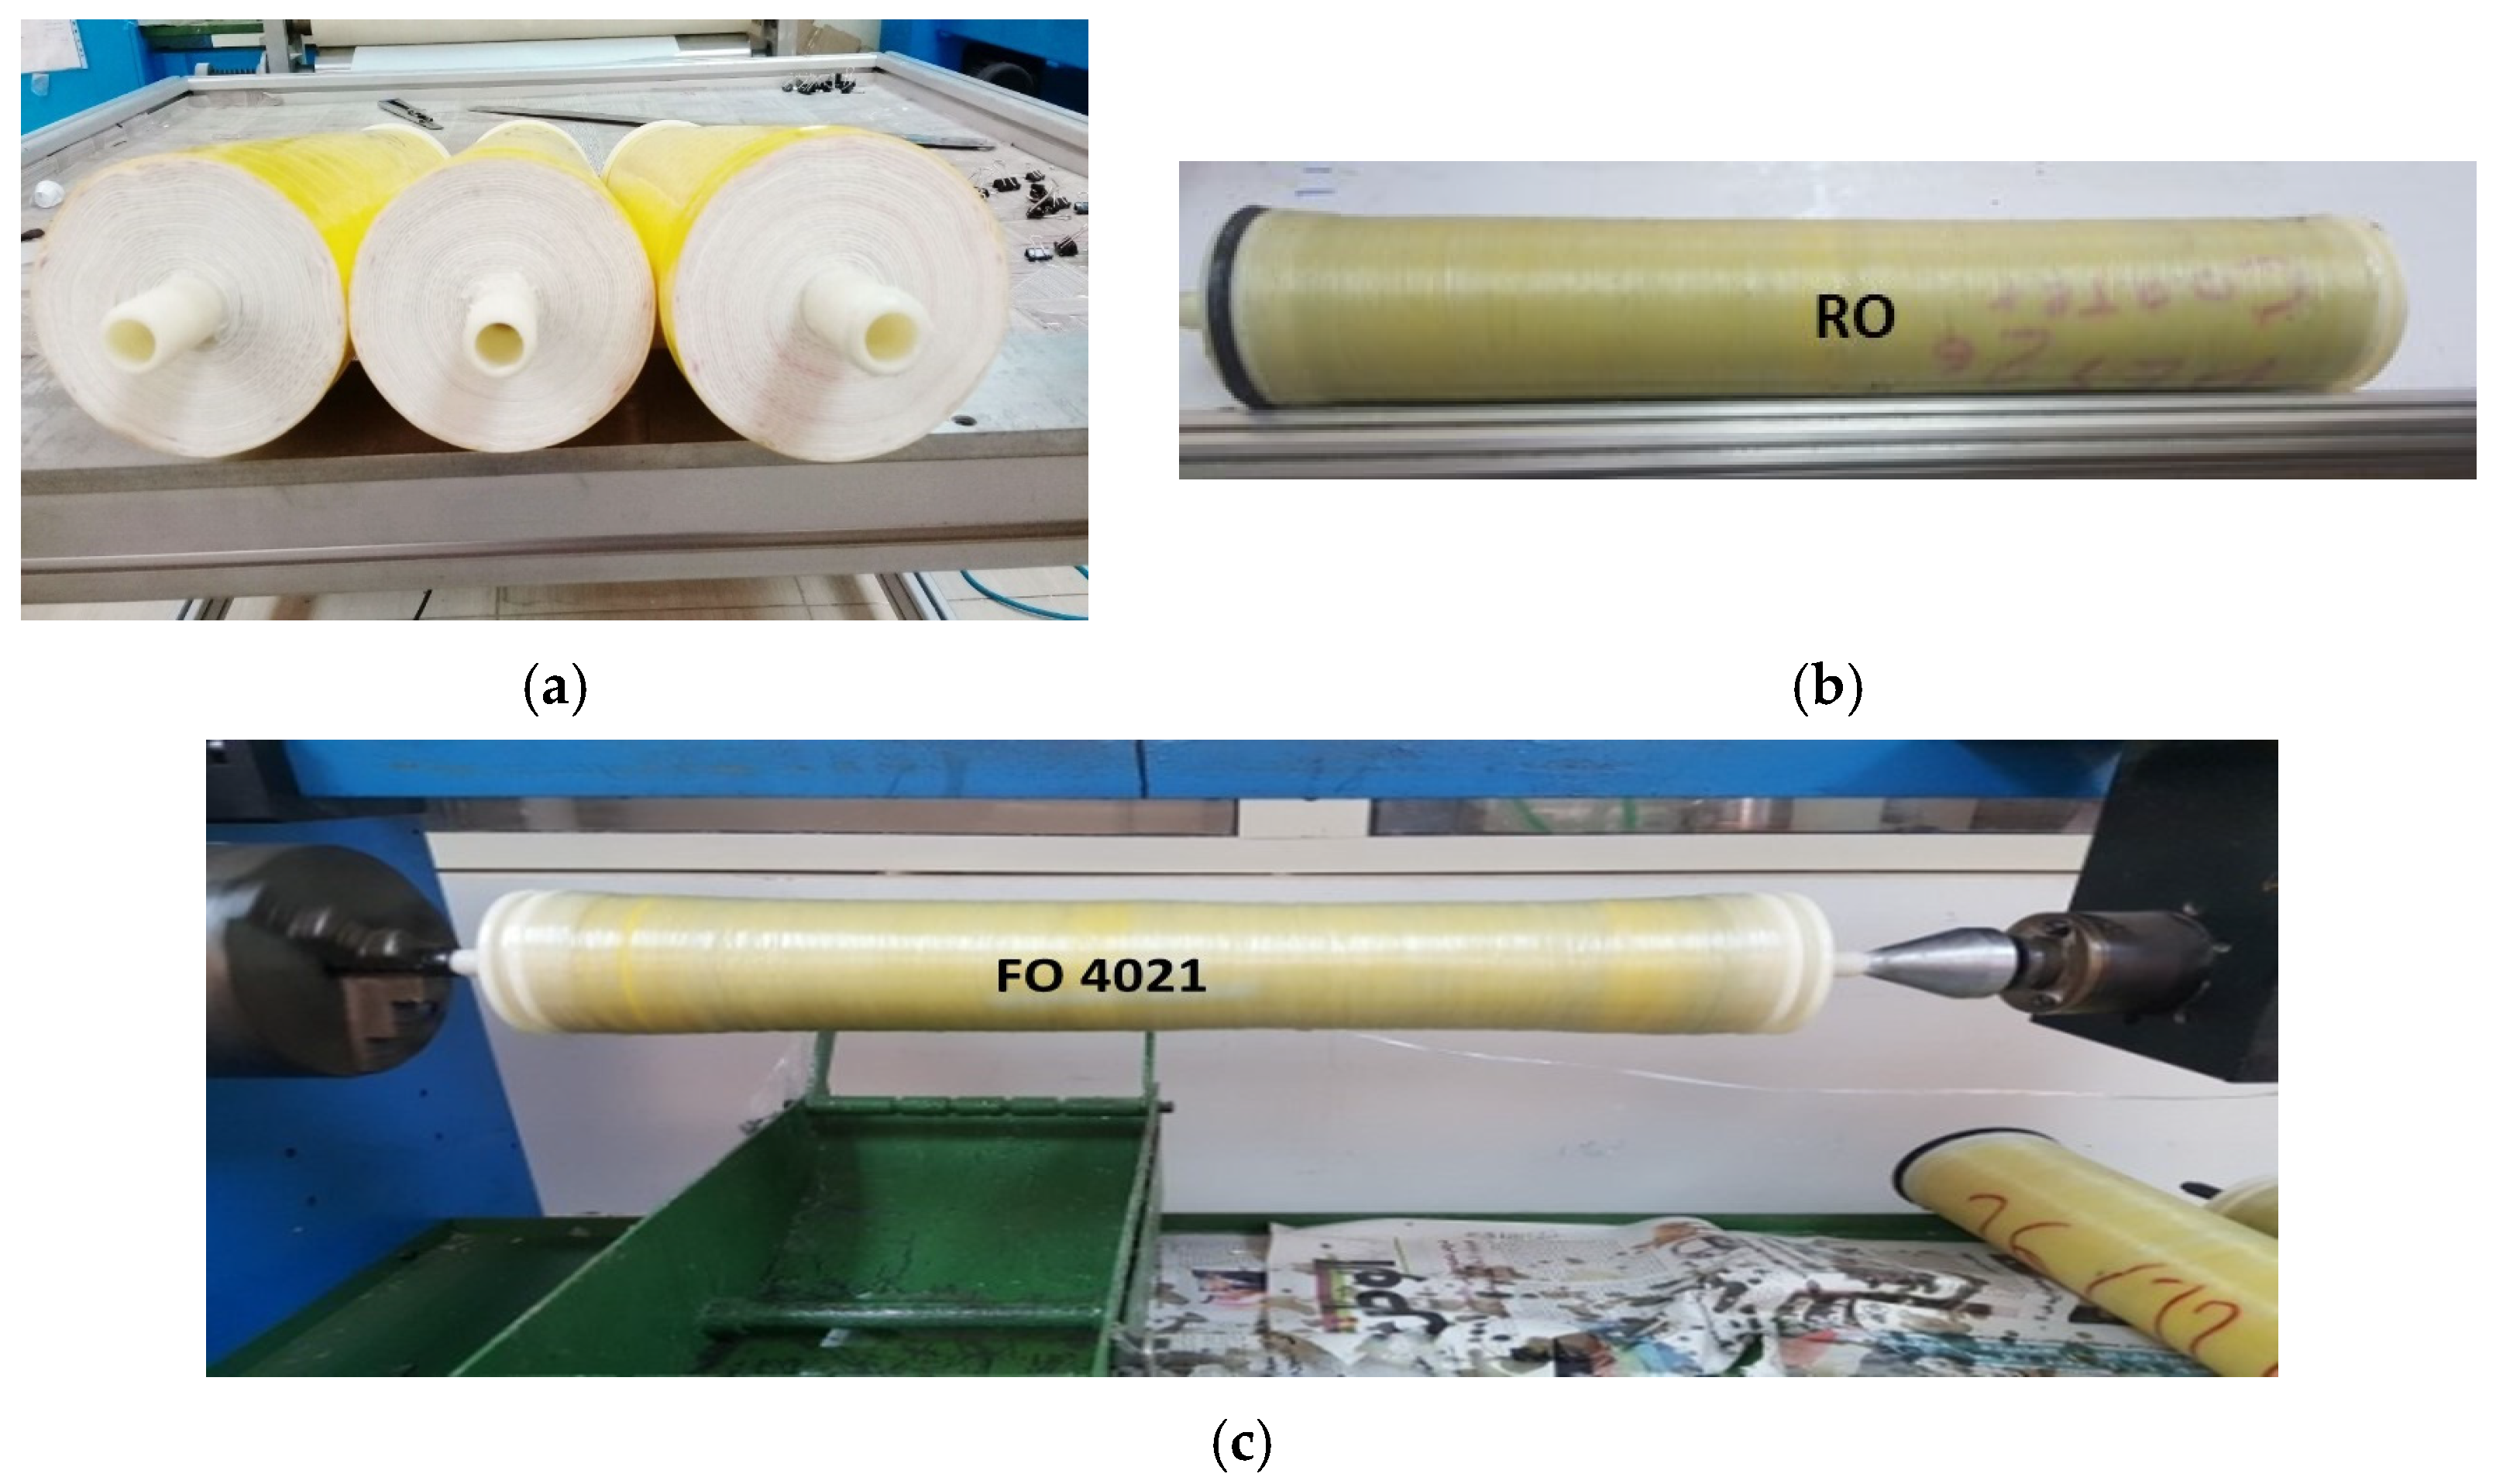
For the RO membrane module, five folders of prepared membranes were used. Between each folder, there was a feed spacer (made of polyvinylchloride), while the backside of the membrane was glued on three sides with a permeate carrier (made from polyester). After rolling, the side of the membrane modules were cut as shown in Figure 2a. The surface area of the prepared RO spiral-wound membrane module was 4.5 m2, and the module was coated by fiberglass by winding machine as shown in Figure 2b.
For the FO membrane module, four folders of prepared membranes were used. Between each folder, there was a feed spacer, while the backside of the membrane was glued on three sides with two permeate carriers and glued from the middle of the membrane to about 60 cm. The surface area of the prepared FO spiral-wound membrane module was 3.6 m2 as shown in Figure 2c. The FO module was coated also from the outside by fiberglass with the winding machine.
All prepared modules were coated with fiberglass as a final step in module formation to help them withstand high pressure.
The nanoparticles and membranes were characterized by a scanning electron microscope (SEM) (QUANTA FEG250 made in Hillsboro, OR, USA), and transmission electron microscopes (TEM, Joel (HR) made in Tokyo, Japan) were located in the National Research Centre, Egypt.

2.3. Pilot Systems for Membrane Module Testing

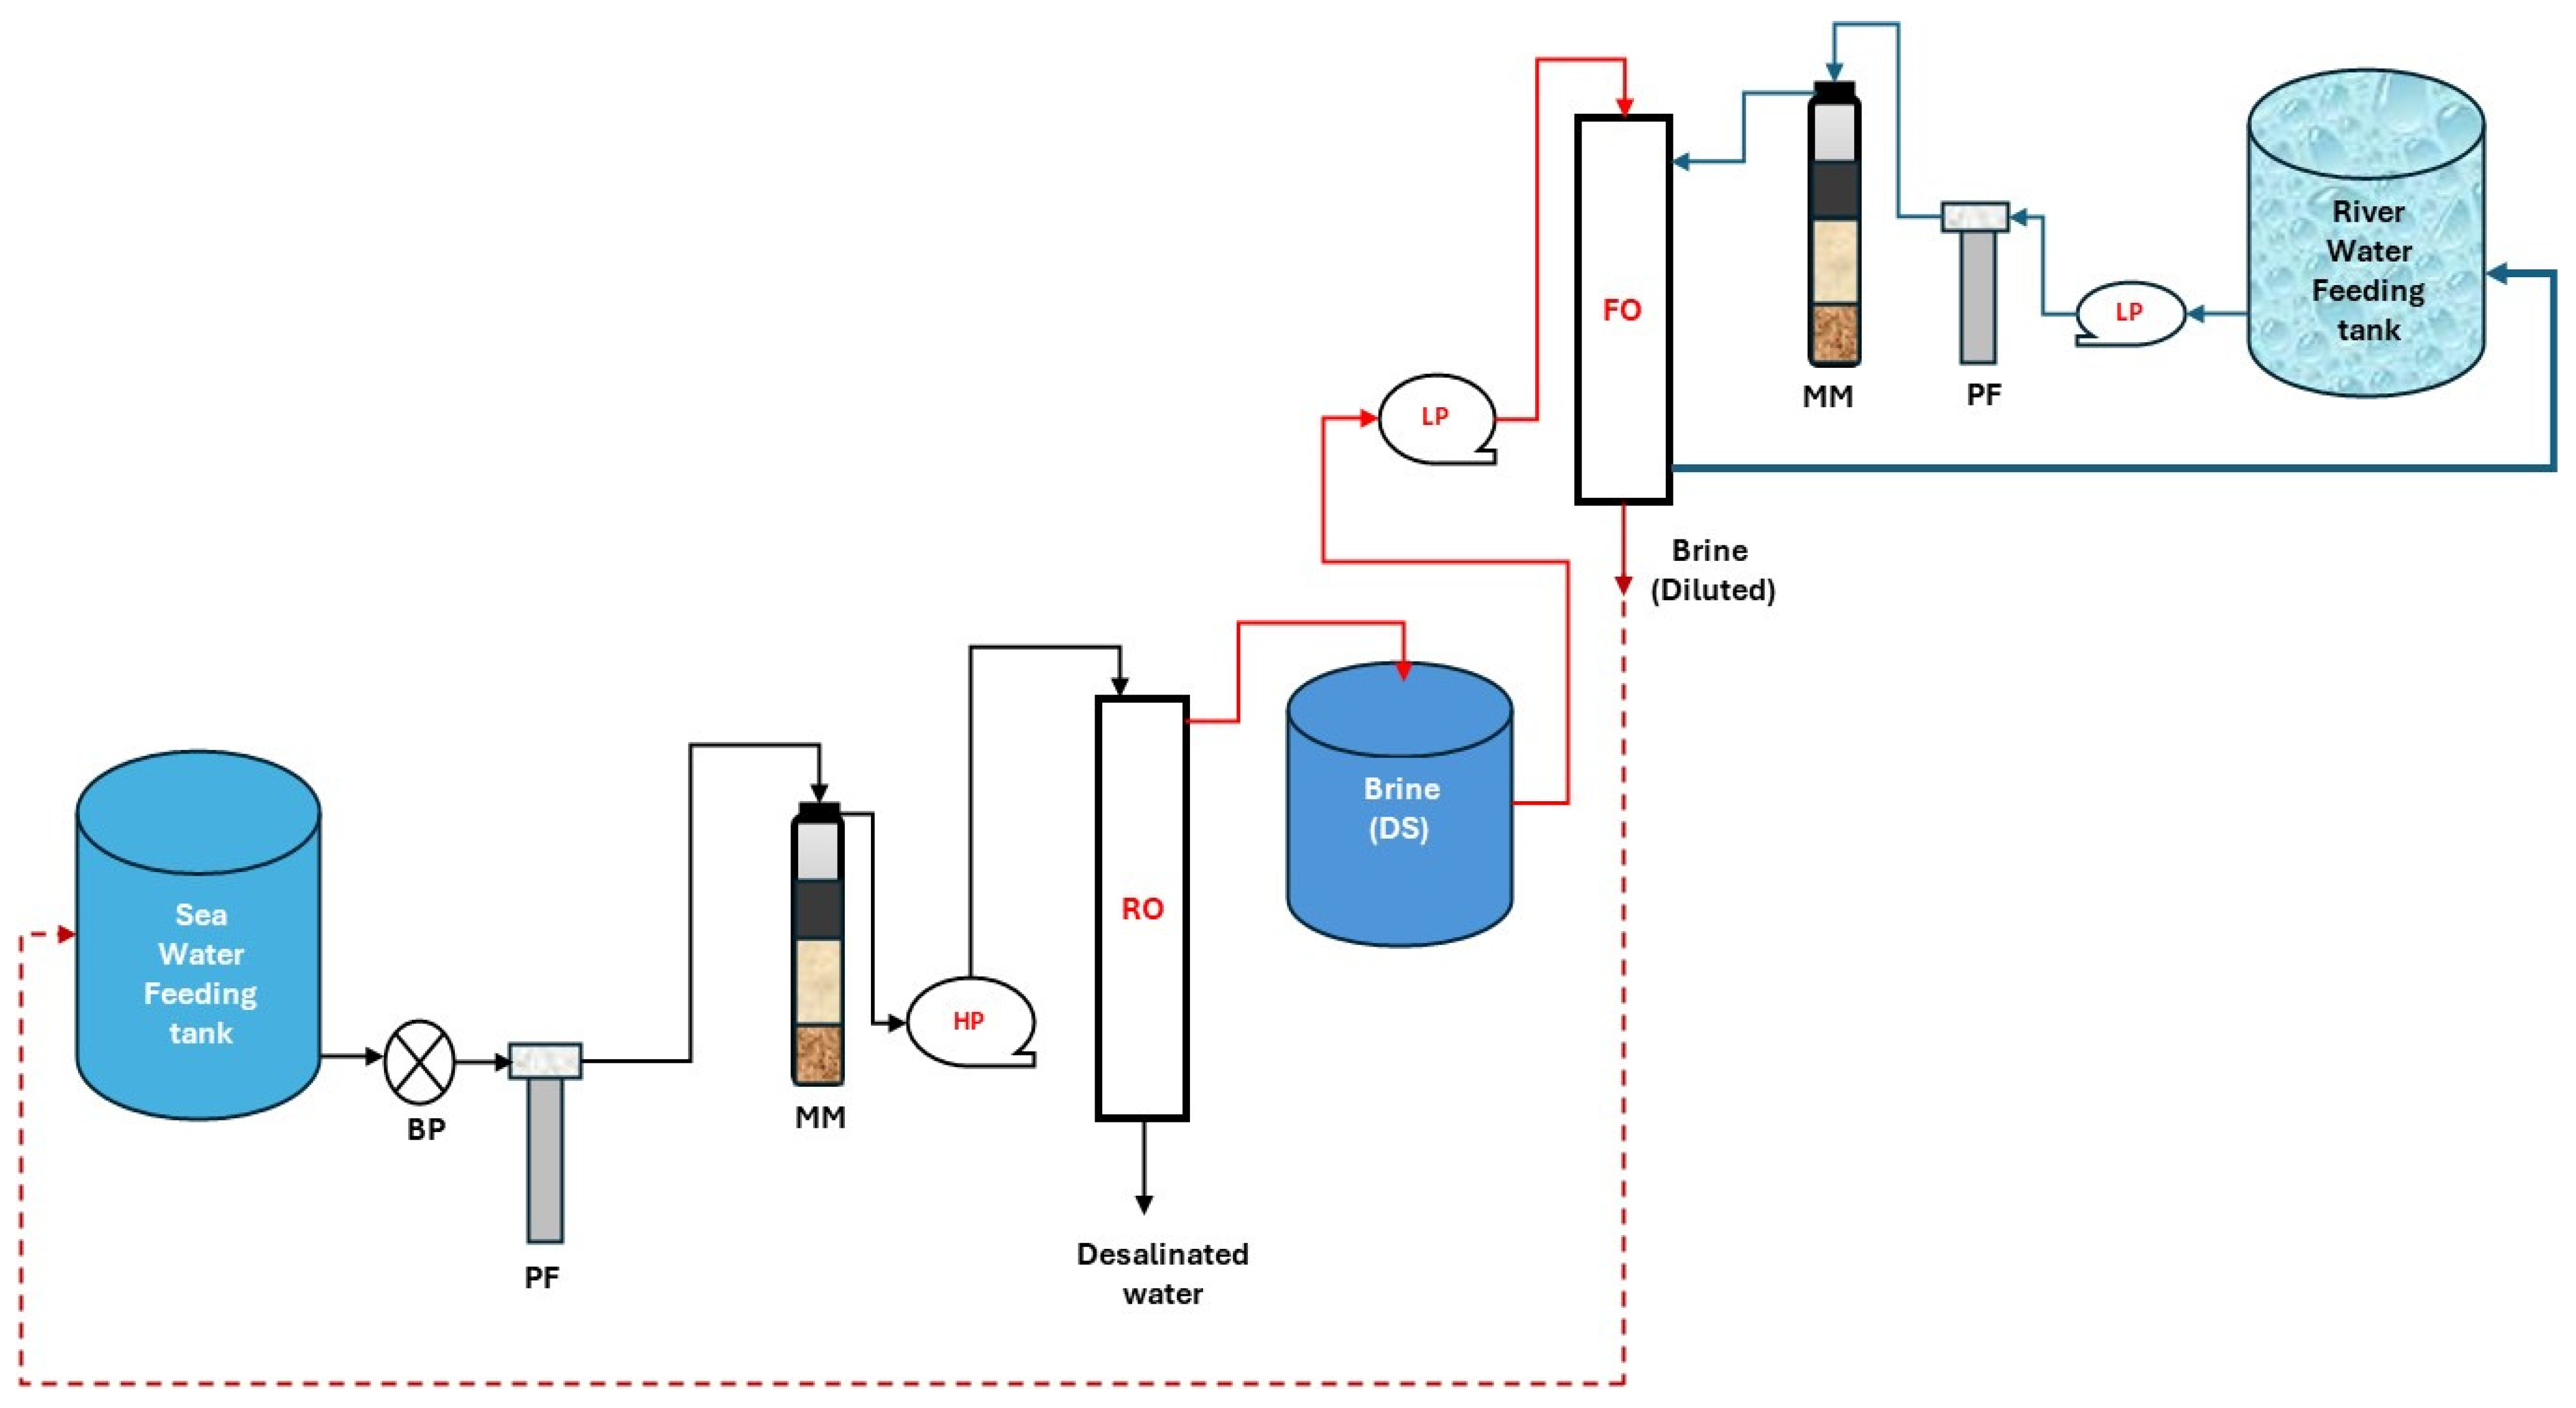
The prepared RO module was tested using a pilot unit, and the schematic diagram of the pilot unit was illustrated in Figure 3. The pilot unit composed of a feedwater tank of 90 L, a centrifugal booster pump that feeds the saline water from the feeding tank to the pretreatment step which consists of micron filters and multimedia for removing any organics, impurities, and dust from the water before entering the membrane. Then it delivered the feeding water to the RO membrane using a high-pressure pump assisted by a booster pump to overcome any pressure drop from the pretreatment step. The pump flow rate was approximately 22 L/min.
The high-pressure pump delivered pretreated water to the RO membrane module. The produced water was collected in a product tank. The product was collected in a product tank and the reject was collected in a brine tank for the FO system. The FO system consists of a brine tank as a draw solution and a feeding tank which was filled using the river samples (Ismailia Canal). Low-pressure pumps (pump flow rate was approximately 11 L/min) were used to pressurize the brine through the tube of the FO spiral-wound module, while the feeding water was fed on the membrane spiral surface. The FO system consisted of a cartridge filter and a multimedia filter to remove any impurities and large compounds from the river samples before entering the FO system. The analysis of the water samples was carried out in National Research Labs, Egypt.
In the RO experiments, the feed water to the membranes were consisted of two solutions. One was prepared by dissolving an appropriate amount of 10 g/L of NaCI and using the real sample from the Red Sea from the Suez Canal, as shown in Table 1. The running experiment readings were averaged after four days, and working daily for five hours.
The recirculation flow rate, and the transmembrane pressure, TMP, were controlled using the valves placed on the concentrate outlet pipe from the module housing.
The experiments were carried out at room temperature. The experiment parameters, like salt rejection percentage, permeate flux, transmembrane pressure, and recovery were calculated using the following equations [18,19]:
For crossflow mode of operation:
T M P = P f + P c 2 P p
where
  • TMP: transmembrane pressure (bar),
  • Pf: feed pressure (bar),
  • Pc: concentrate pressure (bar), and
  • Pp: permeate pressure (bar).
J = Q p A m
where
  • J = flux (L/m2·h)
  • Qp = filtrate flow (L/h)
  • Am = membrane surface area (m2)
  • The recovery of a membrane was calculated using Equation (3):
R c = Q p Q f × 100
where RC = recovery of the membrane unit (%)
  • Qp = filtrate flow produced by the membrane unit (L/h)
  • Qf = feed flow to the membrane unit (L/h)
  • The salt rejection (R) was calculated as follows:
R % = ( C f C p ) × 100 C f
where Cf is the concentration of the feed solution and Cp is the concentration of the permeate.
For FO experiments, the concentrated brine from RO was used as a draw solute and the feed was from Ismailia Canal, and the analysis of the sample is illustrated in Table 2. Diluted brine was recycled back to the RO system to gain more treated water and minimize the brine problems. The schematic diagram of our system is illustrated in Figure 3.
The average FO membrane fluxes were calculated using Equation (5):
J w = Q f i Q f o A m
where Am is the total effective membrane area (m2), Qfi, feed in and Qfo, feed out are the feed flow rate (LPM) at the inlet and outlet of the module, respectively.
The reverse flux of a draw solute, Js (g/m2·h or gMH), can be determined from the increase in the draw solute in the feed concentration:
J s = ( C t V t   C 0 V 0 ) t A m
where C0 (mol/L) and V0 (L) are the initial salt concentration and feed volume, respectively, while Ct (mol/L) and Vt (L) are the salt concentration and feed volume over a predetermined time Δt (h), respectively, during the test. Am (m2) is the effective membrane area.

3. Results and Discussion

3.1. Prepared Nanoparticles and Membranes Characterization

Figure 4 illustrates the TEM for nanoparticles and SEM cross-section for prepared RO and FO membranes. Figure 4a indicates the spherical shape of ZrO2 nanoparticles. Figure 4b,c indicates a blend membrane cross-section for RO and FO, which illustrates the formation of a dense blend CA/ZrO2 membrane with a sublayer that has a compacted structure for the RO membrane. The FO blend CTA/ZrO2 membrane indicated the less-thick top layer with a compacted sublayer structure, whereas the non-woven fabric was compacted with the membrane due to the low thickness of the dense selective layer.

3.2. RO Spiral-Wound Membrane Module Results

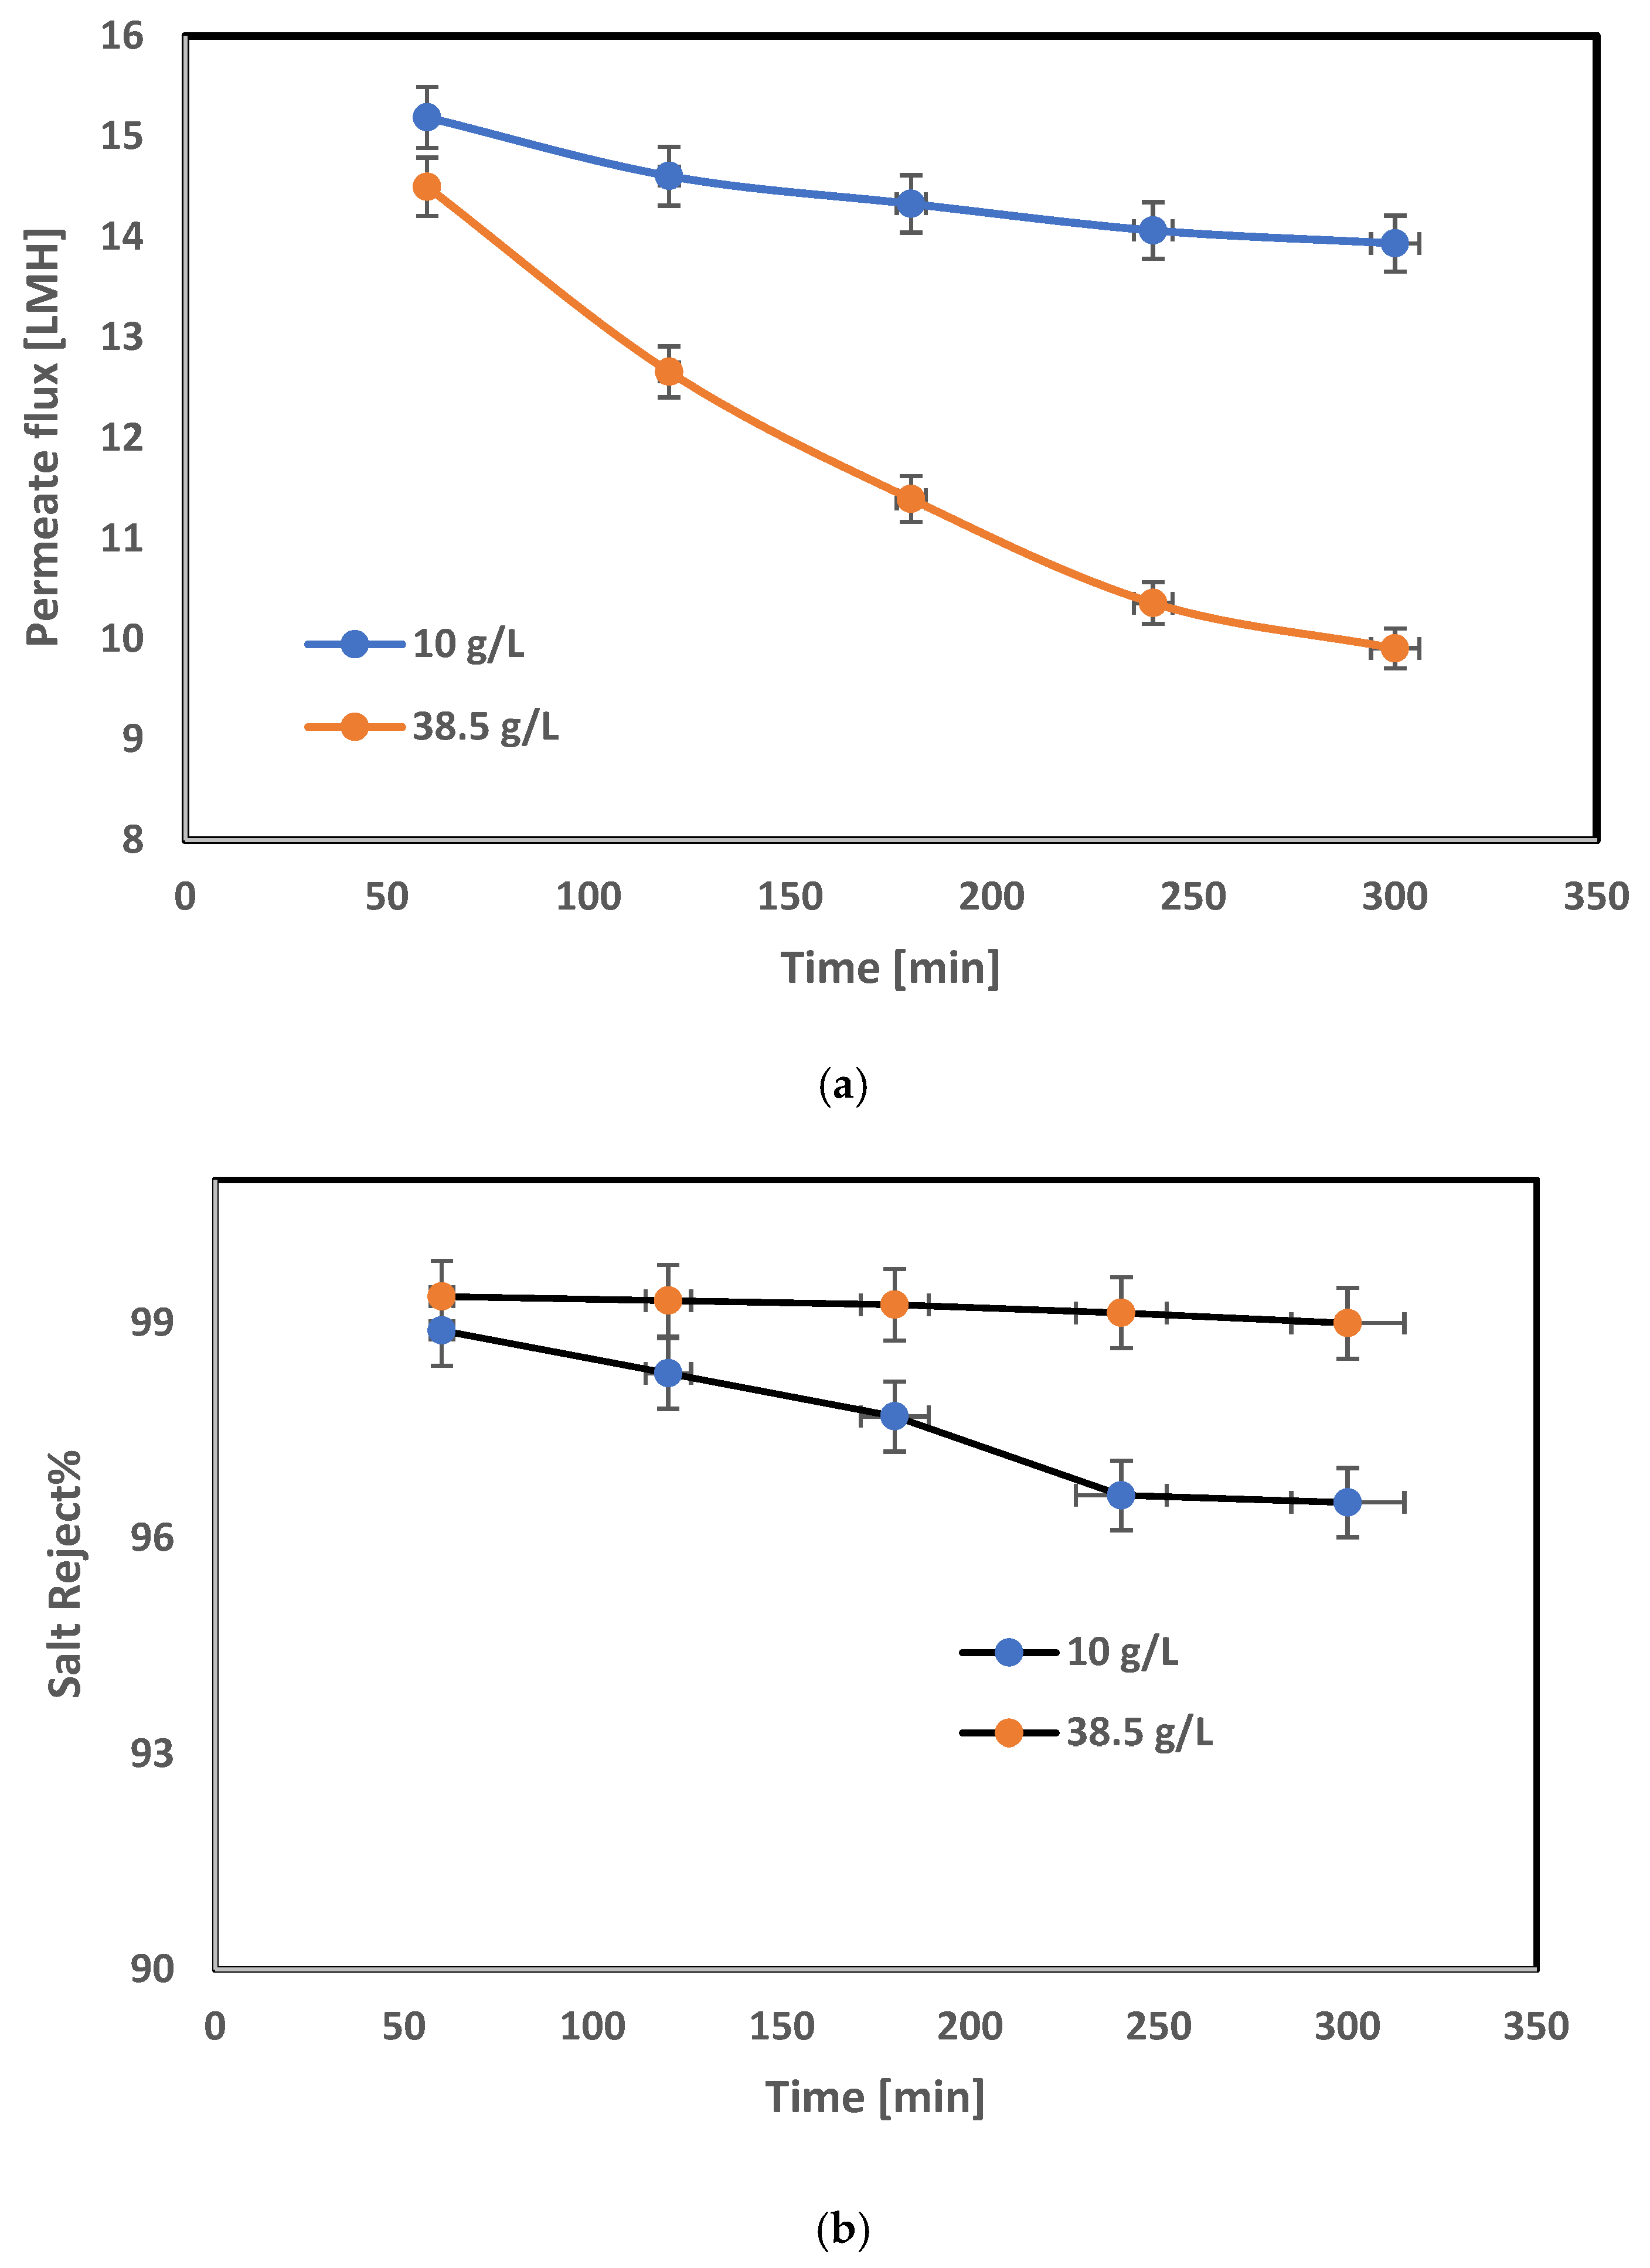
The prepared reverse osmosis blend PVA/CA/ZrO2 membrane was tested using a synthetic solution of 10 g/L of NaCl and a real sample of the seawater of 38,528 ppm. The pressure was adjusted to be 60 bar for all experiments for 4 days. Figure 5 indicates the effect of the increase in the feed concentration on the permeate flux, where the permeate flux reduced from 0.365 to 0.121 m3/m2·h for the desalination of feed concentration (10 g/L) 10,000 ppm to 38,528 ppm (38.5 g/L), respectively. However, the flux reduced during the time operation from 15.2 LMH to 13.9 after 5 h for a feed concentration of 10,000 ppm and reduced from 14.5 LMH to 9.9 LMH for a desalinating feed of 38,528 ppm as shown in Figure 5a. The permeate flux reduced with filtration time due to an increase in the concentration of polarization due to the high separation of the salts over the membrane surface [20].
The salt rejection of the prepared RO module reached 96.5% for the concentration of 10 g/L NaCl and 99% for the seawater concentration as shown in Figure 5b. The results indicate a slight reduction in salt concentration due to using nanoparticle ZrO2 during membrane preparation, which enhances the membrane performance, especially in salt rejection, because ZrO2 was considered a famous additive used for resisting the adsorption of the foulants on the surface, where the interaction between these kinds of nanoparticles and salts enhances the anti-fouling membrane behavior. Also, adding ZrO2NPs in the mixed matrix membrane preparation led to a high rejection of seawater due to the removal of hardness from water. So, the addition of ZrO2NPs led to the reduction in the accumulated salt on the surface of the membrane, which facilitated the removal of these salts by shear force [21].
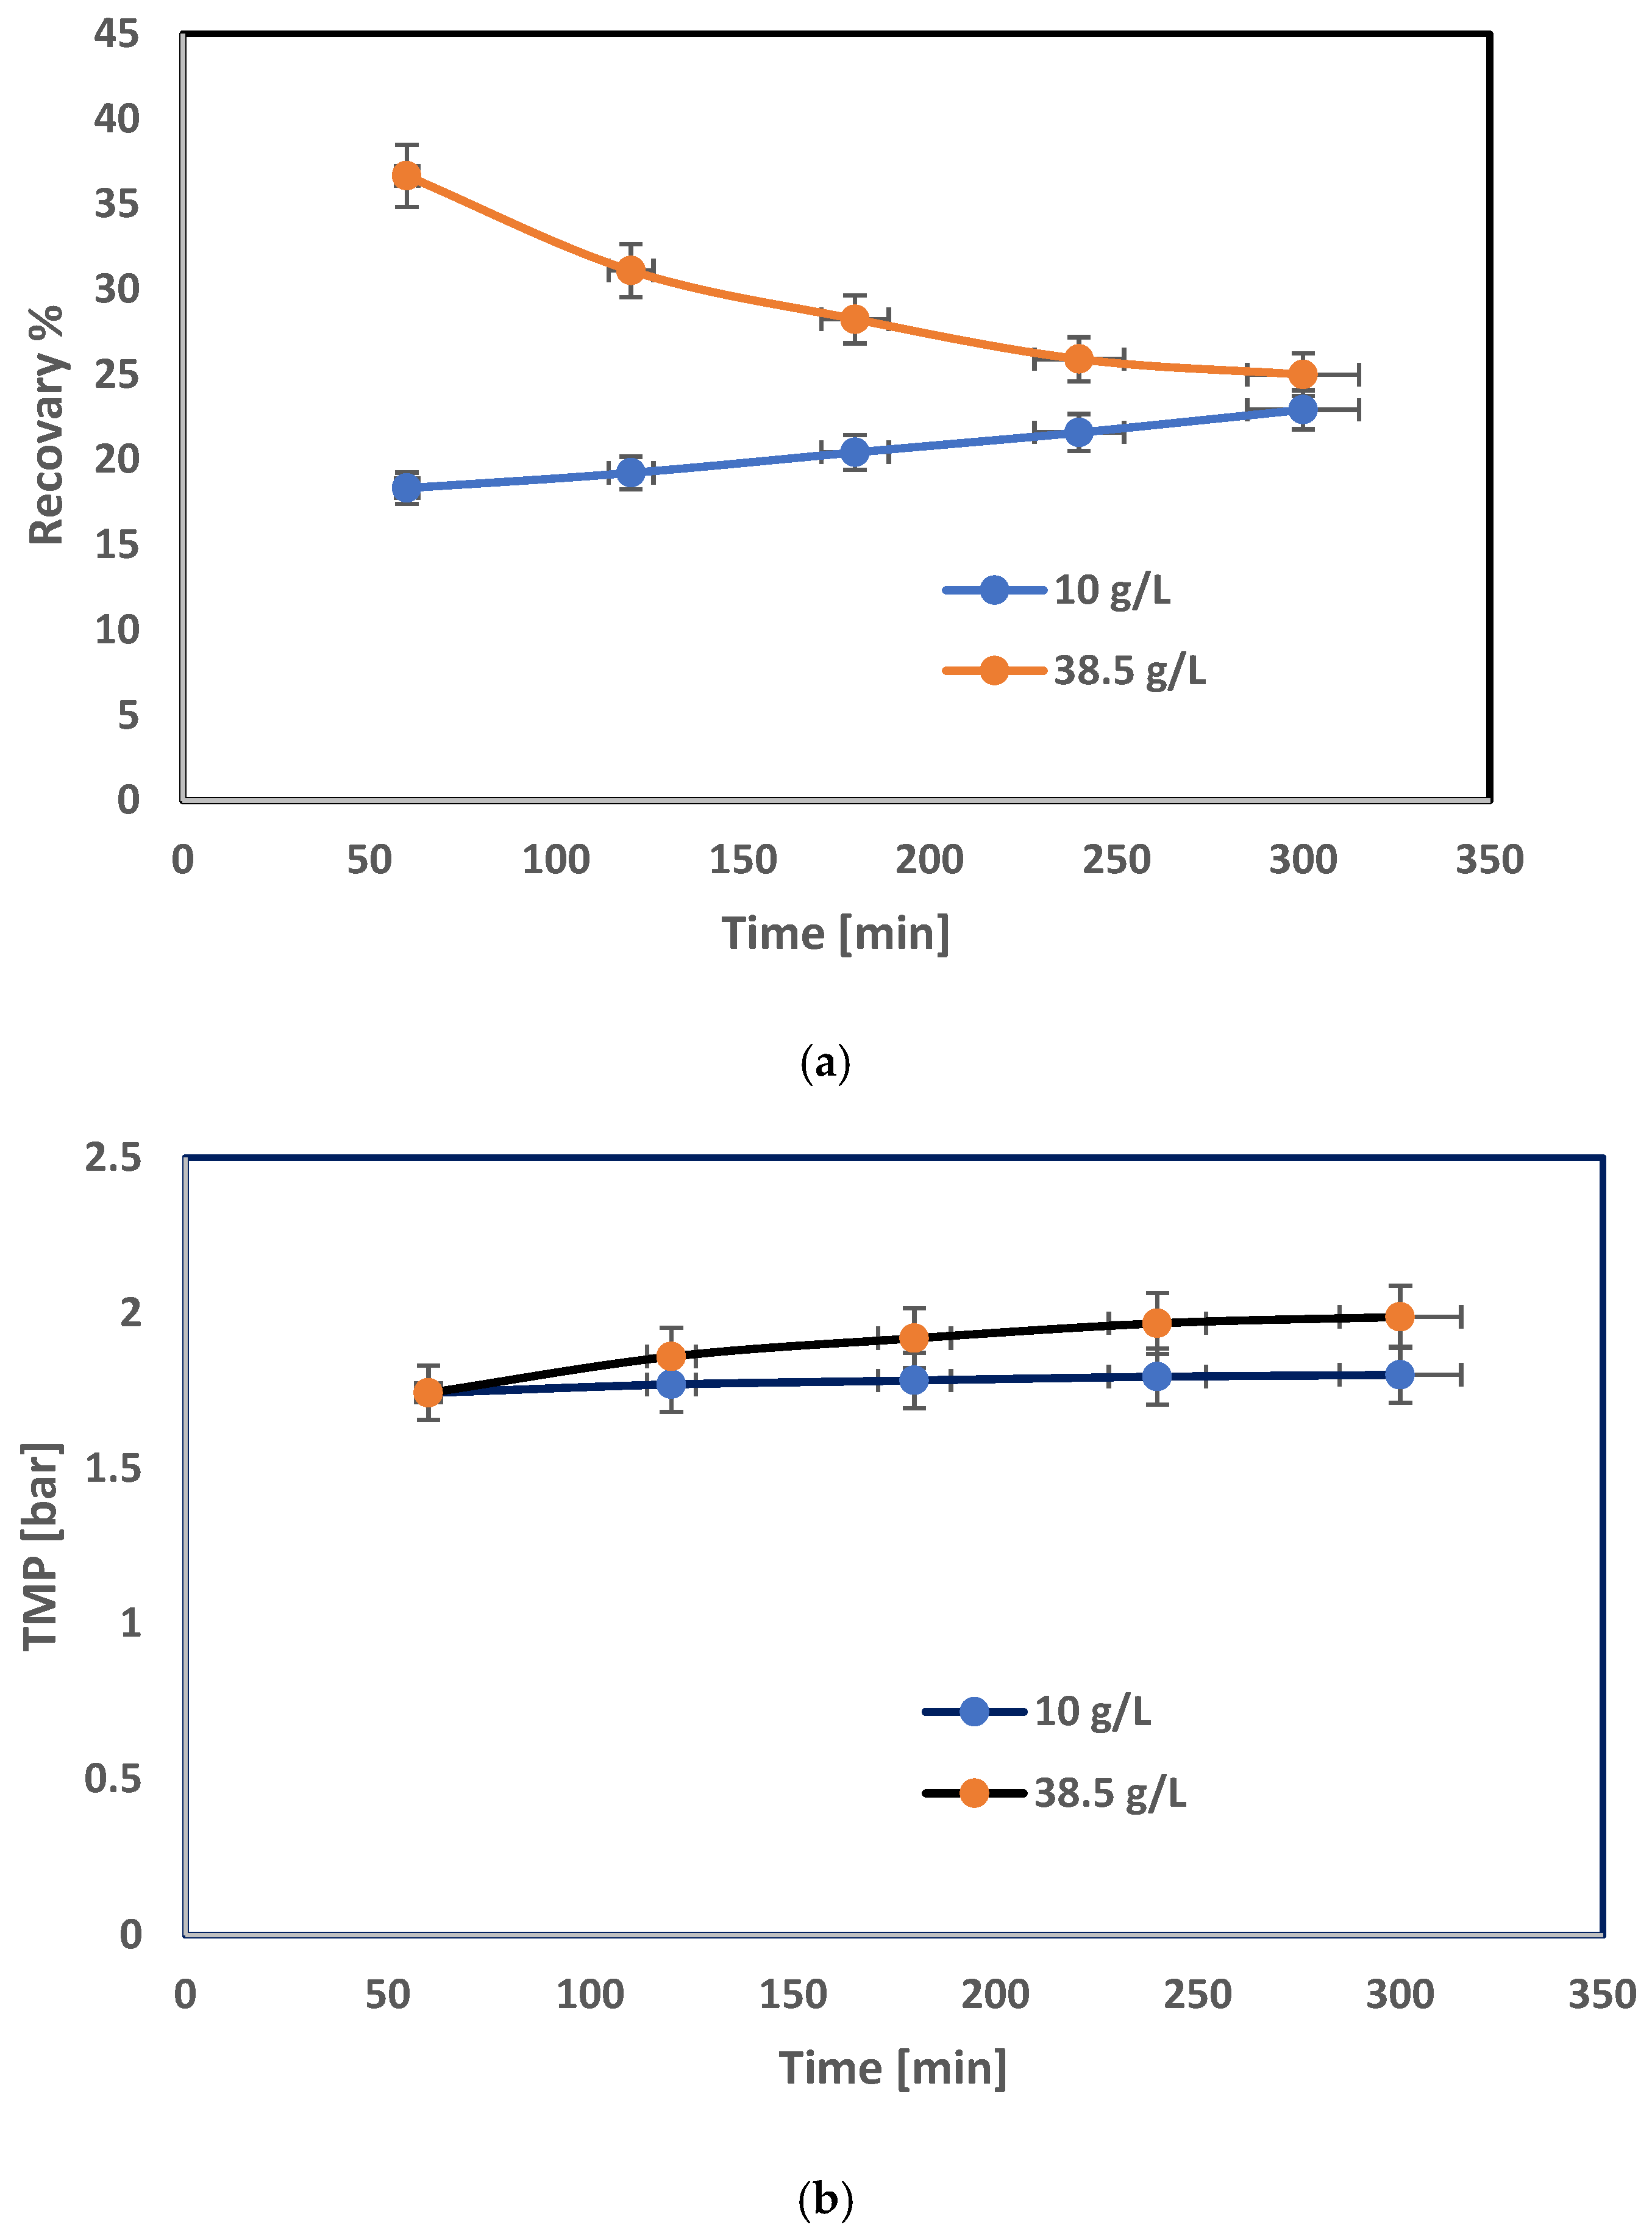
The average recovery of this membrane module was 22.9% for a feeding concentration of 10 g/L ppm and 25% for feeding 38,528 ppm after 5 h of operation as shown in Figure 6a. However, the TMP in the high concentration of the feed was noted due to the fast fouling of the membrane which led to a flux decline as shown in Figure 6b; TMP was 1.8 bar for a feed concentration of 10 g/L and 1.99 bar for a feed concentration of 38.5 g/L. Through a variety of processes, including pore block, cake formation, and concentration polarization, the resistance to permeation rises during an experiment. The permeate flux decreases with increasing membrane resistance in constant TMP operation, but TMP increases with increasing resistance with constant flux operation. In this work, TMP rises slowly due to two reasons: first was the high rejection of salts by the membrane, and the second was the low resistance of the membrane because accumulated salts did not adsorb on the membrane surface due to the existence of ZrO2NPs on the membrane selective layer which led to the repulsion of salts out of the surface [22]. As shown in Figure 5b, the rejection of 10 g/L of a single concentration of NaCl was less than the rejection of seawater concentration because the rejection of sodium ions increases when TMP increases, then the rejection reduced due to electrostatic repulsion attraction of chloride ions and negative charges on the surface [23].
The ZrO2NPs can influence the interaction between solvents and polymers in addition to improving water transport in polymeric membranes [24]. The resistance of the membrane to fouling was calculated as shown in Table 3. The results indicate that Rr which is reversible resistance was higher than irreversible resistance which means that the cleaning of the membrane can be easier because the reversible resistance indicates a cake layer formation on the membrane surface without pores clogging which means that cleaning can be carried without the need for harsh chemicals [24].

3.3. FO Spiral-Wound Membrane Module Results

The first experiments of the FO were carried out using seawater (draw solution) and river water (feed). Draw solution (seawater) was drawn from the draw solution tank to the perforated tube side. The freshwater from the river was used as a feed source and was followed through the membrane surface. Figure 7 indicates the effect of hydraulic pressure on the draw solution side and hydraulic pressure on the feed side on the dilution percentage and draw solute concentration. Using 1 bar of draw solute to 2 bar of feed water provides a dilution percentage of 76.3%, where the draw solute concentration reduced from 38.85 g/L to 9.45 g/L after 270 min as shown in Figure 7a. However, increasing the pressure of the draw solute to 3 bar over the pressure of the feed which was 2 bar led to an increase in dilution percentage to 80%, which reduced to 8 g/L as shown in Figure 7b. Using the same pressure of both sides in the feed and draw solute provided a low dilution of 61.7%, while the concentration of draw solute reduced to 16 g/L as shown in Figure 7c.
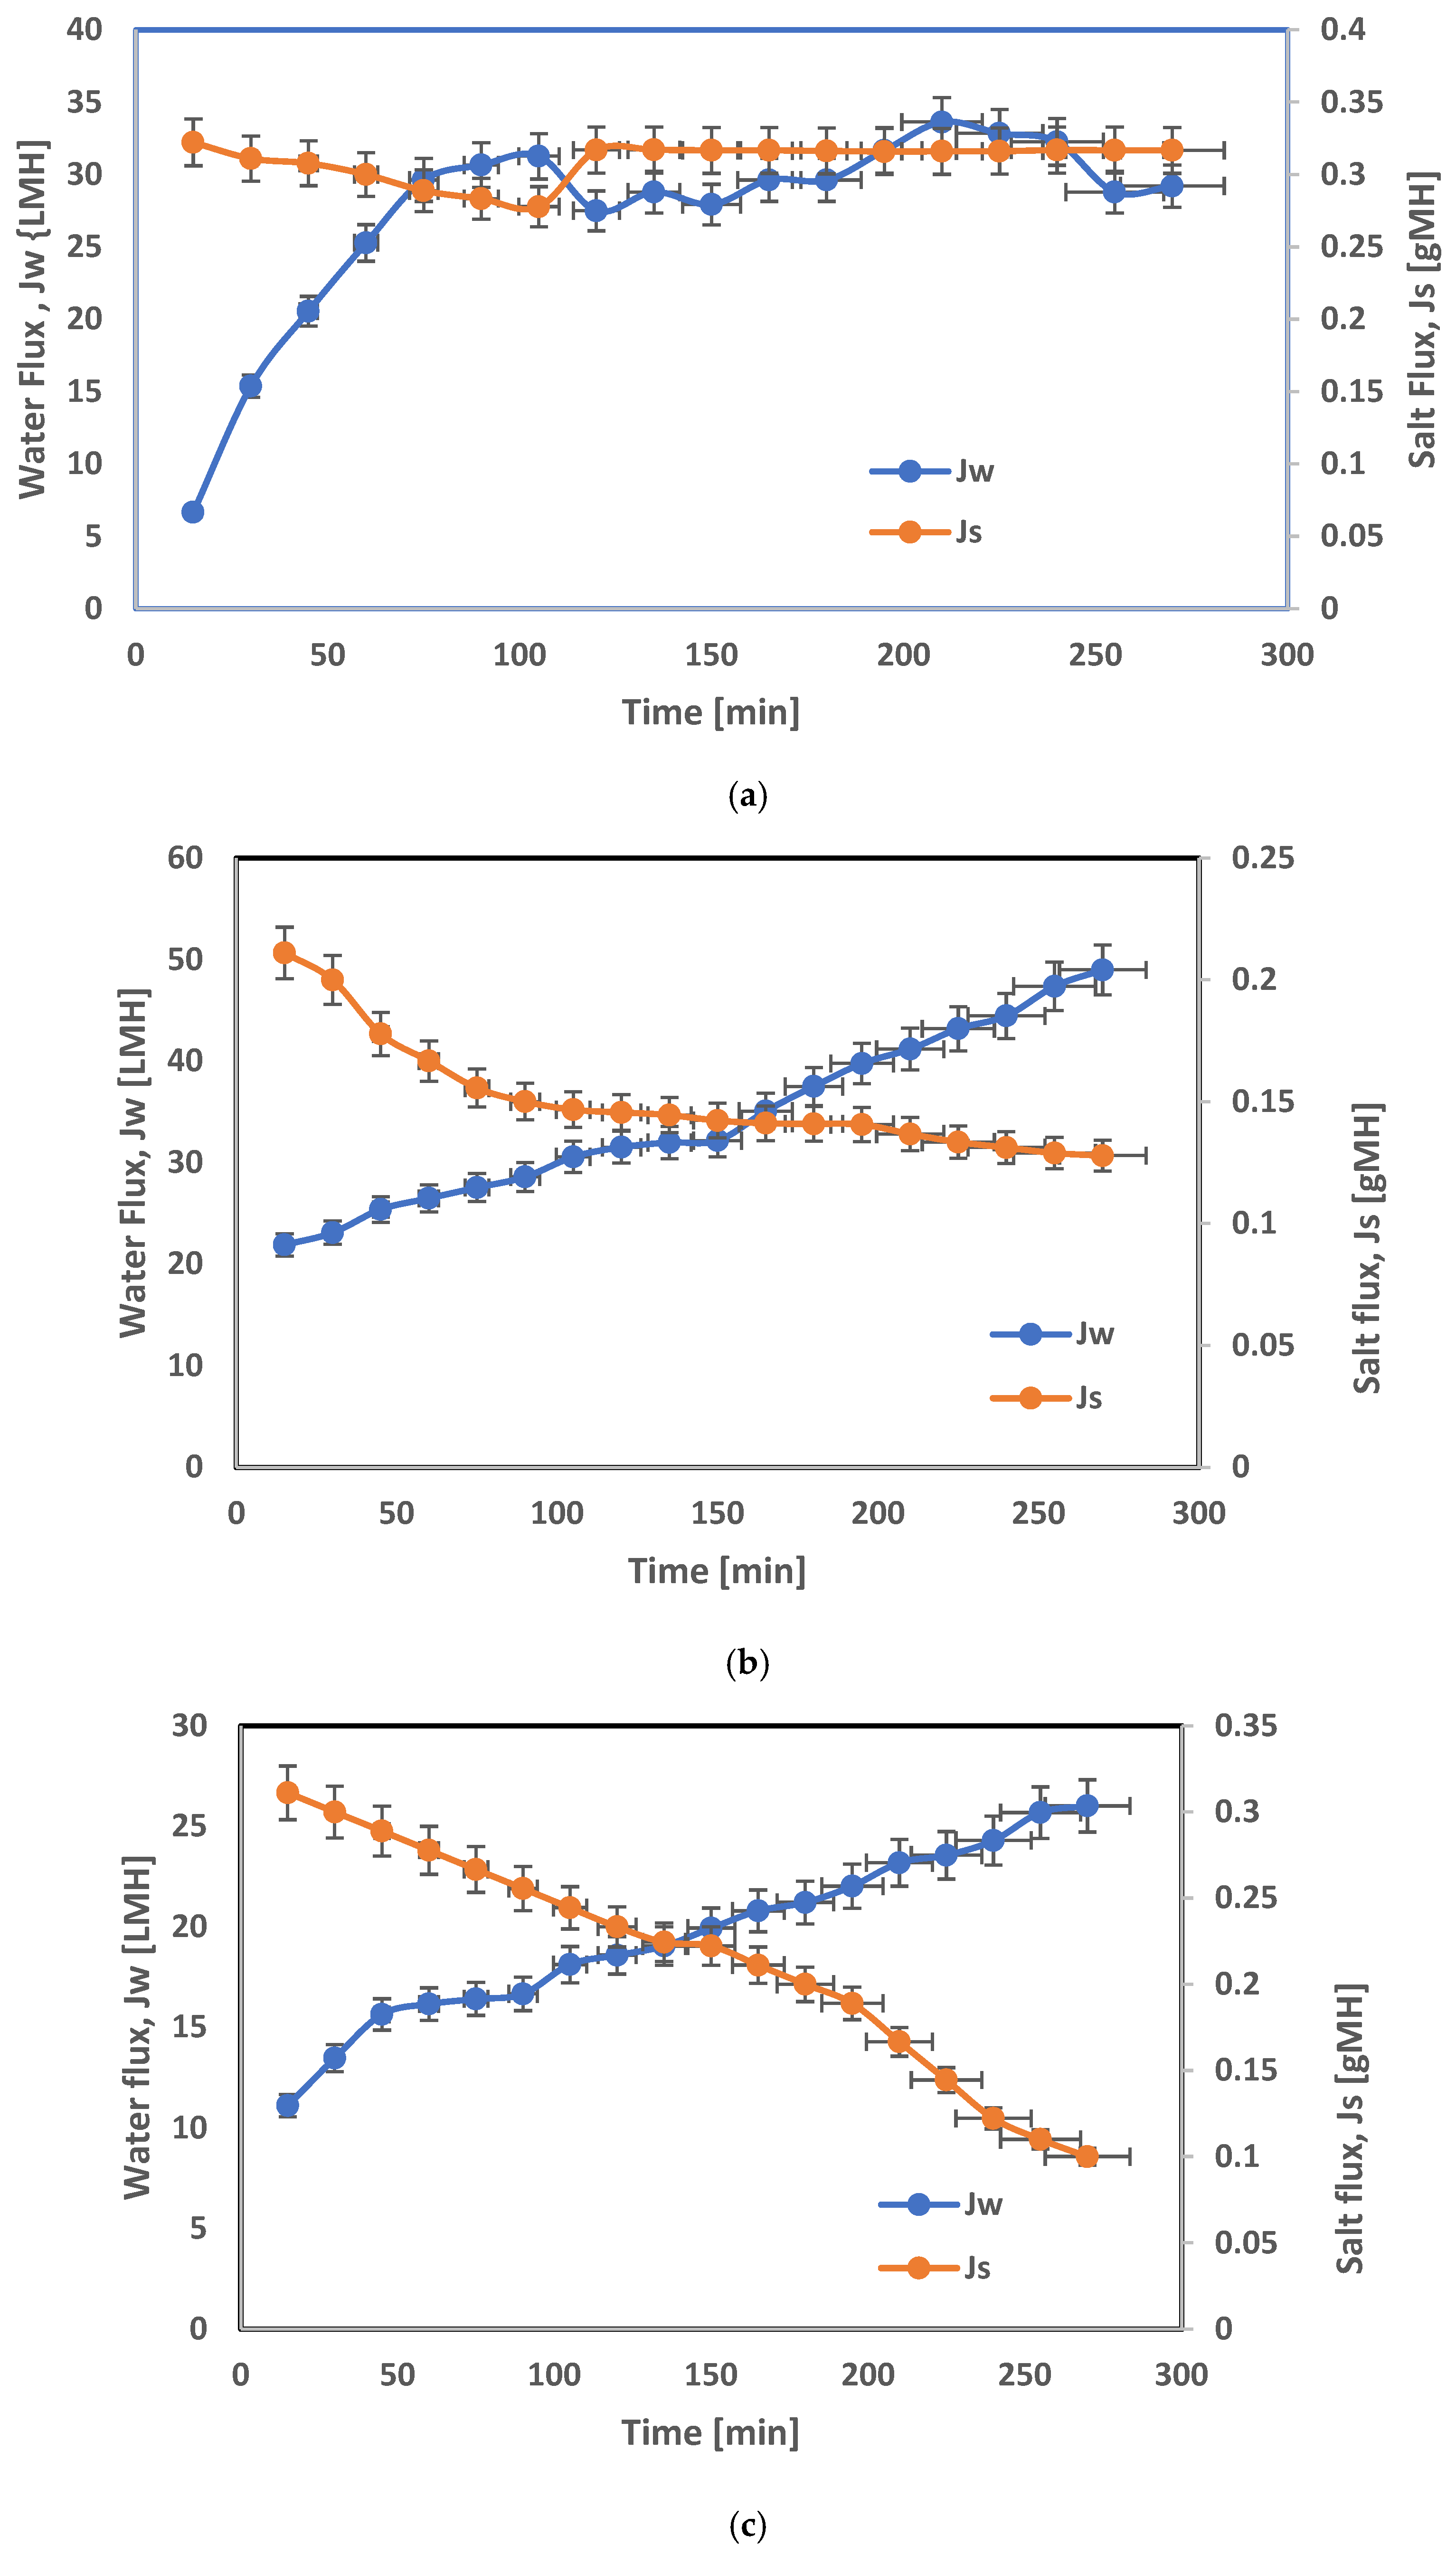
Figure 8 indicates the effect of hydraulic pressure in the draw solution side and hydraulic pressure in the feed side on the salt flux and water flux from the feed water. Using 1 bar of draw solute to 2 bar of feed water provides a water flux of 29.4 LMH, and the salt flux was slightly reduced after 270 min from 0.33 gMH to 0.32 gMH, as shown in Figure 8a. However, increasing the pressure of the draw solute to 3 bar over the pressure of the feed provided high water flux of 48.98 LMH, while the salt flux reduced from 0.21 gMH to 0.128 gMH as shown in Figure 8b. Using the same pressure of both sides in the feed and draw solute provided a water flux of 26.7 LMH and the salt flux reduced from 0.31 gMH to 0.1 gMH as shown in Figure 8c. Figure 9 indicates the effect of the draw solute pressure side and the feed pressure side on the water flux and dilution %.
Results indicate that the water flux through the FO membrane increased with increasing pressure of draw flow and the dilution percentage of draw solute was increased by the water flow in the 4021 FO module. Increasing the pressure of the feed provided low water permeates due to the effect of feed space which performed a pressure drop during the process which affected the mass transfer coefficient; the effect of the pressure of the draw solution was higher than the effect of the pressure of the feed on the water flux. This was also due to the low salt concentration on the river water which provided a low contribution of concentration polarization. Increasing the pressure of the draw solute increased the water permeate through the membrane and the dilution percentage of the draw solute. On the other hand, the water flux was slightly reduced during operation time for all results because two solutions were recycled and their concentrations were changed [25,26]. However, the results indicate low salt reverse flux, which means the prepared membrane from CTA with ZrO2 eliminated the salt flux and prevented the build of salt on the draw solution side, which was the main reason for high water flux [26].

3.4. Integrated Membrane RO/PAO System Results

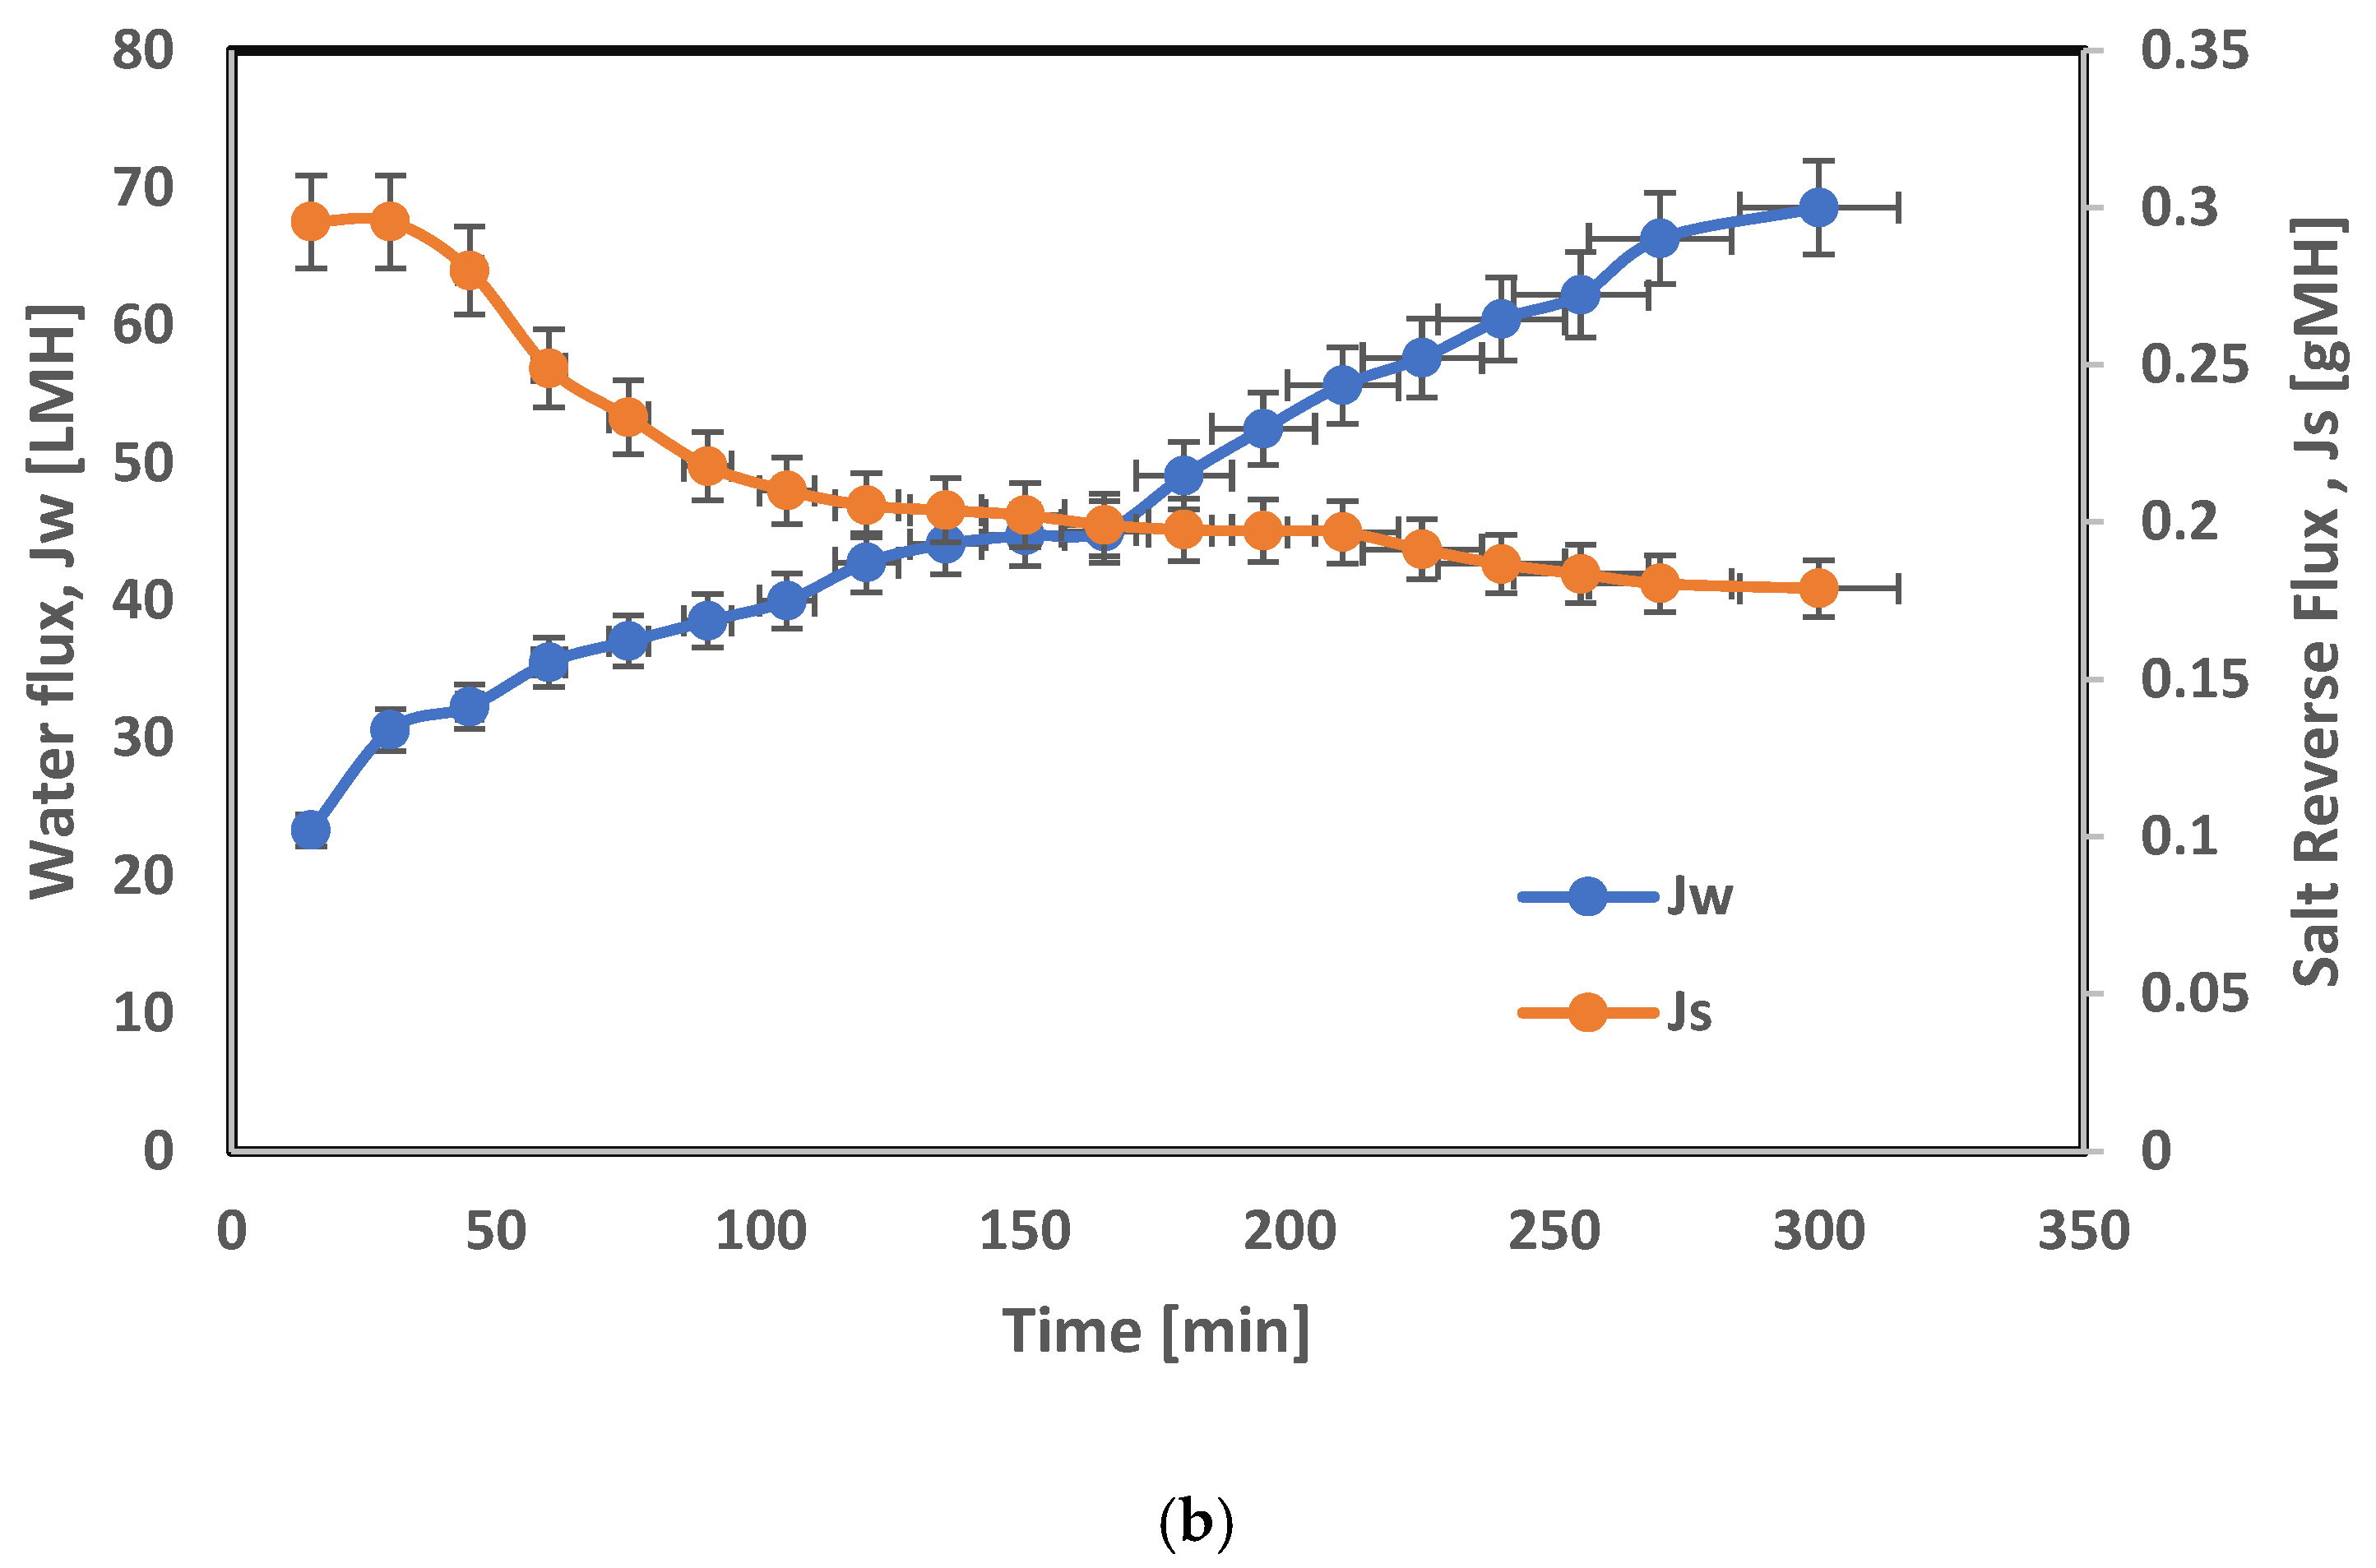
Pilot experiments were carried out using seawater with a salinity of 38,528 ppm as a feed for RO at an operating pressure of 60 bar. The treated water from the RO unit was 390 ppm, while the brine concentration was 76,814 ppm. The brine was drawn to the draw solution tank of the PAO system. The pressure of the draw solute was adjusted to 3 bar and the river feed water (TDS of 282 ppm) was adjusted to 2 bar. The results indicate that the high salinity of the brine increased the water drawing. Therefore, the dilution percentage increased which reached 93.2% after 5 h. On the other hand, the TDS of the DS reduced from 76,814 ppm (76.8 g/L) to 5200 ppm (5.2 g/L) after 5 h of operation time as shown in Figure 10a.
The PAO process is sensitive to feed and draw solution concentrations. An increase in feed TDS leads to a drop in membrane flux. Nonetheless, when the feed TDS increased, the concentration of the diluted draw solution rose due to a decrease in the osmotic pressure gradient across the membrane. Increasing the pressure gradient in the draw solution leads to a system operating as PRO due to the increased water flux [14,15]. But in our case, the pressure was less than osmotic pressure; therefore, it was considered pressure-assisted osmosis (PAO). Because the draw solution of the FO-PAO system contained a concentrated RO brine, it displayed the great driving force of osmotic pressure [27]. However, pressure-assisted osmosis (PAO) using pressure from the feed side and draw side led to a reduction in salt flux from 0.3 g/m2·h to 0.18 g/m2·h, which led to the elimination of the fouling of the membrane [28].
In this work, we combined two processes, pressure-retarded osmosis (PRO) and pressure-assisted osmosis (PAO). PRO is an osmotic pressure-driven process based on partially pressurized brine (draw solution), less than the osmotic pressure, where the required hydraulic pressure to overcome the osmotic one should be over 80 bar due to the high salinity of the brine. So, the force of osmotic pressure plays its role in transporting the feed to the draw solution and causing a high dilution percentage, so the effect of low pressure in the draw solution side provided more initiation of osmotic pressure leading to an increase in the flux of the feed water [28].
As a result of the effect of low hydraulic pressure, and if the active layer of the membrane faces the feed solution, then this leads to an increase in the concentration polarization [29]. Blandin et al., 2017, studied PAO in the Red Sea as a draw solution and deionized water as a feed solution. where increasing in the hydraulic pressure leads to increase in the water flux from 14 LMH at 0 bar to 24 LMH at 6 bar [27,28,29,30,31].
The comparison of the results and previously published research articles for the enhancement of RO and FO membranes based on cellulose acetate with different nanoparticles are illustrated in Table 4.

4. Conclusions

In this study, the integrated system of reverse osmosis and pressure-assisted osmosis (PAO) was investigated using the effect of hydraulic pressure on both sides of the FO membrane. However, the RO and FO membranes were prepared and fabricated in the spiral-wound 4021 module. The RO membrane was prepared using blending techniques between cellulose acetate, polyvinyl alcohol, and ZrO2, and the performance of the membrane was tested using the Red Sea water samples and a synthetic sample of 10 g/L of NaCl. The RO membrane provided a high salt rejection of 99% for seawater desalination. The FO membrane was prepared using blending between cellulose triacetate and ZrO2. Different pressures were applied to test the FO membrane as the PAO process by applying different pressures on both sides of the membranes. On the feed side, river water was used, while on the draw side, seawater was used. The best results were for applying 3 bar as hydraulic pressure in the draw solution side and 2 bar on the feed side, where the water flux reached 48.98 LMH after an operation time of 5 h with a dilution percentage of 80% and a low salt reverse flux of 0.128 g/m2·h. The integrated system of RO and PAO was studied using the brine from the RO unit as a draw solute concentration of 76,814 ppm and the riverside salinity of 282 ppm. The results indicate that using high salt concentration as brine under the hydraulic pressure of 3 bar and 2 bar on the feed side plays a great role in increasing the water flux to 68.6 LMH and reducing the salt reverse flux to 0.18 g/m2·h, because PAO displays the great driving force of osmotic pressure.

Author Contributions

Writing—original draft, H.A. and E.S.M.; supervision, S.O.A.; writing—review and editing, H.A. and E.S.M. All authors have read and agreed to the published version of the manuscript.

Funding

This research received no external funding.

Data Availability Statement

Data are contained within the article.

Conflicts of Interest

The authors declare no conflicts of interest.

References

  1. Zhao, D.L.; Zhou, W.; Shen, L.; Li, B.; Sun, H.; Zeng, Q.; Tang, C.Y.; Lin, H.; Chung, T.S. New directions on membranes for removal and degradation of emerging pollutants in aqueous systems. Water Res. 2024, 251, 121111. [Google Scholar] [CrossRef] [PubMed]
  2. Mamah, S.C.; Goh, P.S.; Ismail, A.F.; Opia, A.C.; Ugwu, C.I. Membrane technology as viable means for water recovery: Challenges and future directions. J. Resour. Recovery 2024, 2, 1020. [Google Scholar] [CrossRef]
  3. Popova, A.; Boivin, S.; Shintani, T.; Fujioka, T. Development of high-integrity reverse osmosis membranes for enhanced removal of microorganisms. Desalination 2024, 572, 117155. [Google Scholar] [CrossRef]
  4. Mamah, S.C.; Goh, P.S.; Ismail, A.F.; Suzaimi, N.D.; Ahmad, N.A.; Lee, W.J. Flux enhancement in reverse osmosis membranes induced by synergistic effect of incorporated palygorskite/chitin hybrid nanomaterial. J. Environ. Chem. Eng. 2021, 9, 105432. [Google Scholar] [CrossRef]
  5. Cui, L.; Wang, P.; Che, H.; Gao, X.; Chen, J.; Liu, B.; Ao, Y. Co nanoparticles modified N-doped carbon nanosheets array as a novel bifunctional photothermal membrane for simultaneous solar-driven interfacial water evaporation and persulfate mediating water purification. Appl. Catal. B Environ. 2023, 330, 122556. [Google Scholar] [CrossRef]
  6. Issaoui, M.; Jellali, S.; Zorpas, A.A.; Dutournie, P. Membrane technology for sustainable water resources management: Challenges and future projections. Sustain. Chem. Pharm. 2022, 25, 100590. [Google Scholar] [CrossRef]
  7. Yu, L.; Deana, K.; Lin, L. Polymer blends and composites from renewable resources. Prog. Polym. Sci. 2006, 31, 576–602. [Google Scholar] [CrossRef]
  8. Reddya, A.V.R.; Patelb, H.R. Chemically treated polyethersulfone/polyacrylonitrile blend ultrafiltration membranes for better fouling resistance. Desalination 2008, 221, 318–323. [Google Scholar] [CrossRef]
  9. Ehsan, S.; Toraj, M. Cellulose acetate (CA)/polyvinylpyrrolidone (PVP) blend asymmetric membranes: Preparation, morphology and performance. Desalination 2009, 249, 850–854. [Google Scholar]
  10. Mansor, E.S.; Abdallah, H.; Shaban, A.M. Development of TiO2/polyvinyl alcohol-cellulose acetate nanocomposite reverse osmosis membrane for groundwater-surface water interfaces purification. Mater. Sci. Eng. B 2023, 289, 116222. [Google Scholar] [CrossRef]
  11. Jain, H.; Garg, M.C. Fabrication of polymeric nanocomposite forward osmosis membranes for water desalination—A review. Environ. Technol. Innov. 2021, 23, 101561. [Google Scholar] [CrossRef]
  12. Al-Najar, B.; Peters, C.D.; Albuflasa, H.; Hankins, N.P. Pressure and osmotically driven membrane processes: A review of the benefits and production of nano-enhanced membranes for desalination. Desalination 2020, 479, 114323. [Google Scholar] [CrossRef]
  13. Altaee, A.; Sharif, A.; Zaragoza, G.; Ismail, A.F. Evaluation of FO-RO and PRO-RO designs for power generation and seawater desalination using impaired water feeds. Desalination 2015, 368, 27–35. [Google Scholar] [CrossRef]
  14. Blandin, G.; Verliefde, A.R.; Le-Clech, P. Pressure enhanced fouling and adapted anti-fouling strategy in pressure assisted osmosis (PAO). J. Membr. Sci. 2015, 493, 557–567. [Google Scholar] [CrossRef]
  15. Blandin, G.; Verliefde, A.R.D.; Tang, C.Y.; Childress, A.E.; Le-Clech, P. Validation of assisted forward osmosis (AFO) process: Impact of hydraulic pressure. J. Membr. Sci. 2013, 447, 1–11. [Google Scholar] [CrossRef]
  16. Kim, B.; Gwak, G.; Hong, S. Review on methodology for determining forward osmosis (FO) membrane characteristics: Water permeability (A), solute permeability (B), and structural parameter (S). Desalination 2017, 422, 5–16. [Google Scholar] [CrossRef]
  17. Marghany, N.E.; Moustafa, M.M.; El-Sharkawy, A.M.; Ali, A.A. Zirconium oxide nanoparticles: Fabrication, study and application for removal of organic dye from aqueous media. Benha J. Appl. Sci. 2022, 7, 193–200. [Google Scholar] [CrossRef]
  18. Mansor, E.S.; Abdallah, H.; Shaban, A.M. Fabrication of high selectivity blend membranes based on polyvinyl alcohol for crystal violet dye removal. J. Environ. Chem. Eng. 2020, 8, 103706. [Google Scholar] [CrossRef]
  19. Li, L.; Zhang, S.B.; Zhang, X.S.; Zheng, G.D. Polyamide thin-film composite membranes prepared from 3,4,5-biphenyl triacyl chloride, 3,3,5,5-biphenyl tetraacyl chloride and m-phenylenediamine. J. Membr. Sci. 2007, 289, 258–267. [Google Scholar] [CrossRef]
  20. Liu, M.H.; Wu, D.H.; Yua, S.C.; Gao, C.J. Influence of the polyacyl chloride structure on the reverse osmosis performance, surface properties and chlorine stability of the thin-film composite polyamide membranes. J. Membr. Sci. 2009, 326, 205–214. [Google Scholar] [CrossRef]
  21. Kim, I.C.; Ka, Y.H.; Park, J.Y.; Lee, K.H. Preparation of fouling resistant nanofiltration and reverse osmosis membranes and their use for dyeing wastewater effluent. J. Ing. Eng. Chem. 2004, 10, 115–121. [Google Scholar]
  22. Huang, X.; Tian, F.; Chen, G.; Wang, F.; Weng, R.; Xi, B. Preparation and Characterization of Regenerated Cellulose Membrane Blended with ZrO2 Nanoparticles. Membranes 2022, 12, 42. [Google Scholar] [CrossRef] [PubMed]
  23. Taniguchi, M.; Kilduff, J.E.; Belfort, G. Modes of Natural Organic Matter Fouling during Ultrafiltration. Environ. Sci. Technol. 2003, 37, 1676–1683. [Google Scholar] [CrossRef]
  24. Teixeira, M.; Rosa, M.; Nyström, M. The role of membrane charge on nanofiltration performance. J. Membr. Sci. 2005, 265, 160–166. [Google Scholar] [CrossRef]
  25. Kim, Y.C.; Park, S. Experimental Study of a 4040 Spiral-Wound Forward-Osmosis Membrane Module. Environ. Sci. Technol. 2011, 45, 7737–7745. [Google Scholar] [CrossRef] [PubMed]
  26. Abounahia, N.; Ibrar, I.; Kazwini, T.; Altaee, A.; Samal, A.K.; Zaidi, S.J.; Hawari, A.H. Desalination by the forward osmosis: Advancement and challenges. Sci. Total Environ. 2023, 886, 163901. [Google Scholar] [CrossRef]
  27. Coday, B.D.; Heil, D.M.; Xu, P.; Cath, T.Y. Effects of transmembrane hydraulic pressure on performance of forward osmosis membranes. Environ. Sci. Technol. 2013, 47, 2386–2393. [Google Scholar] [CrossRef]
  28. AlZainati, N.; Saleem, H.; Altaee, A.; Zaidi, S.J.; Mohsen, M.; Hawari, A.; Millar, G.J. Pressure retarded osmosis: Advancement, challenges and potential. J. Water Process Eng. 2021, 40, 101950. [Google Scholar] [CrossRef]
  29. Blandin, G.; Myat, D.T.; Verliefde, A.R.D.; Le-Clech, P. Pressure assisted osmosis using nanofiltration membranes (PAO-NF): Towards higher efficiency osmotic processes. J. Membr. Sci. 2017, 533, 250–260. [Google Scholar] [CrossRef]
  30. Ibraheem, B.M.; Al Aani, S.; Alsarayreh, A.A.; Alsalhy, Q.F.; Salih, I.K. Forward Osmosis Membrane: Review of Fabrication, Modification, Challenges and Potential. Membranes 2023, 13, 379. [Google Scholar] [CrossRef]
  31. Lee, S. Performance Comparison of Spiral-Wound and Plate-and-Frame Forward Osmosis Membrane Module. Membranes 2020, 10, 318. [Google Scholar] [CrossRef] [PubMed]
  32. Li, T.; Wang, Y.; Wang, X.; Cheng, C.; Zhang, K.; Yang, J.; Han, G.; Wang, Z.; Wang, X.; Wang, L. Desalination Characteristics of Cellulose Acetate FO Membrane Incorporated with ZIF-8 Nanoparticles. Membranes 2022, 12, 122. [Google Scholar] [CrossRef] [PubMed]
  33. Ali, A.S.M.; Soliman, M.M.; Kandil, S.H.; Khalil, M.M.A. Emerging mixed matrix membranes based on zeolite nanoparticles and cellulose acetate for water desalination. Cellulose 2021, 28, 6417–6426. [Google Scholar] [CrossRef]
  34. Chen, X.; Xu, J.; Lu, J.; Shan, B.; Gao, C. Enhanced performance of cellulose triacetate membranes using binary mixed additives for forward osmosis desalination. Desalination 2016, 405, 68–75. [Google Scholar] [CrossRef]
  35. Ali, A.S.M.; Soliman, M.M.; Kandil, S.H.; Ebrahim, S.; Khalil, M. Tailoring nanocomposite membranes of cellulose of acetate Silica Nanoparticles for Desalination. J. Mater. 2022, 8, 1122–1130. [Google Scholar] [CrossRef]
  36. Mansor, E.S.; Abdallah, H.; Shalaby, M.S.; Shaban, A.M. Enhancement of reverse osmosis membranes for groundwater purification using cellulose acetate incorporated with ultrathin graphitic carbon nitride nanosheets. Environ. Nanotechnol. Monit. Manag. 2023, 19, 100760. [Google Scholar] [CrossRef]
  37. Kim, T.; Choi, M.; Ahn, H.S.; Rho, J.; Jeong, H.M.; Kim, K. Fabrication and characterization of zeolitic imidazolate framework embedded cellulose acetate membranes for osmotically driven membrane process. Sci. Rep. 2019, 9, 5779. [Google Scholar] [CrossRef]
  38. El-Noss, M.; Isawi, H.; Shawky, H.A.; Gomaa, M.A.; Abdel-Mottaleb, M.S.A. Improvement of cellulose acetate forward osmosis membrane performance using zinc oxide nanoparticles. Desalin. Water Treat. 2020, 193, 19–33. [Google Scholar] [CrossRef]
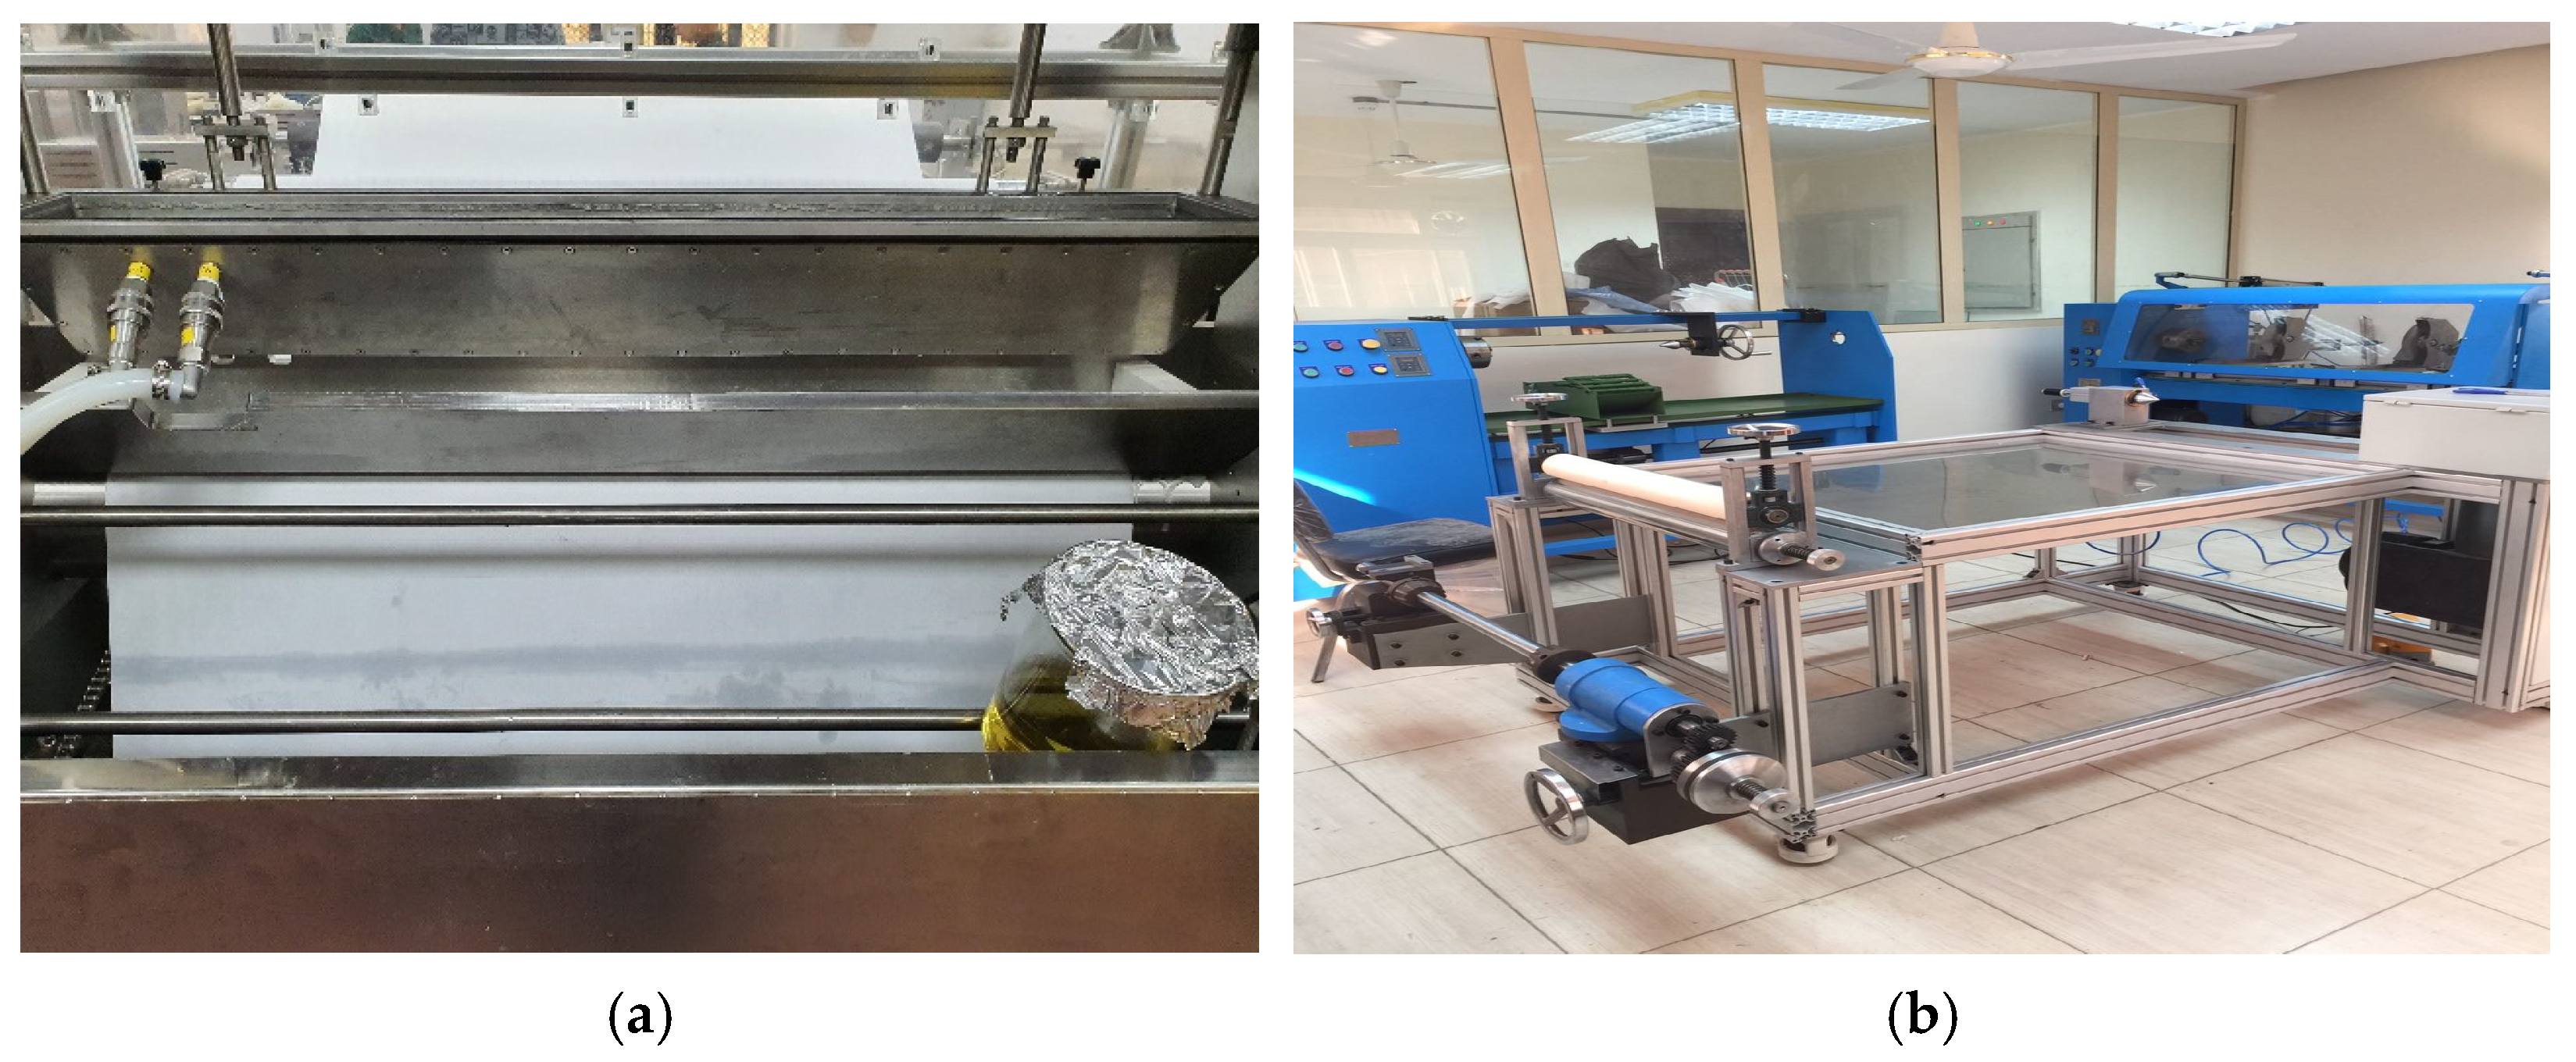
Figure 1. Machines for (a) casting large-scale membranes and (b) spiral-wound fabrication.
Technologies 12 00253 g001
Figure 2. Fabricated spiral-wound modules, (a) before fiberglass winding; (b) RO module and (c) FO module.
Technologies 12 00253 g002
Figure 3. Pilot testing unit for RO/FO modules.
Technologies 12 00253 g003
Figure 4. SEM images for (a) TEM for ZrO2, (b) RO blend membrane and (c) FO blend membrane.
Technologies 12 00253 g004
Figure 5. Effect of feeding saline concentration on (a) permeate flux and (b) salt rejection of prepared RO module.
Technologies 12 00253 g005
Figure 6. Effect of feeding saline concentration on (a) recovery of the prepared RO module, and (b) transmembrane pressure.
Technologies 12 00253 g006
Figure 7. Effect of pressure on the draw solute concentration and dilution percentage of draw solute. (a) Pressure of the DS of 1 bar to feed pressure of 2 bar; (b) pressure of the DS of 3 bar to feed pressure of 2 bar; (c) pressure of the DS of 2 bar to feed pressure of 2 bar.
Technologies 12 00253 g007
Figure 8. Effect of pressure on the draw solute to the pressure of the feed water on the salt flux and water flux. (a) Pressure of DS of 1 bar to feed pressure of 2 bar; (b) pressure of the DS of 3 bar to feed pressure of 2 bar; (c) pressure of the DS of 2 bar to feed pressure of 2 bar.
Technologies 12 00253 g008
Figure 9. Effect of DS pressure to feed pressure on the water flux and dilution %.
Technologies 12 00253 g009
Figure 10. Performance of FAO (a) using brine from RO as draw solution in terms of dilution % and TDS of draw solute; (b) water flux and salt reverse flux.
Technologies 12 00253 g010aTechnologies 12 00253 g010b
Table 1. Seawater sample analysis (Red seawater in Suez).
ParameterUnitResults
pH-7.5
TDSmg/L38,528
ConductivityMs/cm57.5
Total Hardnessmg/L6500
Calcium hardnessmg/L1800
Magnesium hardnessmg/L5600
Sodiummg/L18,000
Alkalinitymg/L13,000
Chloridemg/L34,200
Sulfatemg/L1170
Potassiummg/L275
Table 2. River water sample analysis (Ismailia canal).
ParameterUnitResults
pH 8.14
TurbidityNTU7.4
TDSmg/L282
TSSmg/L101
CODmg/L6.3
BODmg/L3.8
Alkalinitymg/L127
CO3mg/L8.9
HCO3mg/L137
Hardnessmg/L113
NO3mg/L0.24
Table 3. Membrane resistances using a prepared spiral-wound module (RO).
Concentration [ppm]RirRrRm
10,0000.340.4981.67
38,5280.1390.4141.233
Table 4. Comparison of some RO and FO membranes modified with different nanoparticles.
Polymeric MaterialNano
Particles
ProcessSeparation%Permeate Flux
LMH
Reference
Cellulose acetateZIF-8FO2.84 (Js; gLMH)50.14[32]
cellulose acetateZeoliteRO95.51.3[33]
Cellulose triacetateZnCl2-LAFO98.311.5[34]
cellulose acetateSilica RO911.6[35]
Cellulose acetate/polyvinyl alcoholGraphite carbon
nitride
nanosheets
RO9510.5[36]
Cellulose acetateZIF-302/CAFO-16.8[37]
Cellulose acetateZnOFO99.5% of Na+, 100% of Cl26.57[38]
Cellulose acetate/polyvinyl alcoholZrO2RO999.9This work
Cellulose triacetateZrO2FO93.2 Dilution%68.5This work
Disclaimer/Publisher’s Note: The statements, opinions and data contained in all publications are solely those of the individual author(s) and contributor(s) and not of MDPI and/or the editor(s). MDPI and/or the editor(s) disclaim responsibility for any injury to people or property resulting from any ideas, methods, instructions or products referred to in the content.