Article

Effect of Oscillating Area on Generating Microbubbles from Hollow Ultrasonic Horn

1
Graduate School of Science and Engineering, Yamagata University, 4-3-16 Jonan, Yonezawa, Yamagata 992-8510, Japan
2
Infrastructure Company, Ebara Corporation, 11-1, Haneda Asahi-cho, Ota-ku, Tokyo 144-0042, Japan
*
Author to whom correspondence should be addressed.
Technologies 2024, 12(6), 74; https://doi.org/10.3390/technologies12060074
Submission received: 30 April 2024 / Revised: 18 May 2024 / Accepted: 23 May 2024 / Published: 25 May 2024
(This article belongs to the Special Issue Smart Systems (SmaSys2023))

Abstract

:
Microbubbles, which are tiny bubbles with a diameter of less than 100 µm, have been attracting attention in recent years. Conventional methods of microbubble generation using porous material and swirling flows have problems such as large equipment size and non-uniform bubble generation. Therefore, we have been developing a hollow ultrasonic horn with an internal flow path as a microbubble-generating device. By supplying gas and ultrasonic waves simultaneously, the gas–liquid interface is violently disturbed to generate microbubbles. Although this device can generate microbubbles even in highly viscous fluids and high-temperature fluids such as molten metals, it has the problem of generating many relatively large bubbles of 1 mm or more. Since the generation of a large amount of microbubbles in a short period of time is required to realize actual applications in agriculture, aquaculture, and medicine, conventional research has tried to solve this problem by increasing the amplitude of the ultrasonic oscillation. However, it is difficult to further increase the amplitude due to the structural reasons of the horn and the behavior of bubbles at the horn tip; therefore, the oscillating area of the tip of the horn, which had not received attention before, was enlarged by a factor of 2.94 times to facilitate the ultrasonic wave transmission to the bubbles, and the effect of this was investigated. As a result, a large number of gases were miniaturized, especially at high gas flow rates, leading to an increase in the amount of microbubbles generated.

1. Introduction

Microbubbles, which are tiny bubbles with a diameter of less than 100 µm, have been attracting attention in recent years. Microbubbles have various properties that are different from bubbles with a diameter of 1 mm or more, such as a large surface area per unit volume, slow floating velocity, and high pressure inside bubbles, and these properties are being utilized in various fields such as agriculture, aquaculture, medicine, and biochemical processes [1,2]. There are many methods for generating microbubbles [3], and the following two methods have been the most common: the first is to supply gas into a porous material to generate microbubbles [4], and the second is to use the shear force of a swirling flow to miniaturize the supplied gas and generate microbubbles [5]. However, when generated through a porous material, the bubble diameter increases to several millimeters due to surface tension. In addition, the method of generation using shear force requires a pump to circulate the liquid, which increases the size of the equipment. Therefore, it was necessary to develop a simple device that could generate uniform bubbles.
Makuta et al. developed a device called a hollow ultrasonic horn which has a flow path for supplying gas and can be highly oscillated to generate microbubbles [6]. This simple device can be applied to highly viscous fluids and high-temperature fluids such as molten metals. However, this horn cannot fully disturb the gas–liquid interface, especially at a high gas flow rate, and there are many large bubbles due to insufficient miniaturization of the supplied gas. To solve this problem, conventional research has increased the amplitude of ultrasonic oscillation by narrowing the horn tip to increase the disturbance at the gas–liquid interface [7]. However, considering that the tip diameter of the horn is 10 mm, the hole diameter through which the gas passes is 6 mm, and commercially available ultrasonic transducers connected to the root of the horn generally have an outer diameter of 15 mm to 60 mm, of which this study uses a relatively large 55 mm diameter transducer, it is difficult to increase the amplitude by further narrowing the tip diameter. In addition, the conventional horn with a small tip area causes many of the supplied gases to rise to the water surface undisturbed at high flow rates. Therefore, in order to increase the amount of microbubbles generated, the area of both the root and tip of the horn was increased to promote ultrasonic transmission to a large number of gases while maintaining a certain amplitude, and the effect on microbubble generation was investigated.

2. Experimental Apparatus and Evaluation Methods

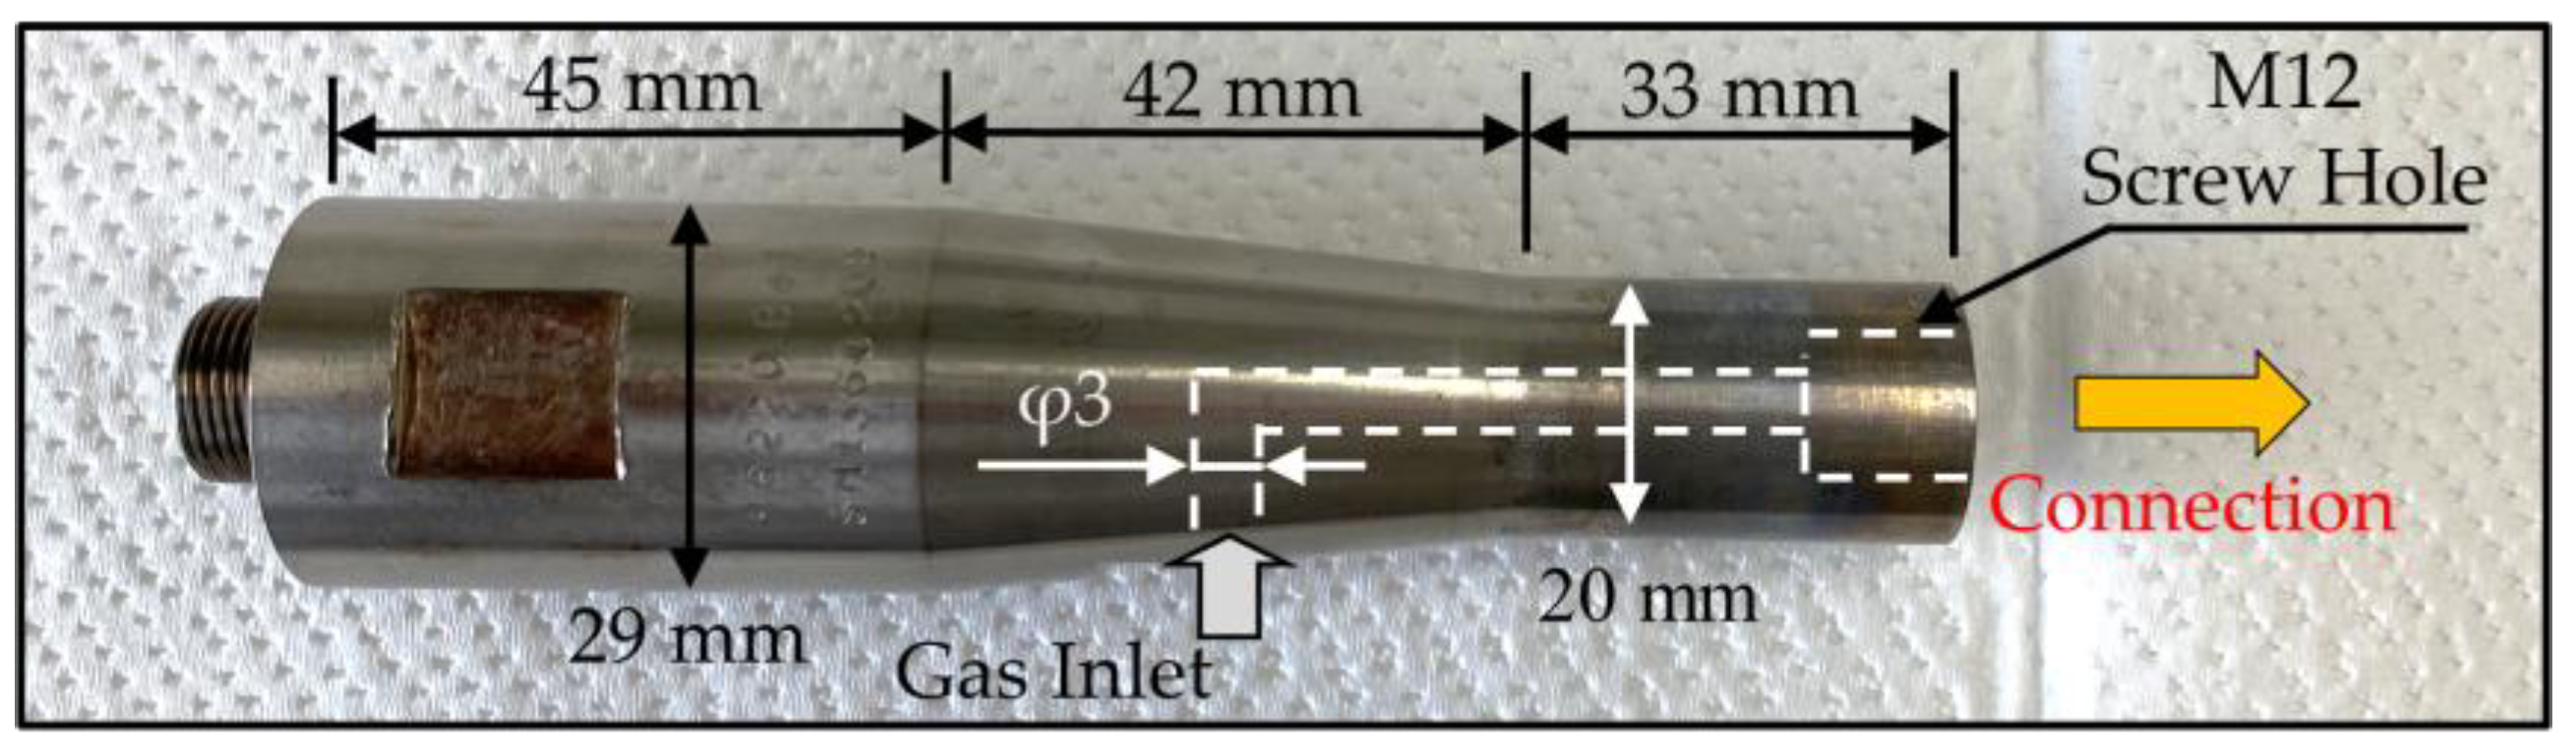
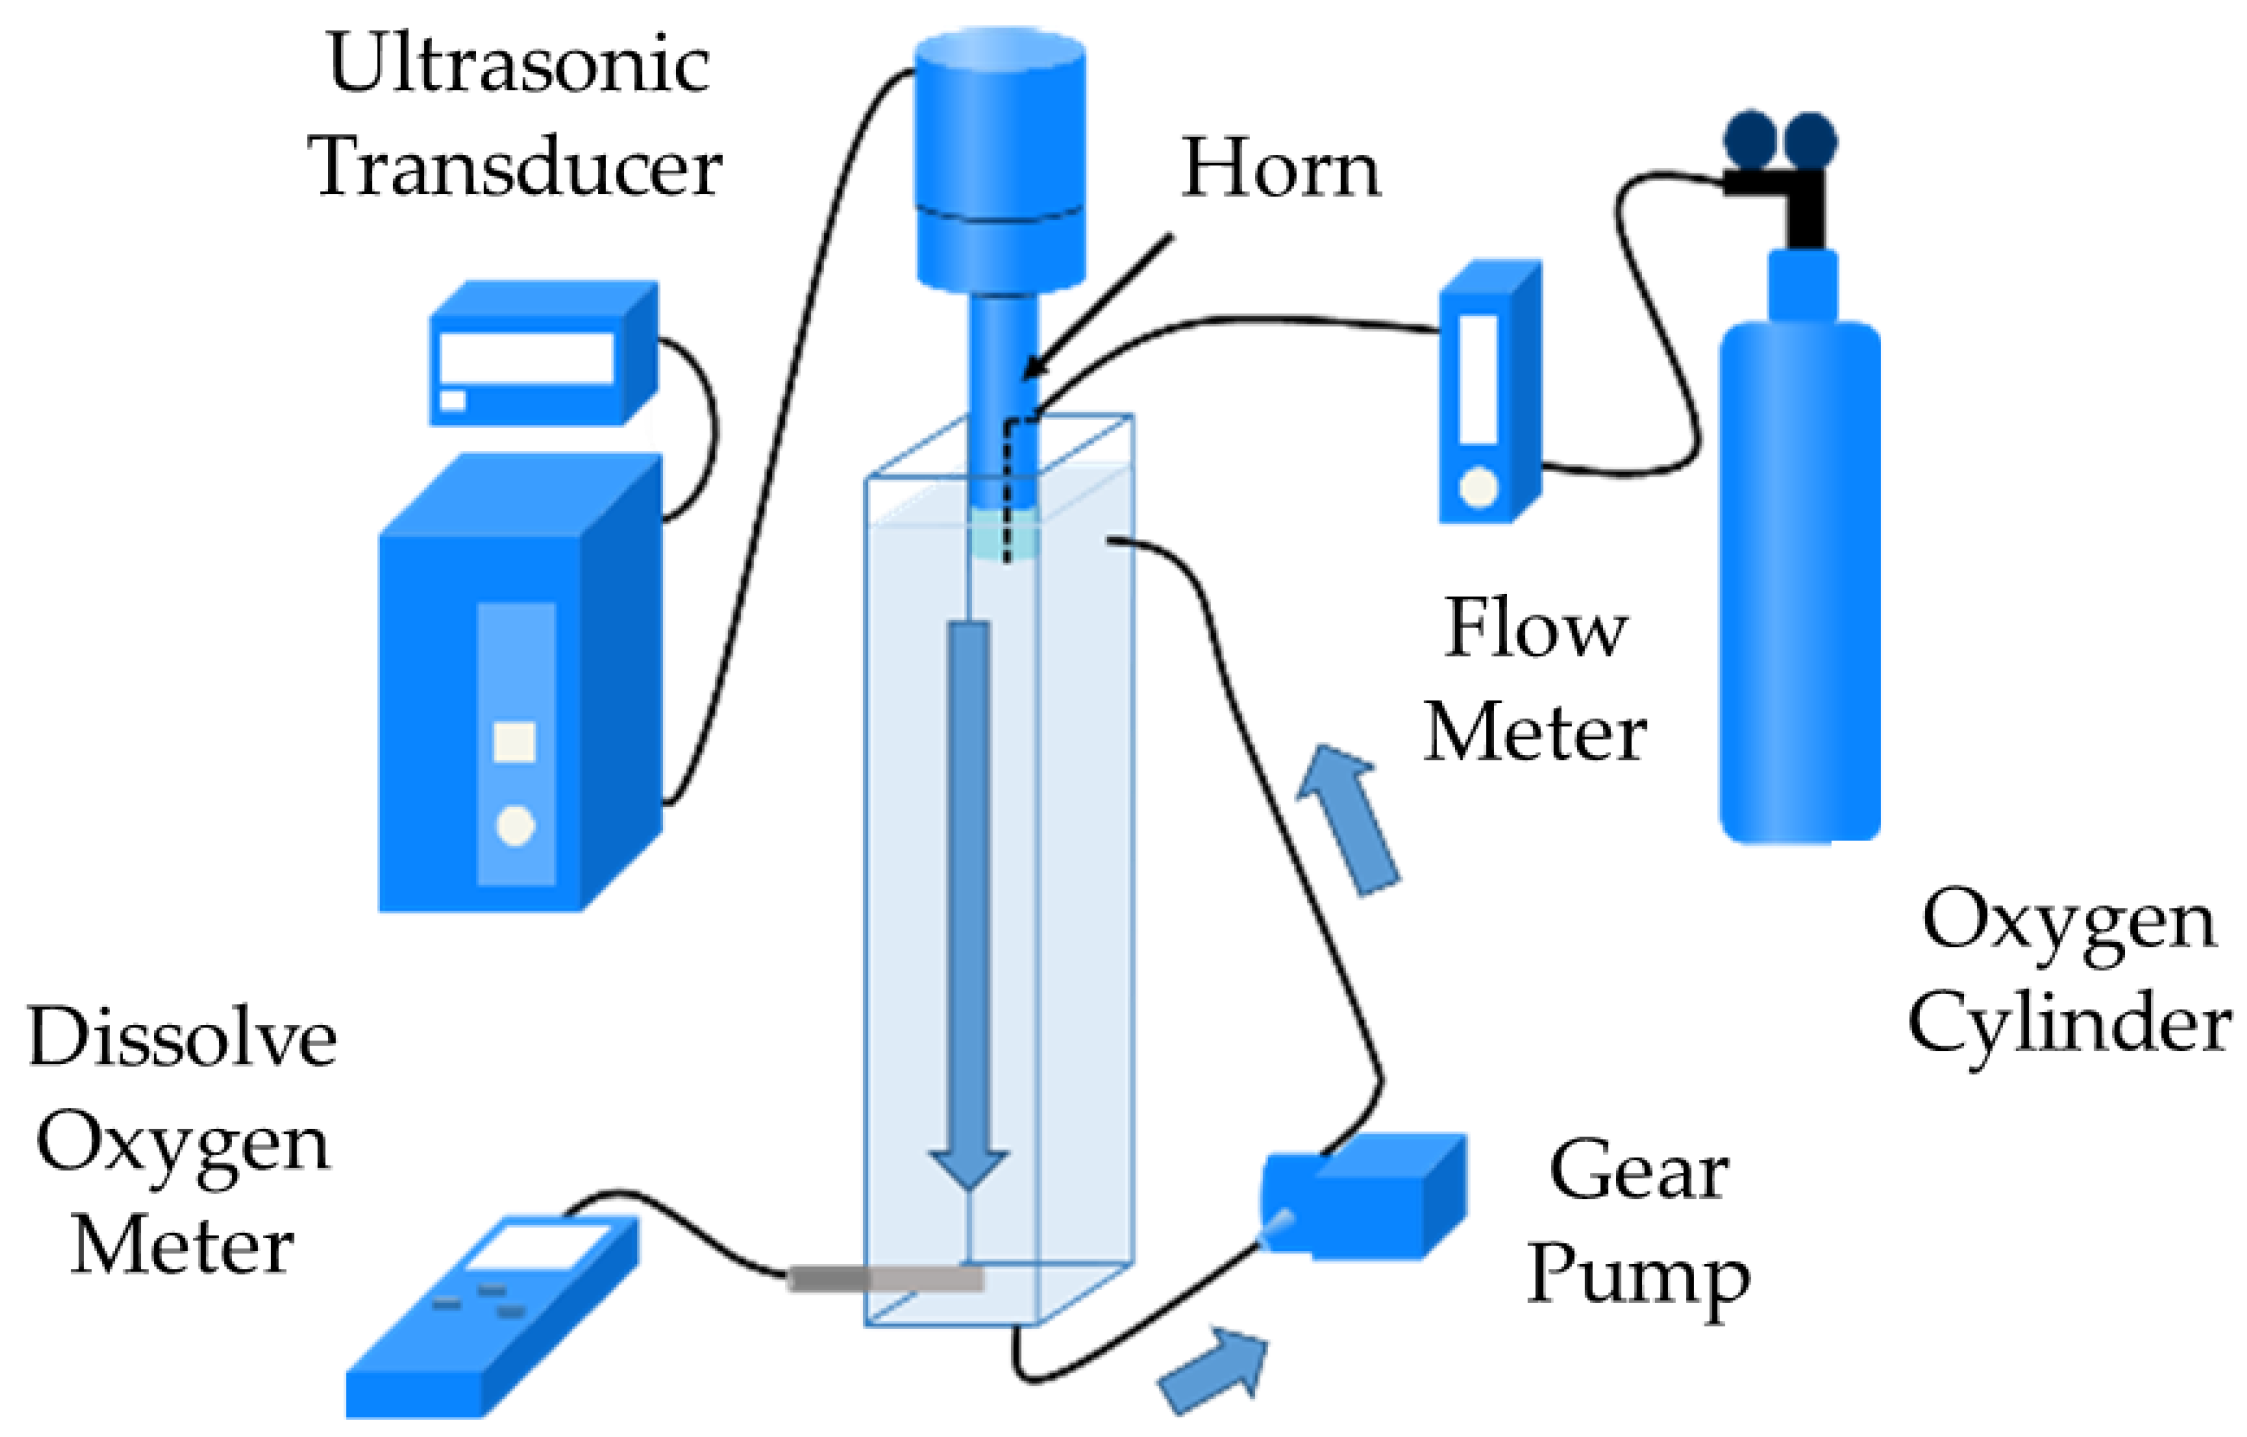
2.1. Experimental Apparatus

A hollow ultrasonic horn is an apparatus for transmitting and amplifying ultrasonic waves, and a separate device that generates ultrasonic waves is needed to operate this device. Therefore, in this study, we used an ultrasonic generator (6271, Kaijo Corporation, Tokyo, Japan) that generates a 19.5 ± 0.5 kHz sinusoidal electric signal and an ultrasonic transducer (6281A, Kaijo Corporation, Tokyo, Japan) that converts the electric signal into oscillation and generates ultrasonic waves. In addition, a gas cylinder was used to supply the gas and a flow meter (RK-1250, KOFLOC Corp., Kyoto, Japan) was used to control the flow of the gas. The configuration of this experimental apparatus is shown in Figure 1. The hollow ultrasonic horn shown in Figure 2 is made of a titanium alloy (Ti-6AL-4V) in terms of oscillation resistance, oscillation loss, and heat resistance [8,9]. The total length of the horn is designed to be half the wavelength of the ultrasonic wave as it passes through the material, and the horn tip is positioned at the belly of the oscillation to obtain the maximum amplitude [10]. The horn is an amplifier with an internal gas supply channel, and the smaller the cross-sectional area, the more the ultrasonic oscillation is amplified.
Microbubbles are generated by the hollow ultrasonic horn in the following steps.
(1)
Insert the tip of the hollow ultrasonic horn into the liquid.
(2)
Supply gas to the gas supply port to form a gas–liquid interface at the tip of the horn.
(3)
By ultrasonic oscillation of the horn tip, the surface waves formed at the gas–liquid interface are separated and miniaturized to generate microbubbles.
While the hollow ultrasonic horn, as shown in Figure 2 (maximum amplitude is 44 µm), can generate microbubbles by itself, we connected an additional horn, as shown in Figure 3, to increase the amplitude of the horn for improving the stability of the microbubble generation. The large-diameter side of the horn in Figure 3a has a diameter of 20 mm and the small-diameter side has a diameter of 10 mm. Figure 3b shows a horn with a reduced maximum amplitude but with an increased tip area compared toFigure 3a. The large-diameter side of the horn has a diameter of 25 mm, while the small-diameter side has a diameter of 15 mm. The horn in Figure 3a has a tip oscillating area of 50.3 mm2, while the horn in Figure 3b has a tip oscillating area of 148 mm2, which is an increase of 2.94 times. Both gas outlets are uniformly 6 mm in diameter.
In this study, the four cases shown in Table 1 were evaluated in terms of the microbubble generation behavior, the amount of microbubbles generated as a dissolved oxygen concentration, the overall mass transfer coefficient KLa, and the bubble diameter distribution. Case 1 uses the horn shown in Figure 3a with an oscillating area of 50.3 mm2 and an amplitude of 93 µm. The ultrasonic generator is equipped with a dial indicated from 0 to 11 (maximum input power is 53 W), which can be turned to adjust the oscillation displacement in proportion to the power input to the transducer. Case 2 uses the horn shown in Figure 3b with an oscillating area of 50.3 mm2 and adjusts the amplitude to 93 µm to set the condition of 2.94 times the tip oscillating area compared to Case 1. Case 3 uses the horn shown in Figure 3a with a maximum amplitude of 274 µm, which is a condition of 2.94 times the amplitude compared to Case 1. Case 4 was tested with the horn shown in Figure 3b with a maximum amplitude of 162 µm. The liquid used in the three experiments was room temperature ultrapure water (maximum purity of 17 MΩ) produced by an ultrapure water production equipment (RFD380-PaiS, Environmental Technology Service Co., Ltd., Wakayama, Japan). Three gas flow rates of 100, 500, and 1000 mL/min were used for each experiment.

2.2. Evaluation Methods

Since microbubbles are generated by the separation of surface waves at the gas–liquid interface, the amount of microbubbles generated is considered to vary depending on the strength of the disturbance at the interface. Therefore, the oscillation amplitudes were measured from images taken with a high-speed camera (FASTCAM SA1.1, PHOTRON LIMITED, Tokyo, Japan) and a 20× magnification lens (M Plan Apo SL 20×, Mitutoyo Corporation, Kanagawa, Japan) at a frame rate of 10,000 frames per second and a shutter speed of 1/102,000 s. A fixed point was placed on the image of the horn tip, and the amplitude was calculated by examining the displacement of the fixed point.
The same high-speed camera was used for the microbubble generation behavior, with a 2× magnification lens (M Plan Apo 2×, Mitutoyo Corporation, Kanagawa, Japan), a frame rate of 10,000 frames per second, and a shutter speed of 1/102,000 s. At high gas flow rates, the generation of large bubbles increases, and it becomes difficult to see the microscopic features caused by disturbances at the gas–liquid interface. Therefore, we observed the microbubble generation behavior only at a flow rate of 100 mL/min, because image comparison would be difficult at higher gas flow rates.
The microbubble generation method used in this study is high-speed, and it is difficult to directly measure the amount of microbubbles generated due to the temporal variation in bubble diameters caused by ultrasonic pressure and decompression, and the susceptibility of bubbles to coalescence and aggregation. Therefore, taking advantage of the property that microbubbles dissolve easily in liquids, we generated microbubbles using oxygen as a gas supply and evaluated the amount of microbubbles generated by measuring the dissolved oxygen concentration in the water. In short, the higher the amount of microbubbles generated, the faster the increase in dissolved oxygen concentration. The amount of microbubbles generated was also evaluated by calculating the overall mass transfer coefficient KLa [s−1] using the dissolved oxygen concentration results. As the amount of microbubbles generated increased, assuming KL was constant, the value of the overall mass transfer coefficient KLa also increased due to the increase in surface area per unit volume a, which is a characteristic of microbubbles. In other words, the magnitude of generation can be evaluated by the size of the value of KLa.
  dDO / dt = K L a DO S DO K d DO
where DO is dissolved oxygen concentration [mg/L], t is time [s], KL is mass transfer coefficient [m/s], a is surface area per unit volume [m2/m3], DOS is saturated dissolved oxygen concentration [mg/L], and Kd is degassing coefficient [s−1]. KLa and Kd are calculated by curve fitting Equation (1) using the least-squares method. The first half of Equation (1), except for KdDO, is a model equation for mass transfer when a gas dissolves into a liquid [11]. When ultrasonic waves are applied to water, the attraction between bubbles, called “Bjerknes force” [12,13], causes them to merge and increase in size, which increases their floating velocity and induces a large degassing effect on each other. In consideration of the amount of degassing, a degassing coefficient Kd was introduced into Equation (1). The DOS in Equation (1) was calculated by Weiss’s equation [14] and expressed as follows:
DO S = EXP 173.4292 + 249.6339 × 100 T + 273.15 + 143.3483 × ln T + 273.15 100 21.8492 ×   T + 273.15 100 × 1.429 × 100 21
where T is the water temperature [°C].
The experimental apparatus used to measure the dissolved oxygen concentration is shown in Figure 4. A horn tip was inserted 13 mm from the top of a water tank (80 mm × 80 mm × 700 mm) filled with 3.7 L of ultrapure water to generate oxygen microbubbles. A dissolved oxygen analyzer (Seven2Go S4, Mettler-Toledo International Inc., Greifensee, Switzerland) was placed 10 mm above the bottom of the tank. To clarify the increase in dissolved oxygen concentration due to microbubble generation, a gear pump (WWB-09121A, ZHEJIANG SHIYUAN TECHNOLOGY CO., LTD., Zhejiang, China) was used to generate a downward flow with an average velocity of 6.1 mm/s, which corresponds to the flotation velocity of a 100 µm bubble in still water.
A laser diffraction particle size analyzer (LMS-2000e, SEISHIN ENTERPRISE CO., Ltd., Tokyo, Japan) was used to measure the bubble diameter. The principle of this method is to irradiate a group of particles with laser light and calculate the particle size distribution from the intensity distribution pattern of the diffracted and scattered light emitted from the irradiated particles. The experimental system is similar to that used to measure dissolved oxygen concentration, in that microbubbles pass through the measurement device before passing through the pump. Microbubbles are easily dissolved in liquid, and it is difficult to accurately measure the actual diameter of the bubbles immediately after they are generated because a large amount of gas is dissolved from their generation at the top of the water tank to their measurement at the bottom of the water tank. Therefore, sulfur hexafluoride was used as the feed gas. The solubility of sulfur hexafluoride was 0.27 mmol/L at 20 °C, approximately five times lower than that of oxygen (1.289 mmol/L) [15].

3. Experimental Results and Discussion

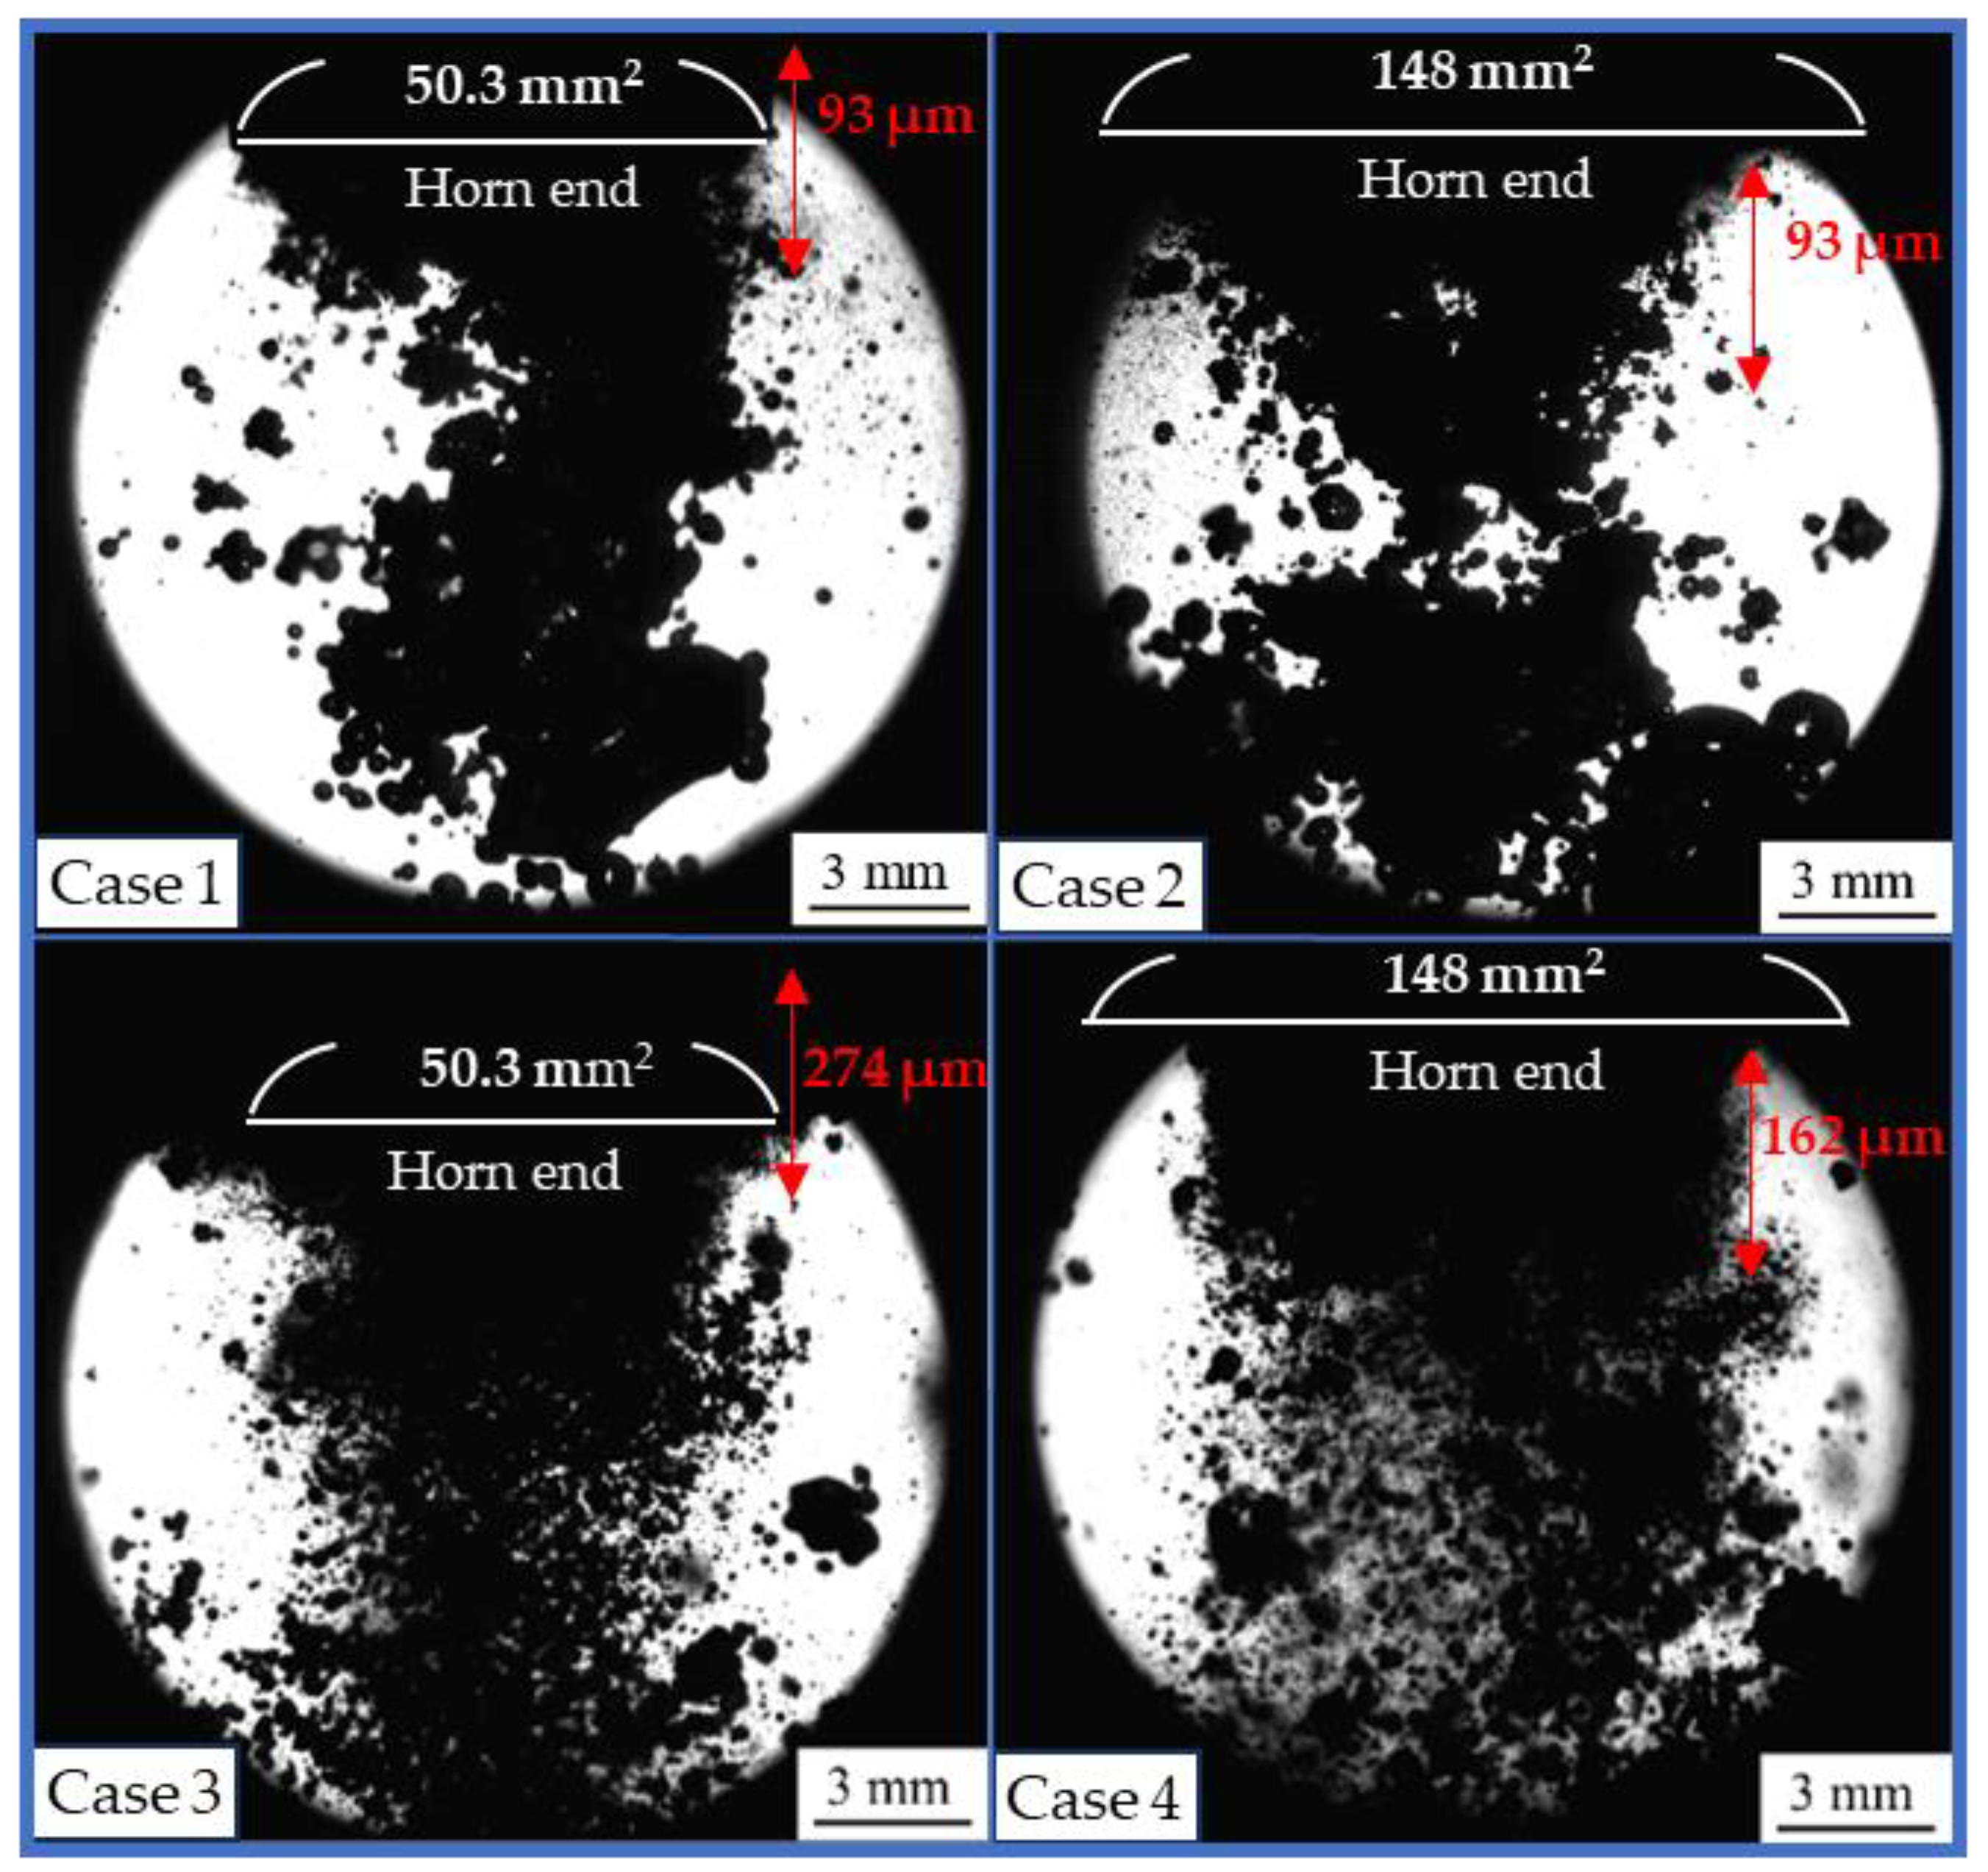
3.1. Generation Behavior of Microbubbles in Water

Figure 5 shows images of the microbubble generation behavior in water for Cases 1 to 4 respectively. In Case 1 (Default condition), the gas–liquid interface formed at the exit of the horn tip collapsed due to ultrasonic pressure fluctuations, but the bubbles were not sufficiently miniaturized and were released in the form of large bubbles. Case 2, in which the tip area was increased by a factor of 2.94, was similar to Case 1, and although disturbances of the gas–liquid interface were observed, they did not result in the generation of many microbubbles. The increase in the tip area causes the ultrasonic waves to be transmitted to the bubbles over a larger area; however, it is difficult for the bubbles to separate the bubbles from the surface waves due to the small amplitude, and the generation of large bubbles is considered to be more dominant. In Case 3, where the amplitude was increased by a factor of 2.94, unlike Cases 1 and 2, the amount of microbubbles generated increased significantly. The increase in amplitude is thought to have caused a more intense disturbance at the gas–liquid interface, which promoted the separation of bubbles from the surface waves and their subsequent miniaturization. In Case 4, microbubbles appear to be generated over a larger area than in Case 3 due to the increased tip area. The microbubble generation over a wider area prevents bubbles from coalescing or agglomerating, and this is expected to be more pronounced when the flow rate is further increased. In fact, Jiro et al. reported that the attractive nature of the “Bjerknes force” acting between bubbles depends on the diameter of the bubbles and the distance between them [16]. The increase in the tip area also makes it easier for gases that have coalesced or agglomerated to touch the horn tip again when they rise to the surface, and it is possible that the ultrasonic oscillation may cause them to miniaturize again. Also, although the amplitude is smaller than in Case 3, the gas–liquid interface is sufficiently disturbed, leading to miniaturization.

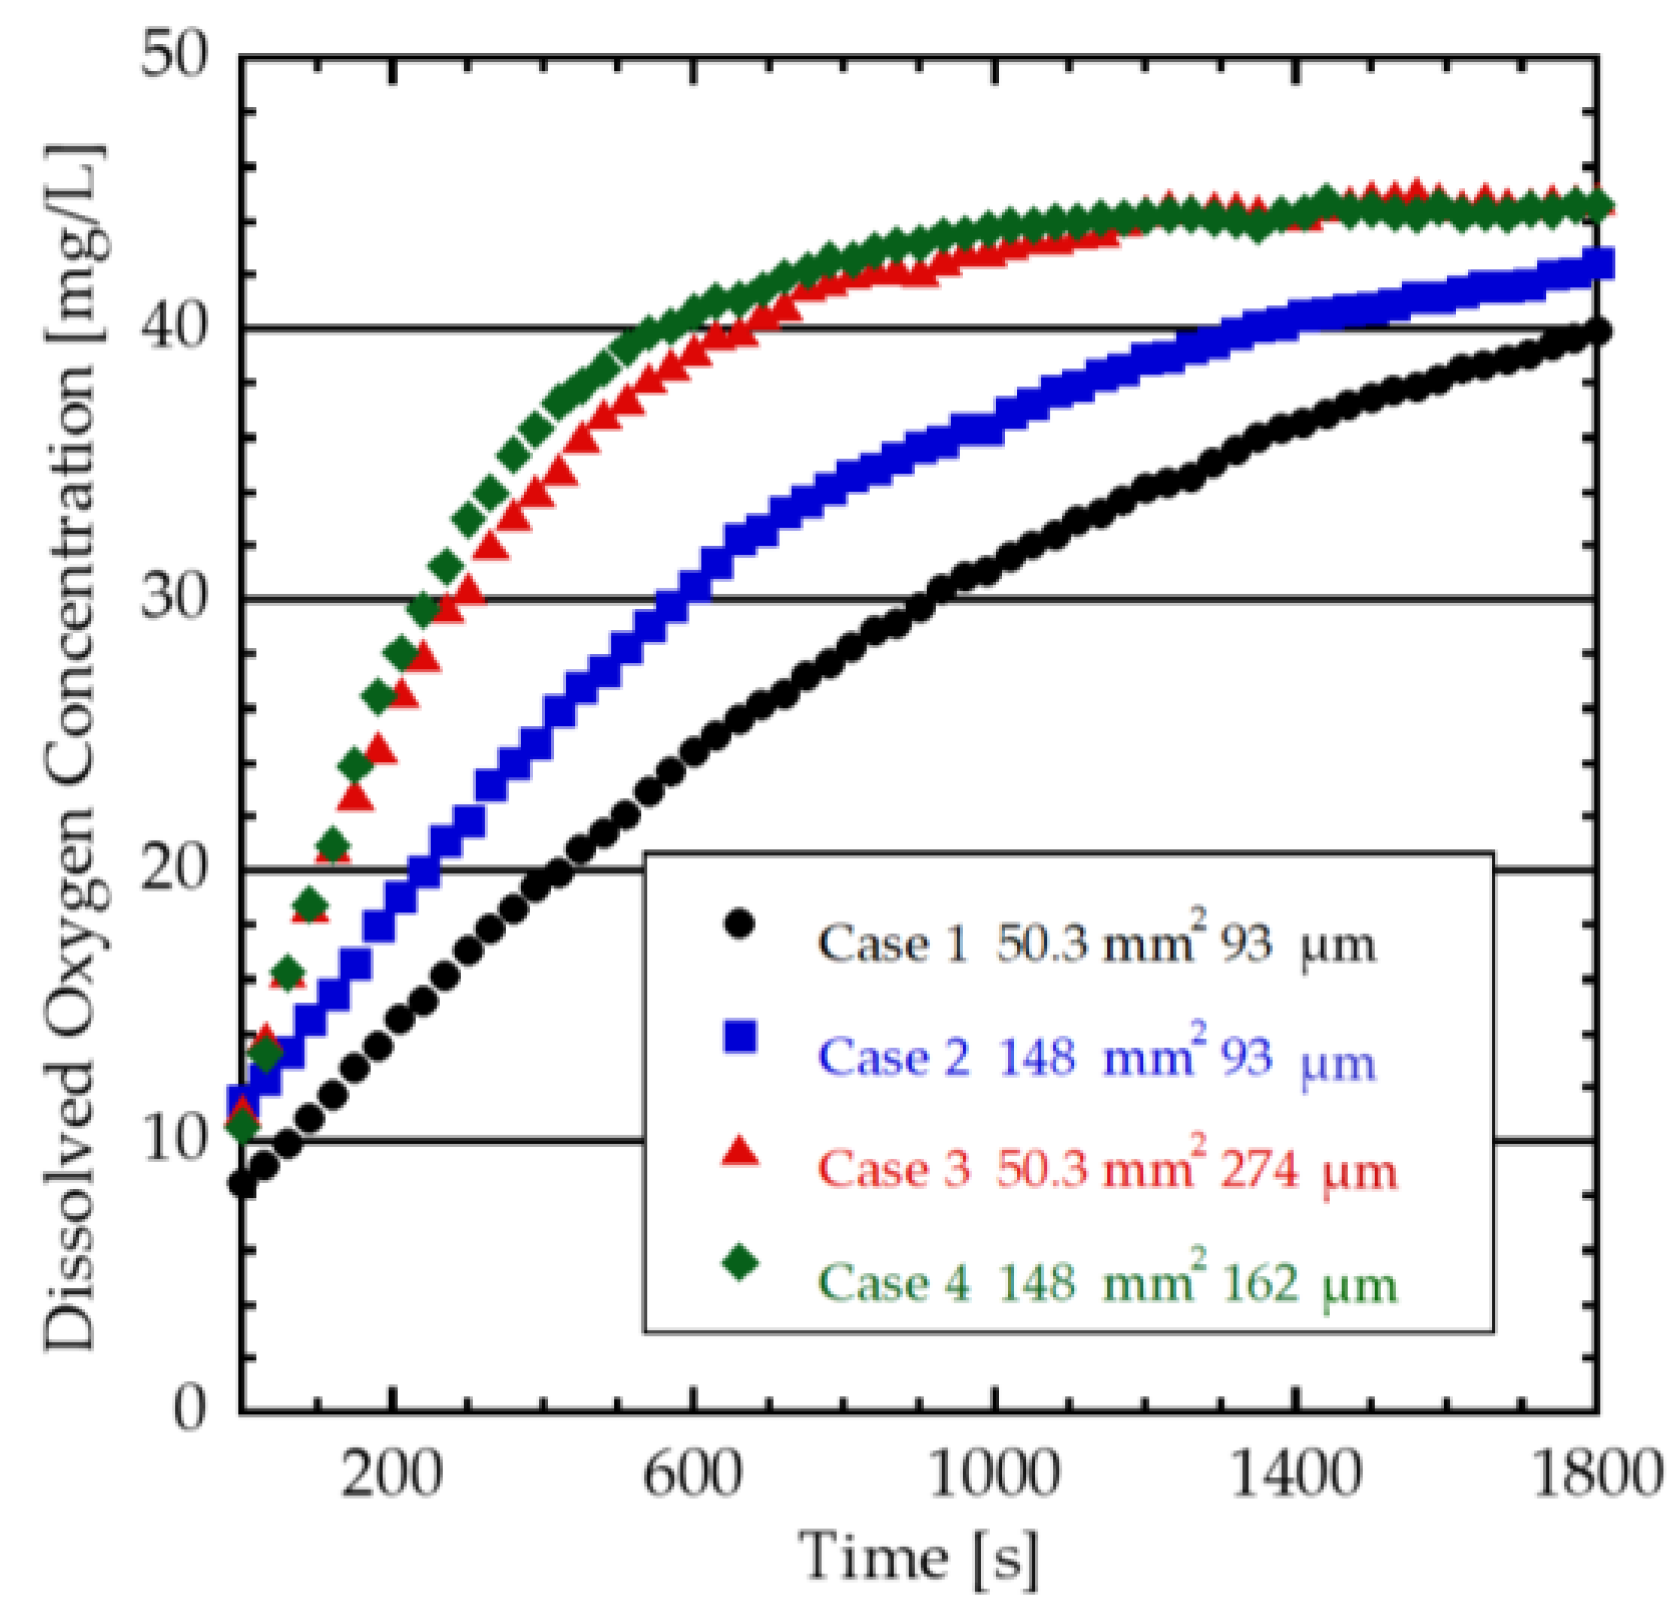
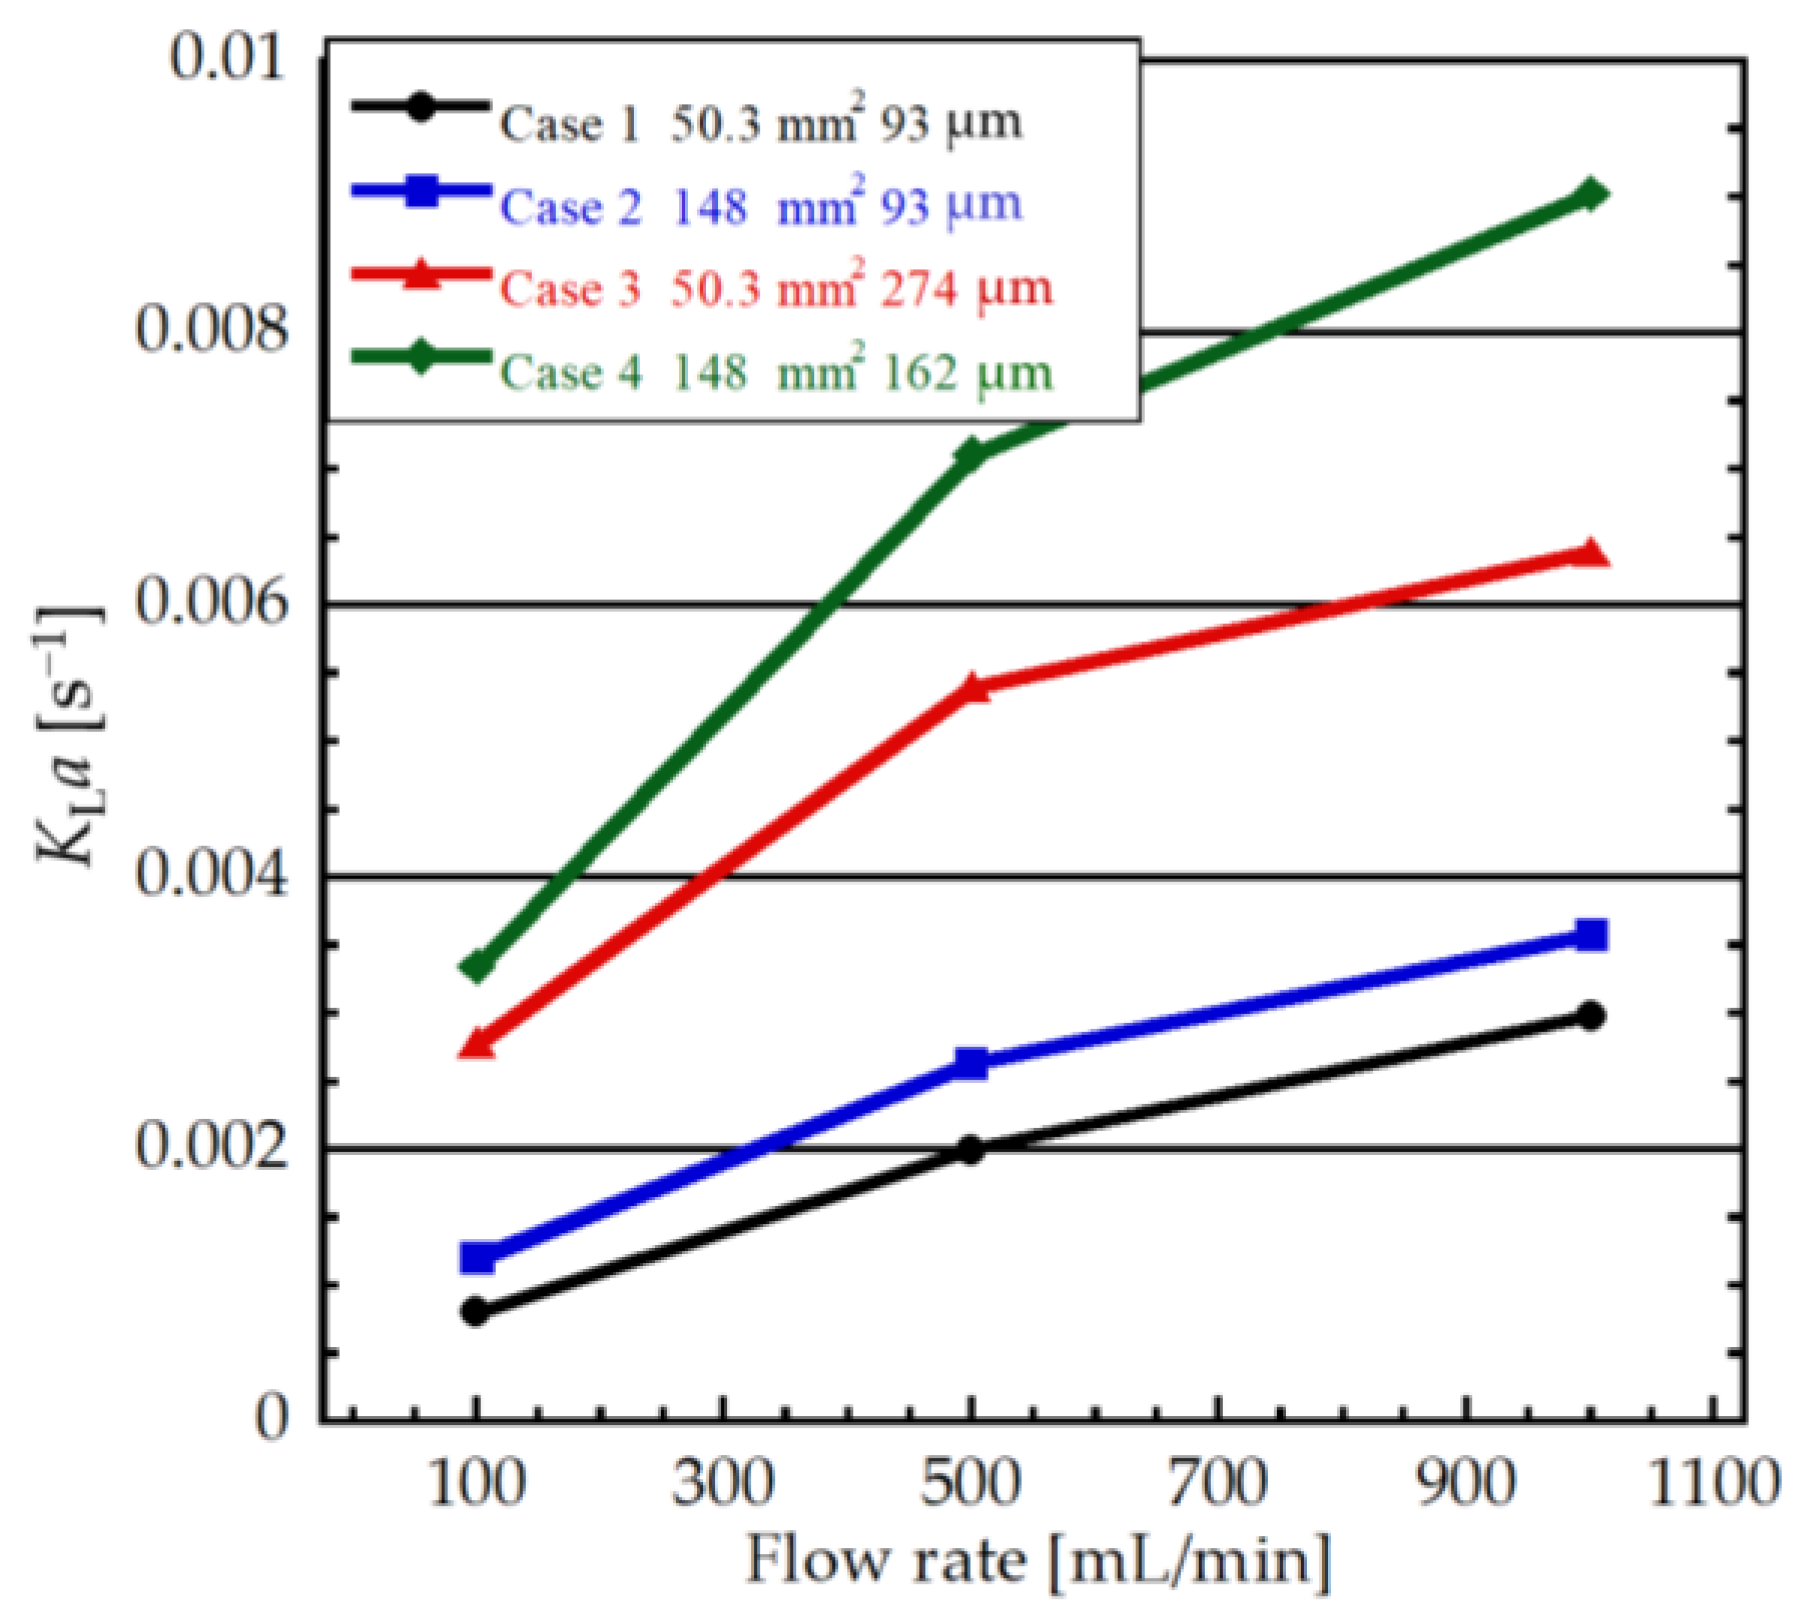
3.2. Evaluation of Microbubble Generation Yield by Dissolved Oxygen Concentration

Figure 6, Figure 7 and Figure 8 show the time variation of dissolved oxygen concentration at gas flow rates of 100, 500, and 1000 mL/min, respectively. The vertical axis represents the dissolved oxygen concentration and the horizontal axis represents the elapsed time after the start of bubbling into the water. It can be seen that the dissolved oxygen concentration increased faster in Case 4, Case 3, Case 2, and Case 1, in that order, for all flow rates. Comparing Case 1 and Case 2, it can be seen that there is no significant difference in the rate of increase in dissolved oxygen concentration at all flow rates. This is thought to be due to the low amplitude and insufficient pressure fluctuation required for miniaturization, even though the tip area is 2.94 times larger, as shown in the image in Figure 5. The rate of increase in dissolved oxygen concentration in Case 1 is lower than in the other Cases, but the final concentration at flow rates of 500 and 1000 mL/min is higher than in the other Cases. This is thought to be related to the water temperature. Table 2 shows the results for the temperature at the end of the dissolved oxygen concentration measurement. In Case 1, the oscillation amplitude was smaller than in the other Cases, and the surface area of the horn oscillating in the water was also smaller, resulting in less heat generation due to friction with the water, which is believed to have suppressed the increase in water temperature. This is believed to have facilitated the dissolution of the oxygen microbubbles, resulting in a higher final concentration.
Figure 9 shows the overall mass transfer coefficient KLa at each flow rate calculated from the dissolved oxygen concentration measurement results. The values for Case 1 and Case 2 were similar at all flow rates and were lower than those for Cases 3 and 4. Comparing Cases 3 and 4, there is no significant difference at low flow rates of 100 mL/min. On the other hand, at a flow rate of 1000 mL/min, the values were 0.0064 s−1 and 0.0090 s−1, respectively, which were 2.15 and 3.03 times higher than those of Case 1, 0.0030 s−1. Since higher KLa values imply more microbubble generation, it can be seen that Case 4, which increased both area and amplitude, generated the most microbubbles, especially at high flow rates. These results confirm that at high flow rates, increasing the tip area is effective in generating microbubbles while maintaining the amplitude required for gas–liquid interface disturbance and surface wave separation. At high flow rates, the velocity of the gas passing through the horn increases, and the rate of formation of the gas–liquid interface also increases. If the tip area is small, gases overflowing outside the horn tip surface become large bubbles that quickly rise to the surface due to buoyancy. By increasing the tip area, the gas–liquid interface remains at the tip of the horn, resulting in the miniaturization of many gases and the further miniaturization of microbubbles separated from the surface waves via extensive ultrasonic transmission.

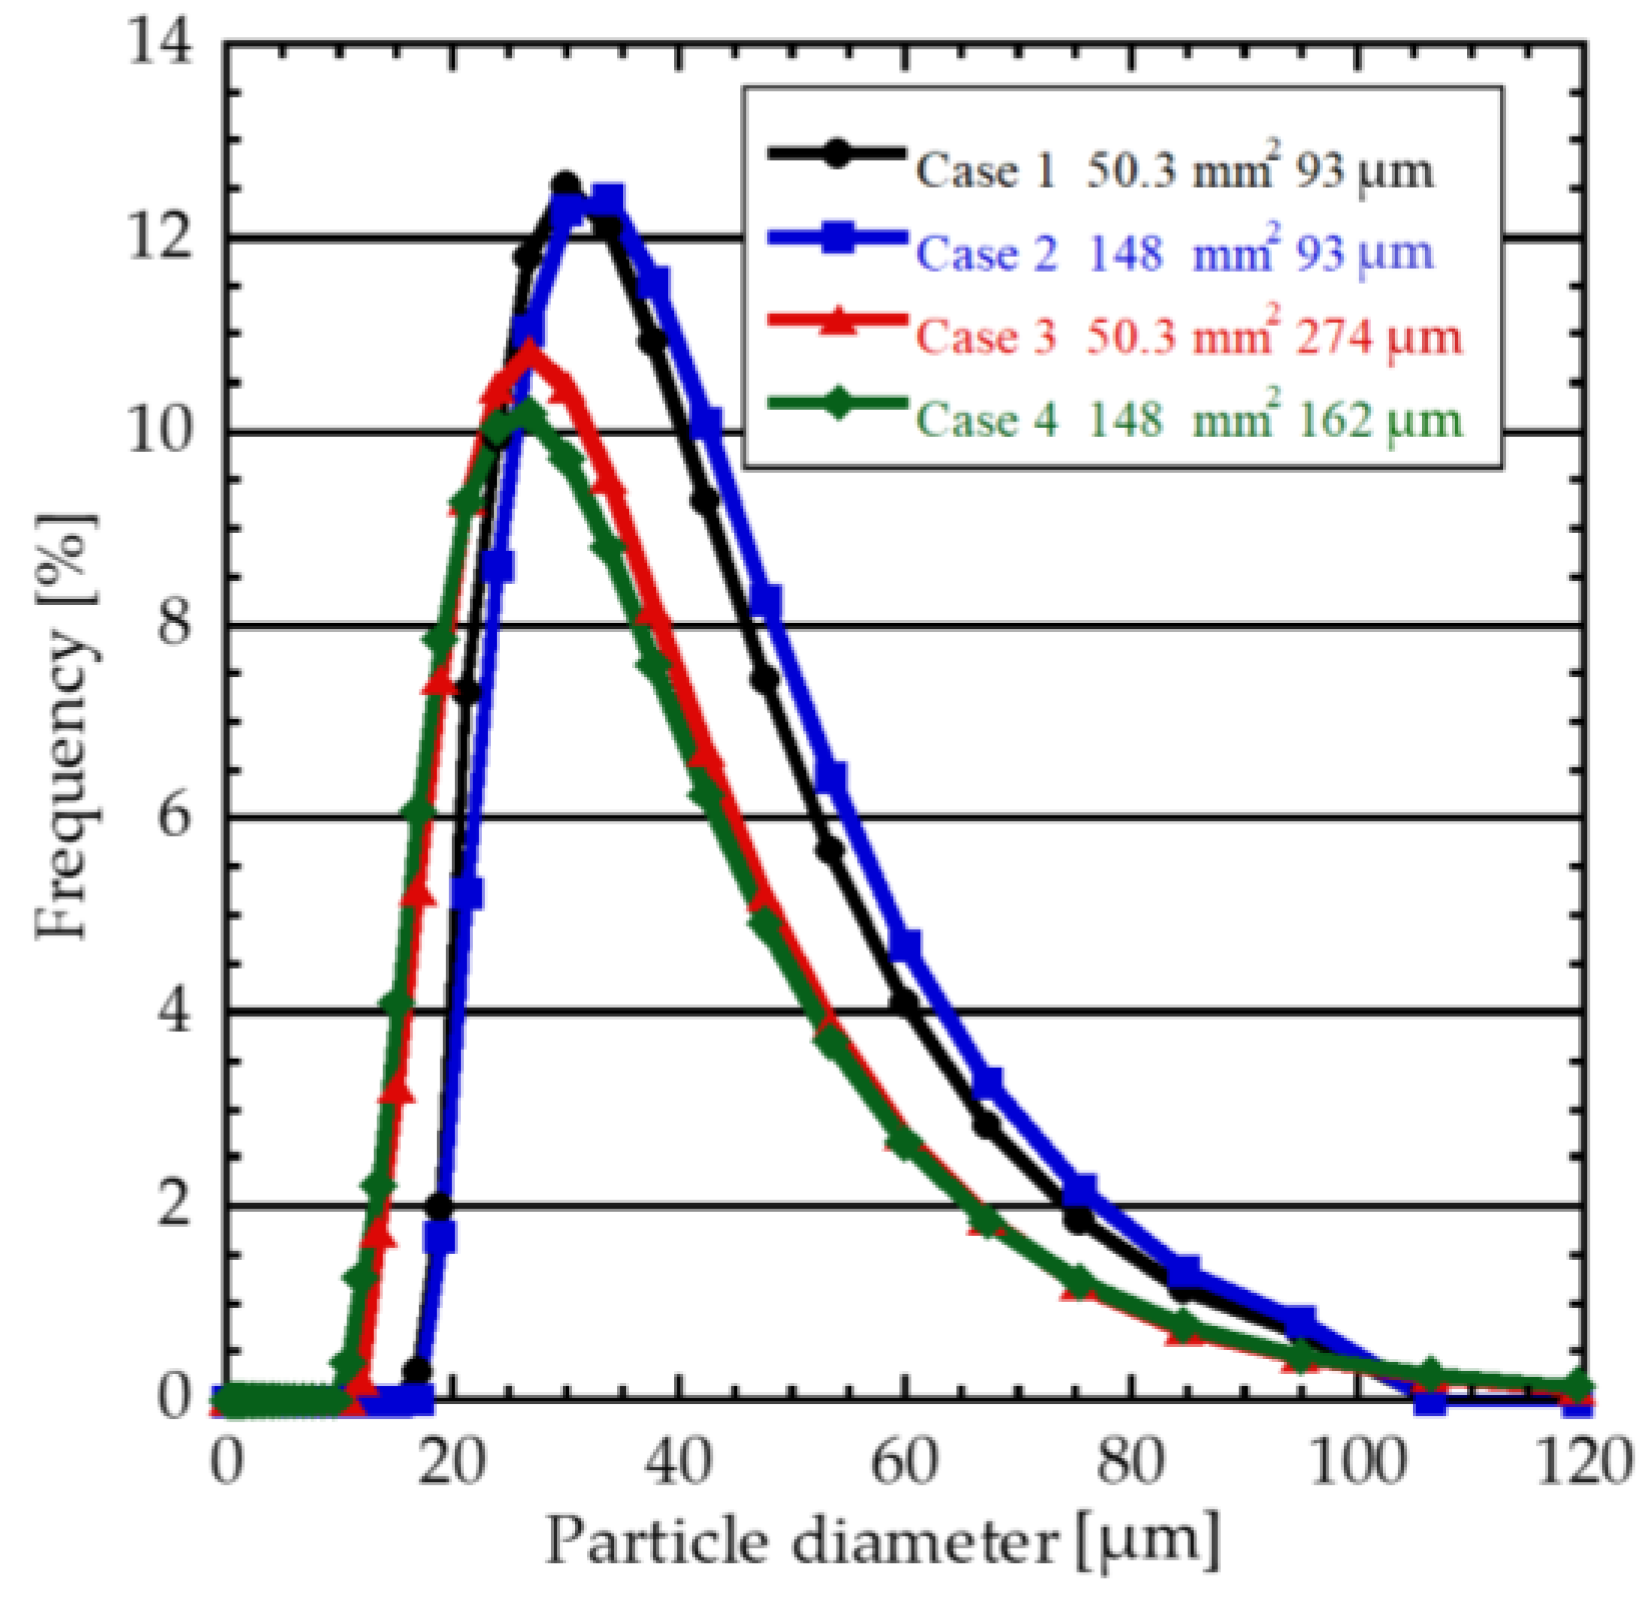
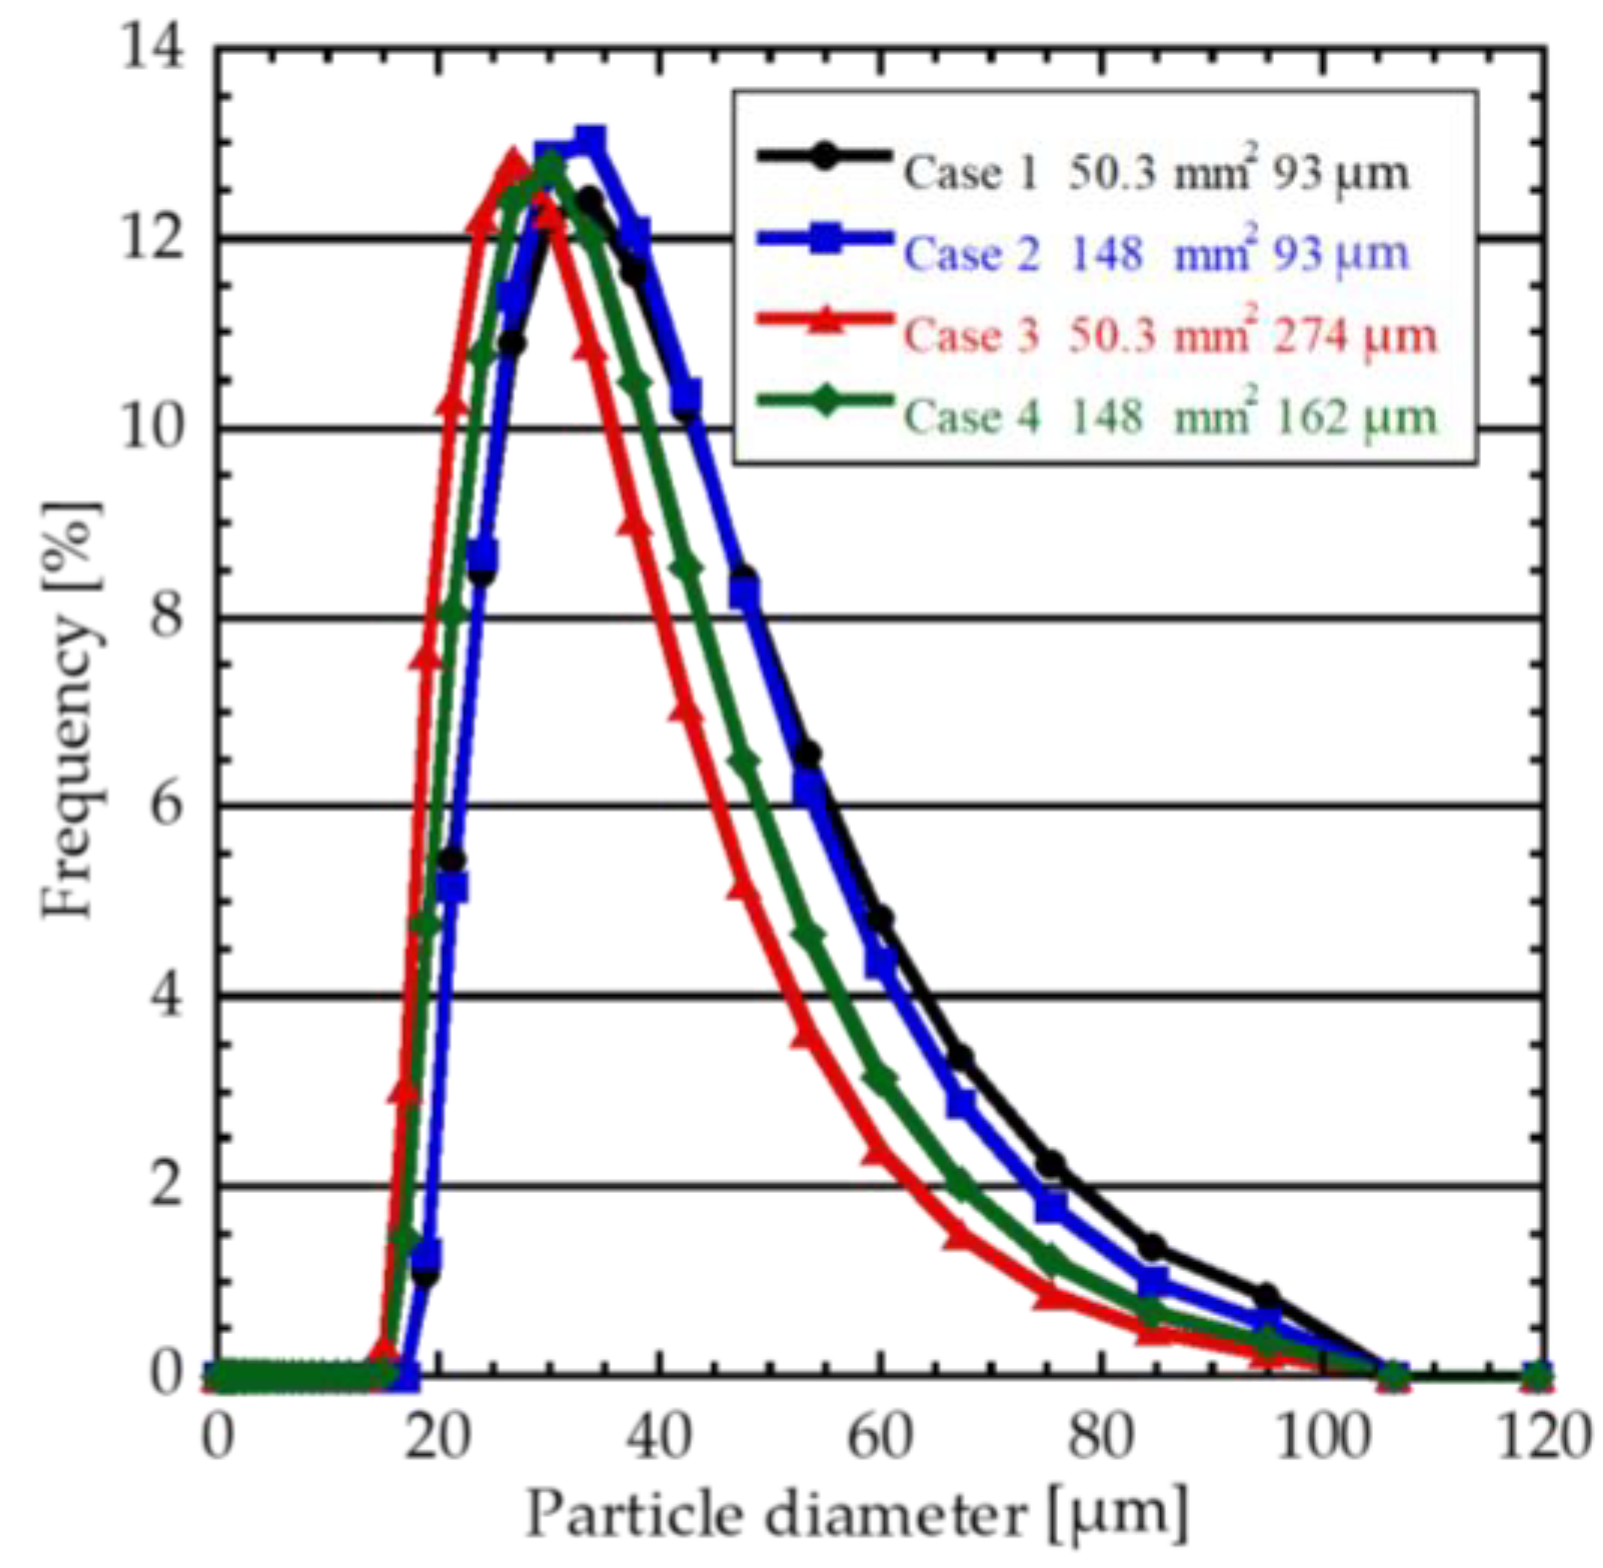
3.3. Diameter Distribution of Microbubble

Figure 10, Figure 11 and Figure 12 show the results of the bubble diameter distribution at flow rates of 100, 500, and 1000 mL/min, respectively. At a flow rate of 100 mL/min, the peaks in Case 3 and Case 4 are slightly to the left, and at a flow rate of 1000 mL/min, the peak in Case 3 is slightly to the left. However, there is no significant difference in the distributions for any of the cases. Table 3 shows the mean number diameter for each Case. In Case 3, where the amplitude is 2.94 times larger, the mean bubble diameter is slightly smaller than in the other cases at all flow rates. This is thought to be due to the fact that the larger oscillation amplitude results in a greater acoustic downward stream when generating microbubbles, which reach the bottom of the water tank faster, thus preventing coalescence and agglomeration caused by ultrasound, resulting in the original bubble diameter values. Makuta et al. reported that the size of bubbles generated by a hollow ultrasonic horn is affected by the frequency of the ultrasonic waves used, the surface tension coefficient, and the density of the liquid [6]. Therefore, increasing the tip area and amplitude is not expected to affect the bubble size.

4. Practical Application and Future Trends

The major achievement of this study is the discovery of the effect of the oscillating area of the hollow ultrasonic horn on microbubble generation, which has not been the focus of attention until now. We believe that microbubbles can be applied to a wide range of industries, including agriculture, fisheries, and medicine, because of their unique characteristics, and we believe that the findings of this study can be applied there. However, the advantage of the hollow ultrasonic horn is blowing gas into high temperature and highly viscous fluids, and we expect further practical applications through the generation of large amounts of microbubbles in fields such as the generation of ozone microbubbles [17] and porous metal generation [18].
In order to further extend this research and apply it to practical applications, we believe that this study can be further extended by combining several techniques, such as changing the shape of the hole at the tip and multidirectional compound oscillation. The results of this study also suggest that increasing the oscillating area has a positive effect on microbubble generation even if the amplitude is suppressed, so further optimization of the hollow ultrasonic horn and the shape of the connecting horn can be expected to improve the generation at higher flow rates.
The use of horns under prolonged and high amplitude conditions, such as dissolved oxygen concentration, is also an issue to be addressed in the future due to the effects of erosion and less durability. In this regard, simulation analysis is essential, including the reduction in development cost and development time. The phenomenon of blowing microbubbles into a liquid is a gas–liquid two-phase flow, and a theoretical model has been constructed [19,20,21]. Once the horn is fabricated, the oscillating area cannot be changed, but simulation allows for quick optimization, which will bring us closer to the expansion and application of this research.

5. Conclusions

In this study, the tip area of a hollow ultrasonic horn, a microbubble generator, was increased and combined with a conventional horn to compare four conditions, namely small area low amplitude, large area low amplitude, small area high amplitude, and large area high amplitude, to investigate the effect of the increased tip area on microbubble generation. The results are as follows.
  • Increasing the oscillation amplitude is necessary for stable microbubble generation, and increasing the tip area at an oscillation amplitude slightly above the threshold for microbubble generation has little effect.
  • For microbubble generation at high gas flow rates, the amount of microbubbles generated can be significantly increased by increasing the tip area while keeping the oscillation amplitude sufficiently larger than the threshold value.
  • Both oscillation amplitude and tip area have little effect on the bubble diameter distribution.

Author Contributions

Conceptualization, T.M.; methodology, K.H., N.Y. and T.M.; validation, K.H. and N.Y.; formal analysis, K.H.; writing—original draft preparation, K.H.; writing—review and editing, K.H. and T.M.; supervision, T.M.; funding acquisition, T.M. All authors have read and agreed to the published version of the manuscript.

Funding

This study is based on results obtained from a project, JPNP20004, subsidized by the New Energy and Industrial Technology Development Organization (NEDO).

Institutional Review Board Statement

Not applicable.

Informed Consent Statement

Not applicable.

Data Availability Statement

All data generated or analyzed during this study are included in this published article.

Conflicts of Interest

Author Nobuhiro Yabuki was employed by the Ebara Corporation. The remaining authors declare that the research was conducted in the absence of any commercial or financial relationships that could be construed as a potential conflict of interest. The funders had no role in the design of the study; in the collection, analyses, or interpretation of data; in the writing of the manuscript; or in the decision to publish the results.

References

  1. Tsuge, H. The Latest Technology on Microbubbles and Nanobubbles; CMC Publishing Co., Ltd.: Tokyo, Japan, 2007; pp. 1–296. [Google Scholar]
  2. Zimmerman, W.B.; Hewakandamby, B.N.; Tesar, V.; Bandulasena, H.C.H.; Omotowa, O.A. On the design and simulation of an airlift loop bioreactor with microbubble generation by fluidic oscillation. Food Bioprod. Process. 2009, 87, 215–227. [Google Scholar] [CrossRef]
  3. Tsuge, H. Fundamentals of microbubbles and nanobubbles. Bull. Soc. Sea Water Sci. 2010, 64, 4–10. [Google Scholar]
  4. Kukizaki, M.; Goto, M. Spontaneous formation behavior of uniform-sized microbubbles from Shirasu porous glass (SPG) membranes in the absence of water-phase flow. Colloids Surf. A Physicochem. Eng. Asp. 2007, 296, 174–181. [Google Scholar] [CrossRef]
  5. Ohnari, H. The Characteristics and possibilities of micro bubble technology. Min. Mater. Process. Inst. Jpn. 2007, 123, 89–96. [Google Scholar]
  6. Makuta, T.; Suzuki, R.; Nakao, T. Generation of microbubbles from hollow cylindrical ultrasonic horn. Ultrasonics 2013, 53, 196–202. [Google Scholar] [CrossRef]
  7. Kataoka, H.; Kameda, R.; Makuta, T. Optimization of orifice shape and oscillatory displacement of an ultrasonic microbubble generator to increase microbubble yield. Adv. Exp. Mech. 2020, 5, 31–37. [Google Scholar]
  8. Neppiras, E.A. Very high energy ultrasonics. Br. J. Appl. Phys. 1960, 11, 143. [Google Scholar] [CrossRef]
  9. Electronic Industries Association of Japan. Ultrasonic Engineering, 3rd ed.; CORONA Publishing Co., Ltd.: Tokyo, Japan, 1999; pp. 77–79. [Google Scholar]
  10. Chiba, C. Ultrasonic Spray; SANKAIDO Publishing Co., Ltd.: Tokyo, Japan, 1990; pp. 42–171. [Google Scholar]
  11. Lewis, W.K.; Whitman, W.G. Principles of Gas Absorption. Ind. Eng. Chem. 1924, 16, 1215–1220. [Google Scholar] [CrossRef]
  12. Leighton, T.G.; Walton, A.J.; Pickworth, M.J.W. Primary Bjerknes forces. Eur. J. Phys. 1990, 11, 47–50. [Google Scholar] [CrossRef]
  13. Hatanaka, S.; Yasui, K.; Kozuka, T.; Tuziuti, T.; Mitome, H. Influence of bubble clustering on multibubble sonoluminescence. Ultrasonics 2002, 40, 655–660. [Google Scholar] [CrossRef] [PubMed]
  14. Weiss, R.F. The solubility of nitrogen, oxygen, and argon in water and seawater. Deep. Sea Res. Oceanogr. Abstr. 1970, 17, 721–735. [Google Scholar] [CrossRef]
  15. Davidson, G.R. Use of SF6 to label drilling air in unsaturated, fractured rock studies: Risk of over-purging. Appl. Geochem. 2002, 17, 1361–1370. [Google Scholar] [CrossRef]
  16. Jiao, J.; He, Y.; Kentish, S.E.; Ashokkumar, M.; Manasseh, R.; Lee, J. Experimental and theoretical analysis of secondary Bjerknes forces between two bubbles in a standing wave. Ultrasonics 2015, 58, 35–42. [Google Scholar] [CrossRef] [PubMed]
  17. Syukuya, N.; Makuta, T. An Experimental Study on Disinfection System using Ozone Microbubbles Generated by the Hollow Ultrasonic Horn. J. Jpn. Soc. Exp. Mech. 2011, 11, 116–121. [Google Scholar]
  18. Saito, Y.; Nozawa, H.; Xing, W.; Makuta, T. Porous Fabrication of White Metal Using Ultrasonically Generated Microbubbles. Metals 2023, 13, 1648. [Google Scholar] [CrossRef]
  19. Dias, F.; Dutykh, D.; Ghidaglia, J.M. A two-fluid model for violent aerated flows. Comput. Fluids 2010, 39, 283–293. [Google Scholar] [CrossRef]
  20. Meyapin, Y.; Dutykh, D.; Gisclon, M. Velocity and Energy Relaxation in Two-Phase Flows. Stud. Appl. Math. 2010, 125, 179–212. [Google Scholar] [CrossRef]
  21. Makuta, T.; Takemura, F. Simulation of micro gas bubble generation of uniform diameter in an ultrasonic field by a boundary element method. Phys. Fluids 2006, 18, 108102. [Google Scholar] [CrossRef]
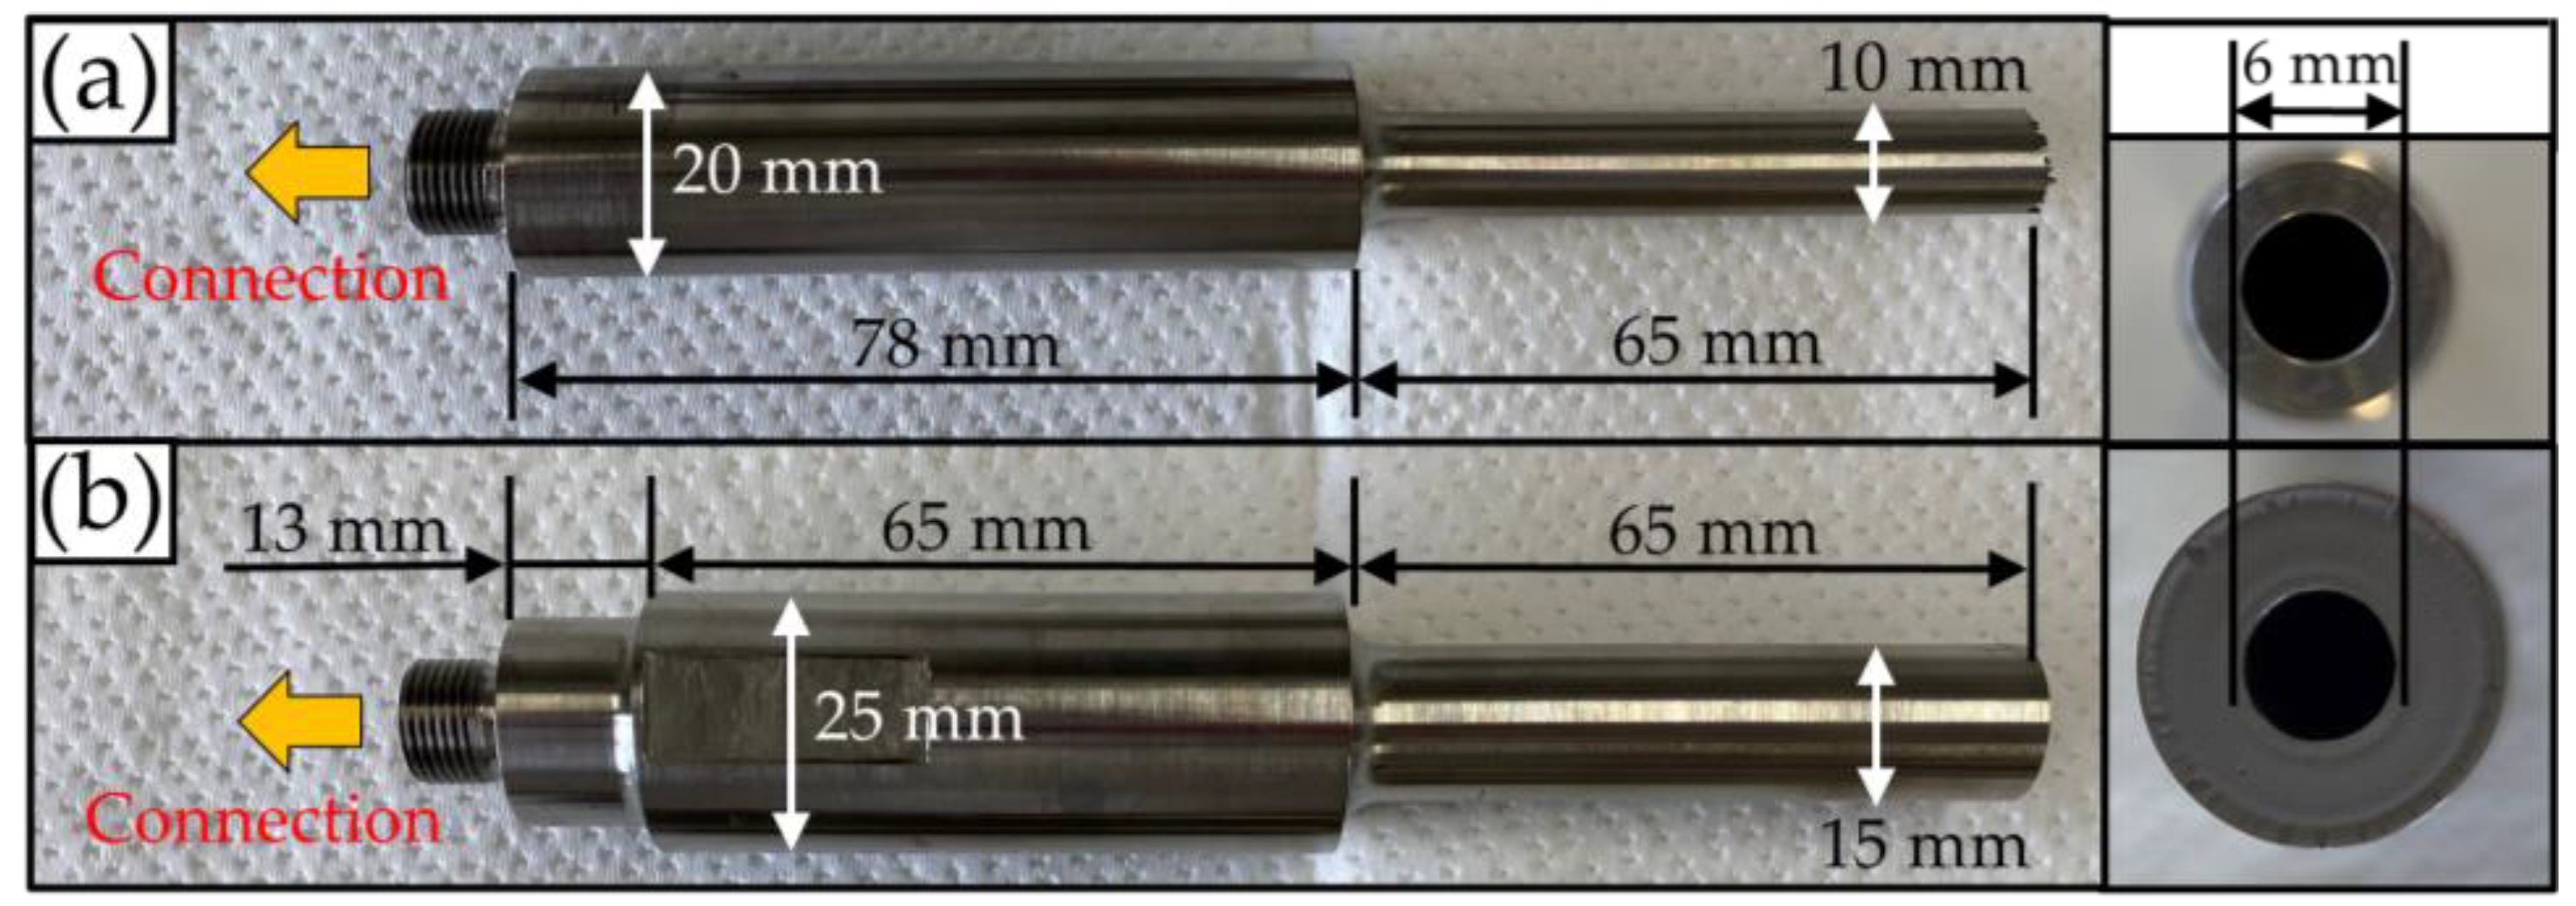
Figure 1. Device configuration for microbubble generation.
Technologies 12 00074 g001
Figure 2. Configuration of hollow ultrasonic horn.
Technologies 12 00074 g002
Figure 3. Configuration of hollow ultrasonic horn connected to the horn tip in Figure 2. (a) Amplitude enhanced horn; (b) balanced-type horn.
Technologies 12 00074 g003
Figure 4. Experimental apparatus used to measure the dissolved oxygen concentration.
Technologies 12 00074 g004
Figure 5. Microbubble generation behavior in different Cases: Case 1 (Default), Case 2 (Large Area), Case 3 (High Amplitude), and Case 4 (Large Area, High Amplitude).
Technologies 12 00074 g005
Figure 6. Dissolved oxygen concentration at the flow rate of 100 mL/min.
Technologies 12 00074 g006
Figure 7. Dissolved oxygen concentration at the flow rate of 500 mL/min.
Technologies 12 00074 g007
Figure 8. Dissolved oxygen concentration at the flow rate of 1000 mL/min.
Technologies 12 00074 g008
Figure 9. The overall mass transfer coefficient (KLa).
Technologies 12 00074 g009
Figure 10. Bubble diameter distribution at the flow rate of 100 mL/min.
Technologies 12 00074 g010
Figure 11. Bubble diameter distribution at the flow rate of 500 mL/min.
Technologies 12 00074 g011
Figure 12. Bubble diameter distribution at the flow rate of 1000 mL/min.
Technologies 12 00074 g012
Table 1. Experimental conditions.
CaseHorn TypeOscillating AreaAmplitude
1 (Default)(a)50.3 mm293 µm
2 (Large Area)(b)148 mm293 µm
3 (High Amplitude)(a)50.3 mm2274 µm
4 (Large area, High Amplitude)(b)148 mm2162 µm
Table 2. Temperature at the end of dissolved oxygen concentration for each Case.
End Temperature [°C]Case 1Case 2Case 3Case 4
100 mL/min11.613.014.714.8
500 mL/min11.613.217.715.6
1000 mL/min11.013.214.615.0
Table 3. The mean number diameter for each Case.
Case100 mL/Min500 mL/Min1000 mL/Min
1 (Default)39.7 [µm]41.6 [µm]42.9 [µm]
2 (Large Area)41.2 [µm]40.7 [µm]41.9 [µm]
3 (High Amplitude)34.7 [µm]34.6 [µm]33.4 [µm]
4 (Large Area, High Amplitude)34.0 [µm]37.3 [µm]36.4 [µm]
Disclaimer/Publisher’s Note: The statements, opinions and data contained in all publications are solely those of the individual author(s) and contributor(s) and not of MDPI and/or the editor(s). MDPI and/or the editor(s) disclaim responsibility for any injury to people or property resulting from any ideas, methods, instructions or products referred to in the content.

