Abstract
This paper provides a comprehensive analysis of recent advancements in additive manufacturing, a transformative approach to industrial production that allows for the layer-by-layer construction of complex parts directly from digital models. Focusing specifically on Directed Energy Deposition, it begins by clarifying the fundamental principles of metal additive manufacturing as defined by International Organization of Standardization and American Society for Testing and Materials standards, with an emphasis on laser- and powder-based methods that are pivotal to Directed Energy Deposition. It explores the critical process mechanisms that can lead to defect formation in the manufactured parts, offering in-depth insights into the factors that influence these outcomes. Additionally, the unique mechanisms of defect formation inherent to Directed Energy Deposition are examined in detail. The review also covers the current landscape of process evaluation and non-destructive testing methods essential for quality assurance, including both traditional and contemporary in situ monitoring techniques, with a particular focus given to advanced machine-vision-based methods for geometric analysis. Furthermore, the integration of process monitoring, multiphysics simulation models, and data analytics is discussed, charting a forward-looking roadmap for the development of Digital Twins in Laser–Powder-based Directed Energy Deposition. Finally, this review highlights critical research gaps and proposes directions for future research to enhance the accuracy and efficiency of Directed Energy Deposition systems.
1. Introduction
Additive Manufacturing (AM) is the term preferred by the International Organization of Standardization (ISO) and American Society for Testing and Materials (ASTM) standards, instead of three-dimensional (3D) printing. AM processes start by taking the information from a Computer-Aided Design (CAD) file that is later converted to a stereolithography or Standard Tessellation Language (STL) file, which slices the 3D model drawing into numerous small triangles for mesh generation that holds the information of each layer. Subsequently, the process involves printing successive layers of materials that form a 3D object following the desired CAD design. The general definition of AM, in accordance with ISO/ASTM 52900 [1], is “a process of joining materials to make parts from 3D model data, usually layer upon layer, as opposed to subtractive manufacturing and formative manufacturing methodologies”—which, respectively, remove material from an initial bulk volume or shape objects from pre-fabricated dies. The adoption of this standard serves a dual purpose: it not only harmonizes the transition from design concept to production, enhancing global competitiveness and collaboration, but also ensures a universal understanding among diverse stakeholders. This includes industries, academic institutions, and society at large, aiming to eliminate ambiguities and foster a unified approach to AM processes.
The rise of AM technology has piqued the attention of the industrialized world. In 2012, the United States President’s Council of Advisors on Science and Technology (PCAST) strongly recommended that the White House make significant investments in AM technology, expected to provide a competitive advantage in the manufacturing sector [2]. By 2015, the United Nations followed suit by urging other nations to invest in AM technology, predicting substantial business growth and a robust economy as a consequence of the technology [3]. Due to this growing interest from all stakeholders, numerous entrepreneurship programs and business incubators have been established to assist existing companies and even spin-off startups from universities in accelerating their innovation and transformation in 3D printing technologies [4]. According to a report, the AM sector is expected to grow at a Compounded Annual Growth Rate (CAGR) of 22.3% from a USD 20 billion industry in 2024 [5]. By 2030, it could reach a staggering estimated value of between USD 100 billion and USD 550 billion [6]. Although some areas of the AM sector have experimented with using AM for the production of parts, large-scale adoption remains limited. This fact has spurred more than 200 entities to compete in the development of new materials, hardware, and software to overcome the different challenges and fuel growth in the industry, aiming to widen their offerings in various sectors. According to Google Trends, as shown in Figure 1, public interest in “3D printing” has increased more than 50-fold since 2010, while traditional manufacturing methods such as machining, forging, injection moulding, and die casting have seen a decline in popularity. However, in 2017, traditional manufacturing techniques including machining, forging, and injection moulding saw a modest resurgence in popularity, with notable increases in regions like Russia, Mexico, and Spain. Meanwhile, China and Japan demonstrated a pronounced preference for injection moulding over 3D printing. In contrast, neighbouring countries, such as Singapore and South Korea, showed a stronger commitment to advancing 3D printing technologies.
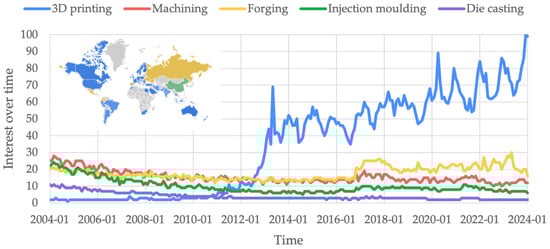
Figure 1.
Global public interest trends for “3D Printing” and other traditional manufacturing processes. Source: extracted from “Google Trends” on 12 January 2024.
AM technology has transformed the world of manufacturing and logistics by providing a range of materials, techniques, and equipment, which improve the lead time in the supply chain and enable faster product development cycles. This includes reduced time and cost, minimised human interaction, and the capability to create almost any shape, which would be very difficult to achieve with the conventional methods [7,8]. Importantly, AM can speed up the time-to-market for new components by facilitating in-house testing of various adumbrated prototypes before introducing them to the market or end-users. Additionally, AM offers a significant advantage in its ability to concurrently produce multiple components of either identical or different shapes within the designated build area of the same job, resulting in a reduction in costs. This cost-reduction aspect of AM is particularly apparent in the production of a smart mix of complex components, whereas conventional manufacturing processes require the creation and transportation of numerous intermediate products for assembly [9]. For instance, manufacturing jet engine housing using conventional methods would require the creation and shipment of numerous parts from different locations, each originating from its own factory equipped with specialized manufacturing machines such as forging, stamping, and casting. This process demands substantial investments in material inventory, finished goods inventory, staffing, and transportation infrastructure, among other resources. However, AM technology enables the production of jet engine casing with reduced material usage through part consolidation, which involves re-designing multiple interacting components into a single integrated system, thereby enhancing technical performance and bypassing typical supply chains [6,10]. This disruptive innovation leads to a more cost-effective manufacturing process by enabling the fabrication of parts traditionally assembled as integral components, potentially decreasing overall weight and reducing the need for joints or fasteners, in contrast to conventional manufacturing.
The history of AM technology dates back to 1986 when Charles Hull developed stereolithography (SLA), the first type of vat photopolymerization process [11]. Not long after, 3D Systems introduced the SLA-1, their first product, to market in 1988 [12]. Undeniably, the SLA process has become a cornerstone of AM, paving the way for the development of other methods, including Powder Bed Fusion, Material Extrusion, Material Jetting, Binder Jetting, Sheet Lamination, And Directed Energy Deposition [13,14]. These technologies have broad applications across different material classes, such as metals, ceramics, polymers, and composites, depending on their intended use. To accomplish effective material joining, these materials have to be in pliable forms, such as powder, filament, wire, sheet, strip, and liquid feedstock; the combination of appropriate heat sources depends on the selected technology, such as lasers, electron beam, or plasma arc [13]. For example, in AM, two distinct laser processing techniques exist: curing and heating. In the case of photopolymer resins, the laser must operate at a precise frequency to solidify or cure the liquid resin effectively. Conversely, when processing materials that require heating, the laser must generate sufficient thermal energy to melt or fuse the feedstock.
The narratives surrounding the technological shift towards rapid AM development have been made possible by significant cost reductions, the expiration of earlier patents, and the re-licensing of many laser and optics systems over the last two decades [11,15,16,17]. As a result, vendors can now develop new AM machines with increasingly better capabilities and functionalities across a wider range of applications, making AM more accessible than ever before. This accessibility has led to rapid advancements in AM, resulting in the emergence of new applications, such as novel materials, Functionally Graded Materials, different AM methods, functional prototypes, topology optimization, and product customization, among others [18,19,20].
2. Metal Additive Manufacturing
Complex mechanical products are often an intricate assembly of components, involving anywhere from tens to thousands of small parts, which are traditionally welded, bolted, or press-fit together—a process that, while effective, introduces inefficiencies. This complexity necessitates a paradigm shift from the traditional Design For Manufacture and Assembly (DFMA) approach to a Design For Additive Manufacturing (DFAM) philosophy [21,22]. Since its inception, AM has undergone significant evolution driven by continuous advancements in equipment and innovative ideas. Despite their diverse forms, these innovations share a common goal: building 3D objects layer by layer on a designated workspace—unlocking possibilities for complex design geometries and embedded components. Metal AM, in particular, has emerged as a disruptive force and stands out for its ability to wield the potent tool of parts consolidation and, thereby, rewrite the rules of complex mechanical design [23].
Implementing metal AM entails a structured process flow that includes five key steps: model generation and preparation, the AM build process, in-process sensing, post-processing, and integration into service, as shown in Figure 2.
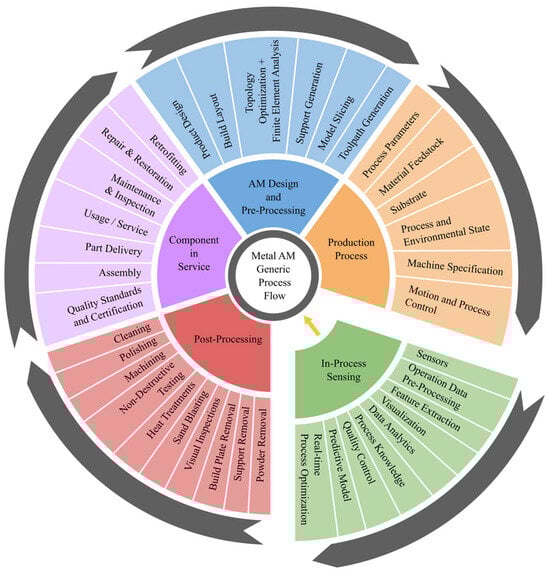
Figure 2.
Generic process flow of metal AM is represented by the dark gray arrow. Meanwhile, the yellow arrow signifies addressing the gap in AM technology by incorporating in-process sensing and its detailed analysis.
Firstly, effective product design involves a series of crucial steps, including material selection, topology optimization, and slicing software. However, designing parts for AM requires special attention to pre-processing data and file formats. To initiate the modern manufacturing process, designers must first utilise appropriate software to create and analyse a CAD file. This file is then transformed into an STL file before being imported into pre-processing software like Ultimate Cura, Materialize Magics, Slic3r, Autodesk Netfab, and others. This software enables designers to orient and manipulate parts on a virtual build plate and add support or lattice structures. As a result, pre-processing software generates a Geometric Code (G-Code) or Numerical Control Code (NCC) file that contains toolpath information, enabling an option for virtual build simulation before implementation. Moreover, depending on the printing mode of the axis and the capabilities of the AM machine, both fixed (planar) and variable (non-planar) layer thickness across each layer can be achieved, provided that the slicing software supports this functionality [24,25]. This step is essential for DED technology because, unlike Powder Bed Fusion (PBF), it does not require any support structures. However, the level of geometric complexity that can be manufactured is dependent on the system used. For instance, 2½-axis or 3-axis DED can achieve only limited geometric complexity, whereas 5-axis DED allows for much greater geometric freedom.
The introduction of topology optimization [26]—a computational analysis technique that minimizes material usage while preserving desired performance—further enhances the capabilities of metal AM and is usually coupled with Finite Element Analysis (FEA). This elegant approach allows for the creation of multi-functional components that unlock a cascade of benefits, redefining the landscape of complex mechanical systems:
Lightweighting: Streamlined, consolidated parts inherently possess a lower mass, translating to reduced energy consumption (due to less inertia to overcome) and optimized fuel efficiency. This is particularly significant in applications where energy conservation is paramount, such as in aerospace and automotive engineering.
Simplified supply chains: By eliminating the need for a plethora of individual components and their associated suppliers, metal AM fosters lean and agile supply chains. This reduces logistical complexities, lowers associated costs, and streamlines production processes.
Enhanced performance: Topology optimization unlocks the potential for optimized internal structures, leading to improved strength-to-weight ratios, superior stiffness, and enhanced mechanical performance. This opens the doors for lighter, more robust, and efficient machinery across diverse fields.
However, the transformative potential of metal AM extends beyond mere part consolidation. It unlocks the fascinating realm of Functionally Graded Materials (FGMs) [27], enabling the seamless integration of multiple advanced materials with different properties within a single component. This opens unprecedented possibilities for the following:
Tailored material properties: FGMs allow for the precise placement of material properties within a component, precisely where they are needed most. This optimizes performance, minimizes material waste, and enables the creation of components with hitherto unimaginable properties.
Enhanced functionality: The integration of disparate material properties within a single component can enable novel functionalities, pushing the boundaries of what is achievable. This paves the way for innovative applications in fields ranging from biocompatible medical implants to high-performance aerospace components.
Secondly, the production process commences with the preparation of the machine setups and materials. While some variables are predetermined (constant), others are latent, making them difficult to monitor. Material feedstock, substrate characteristics, and machine specifications are among those variables that are constant. Additionally, other environmental factors such as carrier and shielding gases, plasma distribution, spatters, and whether the atmosphere is opened or closed are often latent variables that require monitoring [28]. However, some of these factors can be controlled and adjusted as needed before or during the process. This is achieved by optimizing process parameters based on a selected material database, motion, and process control. Parameters such as laser power, scan speed, material feed rate, hatch spacing, inter-layer dwell time, and scan strategy can be adjusted to achieve the desired outcome. Further details on this production process and its key parameters can be found in Section 3.2. Section 4 provides an explanation of how these parameters are linked to the quality of the process and how defects can arise as a result.
Thirdly, the widespread use of metal AM presents a unique challenge. Even if the same material is used, the process parameters optimized for one part may not yield the same results for another part design [29]. This issue arises because even minor changes in the process can lead to significant variations, causing deviations from optimal settings. These deviations can result from residual heat not fully dissipating before adding a new layer [30], geometric variations from the previously deposited layers altering the Standoff Distance (SoD) between the nozzle and the uppermost surface of the layer, subsequently affecting the powder catchment efficiency and specific energy density delivered to the localized deposition [31,32,33], or different scanning strategies impacting heat accumulation and layer height stability [34,35]. Subsequently, these can result in defects such as porosity, cracks, and irregular surface finishes, ultimately compromising the structural integrity and quality of the final product. This is why incorporating an in-process sensing step into the metal AM process flow is crucial. It ensures that the parts produced are of high quality and that the fabrication process remains stable, despite the fluctuations that occur during the deposition process. Various sensors are available for metal AM applications, depending on the monitoring required and the intended purpose of the fabricated parts. Inspections have been categorized by Chua et al. [36] into multiple stages, namely (1) single-layer inspection, (2) multi-layer inspection for void detection across multiple layers, and (3) final inspection, which occurs off-process or post-processing. For dimensional accuracy, machine vision sensors or laser-based scanning are suitable, while temperature distribution monitoring is ideal for achieving different microstructural properties across the build parts. Ultrasonic sensors can detect sub-surface and internal porosities. Efficiently executing the entire process flow using multiple sensors and stages concurrently requires various data pre-processing techniques to accurately extract the necessary features from each process signature [37,38]. Making sense of process signatures can be challenging, requiring a deep understanding of AM process knowledge. As a multi-stage digital manufacturing process, metal AM provides ample opportunities for data-driven decision-making. The abundance of data collected throughout the AM design-to-production process transformation creates opportunities for process improvements at every step.
Fourthly, several post-processing steps are necessary before delivering a component to end-users. To determine the required operations, it is crucial to raise fundamental questions during the design phase. These issues may arise during or after post-processing, so considering them early on is essential. Questions to ensure the blueprint is viable and conforms to the required specifications include determining whether there are internal cavities or overhang surfaces, or if any post-process machining, welding, brazing, or assembly is necessary. Additionally, it is important to consider the requisite heat treatments and inspections for the intended function and whether specific surface finish requirements are necessary for the final application. Sandblasting is typically used to remove powder attached to the surface of the print. However, in complex structures with internal cavities, it may be difficult to reach these areas through visual inspection. In such cases, X-radiation (X-ray) imaging or X-ray Computed Tomography (XCT) are commonly used to check if any of the tiny chambers are blocked from the powder. Ardent readers are urged to refer to Refs. [16,39,40] for more information on the post-processing phase.
Lastly, proper qualification and certification are crucial factors in the widespread implementation of metal AM across different industries. Several studies have outlined the necessary standards in metal AM to expedite the qualification and certification process and guarantee success [10,14,41,42,43]. Moreover, metal AM has become increasingly prevalent in Maintenance, Repair, and Overhaul (MRO) operations, especially in the aerospace industry, which is responsible for maintaining and servicing existing aircraft fleets. Metal AM offers a modern solution for refurbishment, offering a more viable alternative to the complete replacement of components and addressing the critical need for repair in aging, high-value components within the supply chain [16]. This approach not only prolongs the lifespan of structures but also facilitates the reintroduction of components into service, thereby minimizing overall costs. An additional benefit of metal AM is its capability to fabricate replacement parts for items that are no longer manufactured but still in use.
Adhering to these steps enables businesses to effectively reduce manufacturing costs, shorten production times, and improve overall efficiency. Therefore, adopting this process flow is paramount to achieving successful metal AM implementation.
The revolutionary impact of metal AM on complex mechanical design is profound, offering a paradigm shift away from intricate assemblies towards consolidated, lightweight, high-performance components with the potential for FGMs. Metal AM technology has the power to redefine the future of engineering and continue to propel the manufacturing ecosystem forward by enabling the on-demand production of high-value components, thus creating a landscape of more efficient, versatile products across various industries due to its on-demand manufacturing capability. It has already shown its value in diverse fields, from medical implants to aerospace components. For instance, in the medical field, it has successfully produced diverse surgical titanium implants [44]. Similarly, the aviation industry has witnessed remarkable improvements with the GE9X engine heat exchangers—originally composed of 163 components but now an integrated single component—which is 40% lighter and cheaper by 25% [10]. Likewise, the A-CT7 engine mid-frame—once seven assemblies with 300 parts—is now a single piece without additional assembly, shedding five kilograms in return [6]. SpaceX has also achieved 40% reductions in production time and weight for their engines using metal AM [10,45]. The National Aeronautics and Space Administration (NASA) is planning similar applications for the Space Shuttle’s main engine [45]. Astonishingly, the world’s first printed metal bridge, a 10.5-m wonder spanning Amsterdam’s Oudezijds Achterburgwal canal, is a testament to metal AM’s versatility, even in the construction industry [46]. These advancements are a beacon of AM’s potential, which extends beyond these high-tech domains. Hence, these success stories and reports of rapid growth have significantly boosted metal AM’s recognition, leading to a heightened focus on its reliable production of consistent mechanical properties for high-value components.
An in-depth examination of the literature categorizes metal AM technologies based on various factors, such as their energy source, feeding material type, feedstock distribution system, basic AM principle, and layer bonding technique (fusion or non-fusion based), as illustrated in Figure 3. Metal AM involves several types of fusion, including melted, solid, chemically bonded, or thermally bonded. The type of fusion depends on the energy source used during the process, such as high-energy beams like electrons, plasma arcs, and lasers, or other methods like ultrasonic or friction, reactive curing, and heated nozzles. Feedstock materials come in various forms, such as wire, powder, or sheet. In exceptional cases, special bonding techniques may be required; for instance, a liquid binder may be necessary to selectively cure pre-laid powder, or powder may be infused within the filament form. Depending on the technology, material distribution can be achieved through nozzle deposition or a pre-laid powder bed with roller/scraper and sheet stack. Also, in some cases, a print head is necessary to selectively deliver the liquid binder, instead of the feedstock material, onto the pre-laid powder bed. Based on these factors, we can classify five distinct metal AM families. These five distinct families—Material Extrusion (ME), Binder Jetting (BJT), Sheet Lamination (SL), Powder Bed Fusion (PBF), and Directed Energy Deposition (DED)—each have unique advantages and applications [6,10,14,16,40,41,47,48,49,50,51,52,53,54,55,56,57,58,59,60]. According to 2020 market share data [14], as illustrated in Figure 4, PBF technology dominates industrial adoption with over 54% of the market share. DED technology follows closely behind and is on par with the combination of BJT and Material Jetting technologies, equivalent to 16%, respectively. ME and SL technologies are the least utilized in the industry. However, a recent report in 2024 indicates that the global AM with metal powders market has seen drastic growth in DED, reaching almost 35% of the market share, whilst PBF technology remains stagnant at 54.4% [61]. The report from Market.Us shows an increasing global market trend of metal-powder-based AM in terms of market growth by type [61].
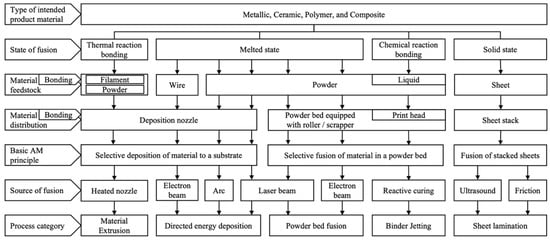
Figure 3.
AM technologies suitable for metallic materials.
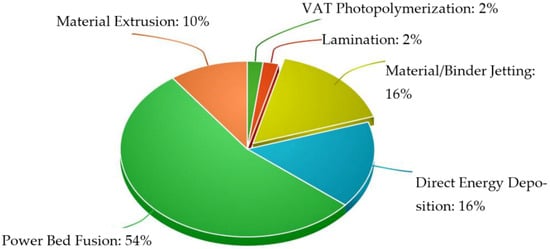
Figure 4.
AM technology market shares in 2020 [14].
SL is a solid-based method where metal sheets are stacked on top of each other and fused using ultrasound or friction [57,59]. The sheets can be trimmed to the desired shape prior to bonding or can be machined into the desired shape after the layers are joined. SL is primarily used to produce parts that are low in feature complexity. The parts manufactured using the SL process may not function properly when subjected to shear and tensile loading, owing to the anisotropic properties resulting from the bonding method used [57]. Additionally, achieving geometric accuracy in the z-direction can be challenging due to swelling effects.
ME is a widely used technique for producing filaments composed of plastics, polymers, ceramics, and even metals. The process involves infusing metal powder into a plastic or polymer filament, which is then heated to a specific temperature and extruded through a heated nozzle onto a substrate [14,58]. Whilst the parts are not purely metallic, they do have metal content. However, to achieve a high-density fully metallic part using the metal ME technology, two additional post-processing operations are necessary: washing and sintering [14,58].
The PBF process begins with a thin layer of pre-laid powder spread across a levelled build plate, achieved through the use of a powder feedstock tank and a recoated blade or powder scrapper. Typically, the powder layer is only tens of micrometres thick [16]. Once the powder layer is in place, a scanner head system positioned above the build platform activates and a thermal heat source (either a laser or electron beam) selectively melts or sinters the metal powder particles together. This process is repeated layer by layer until a complete part is formed. To prevent oxidation of the molten metal, the entire process is carried out within an enclosed build chamber with an inert atmosphere. PBF allows for the use of a broad range of metal and metal alloys and provides exceptional feature resolution, fine microstructure, and fully dense parts. Additionally, when the powder is melted, not sintered, into a liquid state and rapidly solidified, it produces homogeneous and fully dense parts [58].
BJT is akin to PBF, but instead of using an energy source, it relies on a chemical reaction that employs liquid binder droplets to bond the powder together using an inkjet printhead [57,58]. After printing the initial layer, a heated or Ultraviolet lamp is utilized to dry and cure the binder. The liquid binder is allowed to infiltrate and flow into the voids between the metal powder particles to achieve a uniform distribution. The build plate moves in the z-direction, similar to the PBF recoating of a thin, new layer of powder, and the process is repeated until the part is completed. Porosity is a major concern in these parts as the BJT process is essentially a powder metallurgy process [57]. Due to its porous nature, the part is fragile and must be further cured first and sintered to reduce porosity and achieve densification by burning off the excessive binder. An additional step available in BJT is the infiltration process, where the process uses a lower melting temperature alloy to infiltrate the printed structure with a second metal, resulting in a denser material.
It is worth noting that the metal AM industry is rapidly expanding, with new technologies and discoveries being made constantly. For instance, the basic AM principle of Cold Spray technology is similar to DED; the only difference is that the metal powders are instead accelerated at supersonic speeds using compressed gas and then bonded onto a substrate [62,63].
PBF and DED are undoubtedly the two most widely utilized AM processes for metal components with near full density due to their melting fusion state [10], representing a significant 70% of the metal AM market in 2020 due to their high technology readiness levels in the aerospace industry [14,51]. The precision and consistency of metal AM techniques can pose challenges when developing intricate structures [16]. For instance, DED methods can attain surfaces that closely resemble the final shape with deviations of just 0.5 mm, whilst other techniques may deviate by as much as 2.54 mm. Alternatively, PBF can achieve precision up to 0.05 mm, indicating that PBF-manufactured components might not necessitate polishing, depending on the application [64]. Despite the limitations of the DED process, which is limited by low geometric accuracy and typically has tolerances of less than 0.25 mm and surface roughness of less than 25 µm, these tolerances and surface finishes are print-speed-dependent, and slower print speeds improve the surface quality of finished parts. Whilst PBF has a finer feature resolution size, its build volume is rather restricted, requiring a larger build container to accommodate the maximum dimensions of the build, which must be filled with metal powders. In contrast, DED technology offers freeform fabrication—simultaneously melts the incoming feedstock material stored in a separate refillable container as it is being deposited—with scalability limited only by the robotic and gantry systems.
Moreover, the mechanical properties of DED are generally inferior to those of PBF. This disparity is primarily due to the lower cooling rate in DED, resulting in coarser grain sizes compared to the finer grains in PBF, which contribute to higher strength [65]. The coarser microstructure in DED samples resembles that of wrought materials, known for poor workability and ductility. The cooling rate in PBF is higher because the powder bed acts as a heat sink, rapidly dissipating heat from the melted area, leading to faster cooling rates. In contrast, DED cooling occurs mainly through conduction to the underlying layers and the base plate, with some heat loss to the ambient air or inert gas, both of which have lower thermal conductivity.
Additionally, the slightly larger laser beam spot size in DED results in a larger melt pool and thicker layers, further reducing the cooling rate [66]. DED involves depositing thicker layers at a faster rate than PBF, meaning these layers retain more heat for longer periods before subsequent layers are added. In PBF, very thin layers are used, allowing each layer to cool rapidly before the next is deposited. The high surface-area-to-volume ratio of thin layers enhances the cooling rate in PBF.
Both DED and PBF specimens exhibit typical laser AM defects such as Lack-of-Fusion (LoF) and porosity. A recent study shows that DED samples have more severe transgranular cracking, likely due to thermal stresses inherent in the deposition process [65]. This cracking indicates a more brittle mechanical behaviour in DED materials, often attributed to alloy incompatibility and insolubility, which can produce brittle intermetallic phases that cannot tolerate these residual stresses, leading to detrimental cracks and compromised mechanical properties [67].
Furthermore, material versatility in DED technology remains limited because certain alloys are prone to issues such as oxidation (highly reactive alloys: magnesium alloys) and vaporization of elements (low melt point alloys: zinc alloys) during the deposition process [68,69]. Subsequently, when mixing different materials (e.g., titanium aluminides) in DED, the varying melting temperatures of each constituent require specific heat inputs, potentially causing selective vaporization of elements with lower melting points, leading to difficulties in achieving uniform melting and solidification [70]. Differences in density and liquid surface tension can lead to the segregation of alloying elements during rapid solidification, dimensional inaccuracies, porosity, and unmelted particles. Meanwhile, PBF has a controlled environment, and rapid cooling can help mitigate these issues, making it a better choice for alloys with complex compositions or those prone to segregation and oxidation. Mixing different materials lowers powder efficiency and recyclability compared to PBF [71].
Moreover, DED offers several advantages over other metal AM technologies, enabling the creation of complex structure geometries without support mechanisms. However, this capability heavily relies on the kinematics of the systems used, which may involve the utilization of rotary axes to position components for non-planar operations, for instance, in the case of five-axis machines [25]. The feasibility of this approach varies based on factors such as the application, size of the part being produced, and the available budget [6]. For example, a more straightforward three-axis machine can perform well enough for printing simple structures on flat surfaces. Nevertheless, use of the five-axis system can mitigate reach and access issues for complex geometric capabilities and even facilitate the repair of intricate and freeform components that cannot be manufactured with three-axis machines. For example, a helicopter engine combustion chamber was successfully built using the multi-axis DED process, with an overall density of over 99.5% and an accuracy of 0.8 0.9 mm [72]. The fly-to-buy ratio was less than what would be expected from Computer Numerical Control (CNC) machining, with the estimated machining time of 2 months reduced to only 4.5 h. In contrast, PBF would require an additional step to remove supporting structures after fabrication, which could increase production lead time [64]. In addition, DED can process a variety of commercial powder metallurgy materials. It can create fully dense parts with single-crystal structures, and the microstructure can be tailored due to its unique ability to accommodate several materials (multi-alloy capabilities) in a single build while controlling the solidification rate of the deposited material [58]. An investigation by Optomec found that their DED process was 20 times faster than PBF, taking 240 h to complete and costing USD 16,800, while the Optomec LENS 850R DED took 13 h at the cost of USD 3200 [73]. As a result, DED technology has become increasingly popular, especially in the aerospace industry, where wire and powder feedstock materials used for DED machines are abundant, affordable, and convenient, and high printing speeds (build rate) give rise to a relatively economical process for medium- to large-sized components. Most importantly, another apparent advantage of DED is its capability not only in the fabrication process but also in other versatile functionalities, which offer other business opportunities, such as repairing, retrofitting, or coating high-value components [74,75].
3. Directed Energy Deposition
The process of DED shares many similarities with welding processes in terms of how it affects materials through localised heat [76]. Both methods induce melting, solidification, solid-state phase transformations, residual stress, and distortion, with comparable underlying mechanisms. However, a key difference distinguishes the two processes: welding involves the fusion of two parts to form a more intricate piece, whereas DED fabricates a singular complex component from the ground up, which may or may not necessitate joining or welding to other subcomponents. Another point of contrast between the two processes is the smaller Heat-Affected Zone (HAZ), associated with DED but not welding [77]. Another distinction lies in the control method; DED is consistently computer-controlled, ensuring uniform deposits, precision, and control over the melt pool shape, whereas welding can vary between manual and computer-controlled processes depending on the application. From a metallurgical standpoint, DED exhibits higher cooling rates than conventional welds, leading to fabricated parts with superior mechanical properties compared to their as-cast counterparts [78].
DED utilizes a highly focused energy beam to instantaneously liquefy incoming feedstock materials onto the substrate, creating a molten pool that rapidly solidifies as the deposition head moves along predetermined trajectories. This unique capability enables DED to perform surface coating, repairs, or even retrofitting work on an existing high-value component, which also serves as a substrate. Conversely, constructing a 3D object component from a bottom-up approach necessitates a substrate fixed to a three-axis or tilt/rotary (four- or five-axis) worktable, from which the finished part(s) must be detached post-process. The deposition head comprises multiple components, including a thermal energy source, feedstock delivery system, inert gas tubing to prevent oxidation during the process, and, in some cases, sensors. The feedstock delivery system feeds either powder or wire material onto a focal point that coincides with the thermal energy source. For powder material, a single-nozzle, discrete coaxial nozzle, or continuous coaxial nozzle can continuously feed the powder stream. In contrast, a wire feeder system includes an electro-wire feeder with a variable-speed engine and a control engine to drive the electrodes at a uniform rate.
DED technology can be classified into different classes based on its thermal energy sources (e.g., laser, electron beam, electric arc, or plasma) and the form of feedstock used (e.g., wire and powder). The machine’s capabilities are dictated by the combination of various factors, which are often denoted by varying terms and trademarks unique to each manufacturer, as listed in Table 1. For instance, wire-based DED has the highest build rate compared to powder-based DED but with a lower feature resolution.

Table 1.
Other abbreviations of DED technology.
DED covers a range of terminology, and the common ones include Laser Engineered Net Shaping (LENS) owned by Optomec, Direct Metal Deposition (DMD) by DM3D; Wire Arc Additive Manufacturing (WAAM) developed by DigitalAlloys, FIT technologies, and GEFERTEC; Laser Metal Deposition (LMD) by DMG Mori; Directed Energy Deposition (DED) by Prima Additive, InssTek, and Hwacheon; Electron Beam Additive Manufacturing (EBAM) by Sciaky; and Laser Metal Deposition (LMD) by Trumpf and Raycham. Among the different DED technologies, the focus of this study is exclusively on Laser–Powder-based DED (LP-DED) technology.
Generally, there are five different types of lasers: (1) solid-state lasers, such as Neodymium-doped Yttrium Aluminium Garnet (Nd:YAG) or disk lasers; (2) gas lasers, such as a Carbon Dioxide (CO2) lasers; (3) liquid dye lasers; (4) semiconductor diode lasers; and (5) fibre optic lasers, such as Ytterbium (Yb) [6]. However, the literature has yet to report meaningful AM applications using liquid dye lasers. Lasers can be categorised as continuous wave, including gas lasers, solid-state lasers, and dye lasers, and pulsed wave lasers [83].
Moreover, the interaction of blown powder with the laser beam leads to laser attenuation, with the lowest ratio of attenuated-to-original laser power observed at the centre of the laser beam. This suggests that powder closest to the centre absorbs more energy and can even melt mid-flight. Such laser–powder interactions, in conjunction with the inert gas, generate a molten pool or liquid metal with a HAZ beneath, showing varying penetration depths. This phenomenon, known as dilution, represents the minimum level of metallurgical bonding between layers, typically ranging from 10% to 30% [84,85]. Dilution can be simply described by the melt pool Height-over-Depth (H/D) ratio [86,87]. Samples characterized with an H/D > 1 tend to exhibit LoF between tracks due to the shielding effect of the previously deposited clad. This is considered unacceptable as it can lead to cracks and de-bonding in multi-layer components. After the complete deposition of a single layer, the deposition head shifts vertically to a specific amount relative to the workpiece/substrate, known as the z-increment, and the process repeats following the G-code.
Despite the successful use of DED technology in the industry, the reliability and repeatability of the process remain significant challenges for both industry and academia. Achieving high-quality fabricated parts is complex due to the multitude of process parameters involved in the process, as depicted in Figure 5, which was explained in more detail in Section 2 and is closely related to the generic process flow of metal AM in step 2 of Figure 2. The quality of the finished product can be evaluated in terms of geometrical accuracy and deviation from nominal dimensions, mechanical properties, and the presence of internal and external defects. Achieving a high-quality component requires adjusting and optimizing the process parameters to align with the continuously and instantaneously changing physics of the process.
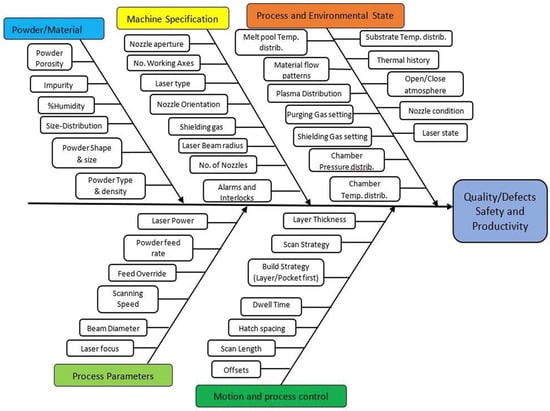
Figure 5.
The fishbone diagram in relation to various variables and quality [88].
3.1. The Melt Pool Morphology
In DED applications, the formation and dynamics of the melt pool play a pivotal role, bearing resemblance to the processes observed in laser welding. The melt pool serves as the starting point of the fabricated part, making its morphology a key indicator of process effectiveness. A consistent melt pool size is strongly correlated with high part quality [75]. The shape of the melt pool depends on various factors during the DED process, as illustrated in Figure 5. As illustrated in Figure 6, the melt pool’s morphology is characterized by a region of superheated molten metal appearing near the interface of the feedstock and energy source. It assumes a spherical shape dictated by the prescribed speed based on the scan strategy. The melt pool is subject to a variety of complex physical phenomena, including heat dissipation through convection and radiation, phase changes, and heat conduction, as well as Marangoni convection due to the thermocapillary effect, which influence the Marangoni flows induced by temperature gradients [75]. Additional physical phenomena, including vapour plume effects, gravity, recoil pressure, and spatters, further shape the melt pool characteristics [54,89,90]. These dynamics are critical for determining the quality of the printed part, showcasing the intricacies of the process.
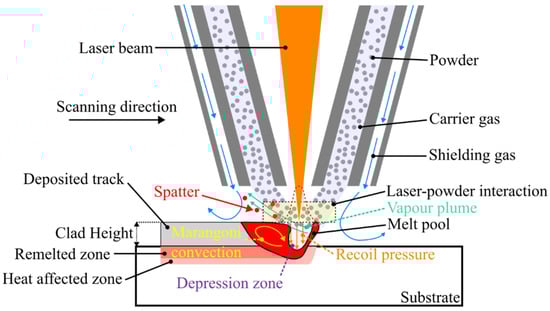
Figure 6.
Schematic of melt pool morphology during DED process. The heat distribution in the laser beam follows a Gaussian distribution, represented as a red dashed line.
There are two modes of melt pool formation in high-energy sources in metal AM: conduction mode and keyhole mode [54]. In conduction mode, the material melts locally to form a shallow pool that is typically wider than it is deep, which helps reduce defects. However, when the energy density is high enough, the process transitions to keyhole mode. In this mode, a deep and narrow pool is formed as the metal evaporates, generating recoil pressure and creating a depression that extends from the surface down into the melt pool, known as a keyhole.
In the DED process, significant temperature variations within the melt pool and the HAZ results in differences in surface tension across the melt pool, causing Marangoni convection [6,91]. Surface tension, which is temperature-dependent, varies spatially on the surface of the fusion zone [90]. For pure metals, an increase in temperature generally leads to a decrease in surface tension, a trend that also applies to most alloys [90,91,92]. However, certain alloying elements in steel and nickel alloys, such as sulphur, selenium, nitrogen, and oxygen, can alter how surface tension changes with temperature and their concentrations [6,90].
During the melting process, the temperature typically peaks at the centre of the laser beam. This peak, combined with the high-gradient vapor pressure, causes the molten liquid to move towards cooler regions and lower-pressure edges of the pool, which have higher surface tension. This movement results in an outward flow of molten material, leading to promoting further material displacement [6,90,91].
Leung et al. [93] highlighted that the mechanism for tracking growth critically relies on the vaporisation of the material, which exerts downward forces (recoil pressure) onto the melt pool to create a depression zone. This action, together with surrounding gases, helps entrain powder particles into the melt pool. Ki et al. [94] further added that both thermocapillary force (Marangoni) and recoil pressure are the primary drivers of melt pool flow and its stability. The extremely high temperatures generated by the heat source can cause the melt pool surface to exceed the material’s boiling point, increasing pressure within the molten material. This recoil pressure, resulting from the vaporization of metal, creates a high-velocity vapor plume. Increased vapor recoil can provide enough energy for the vapor plume to exit the keyhole and eject particles, a phenomenon known as spatter [54].
Despite these insights, a comprehensive understanding of the governing mechanisms and their interactions—both synergistic and antagonistic—are yet to be fully grasped. Numerous studies have attempted to describe the mechanisms and effects of various DED process parameters on the deposited geometrical characteristics, material microstructure, and defect formation [54,71,90]. The DED process is governed by the complex interplay of various process parameters, including powder particles, substrate, inert gas, and laser beam characteristics. These interactions, occurring instantaneously, are challenging to observe with the unaided eye. Therefore, a deep understanding of melt pool behaviour and characteristics is essential, as it directly correlates with the quality of the deposited track/clad.
3.2. Process Parameters and Their Relation to the Melt Pool Morphology
The DED process involves a variety of process parameters. The laser power, scanning speed, and powder mass flow rate are recognized as the three primary variables in DED operations [71,79,95,96,97,98,99]. These three parameters are all interrelated; for instance, an increase in feed rate has a similar effect on lowering the beam power. Likewise, increasing the beam power or powder feed rate and decreasing the scanning speed all increase deposit height. On the other hand, parameters such as the scanning strategy/pattern, hatch spacing, diameter of the energy source, inter-layer dwell time, shield gas flow rate, carrier gas flow rate, z-increment, and working distance are commonly defined as constant throughout the optimization process based on preliminary material-specific experimental data [71,95]. Optimization is usually conducted via the deposition and analysis of single-track, thin-wall, or bulk structures under various sets of processing parameters. In their 2016 study, Shim et al. [100] examined the impact of optimisation on the DED process, explicitly comparing the outcomes in terms of build height when correlating melt pool height with specific energy density. Their results underlined the importance of the optimisation process by establishing a connection between these essential parameters to enhance dimensional accuracy. Additionally, other intrinsic variables must also be considered, such as the properties of the powder and substrate materials (such as thermo-physical properties, mechanical properties, thermal conductivity, and specific heat), feedstock size (including powder particle size and distribution and wire diameter), laser beam type (such as Nd:YAG, CO2, and fibre lasers), nozzle type (including single, discrete coaxial, and continuous coaxial), and the operating environment (such as ambient temperature and inert gas).
Shim et al. [100] also delved into how various process parameters within the DED process can influence the morphology of the melt pool. It is widely acknowledged that the laser power, beam diameter, powder feed rate, and scanning speed are the key process parameters that significantly impact the temperature distribution and size of the melt pool [71,75,101]. It should be emphasised, however, that the microstructural formation and mechanical properties of the fabricated part(s) are directly influenced by thermal behaviour [74], which falls outside the scope of our present study and, therefore, will not be taken into account. Rather, our subsequent discussion will focus on the specific effects of these process parameters on melt pool size, such as the width, height, depth, and dilution of the melt pool. While the importance of melt pool width and penetration depth in laser cladding is well recognized, the role of melt pool height as a performance metric in laser deposition cannot be underestimated. It plays a crucial role in enabling precise control over vertical builds [85,102].
3.2.1. Laser Power
Many researchers have posited that there is a linear correlation between the size of the melt pool and laser power (W) [87,96,97,103,104,105,106,107,108,109,110,111,112,113]. However, contradictory results were found in the literature when analysing the effect of laser power on the height of the melt pool, indicating that the relationship between these variables is not linear [86,114,115,116]. Thus, its influence on the melt pool geometrical morphology is not well understood. In two separate studies, Pinkerton and Li [105] as well as Peyre et al. [104] investigated the effects of different laser power levels on the layer height of American Iron and Steel Institute (AISI) 315L stainless steel and TA6V titanium alloy powders, respectively. Interestingly, both studies concluded that the layer height remained unaffected while the layer width increased with laser power. Similar observations were made for Inconel 625 [114] and Inconel 718 [97,117] alloy powders. Researchers have suggested that this phenomenon is caused by the amplification of energy, with the higher laser power resulting in a radial spread of energy from the centre of the laser beam to its edges [114]. On the other hand, Srivastava et al. [118] and Carrozza et al. [86] observed that increasing the value of laser power results in a reduction in layer height for Ti-6Al-4V titanium alloy powders, while Saeedi et al. [109] showed that the layer height increases with laser power with Nickel–Chromium (NiCr) and Titanium Carbide (TiC) alloy powder. Despite these varied findings, the general consensus is that higher laser power results in a larger melt pool size in various types of alloy powder [87,103,107,110,111,112,113,114]. This holds true even for the Inconel 718, which was previously believed to be impervious to laser power [97,117], but further investigations discovered that both previous studies had utilised a high laser power of 350–2000 W. Another study conducted with the laser power ranging from 2500 to 3400 W indicated a reduction in melt pool height [108]. Conversely, a separate investigation revealed that utilising a lower laser power range of 100–200 W resulted in an increased melt pool height [112], with a slight increase in height noted at the 250–400 W power range [103]. Contrarily, some findings have yielded inconclusive results [115].
Multiple factors play a role in determining the effects of laser power on the melt pool size, as tabulated in Table 2. To summarise what has been described so far, typically, increasing laser power from lower levels has a significant impact on the size of the melt pool in all directions, including height, width, and depth. However, as laser power continues to increase while other process parameters remain constant, the linear relationship between laser power and melt pool height decreases. Feenstra et al. [114] and Mazzarisi et al. [85] asserted that this change occurs because the increase in melt pool size with increased laser power becomes less significant once the saturation level of some kind of energy is reached. Instead, the percentage of melt pool depth penetration into the build increases significantly. Additionally, the maximum depth of penetration and dilution occurs when the laser power is at its maximum and scan speed is medium.
Furthermore, maintaining a proper parity between the Standoff Distance and the actual layer height is essential for ensuring workpiece height accuracy, which can be adjusted through the z-increment [119]. The Standoff Distance—the distance between the nozzle and workpiece—plays a key role in influencing the actual layer height, as it directly affects the laser beam spot size, which is intricately connected to the laser-defocusing power distribution [120]. These parameters significantly impact the focal plane during the deposition process. Caution is necessary if the Standoff Distance falls short or exceeds the pre-defined threshold, as it can hamper the efficiency of the specific energy density required to fully melt the feedstock to a specified height or volume. A study has explored this relationship, often represented as a Gaussian-like distribution, with the actual layer height being highest at the focal point or central to the mean [119]. Neglecting this aspect may lead to adverse effects on subsequent build layers.
Table 2.
Effects of primary build parameters on the geometrical characteristics of the deposited melt pool.
Table 2.
Effects of primary build parameters on the geometrical characteristics of the deposited melt pool.
| Ref. | Analysis | Structure | Material | Melt Pool Size | For an Increase in Each Input Variable the Output Effect Is Shown by Symbol 1 | |||||||
|---|---|---|---|---|---|---|---|---|---|---|---|---|
| Substrate | Powder | Laser Power | Scanning Speed 2 | Powder Feed Rate | Standoff Distance | Hatch Spacing | Beam Size | |||||
| [103] | Linear Regression | Single-track | Annealed Inconel 718 | Inconel 718 | Height | ↑ | ↓ | ↑ | ||||
| Width | ↑ | ↓ | — | |||||||||
| Depth | ||||||||||||
| Dilution | ||||||||||||
| [104] | 2D Visualization | Thin-wall | TA6V alloy | TA6V alloy | Height | — | ↑ | |||||
| Width | ↑ | — | ||||||||||
| Depth | ||||||||||||
| Dilution | ||||||||||||
| [105] | 2D plot | Thin-wall | EN43A (AISI 1050) mild steel | AISI 316 Stainless Steel (50–150 μm) | Height | — | ↓ | ↑ | ||||
| Width | ↑ | ↓ | — | |||||||||
| Depth | ||||||||||||
| Dilution | ||||||||||||
| [96] | 2D plot | Single-track | Stainless-steel 316L | Steel alloy EN25 | Height | |||||||
| Width | ↑ | ↓ | ↑ | |||||||||
| Depth | ||||||||||||
| Dilution | ||||||||||||
| [114] | ANN | Single-track | Mild Steel | SS316L (D90: 50–150 μm) | Height | ↑ | ↓ | ↑ | ↑ | |||
| Width | ↑ | ↓ | — | ↑ | ||||||||
| Depth | ↑ | ↓ | ↓ | ↓ | ||||||||
| Dilution | ↑ | — | ↓ | ↓ | ||||||||
| Inconel 625 (D90: 50–150 μm) | Height | — | ↓ | ↑ | ↑ | |||||||
| Width | ↑ | ↓ | — | ↑ | ||||||||
| Depth | ↑ | — | ↓ | ↓ | ||||||||
| Dilution | ↑ | ↑ | ↓ | ↓ | ||||||||
| Hastelloy X (D90: 50–150 μm) | Height | ↑ | ↓ | ↑ | ↑ | |||||||
| Width | ↑ | ↓ | — | ↑ | ||||||||
| Depth | ↑ | — | ↓ | ↓ | ||||||||
| Dilution | ↑ | ↑ | ↓ | ↓ | ||||||||
| [87] | Image analysis | Single-track | 316L stainless-steel | AISI 316L (80 µm) | Height | ↑ | ↓ | |||||
| Width | ↑ | ↓ | ||||||||||
| Depth | ↑ | ↓ | ||||||||||
| Dilution | ||||||||||||
| [113] | Response Surface Methodology | Double-tracks | Al6061 | Al5083 | Height | ↑ | ↓ | ↑ | ↓ | |||
| Width | ||||||||||||
| Depth | ||||||||||||
| Dilution | — | ↑ | ↓ | ↑ | ||||||||
| [112] | Linear Regression (Empirical–Statistical analysis) | Single-track | A-286 Stainless Steel | Inconel 718 (45–90 µm) | Height | ↑ | ↑ | |||||
| Width | ↓ | ↓ | ||||||||||
| Depth | ||||||||||||
| Dilution | ↓ | ↓ | ||||||||||
| [111] | Linear Regression | Single-track | Inconel 738 | NiCrAlY (50–100 µm) | Height | ↑ | ↓ | ↑ | ||||
| Width | ↑ | ↓ | — | |||||||||
| Depth | ||||||||||||
| Dilution | — | ↑ | ↓ | |||||||||
| [110] | Linear Regression | Single-track | Ti-6Al-4V | Ti-6Al-4V (90–125 µm) | Height | ↑ | ↓ | ↑ | ||||
| Width | ↑ | ↓ | — | |||||||||
| Depth | ↑ | ↑ | ↓ | |||||||||
| Dilution | — | ↑ | ↓ | |||||||||
| [109] | 2D plot and image analysis | Single-track | Martensitic stainless-steel AISI 420 | Commercial powder of NiCr 80/20 (purity of 98%) and TiC | Height | ↑ | ↑ | ↑ | ||||
| Width | ↑ | — | ↑↓ | |||||||||
| Depth | ↑ | ↓ | ↓ | |||||||||
| Dilution | ↑ | ↓ | ↓ | |||||||||
| [108] | ANOVA | Single-track | SS316 | Inconel 718 (45–100 µm) | Height | ↓ | ↓ | ↑ | ||||
| Width | ↑ | ↓ | ↓ | |||||||||
| Depth | ↑ | ↓ | ↓ | |||||||||
| Dilution | ↑ | ↓ | ↓ | |||||||||
| [97] | Linear Regression, Image Analysis, Process maps | Single-track | Mild steel (S235JR) | Inconel 718 (45–105 µm) | Height | — | ↑ | |||||
| Width | ↑ | — | ||||||||||
| Depth | ↑ | ↓ | ↓ | |||||||||
| Dilution | ↑ | — | ↓ | |||||||||
| [107] | Response Surface Methodology, Linear Regression, ANOVA | Singe-track | Copper | CuCrZr alloy (D90: 59.91 μm) | Height | ↑ | ↓ | ↑ | ||||
| Width | ↑ | ↓ | ↑ | |||||||||
| Depth | ↑ | ↓ | ↓ | |||||||||
| Dilution | ↑ | ↓ | ↓ | |||||||||
| [115] | Response Surface Methodology, ANOVA, 2D plot | Single-track | Ti6Al4V | Ti6Al4V | Height | ↑↓ | ↓ | ↑ | ||||
| Width | ↑↓ | ↓ | ↓ | |||||||||
| Depth | ↑↓ | ↓ | ↓ | |||||||||
| Dilution | ↑↓ | ↓ | ↓ | |||||||||
| [116] | 2D visualisation and compare their microstructural properties | Single-track | Wrought Alloy 718 | Alloy 718 (40–105 μm) | Height | ↑↓ | ↓ | — | ||||
| Width | ↑ | ↓ | ↑ | |||||||||
| Depth | ↑ | ↑↓ | ↑↓ | |||||||||
| Dilution | ↑ | ↑ | ↓ | |||||||||
| [121] | Response Surface Methodology | Single-track | 316L Stainless steel | 316L Stainless steel (45–53 μm) | Height | ↓ | ↑↓ | ↑↓ | ↑↓ | |||
| Width | ↓ | ↑↓ | ↑↓ | ↑↓ | ||||||||
| Depth | ||||||||||||
| Dilution | ||||||||||||
| [85] | Linear Regression, ANOVA, Analytical Model | Single-track | AISI 304 Stainless steel | Nickel-based superalloy (15–45 µm) | Height | ↑↓ | ||||||
| Width | ↑↓ | |||||||||||
| Depth | ↓ | |||||||||||
| Dilution | ↓ | |||||||||||
| [86] | 2D visualisation | Single-track | Ti-6Al-4V | Ti-6Al-4V | Height | ↑ | ||||||
| Width | ↑↓ | |||||||||||
| Depth | ↑↓ | |||||||||||
| Dilution | ↑ | |||||||||||
| [106] | Response Surface Methodology, ANOVA | Single-track | AISI 1045 | AISI M4 (53–150 µm) | Height | ↑ | ↑ | |||||
| Width | ↑ | ↑ | ||||||||||
| Depth | ||||||||||||
| Dilution | ↑ | ↑ | ||||||||||
| [99] | ANOVA | Single-track | S355 low alloyed steel | AISI 316L stainless steel (53–150 μm) | Height | |||||||
| Width | ||||||||||||
| Depth | ↑ | ↓ | ||||||||||
| Dilution | ||||||||||||
1 “↑” means positive correlation; “↓” means negative correlation; “—” no effects reported; “↑↓” means mixed effects. 2 The scanning speed column is divided into two parts because some studies investigate the relationship between laser power and powder feed rate with respect to scan speed. These studies consider the interdependence effects of specific energy and powder densities, respectively.
3.2.2. Scan Speed
The rate at which the deposition head moves along a predetermined path, commonly known as the scan speed, travel speed, or traverse speed, significantly influences the local heat flux and melt pool size due to its time component. Controlling the speed can help maintain a constant melt pool size throughout the part build. This scan speed, typically measured in velocity, such as mm/s, may vary along specific axes or combinations of axes, such as around corners or along radii. The motion system controls the speed, with a gantry-type system capable of providing a more consistent travel speed than a robotic arm [16]. Thompson et al. [75] and Shamsaei et al. [74] defined the amount of heat generated, referred to as the specific energy density (J/mm2), as a function of laser power, traverse speed, and beam radius, quantifying the amount of energy delivered per unit area of material:
where P is the laser power (J/s), is the laser scan speed (mm/s), and d is the laser beam diameter (mm). The formula aids in understanding the interdependent effects of these parameters on the geometrical features of the deposited material [86]. Research often varies one parameter, such as laser power, while keeping other parameters constant to explore their interdependence [122,123]. It is important to note that linear energy density calculations may disregard the laser beam diameter [71,86], while volumetric energy density can consider beam area [71,75] or incorporate layer thickness—the latter is more commonly associated with PBF [124].
The scan speed, which typically ranges between 1 and 20 mm/s for a given part geometry [75], naturally affects the time required for the DED process. Increasing the scan speed reduces the build time for a component but may negatively impact component quality. For instance, a faster scan speed can lead to a reduction in melt pool height, resulting in an elongated-looking shape that penetrates less into previously deposited layers due to insufficient energy for the powder particles to melt or fuse fully. This can impact the Heat-Affected Zone and result in a higher cooling rate, leading to better microstructural properties, e.g., a finer equiaxed grains structure [74,75], which can enhance mechanical properties like strength and hardness [125,126]. However, this unoptimized specific energy density can come at the expense of dimensional accuracy and resolution [71,127], where deposited layers may not achieve the desired layer thickness, resulting in variations across the fabricated part(s).
Apart from scan speed, hatch spacing and scanning pattern are also important parameters for ensuring the densification of the fabricated part, as they greatly influence the thermal history and can result in a more uniform microstructure; but, they may also introduce variations in melt pool height [16,128]. These parameters, determined by the operator before the DED process, influence the position of the laser beam. The hatch spacing is crucial for ensuring sufficient joining between deposition beads; otherwise, LoF defects may occur. Typically, an ideal hatch spacing falls between 30% and 50% [16]. The scan pattern generally consists of contour and infill, with the infill pattern accomplished through a back-and-forth striping scan pattern. Common scanning patterns used in DED include zig-zag, parallel, and spiral, depending on the starting point of deposition. By selecting the appropriate scanning patterns, the production of residual stresses, thermal distortion, or even edge collapsing can be minimised [129]. The zig-zag pattern is widely used due to its ease of implementation, as it is not dependent on the shape of the fabricated part [74].
Table 2 illustrates the effects of scan speed on the melt pool size. The majority of the studies concluded that increasing the scan speed would reduce the melt pool size due to the reduction in specific energy density on the region [87,96,103,105,107,108,111,113,115,121]. Contradictorily, Saeedi et al. [109] discovered that the height of NiCr alloys tends to increase as the scan speed is elevated at a constant power. However, a similar study indicated that the height of the bead actually decreases with an increase in scan speed with the same material type [130]. This variations can be attributed to the different types of lasers utilised on the two studies. The former employed a pulsed laser, which has a higher peak power compared to the continuous wave laser used in the latter [83]. Notably, other factors like the substrate, powder morphology, and laser spot diameter can also influence the size of the melt pool. The reason is that a few studies have findings that differ from the majority of the literature, such as depth increasing with scan speed [110], and a few studies have reported having mixed effects [114,116], as tabulated in Table 2.
3.2.3. Powder Feed Rate
The powder feed rate, measured in mass (g/min) or volumetric flow rate (cm3/min), is the amount of powder introduced onto the focal plane that converges with the laser beam; it is influenced by the inert carrier gas and the powder’s morphology. Integral to the powder flow rate is the jet shape of the powder injection. This jet shape is controlled by the flow rate, powder delivery nozzle design, and gas flow rates, and, thus, the focal plane may vary based on variations in the powder flow rate. For instance, Gao et al. [31] determined that the continuous coaxial nozzle should be positioned farther away (higher SoD) than the discrete nozzle, due to the fact that continuous nozzle has less powder dispersion, thus exhibiting a greater laser irradiation rate and powder mass concentration. Specifically, the laser irradiation rate is 10% higher, and the powder mass concentration is 66.7% higher than that of the discrete nozzle. A more comprehensive overview of the powder feedstock handling in DED is given in reference [62].
It has been found that particle speed increases with increasing carrier gas flow rate [32]. Several studies have suggested that high particle velocity leads to a decrease in powder catchment efficiency along with a deteriorated surface finish of the deposited clad [62]. In addition, the powder catchment efficiency value increases with decreasing carrier gas flow rate and increases with increasing powder feed rate. Furthermore, the powder mass concentrations noticeably vary with the change in the SoD, with an initial rapid increase before gradually decreasing with an increase in the SoD, similar to a Gaussian distribution [32].
In addition, the secondary shielding gas flow also has an impact on the jet shape of the powder. Generally, the shielding gas protects the processing space from oxidation and other harmful gas intrusion [75,131], with both the carrier and shielding gas commonly using an inert gas, such as argon [62,75]. Carrozza et al. [86] investigated the effects with and without shield gas and it was found that samples that were deposited without shield gas were characterized by a colourful external surface, ranging from golden to blue–purple due to excessive oxygen enrichment in the alloy, causing the samples to be become more brittle.
Despite the focus on laser power and scan speed, the powder feed rate is another crucial parameter affecting deposition efficiency. It is crucial to take into account the impact of the powder feed rate on the melt pool size. For instance, increasing the SoD would lead to a decrease in depth for all levels of laser power. Interestingly, at a fixed laser power, while increasing the speed, two variations exist: decrease in depth at lower SoD and increase at higher SoD. This result aligns with other findings from Saboori et al. [33], in which they investigated how the nozzle position affects the geometry of the melt pool in the Directed Energy Deposition process. They argued that the reason behind this strange variation in the depth increment at a higher SoD could be related to the lower efficiency of powder captured by the melt pool and, consequently, the higher energy density absorbed by the substrate. Detailed examination of this behaviour is supported by Lin et al. [120], who conducted an empirical investigation on the effects of powder defocusing on deposition efficiency, which asserted that if the powder defocus deviates from the optimal setting, poor dimensional accuracy of the structure is noticeable, i.e., the build height became lower than desired. However, the laser defocus experiment found that if the laser focus is below the substrate, the lower areas on the cladding surface have higher energy than the higher areas. This encourages the growth of lower areas, compensating for the uneven level on the top surface, thus making the level quality self-correcting. Research has shown that the SoD, which influences melt pool geometry, can be controlled by adjusting laser and powder defocus during the initialisation phase before printing begins. Modifying the z-increment after each layer will directly impact the SoD.
Additionally, multiple studies have provided empirical support for the importance of the powder feed rate and its direct association with scan speed [71,106,120]. This correlation, also known as powder density (g/mm2), can be expressed in the following manner:
where G is the powder mass flow rate. Similar to specific energy density, powder density can be simplified to be represented as a linear mass feed rate, ignoring the beam diameter [99,112]. In a similar fashion, Traxel et al. [132] created a comparison value that correlates the powder feed rate and scan speed with the laser power.
Contradictory findings are present in the academic literature regarding the impact of the powder feed rate on the width of the melt pool. Peyre et al. [104], Pinkerton et al. [105], Ansari et al. [111], Nabhani et al. [110], Mazzarisi et al. [133], and Bax et al. [97] conducted studies examining the impact of varying the powder flow rate and concluded that this parameter does not significantly affect the width of the melt pool. Similarly, Sampson et al. [96] observed that, at lower laser power levels, the width remained unaffected by an increase in the powder feed rate. However, when the laser power level exceeded 1000 W, the width began to slightly increase. This increase in melt pool width was further supported by Lee et al. [106] and Zardoshtian et al. [107], where more pronounced effects were observed when high levels of laser power were utilized. This can be attributed to the Gaussian distribution of high laser power, which results in a maximum temperature at the centre of the melt pool, with temperature disparities between the centre and edges of the melt pool leading to differences in surface tension. This causes the transfer of molten metal from the centre to the edges, ultimately widening the clad, as investigated by Gullipalli et al. [108]. The authors further asserted that an increase in the number of powder particles introduced into the laser stream can lead to greater energy attenuation and, consequently, a narrower clad width. This finding is also supported by Sun and Hao [115]. Interestingly, Saeedi et al. [109] reported different results, noting that at higher laser power levels the width decreases with an increase in the powder feed rate, while at lower laser power the width increases. Despite these conflicting findings, the existing literature generally concurs on two key elements: the height of the melt pool is primarily associated with the quantity of powder injected into the pool, compromising the depth of the melt pool, as clearly indicated in Table 2. This relationship is attributed to the fact that the quantity and spatial distribution of the powder within the laser’s interaction region significantly influence the height of the clad; as more powder is added, it absorbs more thermal energy, resulting in less energy for creating the melt pool and consequently reducing the penetration depth into the substrate [85]. Feenstra et al. [114] argued that there exists a non-linear correlation between the powder feed rate and scan speed, which influences the level of dilution.
4. Defects in DED and Their Formation Mechanism
Although metal AM has been studied extensively, researchers are still trying to understand the combined impact of various parameters in ensuring high material deposition quality and minimizing defects. The stability and repeatability of DED are undermined by its dependence on various internal and external factors in a unique and combinatorial manner, which can result in defects within the printed object, as previously shown in Figure 5. AbouelNour and Gupta [134] stated that defects may emerge on the object’s surface, just below it, or deep within its internal structure, thereby compromising the object’s integrity and mechanical characteristics. Defects on the surface present themselves on the outermost layer of the print. Those found less than 500 from the top layer are termed sub-surface defects, whereas defects situated more than 500 beneath the surface are identified as internal. Such sub-surface and internal defects, which can manifest as pores, voids, or cracks, occur within the processing zone.
Liu et al. [88] provided a comprehensive overview of potential defects that may occur during the DED process, dividing defects into three main categories: geometrical, morphological, and microstructural defects. Geometrical defects, which result in deviations from the intended geometry, can cause variations in the form and dimensions of individual features. Various strategies have been suggested to mitigate these issues, aiming to reduce the need for post-processing and decrease the cycle time. Morphological defects, on the other hand, can affect the surface texture, surface finish, and surface topography, as well as bulk defects including pores, cavities, spatter, and inclusions. Lastly, microstructural defects are related to the microstructural aspects of the surface and sub-surface, leading to aesthetic irregularities such as discoloration, or even internal aspects that affect the mechanical properties of the part, such as non-uniform grain morphology. This study specifically focuses on geometrical and morphological defects, particularly, surface defects, deviations in the geometrical deposition, porosity, and cracks, to understand the root-cause analysis better. Defects related to microstructural properties are not discussed in detail as they fall outside the scope of this investigation.
4.1. Geometrical Defects
Geometric defects in DED processes may result in deviations from the intended shape and size outlined in CAD specifications, as well as surface roughness and deviations on the plane surface. These defects can compromise the structural integrity of the part, rendering it unsuitable for use. The literature identifies the most common geometrical defects in DED as falling into two categories: non-uniform layer thickness and edge collapse defects [88,135].
4.1.1. Non-Uniform Layer Thickness
Suboptimal process conditions can destabilize the surface tension of a molten pool through thermocapillary (Marangoni convection) and recoil pressure forces, causing spattering [71,136]. A more detailed description of spatter is further discussed in Section 4.2.2. Spatter forms as a subsidiary formation of disintegrated particles of molten spheres that burst from the molten pool, which can land haphazardly on the surface—forming an adhesive, partially melted powder particle that results in an irregular surface, also known as “balling” [71,137]. Balling can result in uneven layer thickness and exacerbate surface roughness, particularly on the side surfaces of components, negatively impacting subsequent layers if it occurs atop a previous layer [135,138], as shown in Figure 7. Additionally, factors such as process fluctuations and localized heat accumulation can further destabilize the melt pool, further degrading surface conditions. Heat accumulation, which intensifies the Marangoni effect and alters melt pool size due to increased specific energy density, occurs as the layer count increases, influenced by heat conduction and idle time between layers [75]. Balling, combined with process fluctuations and heat accumulation, can lead to severe under- or over-deposition, jeopardizing the dimensional accuracy of the parts, as shown in Figure 8. These unmelted metal powder grains on the upper surface (balling) are the primary cause of high variability in deposit height signals [139]. Fixed hatch spacing during the slicing process does not account for heat-accumulation-induced melt pool enlargement, potentially leading to excessive overlap and deposition [113]. Therefore, it is crucial to implement appropriate slicing strategies and interventions to mitigate these issues [88,124]. The balling process in metal AM, including both DED and PBF, shares a similar definition: dimensional inconsistency in the deposition profile, leading to poor bonding between layers when adjusting specific energy density to boost productivity and improve economic efficiency.
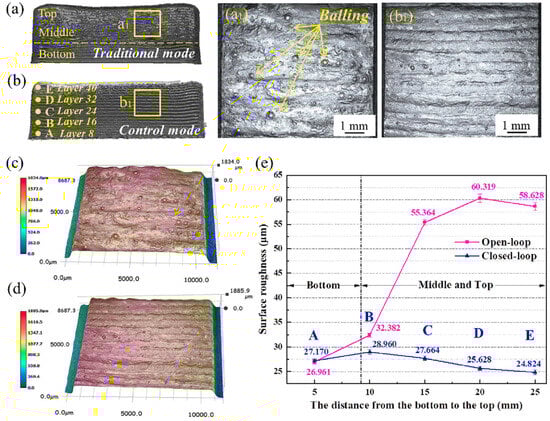
Figure 7.
The 3D surface morphology and surface roughness of a thin-wall structure are shown (a) without control and (b) with control. (a1,b1) The zoomed-in section of the region of interest highlights the differences in surface morphology between the two modes. In the traditional mode, some powder does not melt during the deposition process due to spatters, adhering to the specimen surface and forming larger balling defects. (c,d) Indicates that the flatness and finish of the specimen surface in the control mode are significantly improved. (e) Presents the surface roughness results for both modes, indicating that the roughness values at the bottom of the thin-walled parts are similar in the control mode. The dashed line in (a,e) is segmented at the bottom, separate from the other sections (middle and top), to emphasize the significant difference in surface roughness that deviates out of control in open-loop control. In contrast, the surface roughness in closed-loop control is stabilized and improved slightly [140].
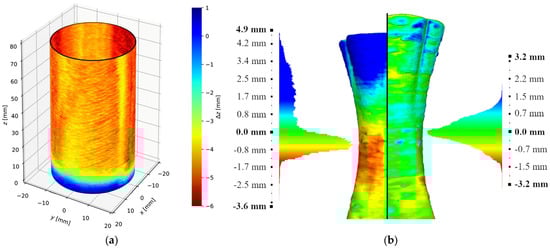
Figure 8.
(a) Discrepancy between the programmed robot height and the actual measured cylinder height [141]. (b) Comparison of the deviation of the deposited part from the input CAD model using a suboptimal controller (left) and an optimal controller (right) that adaptively adjusts the process parameters with reslicing after the completion of each layer [142].
4.1.2. Edge Collapse
Edge collapse in the DED process significantly impacts the precision of part geometry. Previous research by He et al. [129] examined the effect of scanning patterns on edge collapse and determined that commencing deposition from the edge to the inside yields better outcomes compared to the opposite approach, due to modification of the melt pool morphology caused by the overlapping of adjacent tracks, leading to a slight inclination of the molten pool over the neighbouring tracks. Recent findings [143] indicated that the deposition of molten pools along the edges of a surface can lead to collapse and adhesion to the sidewall, as shown in Figure 9a. This problem is exacerbated as the height of the parts increases, which can have a significant impact on sidewall quality. Lin et al. [120] reported that powder particles situated at the edge of the melt pool would liquefy and seep down the sidewall if the cladding width was less than the laser spot size. These particles would then stick to the wall after cooling and solidifying. Wang et al. [144] and Yu et al. [145] investigated the force conditions of the molten pool and discovered that collapse occurs when the balance between surface tension and the supporting force provided by the previous layer is insufficient to counteract gravity and impulsion force in the direction, as illustrated in Figure 9b. This condition is true even in the ME process [146]. The overhanging structure, improper defocusing distance, and improper energy density can further aggravate the edge collapse and powder adhering to the sidewall, leading to a severely uneven surface, low dimensional accuracy, and an increased need for post-processing or even material wastage [135]. This is because the unsupported overhanging structure’s horizontal offset increases dramatically with the inclination angle and z-increment , resulting in the staircase effect and leading to an unstable flow of the deposition molten pool liquid metal, ultimately resulting in collapse [144,147]. Employing sensors to ensure proper energy density coupled with the use of an appropriate scanning strategy, such as starting with a contour followed by infill, should minimize side collapse [16,88,129,148]. Additionally, utilising a double contour aids in curbing the edges from collapsing, thus increasing dimensional accuracy [16,149].
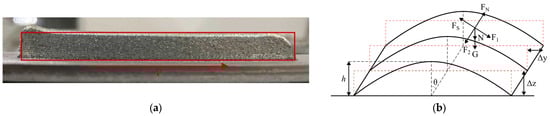
Figure 9.
(a) The morphology of a thin-walled part fabricated using LP-DED shows melt pool collapse at one end and over-deposition at the other, along with clear powder adhesion on the sidewall. The red box represents the desired geometrical shape [150]. (b) Schematic of overhang structure together with the force conditions of the molten pool.
4.2. Morphological Defects
Morphological imperfections emerge beneath the surface or within the body of the bulk component, necessitating the use of sophisticated characterization techniques, such as XCT or high-speed X-ray imaging for detailed analysis. Although these methods enable the accurate detection and assessment of defects in both sectioned samples and entire parts, their resolution is limited by the machine’s capacity. Whilst other methods, such as Archimedes and metallography, are available, they are prone to human error [151].
The Archimedes method is fast and non-destructive, but it can be challenging to use due to the difficulty in precisely knowing the theoretical density of the AM part. This difficulty arises because the chemical compositions of the powder and the AM parts may change due to the evaporation of alloying elements during the AM process.
Metallography, another method for porosity measurement, is a form of destructive testing that involves sectioning and mirror polishing the sample. The surface is then inspected under an optical microscope at different magnifications, providing high precision for pore recognition. However, the testing details, such as lens magnification and the number of photos taken at a specified magnification, can vary among researchers, potentially leading to different results.
4.2.1. Porosity
The existence of voids or porosity within a material, whether on the sub-surface or throughout the bulk, notably diminishes material density. There are three significant mechanisms that can lead to porosity formation: gas porosity, LoF, and keyhole [50,71]. Gas porosity originates from gases that are inherent in the initial powder used or may be introduced by the shield or carrier gases [152]. These gases can infiltrate the molten pool during the deposition process, gradually merging to form bubbles. Slow material solidification may allow bubbles to move away from the interface of the solid and liquid phases, potentially dispersing through Marangoni convection [153]. In contrast, rapid material solidification may cause the bubbles to be trapped along the solid–liquid interface and accumulate within the melt pool, leading to pore formation, as illustrated in Figure 10. To address this issue, Sohn et al. [154] conducted research on the application of pulse laser processes in the LP-DED process with the aim of enhancing the fluid dynamic forces that impact gas pores. Their findings revealed a remarkable over 90% decrease in the total pore count through the implementation of accelerated and turbulent Marangoni flow, ultrasonic waves, and shock waves within the melt pool.
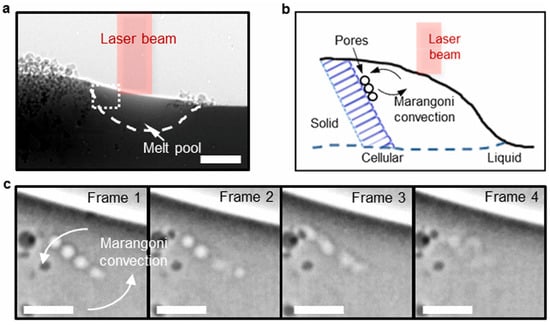
Figure 10.
Examination of pore formation in LP-DED of Ti-6242. (a) Radiograph of a single-layer track displaying the pore pushing phenomenon. (b) Schematic illustrating the pore-pushing mechanism in a DED-AM build using Ti-6242. (c) Enlarged time series radiographs of the highlighted area in (a), represented in a white box, showing pores swirling due to Marangoni convection at the back of the melt pool [153].
A different form of porosity, known as LoF, typically nonspherical in shape, occurs due to powder particles that remain unmelted or only partially melted. In the deposition process, a keyhole is formed when high energy density creates strong recoil pressure on the molten pool, and this pressure carves out a deep and narrow valley-shaped penetration in the material [94]. The destabilization of the melt pool due to the high-energy interaction leads to rapid radial convection, causing a bubble to build up ahead of the scanning laser and be pushed down and become trapped [93,155], resembling gas porosity. In some cases, spatter is expelled from the turbulent molten pool as a result of this process [50,156]. These issues can be readily resolved by applying the correct specific energy density to ensure complete melting of the powder [84,124]. Such defects are detrimental to the part’s structural integrity, promoting the initiation and spread of cracks and significantly reducing the material’s resistance to fatigue [88], as shown in Figure 11. Additionally, the presence of these voids can impair the material’s ability to conduct heat, as air-filled pockets disrupt efficient thermal transfer.
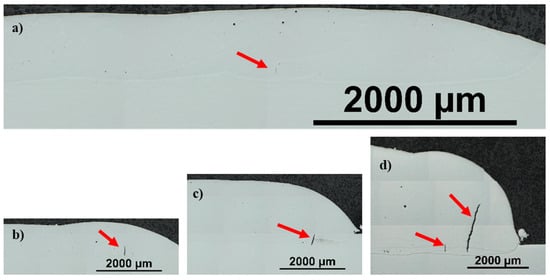
Figure 11.
(a) A small crack exists at the interface between the layer track and the substrate. (b–d) The crack is seen to propagate in the direction of layer growth, ultimately causing an additional crack nearby due to residual stress [157].
Advancements in DED aim to curb porosity, achieving densities that closely mirror theoretical values. Lin et al. [120] conducted an empirical study to scrutinise the association between essential process parameters and the formation of porosity and deduced that an increase in laser power inversely affects porosity, reducing its presence. In contrast, an enhanced powder feed rate directly correlates with a proportional increase in porosity. The study also revealed a nuanced relationship between scan speed and porosity, in which any deviation from the optimal scan speed of 9 mm/s in either direction was found to elevate porosity levels, suggesting a delicate balance in process parameters is crucial for minimizing porosity. Another study indicated that lowering the scan speed throughout the printing procedure can inhibit the creation of voids, achieving almost total densification [152]. Nonetheless, it is crucial to acknowledge that this adjustment might result in increased surface roughness [138]. Although surface roughness can pose some challenges, these issues can be resolved by using post-processing techniques such as sandblasting [39]. Additionally, Hot Isostatic Pressing (HIP) is a commonly used method to eliminate porosity and improve the material’s overall performance and densification up to [40], as depicted in Figure 12.
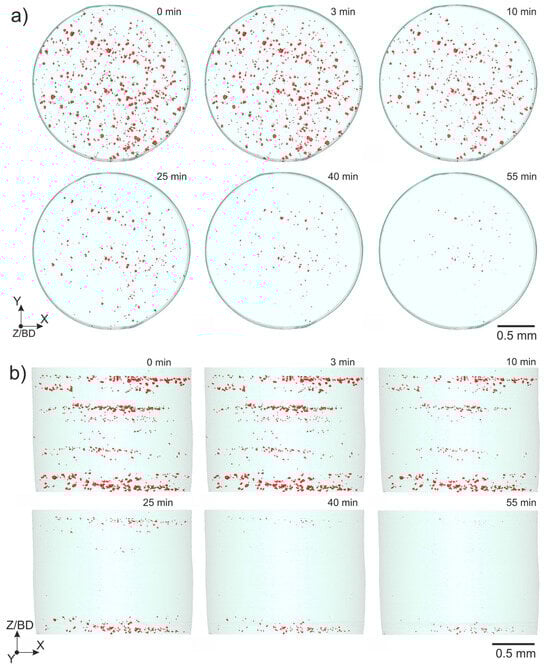
Figure 12.
A 3D rendering of porosity projected onto the (a) XY plane and (b) XZ plane during the HIP cycle [158].
Building on this understanding of melt pool dynamics, further exploration can be conducted into how these parameters affect the overall processing ranges for various alloy systems. Figure 13 displays these optimal processing ranges for alloys like Inconel, Ti-6Al-4V, H13 Tool steel, Fe, Ti-15Mo, and some Ni-Cr alloys. Three regions without optimal data points suggest increased porosity due to keyholing (high heat input and low powder feed), Lack-of-Fusion (low heat input and high powder feed), and mixed-mode porosity (high heat input and high powder feed).
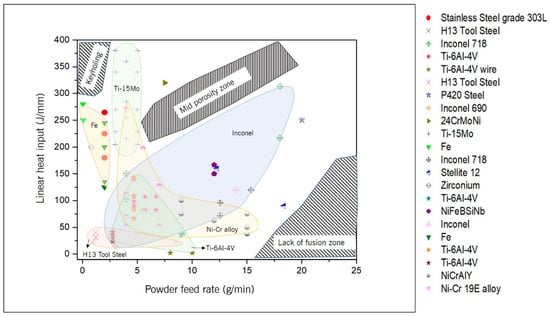
Figure 13.
Optimal processing ranges for various alloys. Three regions lacking optimal processing windows suggest increased porosity due to keyhole, LoF, and mixed-mode porosity, defined by a linear heat input up to 400 J/mm and a powder feed rate up to 25 g/min [84].
4.2.2. Spatters
Spatter, also referred to as sparking or sputtering [136,159], is the expulsion of fluid particles from the melt pool, and it is a prevalent imperfection in metal AM and laser welding processes [54,160], as shown in Figure 14. Though it occurs naturally, this phenomenon is inextricably linked to the laser-based manufacturing process and is somewhat unpredictable. However, it can be mitigated through proper, optimal key process parameters settings at the deposition region, given that no defects are present [93,161,162].
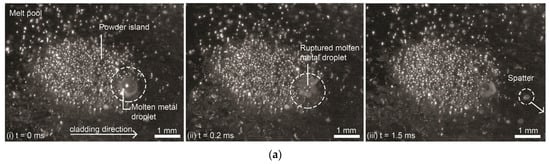
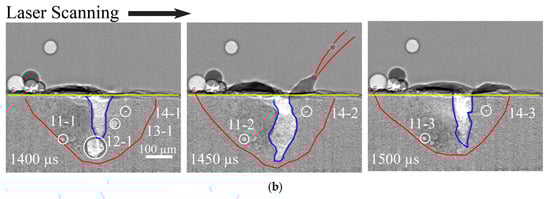
Figure 14.
Spatter formation using an in situ, high-speed camera and X-ray, respectively. (a) Since the molten droplet is separated from the melt pool, it will likely have a temperature difference. Occasionally, this droplet can burst, possibly due to boiling effects, creating a spatter with upward momentum that then leaves the melt pool [163]. (b) This phenomenon can be further explained by the presence of an existing pore beneath the localized region. This pore eventually coalesces with the keyhole (blue line), causing severe instability in the melt pool and necessitating the release of intense energy from within the melt pool, i.e., spatter (red line trajectory) [164].
Should a spatter (resulting in a balling defect) be observed on a part’s surface, it is advisable to tailor the process parameters to that particular area. In such instances, utilizing the constant process parameters may not be the most prudent approach when traversing the affected section. This could result in more spatter due to improper specific energy density, leading to voids and greater thickness of the deposited layer. Figure 15 depicts an exaggerated visual representation of this phenomenon. However, in reality, the spatter or balling is typically smaller than the melt pool, on-the-order of one μm. Young et al. [156] conducted a detailed study quantifying various spatters, ranging from 31 to 114 . The authors added that the size can vary depending on the properties of the feedstock powder, the process parameters, and the type of spatter. Another study [165], however, claimed that spatter sizes are generally three times larger than the powder particle sizes. Given that the powder particles range from 45 to 150 μm, the estimated spatter sizes would be between 135 and 450 μm.
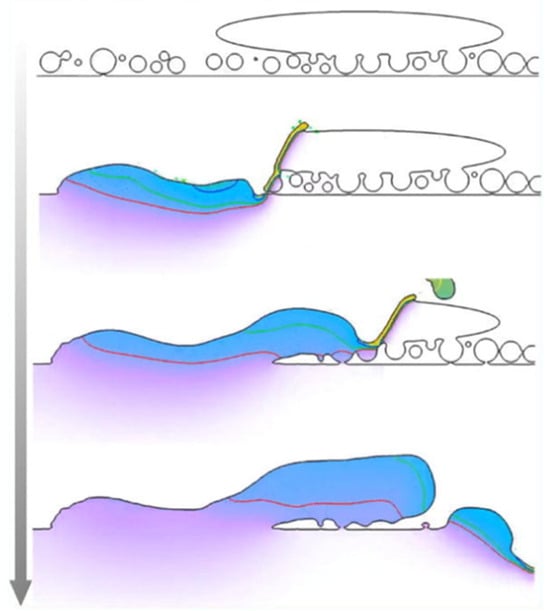
Figure 15.
Large spatter sits atop the part’s surface, resulting in detrimental defects [166].
Spatter generation is primarily influenced by Marangoni convection and recoil pressure, which govern the dynamics of the melt pool [93,161,162,164,167]. This dynamic is set in motion with the application of concentrated energy, causing metal powder at the molten pool’s surface to vaporise and generating recoil pressure within the laser–powder interaction zone, leading to the emergence of a metal vapour jet [93,156,162,164]. This vapour jet exerts downward pressure on the melt pool, forming a depression zone on its surface [136]. Moreover, the interaction of hot powder and metal vapour with surrounding gases triggers a rapid expansion; under a sufficient pressure gradient, a vapour plume may form aiming to stabilise the melt pool, erupting radially upwards at high velocity [71,168]. This vapour plume typically ejects backwards, in alignment with the depression zone’s wall [161,169], with the tiny liquid droplets from the melt pool. due to tendency for surface tension to minimise surface energy [136,163], often accompanying the plume outward, resulting in the formation of metallic jet spatters [156,161,162,164]. In certain situations, these spatters can combine with incoming unmelted powders, creating larger spatter particles, also known as powder agglomeration spatter [156,162]. This spatter formation mechanism is illustrated in Figure 6 and Figure 15. Key operational parameters such as laser power and powder feed rate, along with energy and powder density, are instrumental in determining the size and quantity of spatter, as well as the patterns of its dispersal [164,170].
Spatter formation strips material from the clad’s designed geometry, introducing under-deposition [167] and surface defects such as balling, which, in turn, exacerbates surface roughness [71,161,164]. These imperfections typically necessitate further post-processing, which can prolong the production schedule and inflate costs. When these spatter-induced balling defects accumulate on the top surface’s outer edges of the part, they impede energy absorption in those zones [71,171], potentially giving rise to additional defects, including porosity. Additionally, spatter occurs more frequently on the overhang structures [93]. The in situ monitoring system detected a considerable amount of heavy spattering at the contours [172]. On the built part side, a significant spatter was found, causing substantial disruption to the shape of the melt pool due to defects, such as balling caused by spatters and the separation of the melt. Moreover, Sames et al. [57] posited that spatter phenomena serve as a fundamental mechanism behind the formation of certain types of process-induced porosity. It was found that spatter often precedes with the creation of keyholes [54,93,136,155,156,160,161,162,164,168,173], a consequence of inappropriately high energy density applied to the substrate or previous layers, which causes overly deep depressions and subsequent voids from gas entrapment, as previously described in Section 4.2.1. Sames et al. [57] asserted that spatter phenomena represent an underlying mechanism for the formation of some forms of process-induced porosity. Furthermore, Young et al. [156] provided an in-depth examination and discussion on spatter phenomena in metal AM, highlighting the comparison of various spatter types. They identified a unique spatter occurrence that manifests when the laser beam encounters pronounced pre-existing flaws, like oversized pores, within the component, which instigates a forceful expulsion of liquid spatter.
Undoubtedly, spatter formation, with its inherent unpredictability, poses various challenges. These spatters can cover considerable distances and adhere to the clad track, substrate, and even the powder-feeding nozzle, posing the risk of equipment damage [163]. Spatter can also disrupt in situ monitoring systems, potentially resulting in signal misinterpretations and complicating the analysis of data. Research into spatter behaviour reveals its connection to process conditions and stability, indicating that tracking spatter could provide valuable insights into the quality and consistency of the metal AM process [16,156,159,162,164,174], a topic that will be elaborated on in the next sub-section.
5. Inspection and Verification Approaches for Quality Assurance in DED Process
The application of metal AM for critical components is often limited due to the high costs and time involved in post-processing and inspection. This limitation has prevented the widespread adoption of AM technology in industries where precision and efficiency are paramount. To fully realize the potential of metal AM, it is crucial to streamline the post-processing and inspection process, thereby reducing both costs and time without compromising quality. Achieving this would not only benefit business productivity and profitability but also pave the way for a more sustainable manufacturing future through the use of efficient manufacturing technologies.
5.1. Terminology and Definitions Related to Measurement and Monitoring Techniques
This section reviews various terms related to measurement and monitoring techniques, as found in the academic literature within the manufacturing context, noting inconsistencies in usage. To provide clarity, a glossary is included in Figure 16, summarizing the most pertinent terms, as refined from the literature [175,176,177,178,179]. These terms are categorized into sub-themes: on-machine, in-process, off-process, and batch-process.
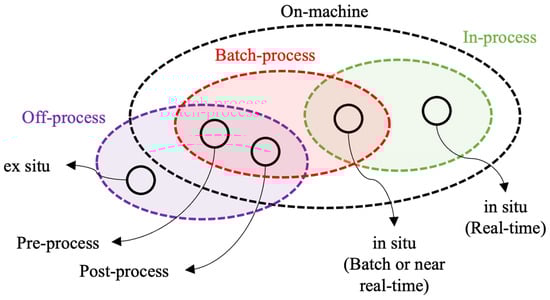
Figure 16.
Graphical representation of different terms associated with measurement, monitoring, and data processing techniques.
The term “on-machine” refers to measurements or recordings made directly on the AM machine during the production of the workpiece. In contrast, “off-machine” measurements are those taken externally to the AM equipment. On-machine metrology is further differentiated by its timing relative to the manufacturing process, being either in-process or off-process. The former denotes measurements taken concurrently with the manufacturing process, also known as “in situ”, where data on process stability and part quality are collected in real-time. Within the context of data processing, in situ can be further divided into two subcategories—batch processing and real-time data stream processing—with batch processing involving the simultaneous handling of a large volume of data, while real-time processing manages the data immediately as it is received. The latter, “off-process”, is also applied to on-machine metrology that is not synchronized with the manufacturing activity and encompasses both pre-process and post-process metrology, which occurs before or after manufacturing, respectively: for instance, a hybrid DED machine combined with other manufacturing processes, such as peripheral milling or drilling. Lastly, measurements that take place outside the manufacturing environment, or “ex situ”, combine aspects of “off-machine” and “off-process” methodologies, in which the component has to be taken out from the manufacturing area for inspection.
5.2. In-Process Measurement Technologies and Its Process Signatures in Metal AM
The insights gained from inspection and monitoring are instrumental in providing critical feedback and characterizing materials, enhancing the manufacturing process, and defining the operational parameters for specific material systems and AM techniques. Employing Non-Destructive Testing (NDT) and embracing comprehensive quality management methods have proven effective in the industry, spanning from metal powder to the final product, with in-process sensing approaches receiving notable attention in scholarly discussions to ensure a high quality of fabricated parts. The escalating interest in AM technologies underscores the significance of implementing rigorous quality control measures and performance assessments for parts produced through AM.
Within the DED process, the connection between process signatures and the quality of the final product is clear. Nevertheless, pinpointing these signatures presents a considerable challenge due to the intricate nature of the underlying process. This section aims to shed light on the variety of sensing signals and equipment utilized to capture them, including vision, thermal, acoustic, spectra, and X-ray signals. Table 3 systematically catalogues the sensing signals, the equipment used for sensing, the identified process signatures, and the relevant research literature on the DED process.
Table 3.
Sensing signals and their corresponding devices and process signatures in Laser–Powder-based MAM.
5.2.1. Optical Inspection Techniques
In situ imaging inspection techniques in metal AM are pivotal for ensuring the quality and integrity of printed components through real-time monitoring and analysis. Numerous studies have been conducted on how to effectively monitor and inspect the geometric properties of parts produced through AM. Generally, there are two categories of methods to measure the geometrical characteristics of the melt pool or deposited clad: machine vision-based and laser scanning-based monitoring systems. The former involves using high-speed and high-resolution cameras to capture images of the parts while they are being printed, with the images processed to detect any irregularities, such as uneven layers, and to analyse the melt pool morphology. In contrast, laser-based scanning is mainly used for areal surface topology. Thermal imaging techniques utilise Infrared (IR) cameras to monitor the temperature distribution of the melt pool and across the build area, identifying anomalies such as overheating or insufficient fusion that could compromise the microstructural properties of the material. X-ray imaging, including XCT scans, on the other hand, offers a deeper insight by allowing for the visualisation of the internal structure of the component, revealing pores, LoF, and internal defects that are not visible from the surface, such as the evolution of the depression zone. Collectively, these techniques offer a non-contact method to observe the melt pool dynamics and spatters appearance—regardless of the geometry of the structure—in order to enhance the reliability of metal AM processes by enabling the detection and correction of potential defects in real-time, thus improving the overall quality and performance of the manufactured parts. Overall, the mounting of these sensors is critical not only for capturing high-quality data but also for monitoring the intricate layer-by-layer fabrication in real-time.
Vision-Based Signals
The deployment of visual sensing systems, including Charge-Coupled Device (CCD) and Complementary Metal Oxide Semiconductor (CMOS) cameras, has significantly improved the precision and reliability of the manufacturing process [38]. These advanced cameras are capable of capturing high-resolution images at high speed, allowing the meticulous monitoring of the dynamics of the melt pool during the layer-wise fabrication of metal parts. Real-time monitoring of the melt pool’s geometrical characteristics, such as size, shape, and symmetry, is of paramount importance in ensuring the stability of the AM process and the manufacture of high-quality products [38,186]. The data on melt pool geometry obtained from CCD and CMOS cameras allows proactive adjustment of key process parameters, including laser power, scan speed, and powder feed rate, leading to higher levels of precision and repeatability. By closely monitoring these geometrical parameters, subtle process anomalies that could compromise the quality of the manufactured part can be detected. For instance, an irregular or fluctuating melt pool size or shape may indicate inconsistencies in the energy input or powder delivery, leading to potential defects in the fabricated layers.
Other than the shape of the melt pool, there are other characteristics to consider, such as spatter formation and distortion [38]. The accuracy of optical sensing is highly dependent on the camera’s resolution, which is crucial for providing feedback on the dimensions of the metal AM process. Various studies use visual information and image processing algorithms to examine the molten pool’s size and spatter formation [187].
Early studies used CCD cameras to monitor powder behaviour, part melting, and overhang layers in metal AM [31,188,189]. Iravani-Tabrizipour and Toyserkani [189] developed a method to measure the geometry of the melt pool in the DED process. They strategically positioned three CCD cameras off-axis to reliably capture the complexities of the melt pool geometry, acknowledging that the melt pool’s position relative to the cameras can shift during manufacturing. This setup facilitated the resizing of captured images to suit computational analysis requirements effectively. The analysis employed a sophisticated feature tracking algorithm that executed tasks such as thresholding, boundary tracing, image calibration, triangulation, and tracking of image features. To streamline computational efforts, only two images were selected for processing, based on the track’s orientation, thereby optimizing the analysis time. The culmination of this process involved utilizing the processed images to accurately estimate the melt pool’s height in real-time, demonstrating a significant advancement in monitoring and controlling the DED process. Naiel et al. [190] conducted experiments using five different power levels to rigorously investigate the impact of various melting modes, such as under-melting and keyhole melting, on the size of the melt pool, by utilizing a vision camera to accurately monitor any variations in the melt pool size. Perani et al. [191] developed a vision-based monitoring system for the DED molten pool by utilising a laser coaxial CMOS camera that could accommodate the entire melt pool, due to its 400 × 400 pixel size. Yang et al. [192] employed a visual camera for gauging the scanning velocity of the deposition head. This was performed as the traverse speed frequently slowed down at corners and differed from what was intended.
Machine-vision sensing is a cost-effective and reliable method for obtaining multiple information through image processing, as opposed to expensive IR cameras [193,194]. It has been reported that results obtained from digital cameras only deviate by a mere 5% from the precise results obtained through an optical 3D scanner [193], making it a cost-effective options for layer height control [195,196,197]. Ultimately, the advantages of using machine-vision sensing outweigh its alternative, laser-based scanning techniques, with the later further discussed in the following section. Consequently, studies in the literature utilised vision sensing to rapidly detect and measure defects, such as porosity and microstructural properties [198,199], with the present method employing ex situ XCT scans to detect these types of flaws.
These sensors for in situ imaging inspection are strategically mounted to provide optimal coverage and data acquisition without interfering with the printing process. DED systems often feature visual and thermal imaging cameras positioned above the build platform and attached to the deposition head, which tracks the energy beam’s position during printing. In some cases, these cameras may also be found within the build chamber at off-axial or paraxial angles. This setup is illustrated in Figure 17. Multiple fixed cameras, each with limited coverage and positioned strategically at varying angles, can guarantee complete surface coverage. These cameras may be equipped with high-intensity lighting to illuminate the build area, ensuring clear image capture even in the typically low-light conditions inside the machine.
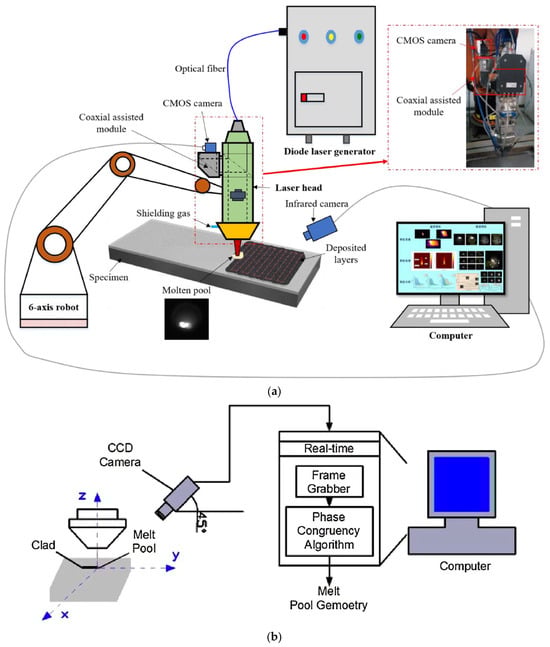
Figure 17.
Schematic of (a) coaxial monitoring [200] and (b) paraxial monitoring [201] in DED.
Laser-Based Scanning
Several studies have utilised a laser scanning system to monitor the AM process. Compared to machine vision-based monitoring systems, laser scanning systems offer superior repeatability. The most notable benefit of laser scanning systems lies in their capacity to precisely measure the height of the currently deposited part with micron-level accuracy, an accomplishment that a monocular-vision-based system cannot attain [202]. Laser-based metrology techniques used in assessing metal-AM-fabricated parts are broadly categorised into passive and active types. Passive techniques, including photogrammetry and stereo vision, rely primarily on photographic principles and often necessitate a certain level of consistent ambient lighting. These systems typically employ one or more cameras along with sophisticated image processing algorithms to construct 3D representations from a sequence of interrelated images. In contrast, active metrology methods illuminate the subject using their own light sources and can vary depending on the environmental lighting, enabling precise measurements as compared to passive techniques. Active sensors include laser triangulation, structured light (or fringe projection), and interferometry.
In the context of passive techniques, photogrammetry is versatile and suitable for large objects but may perform less reliably on fine detail accuracy [203]. On the other hand, stereo vision is flexible and cost-effective but may not match the precision of active techniques [204,205]. For active sensors, laser triangulation offers high resolution and accuracy for surface measurements and is often found to be used for layer height control [141,206,207,208,209]. Structured light, on the other hand, provides detailed 3D models but requires controlled lighting and can be time-consuming and difficult to utilize for complex parts [147]. Though laser triangulation and structured light may be favourable in regard to the measurement of surface roughness, object size, and measurement accuracy, they struggle with highly reflective or absorptive surfaces, such as those found in finished metal AM [141,176,206,207,208,209,210,211,212]. On the other hand, interferometry delivers high precision over small areas but is highly sensitive to vibrations and environmental changes [184]. In actual fact, each technique has its strengths and limitations, making their applicability dependent on specific manufacturing requirements and part geometries. Detailed analysis and comprehensive insights on laser-based technology are given in reference [213].
Laser scanning technology is a prevalent choice for measuring surface topography and dimensional measurements of deposited height, offering the added advantage of identifying inherent defects during fabrication [206,214]. This capability facilitates the development of compensation strategies, thereby improving the overall quality of the final product. Laser triangulation, in particular, can generate an areal surface topography based on depth images, with high resolution [215]. However, leveraging this technology requires the application of 3D cloud point software for data processing. This includes steps such as image filtering, denoising, smoothing, segmentation, and contour extraction methods, essential for translating raw data into actionable insights [206,207].
Thermal Signals
The visible spectrum of light, detectable by human eyes, spans from violet to red, encompassing wavelengths of 350 to 750 nm. In contrast, IR radiation, situated at the other end of the spectrum, extends up to 1000 µm. IR thermography operates within the bands of 0.75 to 14 µm and serves as a non-contact method for recording and visualising thermal radiation emitted by objects. This technique is important for the analysis of surface temperature distributions [216]. Emissivity, the efficiency at which a surface emits thermal radiation relative to a blackbody, and irradiance, the radiant energy received by a surface, are key concepts in this context. According to Planck’s law, the spectral distribution of electromagnetic radiation emitted by a blackbody is solely determined by its temperature, with blackbodies being theoretical objects that perfectly emit and absorb all incident radiation, characterised by unity spectral emissivity.
A thermocouple, consisting of two wires made of dissimilar metals, generates an electric current when one of the wire joints is heated, producing a thermoelectric voltage linearly proportional to temperature [216]. As an inexpensive, contact-type measurement device, thermocouples have been used to measure temperature at a specific fixed point on the surface of a substrate, aiding in determining deposition stability and the correlations between process parameters [217].
However, temperature monitoring in DED processes predominantly employs pyrometers, which measure an object’s temperature without making any physical contact by assessing the thermal radiation the object emits relative to a black body. Pyrometers, known for their high temporal resolutions, excel more in detecting process deviations than other thermographic devices, such as IR cameras, albeit they are susceptible to noise [134,218]. As temperature increases, the emitted energy climbs and the wavelength of peak emittance decreases [219]. Pyrometers or IR cameras are typically categorized into two main types: single-colour (or single-wavelength) pyrometers and ratio (or two-colour, two-wavelength) pyrometers [186]. A single-colour pyrometer measures the thermal radiation at a single wavelength, typically using a photodiode detector, whereas a ratio pyrometer, also known as a digital camera or CCD/CMOS camera with an IR spectrum [181,220], is built around an array of photodiodes to measure thermal radiation at two different wavelengths. This dual-wavelength approach compensates for variations in emissivity, yielding more accurate temperature measurements, especially in scenarios with semi-transparent materials or varying surface emissivities [186,218].
Calibration of these sensors is crucial for accurate measurements but can be intricate due to the high temperatures and harsh conditions typical in metal AM environments [186]. The differing material specificity of different materials further complicates matters, as different metals and alloys used in AM may interact differently with the sensors. For example, the reflectivity of the material can affect the quality of the visual images, while thermal properties can influence the readings of thermal sensors. Adapting sensor settings and algorithms to accommodate the wide range of materials used in metal AM adds another layer of complexity.
Mazzarisi et al. [221] investigated how different DED scanning methods—unidirectional, bidirectional (with and without contour), and spiral patterns—affect the heat distribution in materials using IR thermography. The authors extracted important features, including the average and maximum temperature of the melt pool, thermal cycles, rates of cooling, and thermal gradients. These factors, notably the maximum temperature and the cooling rate, significantly impact the component’s microstructure, suggesting that different scanning methods can lead to different microstructures. The study also highlights the importance of cooling rates in determining porosity, with lower energy density cooling the material faster, potentially trapping gases but also refining the microstructure. Despite the constant energy density in their experiments, variations in the temperature of the melt pool were observed from different scanning strategies used, which could introduce residual stresses and potentially lead to cracks in the material. Overall, they found that unidirectional scanning tends to produce more consistent deposits. Nair et al. [222], utilised a dual-colour pyrometer to carefully monitor temperatures at both the centre of the melt pool surface and its tail. This approach enabled precise measurement of temperature fluctuations across various regions of the build, yielding valuable insights into how cooling rates impact the microstructure of the part. The knowledge is pivotal in the development of real-time feedback control systems, ultimately enhancing the reproducibility of a microstructure. Miyagi et al. [223] utilised a CCD camera equipped with three distinct photodiodes for Near-IR, IR, and Ultraviolet (UV) spectra measurement. By simultaneously tracking the deposition area, thermal radiation, and plume emission, they gained a comprehensive understanding of the deposition process, thereby optimizing efficiency by analysing the relationship between signal intensity from a molten pool and the shape of the structure formed under various conditions.
X-ray Imaging
High-speed and high-resolution X-ray imaging plays a pivotal role in the real-time quality assurance of metal AM technology, identifying sub-surface defects and intricate melt pool dynamics, including variations in melt behavior and melting patterns [134,181]. This detailed observation is instrumental in averting defect formation in metal AM parts. The unique advantage of X-ray imaging lies in its superior ability to closely investigate the solid–liquid interface within the melt pool, offering invaluable insights into the formation of the depression zone due to recoil pressure and facilitating a comprehensive field analysis.
In-depth investigations into the role of in situ X-ray imaging within metal AM have been thoroughly explored by Leung et al. [93]. Their study focused on defect formation and the dynamics of the molten pool in Laser-PBF, utilizing high-speed synchrotron X-ray imaging. The research highlights key insights into the formation of melt tracks, denuded zones, spatter, porosity, and the influence of varying process parameters on these occurrences. It was found that laser-induced gas or vapour jets result in the creation of melt tracks, whereas the Marangoni effect drives the movement, dissolution, and dispersion of pores. The study provides a detailed analysis of melt pool behaviours and transition mechanisms under different process conditions, offering a comprehensive mechanism map for validating and enhancing computer simulations aimed at predicting build accuracy in metal AM processes. Similarly, another study delves into the effectiveness of a piezoelectric powder deposition system in DED, leveraging X-ray imaging to capture the intricate interactions between powder particles and the melt pool [164]. This investigation sheds light on the influence of different process parameters on melt pool stability, essential for refining the DED process and understanding the impact of laser–powder interactions on powder flow and the formation of porosity.
XCT scans, non-destructive in nature, offer an unparalleled perspective on the quality of AM parts. It delivers a holistic view encompassing defect identification, dimensional accuracy, density assessment, and surface roughness analysis, catering to the rigorous standards of the aerospace industry on dimensional precision and geometrical tolerances [224]. This technology is especially beneficial for parts with complex geometries, high surface roughness, inaccessible features, or varied optical and surface properties. Despite the inherent challenges, such as variability, intricate surface topographies, and internal defects, in evaluating metal AM parts, XCT has been proven to be indispensable. While techniques such as Acoustic Emission (AE) and acoustic spectroscopy have addressed near-surface defect detection, traditional porosity measurement methods like the Archimedes method and pycnometry offer limited insights [176]. In contrast, XCT reveals comprehensive details on porosity, including pore size distribution and morphology for both open and closed pores, across the entire volume of the part, as depicted in Figure 18.
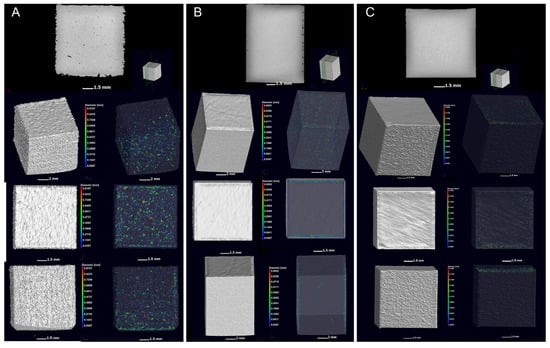
Figure 18.
Examples of various porosity distributions in cube samples are illustrated. Each cube (A–C) is presented with four views: CT slice image (top), 3D angled view, 3D top view, and 3D side view. The colour bar represents the magnitude of the pore diameter based on the sliced cross-section [225].
The efficacy of XCT hinges on the partial absorption of X-rays by materials, necessitating higher energy levels for denser or larger objects, which could affect the resolution [16]. By rotating the part and capturing images from multiple angles, XCT minimises the risk of missing cracks that might not be detected if the voxel size is too large or the orientation of the crack is parallel to the X-ray beam [16]. Moreover, XCT’s enhanced contrast capabilities make it more effective than traditional radiography for porosity detection. XCT images, compiled from 2D grayscale images obtained using a flat panel detector, create a detailed 3D representation of the specimen, typically 1000 cubic voxels in size, with each voxel’s (2-byte integer) size determined by the pixel size multiplied by the slice thickness [134,226]. Despite the long scan durations required for high-quality images, the resulting volumetric image quality, influenced by X-ray parameters and part orientation, is vital for a precise evaluation of the material.
While X-ray imaging is predominantly used for in situ monitoring during the manufacturing process, XCT is typically employed for ex situ analysis during the validation phase. The application of XCT in AM, as has been extensively reviewed by Gobert et al. [227] and Snow et al. [228], leverages data fusion techniques of vision-based imagery with XCT as the ground truth to significantly enhance the depth and thoroughness of defect assessments—unlocking the possibility of correlating them with processing parameters [225,229,230]. Du Plessis et al. [231] explored the influence of different XCT scan techniques on a variety of AM applications—from Research and Development (R&D) to industrial production—emphasizing the importance of selecting a scan strategy that matches the inspection objectives and sample size. This choice directly affects the time and cost of utilizing XCT technology. Their ultimate goal is to uncover insights into reducing the cost barrier to the adoption of XCT technology for academia and industry. Ongoing research efforts, such as Warnett et al.’s work [232] on speedy XCT reconstruction through real-time tomography, aim to reduce scan times without compromising quality for potential in situ applications, despite the current limitations in achieving optimal resolution.
The equipment setups of X-ray and XCT scanning systems are more complex and are typically integrated into more advanced AM setups due to their need for penetrating radiation. In some cases, these sensors are built into the machine itself, allowing for real-time internal inspection during the build process, as shown in Figure 19. In other setups, the part may be scanned post-build in a separate chamber that is equipped with the necessary X-ray or XCT technology, e.g., Nikon Selective Laser Melting (SLM) solutions in combination with Nikon Metrology [233]. This arrangement requires careful calibration and shielding to protect operators from radiation exposure while ensuring high-resolution internal imaging of the part.
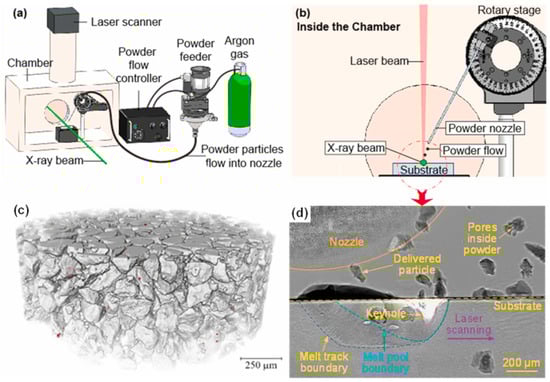
Figure 19.
Schematics of in situ monitoring and characterization during small-scale LP-DED: (a) Experimental setup for in situ high-speed synchrotron X-ray imaging. (b) Interior chamber illustration. (c) X-ray tomography of Ti–6Al–4V particles, highlighting porosity—coloured in red. (d) Representative X-ray image revealing pore and melt pool dynamics (using 208 W laser power and 0.1 m/s scanning speed). [234].
5.2.2. Acoustic Signals
Over the years, acoustic sensors have gained popularity due to their ease of installation, affordability, and potential to provide valuable information. Unlike vision and thermal signals, which excel in monitoring physical characteristics, acoustic sensors offer unique insights into the internal state of deposited components. The interaction between the energy beam and the feedstock material generates elastic waves from the molten pool, carrying essential information about internal characteristics such as pores and cracks [235,236,237]. AE signals, characterized as one-dimensional, time-dependent data, requires less computational effort to process and can reveal distinct variations associated with different levels of porosity and power [235,238], as shown in Figure 20. This reduces the need for subsequent quality assurance, making the entire process more efficient and economical [239]. The development of AE sensing technologies is, thus, critical for detecting defects in metal AM. Some of the AE sensing methods include piezoelectric, spatially resolved acoustic spectroscopy, ICP® microphone, Fiber Bragg Grating (FBG), Doppler vibrometer, and ultrasonic transducer. Hossain et al. [240] provided the range of AE frequency levels for different types of defects, from macro- to microscopic size.
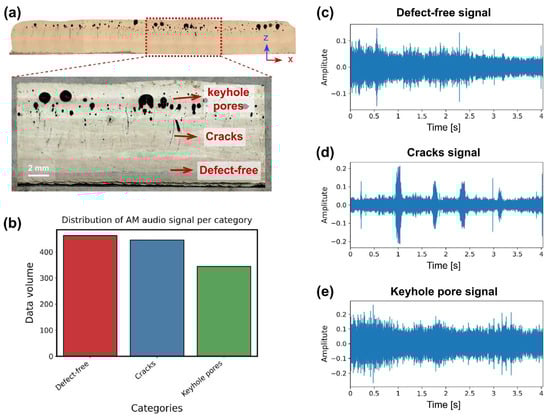
Figure 20.
Preparation and overview of the LP-DED AE signal. (a) Optical micrograph of the thin-wall structure, captured from the x–z external surface. (b) Categorization distribution of the AM audio dataset, with each category’s acoustic signals divided into 0.5 s segments. (c–e) Visual representations of AE signals within a selected layer representing defect-free, cracks, and keyhole pore signals, respectively [235].
Ito et al. [241] developed an online monitoring system for the Laser-PBF process, utilizing two piezoelectric AE sensors to detect micro-cracks and pores in real-time. The system can pinpoint the location and timing of defects by analysing the amplitude difference and time domain of AE signals, achieving spatial positioning accuracy within a few millimetres. Other researchers used a microphone sensor to collect the AE signals in metal AM and established a map between the AE signals and the process parameters [239,242]. Similarly, Whiting et al. [243] devised an AE sensing monitoring system to monitor the powder flow rate in the DED process, attaching ultrasonic transducers directly to the nozzles to identify any clogs or flow inconsistencies. Nevertheless, the harsh working environment and limited space make this task rather challenging. In another study, a Fibre Bragg Grating was placed 20 cm away from the process zone inside the process chamber to gather AE signals during Laser–Powder DED [244]. The study demonstrated that wavelet packet transformation can be used to extract useful features and, subsequently, classify the quality level of specimens into three categories based on the content of pores formed with different energy densities. Spatially resolved acoustic spectroscopy was implemented in WAAM for rapid microstructure texture assessment by detecting the change in surface acoustic wave velocity [245]. A recent study by Li et al. [246] emphasized the significance of AE signals in capturing the intricate physical phenomena that occur during different operational conditions of Laser–Powder DED. The study has brought attention to the distinct behaviours of AE signals under various conditions, including powder density and energy density. By examining the number of signal peaks, it is possible to make a rough prediction of the frequency components of the signal, with signals caused by laser melting consisting mainly low-frequency components as the viscous fluid melt pool does not generate much vibration during collisions. Conversely, high-frequency components are triggered by the bombardment of incoming powder on the solid. However, analysing high-frequency acoustic signals can be a challenging task for multiple reasons, including overheating substrates and noise interference from powder that obstructs the application of AE signals. Additionally, when the wave source is positioned differently in relation to the propagation path to the detector, the detected signals may vary even when using a similar AE mechanism [181].
5.2.3. Spectral and Other Signals
Optical emission spectroscopy (OES) is an impeccable tool for compositional analysis in metal AM [247,248], owing to the unique and characteristic spectral lines released by metal elements in excited states [38]. Lough et al. [249] demonstrated that the concentration of an element can be assessed through analysis of the intensity ratio of its characteristic spectral lines; highlighting that, among the constituents of 304L stainless steel, chromium emits the most prominent signal compared to iron and manganese. The authors established a direct correlation between spectral intensity and laser power; noting that an increase in laser power leads to a corresponding increase in both the intensity and variance of emitted spectral lines. This observation suggests that the higher energy densities contribute to a rapid emission of chromium, influenced by the volatile recoil pressure from material vaporisation, which, in turn, affects the depth and width of the melt pool. OES serves as a cost-effective approach for real-time monitoring of plasma plume activity over the molten pool. Liu et al. [250] found that a potent spectral intensity was identified in the plasma plume when high energy density was applied, possibly pointing to the existence of spatters and resulting in uneven clad width. Furthermore, spatters dispersed throughout the build surface and substrate also resulted in balling defects. Although a lot of useful information can be obtained from the spectra signals of the plasma plume, its usage may not be reliable and consistent as, in some cases, the energy density of DED cannot always produce plasma plume [181]. Despite this, Montazeri et al. [251] used OES to study the behaviour of porosity formation through the spectra signals with some degree of success.
Accurately estimating temperature from pyrometer readings can be challenging due to external environment and equipment interferences. Yet, leveraging spectral data offers a viable alternative. A recent investigation employed OES sensors at several strategic locations across the DED build area, identifying sensor placement as a critical factor affecting pyrometer accuracy [218]. The study suggested that utilising a hyperspectral camera could significantly improve temperature measurement reliability. The technology enables the concurrent acquisition of spectral data from various locations, capturing a broader range of IR wavelengths. By applying a fitting process that accounts for variations in emissivity across different wavelength, the information can then be analysed to determine the melt pool’s temperature range [252]. This approach outperforms thermal cameras and pyrometers by collecting spectral information over a broader wavelength spectrum, thus enhancing the signal-to-noise ratio while preserving camera-based systems’ high spatial resolution characteristics. Gerdes et al. [253] correlated process signatures obtained from hyperspectral imaging to the surface roughness, thus validating the utility of spectral analysis in metal AM. Moreover, additional electronic and other signals, such as eddy current, thermocouple, optoelectronic sensor, and strain gauge, offer various monitoring capabilities, enhancing the quality control measures in metal AM processes [37,134,135,180,181,185].
5.3. Challenges in Real-Time Data Acquisition
5.3.1. Spatter-Induced Disturbances
Prasad et al. [163] observed in their study on high-deposition-rate Blown Powder DED processes that spatter could form an island of unmelted powder around the boundary of the melt pool. If spatter gains sufficient energy, it burst into droplets, potentially affecting the stability and quality of the melt pool and causing interferences in monitoring signals [254]. Different types of monitoring systems, including optical, thermal, or acoustic sensors, can be affected by spatters in different ways. Optical sensors, for instance, may experience signal loss or noise due to spatter blockage or light scattering. In certain cases, spatter emissions could be misconstrued as part of the melt pool, resulting in the misinterpretation of melt pool boundaries and apparent enlargement. It is imperative to mitigate these disturbances to ensure accurate image processing of the melt pool [255]. Similarly, heat carried by spatters can create transient spikes in temperature readings in thermal sensors, and acoustic sensors may pick up the noise generated by spatter ejections and impacts, further complicating data interpretation.
A few studies have incorporated spatter tracking for denoising as part of an additional step in image processing to reduce these spatter-induced deviations in deposited layer extraction [256,257]. Rezaeifar and Elbestawi [258] noted that off-axis imaging systems, while measuring weld pool size, can suffer from overlapping and spreading spatters, resulting in inaccurate measurements. Though erosion is often used to reduce this error, it can result in underestimation of the actual melt pool size. On the other hand, coaxial in-process imaging monitoring may result in disturbances and falsely enlarge the perceived melt pool size [101]. Indeed, spatter removal through image processing is difficult due to their size similarity to the melt pool and the accompanying plume [259]. Park et al. [183] utilised single-colour photodiodes operating in UV and IR ranges, discovering that UV signal remained unchanged in the presence of spatter, whereas IR sensors detected instantaneous pulses. A statistical control limit of three sigmas was used for general quality control, with anything beyond this limit identified as spatter, as a trend removal method. The study concluded that a small amount of spatter, unless persistent for a long time, does not necessarily indicate poor weld quality.
Feng et al. [260] noted that temperature spikes caused by spatters could lead to potential confusion between defects and noise, emphasizing the need for analysis of temperature signals and interpretation of their results. Hauser et al. [239] confirmed that there is a clear link between the escalation and sustained nature (concept drift) of acoustic signals and changes in process parameters due to unstable processes with respect to an elevation in spattering events. It has been observed that an increase in spatters would cause a corresponding rise in brightness in the area surrounding the melt pool, as captured by the vision camera.
In fact, melt pool instabilities may cause excessive spatters [16,163], which, in turn, may cause concept drift in signals [182,261]. Only a few other studies have also proposed using spatters as process signatures, including their size and quantity, to assess process performance and stability in metal AM [159,162,164,165,168,174,257,262,263], yet a quantitative comparison among different types of spatters, such as metallic jet and agglomeration spatters, remains unexplored [156].
5.3.2. Shadow and Occlusion Effect
It is still debatable whether laser scanning technology is the best technology to employ for AM process sensing and if it can be directly compared with the machine-vision-based monitoring system. Although laser-scanning technology has been shown to result in a high resolution of geometrical sensing, especially related to the height of the deposition and its areal surface topography, it often suffers when used to sense complex geometries. The problems of shadow and occlusion effect, as shown in Figure 21, were reported for a laser-based scanning technology. Whilst the former occurs when the part design has complex shapes or due to surface irregularities that prevent some regions from being reached by the laser scanner [213,264,265,266], the latter occurs when the scanner scans the surface but the detector cannot see the region [213,264]. It has been reported that these two effects would result in missing local point clouds, resulting in unrecognisable defects if present [267,268].
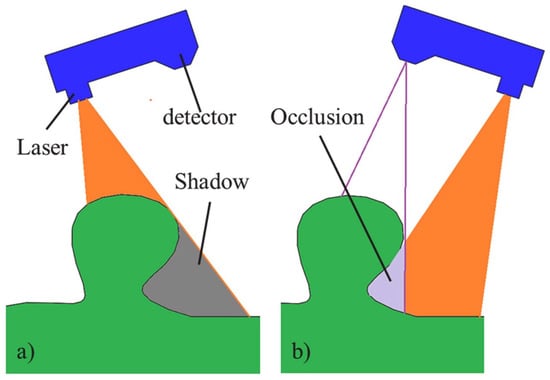
Figure 21.
Schematic of (a) shadow and (b) occlusion effect on laser-based scanning [264].
5.3.3. Hot-Red-Glowing Surfaces
Scanners face limitations in scanning hot metal surfaces but can provide accurate measurements if the surface of the deposited part is allowed to cool slightly prior to scanning. Heralić et al. [208] demonstrated the effectiveness of a laser scanner with a mechanism to protect against high temperatures and reflections during deposition. The scanner can scan the top surface of the part with a one-minute cooling period between layers to obtain precise measurements. However, in production environments, there is often a need to minimize cooling time to increase production speed, which can compromise scanning accuracy on hot surfaces. Binega et al. [269] incorporated a blue laser scanner capable of scanning transparent, organic, and hot-red-glowing surfaces with over 90% accuracy, although challenges remain with contour beads due to the shiny surface and rounded edges, resulting in low levels of reflected light. In such cases, a thin powder coating is recommended to improve scanning accuracy [176]. However, this comes at the expense of increasing production time, requiring pre-processing and post-processing of materials.
In essence, the incorporation of in-process sensing in metal AM presents significant hurdles due to the vast amounts of data generated, necessitating extensive storage and processing capabilities. Real-time or near-real-time analysis of this data for actionable decision-making requires advanced computational resources and efficient algorithms, potentially straining some systems. Environmental interference, such as heat source or spatter interference, or variations in ambient light, can also impact sensor performance, leading to distorted readings that may complicate the data analysis process. Additionally, the sophisticated sensing technologies utilized in AM systems are often expensive and complex, necessitating considerable investment in high-performance sensors and computational infrastructure. Integrating these systems into existing workflows and training personnel for data interpretation only adds to the challenges.
Data validation also plays a crucial role, as emphasised by AbouelNour and Gupta [134], who derived meaningful insights from collected data through various data processing techniques such as unifying and layering of data. Particularly, two principal strategies were proposed: (1) Post-Process Validation, which entails a direct comparison of data acquired from in situ measurements with that from ex situ measurements, and (2) A Priori Identification, a process that involves conducting in situ measurements, analysing the gathered data, and subsequently validating it by comparing it with corresponding ex situ data from the exact defect locations. This ex situ analysis can be conducted either using NDT approaches, visual inspections, or XCT scans.
6. Data Analytics and Statistical Approaches for In Situ Defect Detection
6.1. Outliers and Concept Drift Detection
Adapting to a change in distribution over time is crucial for maintaining accuracy in detection mechanism; ideally, this must be performed in real time. In the literature, multiple outlier detection methods exist in streaming data applications, including sequential-analysis-based, similarity and dissimilarity-based, window-based, statistically based, and data-distribution-based [270].
The most commonly used similarity- and dissimilarity-based method is the Drift Detection Method (DDM) [271], which implements two warning levels of detection based on the set confidence interval, for instance based on 95% and 99% confidence intervals. DDM performs well in detecting sudden and gradual drifts but performs poorly for an incremental drift. Early DDM, proposed by Baena-García et al. [271], aims to improve the detection of incremental drifts. Sequential-analysis-based methods, such as the Page–Hinkley Test [272], rely on hypothesis testing with incoming signals assumed to follow a Gaussian distribution; as such, any sudden changes in variance, either increase or decrease, would be characterized as abnormal. On the other hand, a window-based approach commonly incorporates two windows that accumulate incoming data to form a small batch of data, with large differences in the distributions between these two small batches of data, signalling a drift. Rather than utilizing a fixed window size, an adaptive window size can also be employed by tailoring the window size according to the type of drift. A series of statistical-based tests, such as measurements of central tendency, hypothesis testing, kurtosis, and skewness, can also be incorporated into the window-based approach. Vallim and De Mello [273] incorporated a Fourier transform method to produce power spectrum graphs of two sliding windows, before comparing them to detect statistical differences.
The Drift Streaming Peaks-Over-Threshold (DSPOT) [274] method iteratively updates parameters upon peak detection. It enhances the Peaks-Over-Threshold (POT) method for streaming adaptability and is specifically designed for real-time anomalous detection. Two variants of the POT method were developed by Siffer et al. [274]: Streaming POT and DSPOT. The former is suited for any stationary distribution, while the latter is more robust to handle process shifts in the streaming data. At the outset, the algorithm requires a calibration step to initialize the threshold (quantile) value with a fixed risk q, such that . The excess over the threshold (quantile) Th results in a set of peaks , with a Generalized Pareto Distribution (GPD) fitted on them to infer . Ultimately, the algorithm can adapt itself to the evolution of data for streaming that can detect anomalies and refine . The threshold (quantile) value can be determined as
where Th is a high threshold (quantile), n is the total samples, and peaks occurrences over Th are denoted by . Both parameters and are estimated through observations using Grimshaw’s trick to attain a single-variable function for solving the two variable optimization problems.
A recent study focused on analysing the melt pool height data and identified that transient spikes caused by the spatter phenomenon disrupted data acquisition in the LP-DED process [275,276]. They developed an algorithm capable of distinguishing between transient spikes, referred to as point anomalies, and unstable processes (concept drift) in streaming data without prior knowledge of the data distribution. When their method was tested on three-axis overhang data and the impeller blade structure constructed using the five-axis mode, it outperformed the DSPOT method. This improved performance can be attributed to certain algorithms overreacting to noise and incorrectly interpreting it as concept drift, while others may be too resistant to noise and adapt too slowly to changes. An ideal algorithm should strike a balance between robustness to noise and sensitivity to concept drift.
6.2. Point Cloud Data Structure
In point cloud processing, data structures can be categorised into ordered and unordered types, each with its unique characteristics and practical applications. Unordered point clouds lack any inherent organisation among the points; rather, they consist of a collection of coordinates in space with no specific order or arrangement. Unordered data structures are often used when the points are gathered from multiple scans or sensors with no fixed scanning pattern.
Rasterization is commonly employed to process high-dimensional unordered point clouds, transforming them into ordered point clouds or images to enhance the performance of downstream algorithms [277]. Lyu and Manoochechri [265] developed an online laser scanning system that efficiently monitors the fused filament fabrication process. The system uses a custom program that reduces noise with a point cloud library [278] and extracts the upper surface of the part with the RANdom SAmple Consensus (RANSAC) algorithm [279]. Subsequently, a rasterization method was used to the explain surface quality by calculating the depth of each grid node based on the distance of accumulated, neighbouring, projected scanned points—the ratio of grid depth to the designed layer thickness was used to identify over- and under-extrusions through colour coding. Afterwards, a Convolutional Neural Network (CNN) model was used to classify the state of a manually labelled layer into four main classes: normal, under-deposition, over-deposition, and severe under-deposition; based on the classification results, the process parameters were adjusted for the subsequent layer. However, generally labelling the whole layer as having either of the three anomaly classes based on only some areas of the layer with defects could result in issues for the previously deposited normal areas. This is because, whilst the adjusted process parameters may be suitable for some of the layers with defects, it may not be suitable for the layer as a whole. Localizing these defects separately with multi-classification and making appropriate adjustments to the process parameters solely in those affected regions would have been a more productive strategy.
Similarly, Ye et al. [280] used the rasterization technique for point cloud transformation; however, they asserted that the technique is insufficient for detecting defects and that only minor differences can be observed when comparing the distributions of the rasterized pixels. Ye et al. [210] proposed a framework for detecting manufacturing process defects using in situ point clouds. A series of pre-processing steps, including translation, orientation, and scaling, was used to measure the planes’ affinity between the unordered and reference point clouds to describe the surface variations. This was necessary since the captured point clouds were not on the same plane.
Point cloud data structures can be further leveraged for a follow-up analysis to identify surface, sub-surface, and internal defects. Kalami and Urbanic [264] used point cloud data to establish a correlation with surface roughness. This non-destructive approach formed an integral part of a post-processing procedure, whereby surface roughness results were subsequently compared with those obtained from destructive testing. Petrich et al. [281] combined toolpath data with process signatures to form a point cloud after each layer was fabricated. Subsequently, the point cloud was converted into a raster image, with pixel values assigned based on the average of the nearest data points. Additionally, a homography technique was used to align the registered CT and layer-wise electro-optical imagery data with the toolpath through iterative optimization. Using this technique, spatial and temporal data were integrated through synchronization. Subsequently, clusters of anomalous CT voxels could be detected based on the CT scan’s grayscale intensity.
The use of point clouds in metal AM for in situ inspection, however, remains limited, as most studies have focused on post-processing approach. Gronle et al. [282] visualized the unordered point cloud representation of each layer’s raw Indium Gallium Arsenide (InGaAs) photodiode signal. Chen et al. [206] exploited unordered point clouds obtained from a laser profiler to detect surface defects through unsupervised and supervised machine learning methods. Initially, Density-Based Spatial Clustering of Applications with Noise (DBSCAN) clustering was used to segregate the point cloud regions that may contain surface defects. Subsequently, the clustering outcomes were fed into a supervised classification algorithm to classify the type of defects. Garmendia et al. [283] used third-party GOM inspection software to visualize the layer height deviations. However, the software’s capability is limited to visualizing the deviations of the outer surface of the manufactured part only and not the internal segment. In real industrial settings, it is essential to ensure the reliability of parts; therefore, information on the internal section of the part is also necessary to prevent the need for destructive testing. Meanwhile, Bernhard et al. [284] tackled this problem by transforming the unordered toolpath coordinates into ordered point clouds, with each pixel representing the melt pool temperature data using OCTAVE software to enable the in-line inspection. However, quantifiable results of the process performance were not presented. Furthermore, visualization was only created once the print was completed and not in a layer-wise manner—relying on third-party software. In contrast, Heralić et al. [208] introduced a simple pre-processing technique to transform the sampling points into a set of N discrete points along the deposition toolpath. Instead of temperature data, they measured the performance of the process by measuring the error between the mean of the layer height and the reference height of the robot. However, this approach does not capture information between the layers—that is, if the layer has small, accumulated layer-by-layer defects; hence, localizing these faults or errors on the layer is not possible.
In contrast, ordered point clouds possess an inherent order among the points, which is usually based on their acquisition sequence or spatial arrangement. A common example of an ordered point cloud is a 2D raster grid or a 3D voxel grid, where every point is assigned to a specific position within a matrix or a volume. This order allows for efficient access and processing of spatially adjacent points, thereby facilitating downstream analysis. The choice between ordered and unordered data structures in point cloud processing depends on the point cloud data’s nature and the specific processing tasks’ requirements, as will be explained in the next section.
6.3. Spatiotemporal Analysis
Neglecting the spatiotemporal aspects in modelling and controlling the DED process can lead to geometric irregularities or adverse microstructural features in the produced item. Perani et al. [191] reaffirmed the necessity of linking outcome data with every stage of the process trajectory, highlighting that a 3D scanned mesh of the deposited sample represents only spatial dimensions, lacking the temporal context of the deposition history. To achieve this, it is essential to synchronize the deposition trajectory with the sample’s geometry.
It is known that the DED process begins with the design of the component’s geometry in CAD software, which is then sliced into layers, each defined by a specific deposition path. Any normal deposition would result in an unordered data structure, attributed to the variable sampling rates during data collection. To mitigate this, Kahl et al. [285] tested the concept of ordered data structure in DED applications by rasterising the predetermined printing boundary into a 15 × 15 grid (multi-tracks) with a 2 mm spatial resolution, aligning with the dimensions of the laser spot and hatch spacing. They averaged the temperature data for each grid cell, thereby achieving a spatiotemporal representation of the process. The authors reaffirmed that the computational effort is reduced compared to FEA, when tested for the thermal distribution prediction built based on an analytical model, called the partial different equation. Nonetheless, these FEA techniques are limited, including reliance on the geometry of the component and being computationally expensive and deterministic [286].
Yan et al. [261] devised a real-time method of detecting structured anomalies by dissecting spatiotemporal imagery data, following the methodologies outlined by Colosimo and Grasso [287]. The study indicated that foreground incidents (spatters) and irregular anomaly occurrences (hot spots) within the data can be differentiated by utilising spatially weighted Principal Component Analysis (PCA). Additionally, to further enhance anomaly detection, the sequential nature of video data was also incorporated. It was established that typical spatter events generate sudden intensity peaks in the time domain, provided those pixel intensities have no auto-correlation. On the other hand, hot spots, characterised by auto-correlation of affected pixel intensities, manifest as prolonged spikes in pixel intensities that eventually decrease over time. The importance of spatial interconnections among adjacent pixels and the temporal linkage across successive frames was emphasised. However, the approach is computationally intensive, requiring the processing of extensive data flows with frame dimensions of 126 × 136 pixels. Furthermore, the method requires a sufficient number of frames to discern anomalous patterns against the natural dynamics of the process, both in spatial and temporal realms, with hot spots only identified after 60 frames from their emergence.
Yang et al. [288] stated that the scan direction and tool path could significantly increase the uncertainty of melt pool formation even with a fixed hatch distance. A matrix-based feature descriptor that captures information from nearby points in the same layer, including laser power, scan speed, time difference, and Euclidean distance, was developed. The results indicated the presence of scattered particles and thermal energy emitted from previous melted tracks, which may impact future melt pool formation in the same vicinity. In order to predict melt pool size, a polynomial regression method was deployed to avoid potential overfitting due to noisy data. Building on this research, Yang et al. [289] highlighted that melt pool imaging data exhibit spatial and temporal variations. Whilst PCA performs well on typical 2D data, it is inadequate when dealing with 3D tensor data, as traditional PCA, when applied to vectorised imaging data, tends to overlook the intrinsic structures and correlations present in tensor data. To address this issue, the use of tensor decomposition, or Tensor-to-Vector Projection (TVP), was proposed as a method to extract uncorrelated features from melt pool images. It was emphasised that the AM process naturally induces complex spatial and temporal correlations due to its sequential layering technique, with the formation of a melt pool in a specific location affected by neighbouring areas, either within the same layer or in adjacent layers. For statistical monitoring of AM processes, Hotelling’s T-Squared and generalised likelihood ratio hypothesis testing techniques were used.
6.4. Performance Evaluation and Defects Identification
Laser Metal Deposition is a sophisticated process that builds structures layer by layer, adjusting the height of the deposition head to match the growth of the structure. Any discrepancy between the actual height of the built structure and the programmed height of the robot signals an error, potentially leading to a structure that exceeds its intended size. This nuanced balance between deposition rate and height adjustment is critical for ensuring the structure grows as designed. Donadello et al. [141] observed that initial height discrepancies increase with each layer but then tend to stabilize over time. This variation is often due to the changing efficiency in capturing powder and the fluctuating temperatures in the melt pool, which influence the thickness of each layer. Notably, the melt pool temperature usually rises in the early stages before stabilizing. However, rapid structure growth beyond the robot’s adjustments, reducing the distance between the nozzle and the workpiece, may affect the efficiency of the deposition. If this distance, or SoD, becomes too small, the process may not work as effectively, potentially leading to a cycle where the deposition efficiency and the SoD adjust back and forth in a self-regulating manner. Despite the expectation that height discrepancies will balance out over time, the authors did not consider the potential for defect propagation that begins in the early stages of the process. Without corrective measures, the final structure may end up exceeding its planned dimensions. Additionally, variations in energy density may affect layer fusion, introducing defects often related to variations in the height of the structure.
Imran et al. [290] developed an innovative method to transform the 1D melt pool height signal along with the coordinate system into an ordered data structure. This structure preserves both temporal and spatial information, creating a spatiotemporal data framework. The advantage of this approach is its ability to localize defects within the region of interest and correlate them with temporal data for diagnosis or downstream analysis, such as defect classification and segmentation using CNN. Additionally, this method led to the creation of a novel Defects−Finder algorithm, which identifies and localizes clusters of defects based on the processed data and determines their sizes.
Seifi et al. [286] introduced a data-driven method to identify various defect types, such as porosity and overheating, by analysing thermal process signatures through multilinear PCA. The rationale for employing multilinear PCA over traditional PCA is its capability to capture the spatiotemporal variations within thermal images by treating the data as a tensor. This approach involves reducing the tensor data for each layer to a lower-dimensional space that retains key information about the principal components, similar to TVP. By plotting the first two principal components against each other, a profile for each layer is created, which is then outlined by a convex hull. Variations in the melt pool characteristics result in alterations to the convex hull’s boundaries, indicating different material behaviours. A similar study also utilised multilinear PCA to extract features from the thermal imaging and subsequently used a Statistical Process Control, i.e., Q-Chart and Hotelling’s T-Squared chart, for online anomaly detection [291].
Guerra et al. [292] developed an advanced system for real-time monitoring of geometric distortions in Laser-PBF. To create varying levels of deformation and dimensional accuracy in thin-wall structures, the wall thickness and inclination angles of the structures were intentionally altered. Three new geometric indicators to more accurately describe anomalies at the overhanging surface edge—Deviation Along the Overhanging Surface Edge (DAOSE), Orthogonal Deviation (OD), and Punctual-DAOSE—were introduced. With the implementation of Shewhart Control Charts for Individual Measurements, statistical methods were used to precisely identify deviations from standard process conditions. To further validate their findings, the researchers conducted 2D/3D analyses on photogrammetric reconstructions of each sample, to pinpoint critical areas and calculate the geometric indices under consideration, leading to a comprehensive 3D evaluation of the constructed walls.
Similarly, Yang et al. [293] utilised spatter patterns captured through an IR camera as markers to assess the stability of the melt pool process. These patterns were subsequently scrutinized through Statistical Process Control (SPC) charts based on the moving average, the exponentially weighted moving average, and number of pixels to decipher the data of the melt pool area. The results revealed that localised imperfections, delamination, and separation between layers could be attributed to instances of under melting, over melting, and material spattering.
Repossini et al. [174] explored the effectiveness of integrating spatter-related data to assess the quality of the Laser-PBF process. Their findings indicate that incorporating spatters as an indicator of the process significantly enhances the ability to identify under-melting and over-melting occurrences, highlighting the substantial role spatters have in real-time monitoring and the overall quality of the DED process. To differentiate between various energy density conditions that represent different quality levels, a logistic regression model was utilised.
Ertay et al. [294] developed a classifier that uses affordable machine vision sensing to categorize process signatures into specific zones, including under-melt, conduction, keyhole, and balling, to prevent instabilities, defects, and anomalies during the process. Statistical measures including average, standard deviation, and Root Mean Square, derived from various data types like process physics, signatures, and ex situ data (with a microscope), were used to formulate process maps. The maps help to understand the relationship between performance indicators and identify different process zones. The researchers reported that using the process signatures of the melt pool alone can help identify the balling and keyholing process zones more easily; however, detecting LoF using these sensors has proven to be challenging and typically requires inference from the spatter signature. By training a K-Nearest Neighbours (kNN) classifier on statistical attributes identified by the vision sensor alongside process parameters, an error rate of 13% was reported.
A thermal prediction model created for structures with cylindrical shapes produced through Laser-PBF was implemented using an ordered data structure approach [295]. The model’s accuracy was verified by comparing IR images of each layer against ex situ XCT scans, which helped identify porosities. To facilitate comparison, the XCT images were resized to match the IR images, enabling an effective anomaly labelling process. The researchers proposed using the spatial features surrounding a voxel to determine anomalies, with a feedback loop control that allows for in situ corrections by adjusting the process parameters in subsequent layers to rectify defects detected in the current layer. However, implementing in situ corrections presents challenges, as correcting current layer defects would require information from the subsequent, yet-to-be-printed layer. The study also found that the thermal history of voxels above a given voxel has a greater impact than those below it, influencing the findings significantly. Process parameter optimization might be limited to specific areas within a layer or particular moments in the printing process. Thus, a key objective of in situ monitoring is to identify the precise spatial and temporal points where real-time adjustments to the process parameters can effectively prevent defect formation.
6.5. Melt Pool Geometrical Modelling
6.5.1. Physics-Based Approach
Researchers have used physics-based modelling to simulate the dynamics of the melt pool, particularly its morphology and temperature distribution. At the same time, this approach is also used to find the optimal process parameters for building a high-quality parts at a lower cost before printing. A physics-based approach introduces intermediate variables to quantitatively represent the physical processes, based on transport phenomena, to build the relationships amongst the process parameters, the approximate clad geometry, and its corresponding mechanical and microstructural properties [90,98,296]. When dealing with physics-related problems, they can be solved through either numerical or analytical methods.
The FEA is a popular technique employed to solve numerical models [75]. It involves breaking down a digital 3D parts into millions of smaller elements through a process called discretization or meshing. This approach allows the model to account for complex shapes and non-ideal boundary conditions. Although numerical models rely on assumptions to simplify the process, their accuracy primarily depends on the meshing scheme, which incurs higher computational time and complexity [297]. It is computationally more expensive since it requires the computation of fluid dynamics of the melt pool following the conservation principles of mass, momentum, and energy [90]. These more encompassing considerations benefited the numerical model; resulting in a slightly larger melt pool geometry and temperature distribution, which is closer to the experimental results than the analytical model [298]. Guan et al. [296] discussed the two models together with their assumptions for related physical processes.
Analytical modelling is a classical approach to understanding complex aspects of the process. Around the early 1990s, Picassa et al. [299] conducted research that gained popularity for developing a fundamental analytical model for the LP-DED process. While prediction models may not always be completely accurate due to oversimplified assumptions about complex physical processes, such as the spatial Gaussian distribution of the powder stream and heat source energy, and bulk heating, they are still valuable tools for process mapping and parameter selection [296,300]. An analytical model is preferable amongst researchers due to its fast computation time as it does not include the detailed solution of fluid mechanics (Marangoni effect) or heat loss through convection and radiation, albeit requiring a set of rational assumptions for simplification purposes [90,300]. Of course, by including different details in the model, it is possible to increase the model’s performance. However, this comes at the expense of a drastic increase in complexities. A particular focus of analytical models is on the distribution of powder concentration and associated thermal analysis. In relation to the melt pool and bulk-heating, analytical models are frequently utilized to forecast the dimensions of the melt pool as well as the thermal profile of the built part [296]. Ansari et al. [301] conducted a more in-depth analysis by approximating the thermal and geometry profiles of a single-track using 1D, 2D, and 3D heat sources. These were further extended to multi-track, multi-layer deposition [302]. However, profound discrepancies between the analytical and experimental results were found due to over-simplifications of the physical processes, physical inconsistencies, and constraints on simple structures that restricted their usage [296,302].
6.5.2. Data-Driven Approach
Data-driven models of melt pool geometry during DED processes have recently gained a considerable amount of interest among researchers. A polynomial regression thermal model has been introduced using various scan strategies and incorporating information on the adjacent points to predict melt pool size [288]. The method was compared with numerical modelling and validated through a single-layer experiment. According to Iravani-Tabrizipour and Toyserkani [189], the height of the clad cannot be analytically calculated due to the unpredictable and fluctuating shape of its cross-sectional profile during the process. To address this challenge, they demonstrated an early example of an RNN model to predict the clad height of a single-track, single-layer structure. Similar work focusing on thermal prediction has been reported using a Gated Recurrent Unit (GRU) with simulated datasets equipped with artificial noise [303]. Zhang et al. [220] investigated the effectiveness of different data-driven thermal predictive models, including Long Short-Term Memory (LSTM) and Extreme Gradient Boosting (XGBoost). Using metrics such as Root Mean Squared Error (RMSE), Relative Error (RE), and R-squared, they evaluated the effectiveness of these models and found that LSTM demonstrated exceptional prediction accuracy and resilience to noise when compared to XGBoost. Nalajam and Varadarajan [304] suggested incorporating CNN into the LSTM model to improve the accuracy of the thermal predictive model, by capturing spatial and temporal data from time series information. Whilst a previous study trained and assessed the model performance on separate structures [220], Nalajam and Varadarajan trained the networks on data from earlier layers. However, they evaluated the model using only the top layer; making the reported performance of their model questionable. Aside from using the model from the family of RNN architectures, Artificial Neural Network (ANN) models have also been utilized. Feenstra et al. [114] conducted a study on the impact of various input parameters on the geometric characteristics of the melt pool for Inconel 625, Hastelloy X, and stainless-steel 316L. Their findings indicate that the ANN model did not produce satisfactory results, but they hypothesized that the limited size of the datasets could have been a factor. Analogous to the prior study, Yang et al. [192] predicted layer height—the averaged difference in the current and previous deposition height of the predetermined cross-sectional profiles. A set of fixed variables in each layer, including laser power, scanning speed, feedstock rate, and layer index, was used. Subsequently, information such as the previous layer height, total deposited height, and nozzle-to-work distance obtained from the laser scanner were also considered. Their study used a transfer learning approach based on an ANN model with batch updates to estimate the inter-layer height of the single-track, multi-layer structure with corner features with modified scanning speed, initially trained with a straight-line feature. The revised speed was required to account for the loss of speed that may affect local energy density at the corner features. As part of the pre-processing step in each layer, the raw data obtained from the laser scanner were fitted with a spline curve and subdivided into chunks, each with an average layer height. Repetitive layer segregation in each layer was required; however, the spatial resolution of each subdivision was not defined and discussed in detail. The main limitation of this study is that the scanning strategy is the same for all layers. However, in many cases and for multi-track, multi-layer structures, an alternating scanning strategy for each subsequent layer is commonly applied, such as zig-zag and spiral [288]. Thus, synchronizing the revised scanning speed with its corresponding cross-sectional profile may be difficult to pinpoint. Overall, it is important to note that all of the aforementioned studies only experimented with a simple structure. Table 4 summarizes important works on data-driven predictive models in metal AM.
Table 4.
Existing body of research conducted for the data-driven predictive model in Metal AM.
7. Research Gap Analysis and Future Outlooks
7.1. Research Gap Analysis
Many studies have incorporated spatiotemporal features into metal AM, particularly using IR images in the PBF process. These methods, however, often strain resources for larger prints. A promising direction for future research could involve developing a new framework to convert the collected 1D signal—representing the geometric height of the deposited melt pool—into an organized point cloud structure. This structure would preserve both crucial spatial and temporal information, integrating tool path scan coordinates with other deposition data.
The findings from Section 5 highlight that most post-processing techniques are currently performed off-machine and off-process. This approach can lead to significant material wastage and production delays when components fail to meet required standards and must be scrapped. Furthermore, parts typically need to await the completion of each layer before undergoing batch process inspection and verification, further extending production times. To tackle these inefficiencies, the development of an in situ monitoring and verification procedure is essential. Such advancements would enable machine operators to promptly identify and correct deviations by adjusting process parameters on the fly. Additionally, as post-processing inspections are often conducted ex situ after fabrication, the methods can be prohibitively expensive and less effective for larger, more complex components. For instance, high-power XCT scans needed for thorough inspections are costly and generally limited to small- to medium-sized parts.
There is a crucial need for methods that can simultaneously inspect and contextualize onset defects, such as surface inconsistencies or uniform layer thickness, to enhance time and cost efficiency. Data-driven predictive modelling techniques offer potential solutions by anticipating deviations and mitigating possible issues before they arise. These would ensure better adherence to quality standards and reduce material wastage.
Table 5 provides a summary of past and ongoing research related to spatiotemporal utilization in data analytics, emphasizing the ongoing need for innovative solutions to improve in situ monitoring and control of the AM process. This analysis underscores the importance of developing adaptive models that can effectively address the complex dynamics observed in metal AM, particularly under varying operational conditions and with different material systems.
Table 5.
Related studies focusing on spatiotemporal utilization in data analytics approaches 1.
The outlined research gaps and potential improvements aim to drive advancements in AM technology by enhancing process control, reducing waste, and improving the overall reliability and quality of manufactured components.
7.2. Future Outlooks
The adoption of Digital Twin (DT) technology in AM represents a transformative approach by integrating comprehensive data collection and analysis during the deposition process. These data are instrumental in crafting a virtual replica of the physical system or process, which enhances the understanding, modelling, simulation, prediction, and optimization of the AM process to bolster quality assurance. DT technology serves as a critical bridge, linking real-world challenges to digital solutions by aggregating data from sensors, machines, and other sources to accurately model the physical system in digital space. Through the continuous analysis and validation of these DTs, manufacturers can replicate the actual manufacturing conditions, facilitating real-time control and feedback mechanisms.
However, it is crucial to recognize that DTs do not aim to supplant experimental studies but rather aim to narrow the range of process parameters and reduce dependence on trial-and-error methods. Although research interest in DTs has surged in recent years, their practical implementation within the AM landscape remains in its nascent stages. This review delineates three primary applications of DT in metal AM, as depicted in Figure 22.
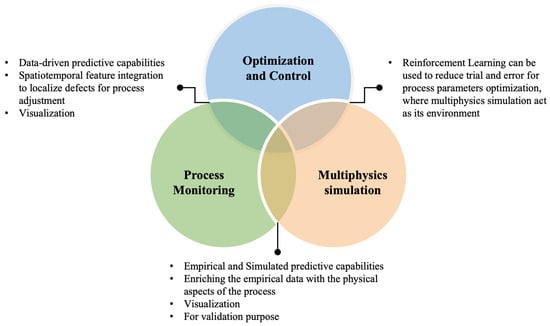
Figure 22.
Digital Twin framework in metal AM.
The concept of utilizing DTs to minimize the extensive trial-and-error cycles associated with AM was pioneered by DebRoy et al. [307], fostering subsequent advancements in the field. Following this, Knapp et al. [308] further evolved the notion by introducing the first-generation Digital Twin for laser-based Directed Energy Deposition, which predicts the spatial and temporal variations of metallurgical parameters influencing the construction and properties of components. This is achieved through an analytical model that simulates the physical process and precisely forecasts catchment efficiency and convection flow of molten metal with high accuracy.
Subsequent research by Hartmann et al. [309] introduced a numerical model for DT using multiphysics simulation to couple local (the deposition process) and global (base plate temperature) models, thus enhancing the understanding of the LP-DED process. This model monitors melt pool diameter and temperature and analyses microstructure, i.e., Secondary Dendrite Arm Spacing (SDAS), based on the cooling rate measurement. The DTs validated through experiments on different structures demonstrated considerable error margins, particularly in height measurements as the layer height increased.
Sharma et al. [310] advocated for the use of standalone Digital Twins that employ phenomenological computational models to predict process–structural–property relationships, including process parameters, structural defects, grain morphology and size, as well as mechanical properties, respectively, in metal AM. These models, while predictive, are tested against experimental results for validation and refinement.
Khairallah et al. [311] put forward an innovative approach to enhance the precision of DT processes in AM. They explored the promising potential of laser customization technologies to manipulate the transition from columnar to equiaxed grain structures. This study particularly focused on the benefits of using a ring laser beam profile over the traditional Gaussian laser profile. The ring beam, by distributing energy more evenly across the melt pool, significantly reduces the thermal gradient along the solidification front. Such a reduction is critical as it increases the propensity for forming equiaxed grains, which are often more desirable due to their isotropic properties. Moreover, the research introduced a high-fidelity model capable of replicating the DED process with a high degree of accuracy. This model is instrumental in providing deep insights into the pore formation mechanisms that are typically initiated by powder impingement or elevated powder flow rates. It also facilitates a detailed analysis of the variations in thermal gradient profiles and solidification rates, impacting the microstructure morphology of the printed parts. These complex variations are challenging to access through standard experimental setups but can be effectively deduced and validated via post hoc analysis of the components. Additionally, the study highlights the distinct advantages of employing a high-power laser ring beam profile compared to the Gaussian beam. The ring beam profile, while potentially increasing the occurrence of pores due to its characteristics of insufficient melting at higher powder flow rates and lower power, offers a significant advantage in how it manages the distribution of laser energy. By covering a larger area of the melt pool without relying solely on melt flow or heat conduction for the distribution of heat, the ring beam mitigates the formation of central hot spots typical of Gaussian beams. This alteration substantially diminishes the thermal gradient across the melt pool, further facilitating the formation of equiaxed grains. This nuanced understanding of laser beam profiling opens new avenues for optimizing the microstructural outcomes in metal AM.
Chen et al. [312] highlighted the potential of DT technology to predict localized quality in the LP-DED process through comprehensive process monitoring. The study employed a multi-sensor setup that captured diverse data streams including visual images of the melt pool, thermal fields, and acoustic signals. This approach revealed that relying exclusively on any single type of sensor data—visual or acoustic—tends to either overstate or understate defect occurrences. In contrast, a fused sensor approach provided a more balanced and reliable detection of anomalies, proving that multi-sensor data fusion is a superior method for monitoring. However, the research also noted the challenge of achieving absolute synchronization and precise alignment among the multi-sensor data, machine learning predictions, and the robotic tool centre-point positioning, settling instead for a rough approximation of defect locations. Neural networks emerged as the most effective among the six machine learning models tested, adept at managing the complex, high-dimensional data typical of DED processes. However, the researchers encountered issues in data annotation when discernible defects such as cracks or keyhole pores appeared briefly within a 500 ms window. This led to labelling the entire region as defective, which might exaggerate the extent of imperfections. Utilizing established process knowledge and pre-defined rules, deviations from norms could be efficiently detected and correlated to the digital 3D model of the product [313]. This capability simplifies the task of pinpointing concerns and assessing the severity of defects, embodying a fundamental application of DT technology.
In terms of modelling strategies, the field predominantly employs two approaches: data-driven models, known as black box models, and physics-based models, or white box models. By integrating these approaches, a grey box model or DT [29] can be constructed, offering a balance of empirical data handling and theoretical physics understanding. White box models based on physical phenomena, while robust, often do not fully account for process uncertainties, whereas black box models, though adept at handling data from sensors capturing real-time uncertainties, offer limited explanatory power regarding the causality of observed phenomena. Consequently, they are unable to bring the process back to a fault-free status if any irregularity is observed. Combining these models enhances overall accuracy and utility. Integrating multiphysics simulation models, sensor data, and data analysis through machine learning facilitates the identification of optimal parameters for defect-free deposition, thus eliminating the necessity to develop a physical model, which can then be used for real-time control and continuous improvement of the deposition process. The efficacy of a DT hinges upon its proximity to real-world conditions. For instance, Gawade et al. [314] developed an innovative method to enhance anomaly detection within the LP-DED process by integrating numerical simulations with empirical data. This integration proved pivotal for improving the performance of a supervised learning model tasked with anomaly detection. By feeding physics-based features derived from simulated melt pools into the model, the learning algorithm could develop a more nuanced understanding of the melt pool dynamics. This process began with aligning simulated melt pools with their empirical counterparts, ensuring that both sets of data corresponded to the same sections of the print and similar operational times. To delve deeper into the data, the researchers employed functional PCA. This technique allowed them to distil the complex data sets into principal components that captured the most significant features of the melt pools, both simulated and observed. These features included variations in melt pool geometry, temperature gradients, and other critical metallurgical factors. The next step involved selective feature extraction, where only the most relevant features—those strongly correlated with porosity formation—were retained for further analysis. This focus ensured that the model was not overwhelmed by extraneous data, enhancing its predictive accuracy. With a refined set of features, the team then trained a gradient boosting model, a type of supervised learning technique known for its effectiveness in handling diverse and complex data structures. The model was specifically tasked with predicting porosity, a common defect in AM that can significantly impact the mechanical properties and integrity of the produced parts. This methodological approach not only bolstered the accuracy of the defect detection but also provided a framework for applying similar techniques across different AM processes, potentially transforming how data-driven models are constructed and utilized in high-precision manufacturing settings.
In the domain of metal AM, DTs are extensively employed for tasks such as multiphysics simulation modelling and process monitoring. These sophisticated tools facilitate the virtual replication of physical entities, enabling the simulation of processes without direct physical interference. Such capabilities are crucial for enhancing process understanding and predictive accuracy. Machine learning models within DT frameworks have shown significant potential in predicting defects, which is vital for implementing effective quality control measures. By analysing the likelihood of defect occurrence, these models inform necessary adjustments to the manufacturing process, such as modifying the specific energy density to mitigate localized heat accumulation. This proactive approach to process adjustments helps maintain the integrity and quality of the manufactured parts. To harness the full capabilities of DTs in metal AM, it is essential to advance techniques in optimization and adaptive process control. For example, a recent study by Dharmadhikari et al. [315] leveraged a Reinforcement Learning (RL) methodology to refine the process parameters of DTs, utilizing a Q-learning algorithm tailored to a multiphysics simulation environment. This study explored various Laser power–velocity combinations to optimize the melt pool’s depth, effectively maintaining critical process variables within optimal ranges. The RL agent, representing the laser in the simulation, interacted with the environment—an analytical model of the process—to dynamically adjust parameters based on real-time feedback regarding temperature distribution and melt pool depth. Such adaptive strategies exemplify how DTs can not only simulate but also actively control the AM process, leading to more precise and reliable outcomes. This integration of predictive analytics with active process control opens new avenues for improving the efficiency and quality of metal AM, illustrating the transformative potential of Digital Twins in the industry.
In summary, the integration of DTs into metal AM represents a transformative advancement in the fields of multiphysics simulation, process monitoring, and optimization strategies. Digital Twins capture and utilize the extensive data generated during the deposition process, providing manufacturers with sophisticated insights, enhanced modelling capabilities, and robust quality assurance tools. This technology has been pioneered by trailblazing research that demonstrates the feasibility and benefits of DTs in AM, particularly in their capacity to predict and manage metallurgical parameters and identify potential defects. Further studies have shown that DTs are remarkably flexible in optimizing process parameters, which aids in refining the grain structure and improving defect detection within manufactured parts. By combining both data-driven analytics and physics-based modelling, DTs offer a powerful solution for advancing quality enhancements and achieving precise real-time control over AM processes. This integrated approach allows for the adaptive modification of process parameters in response to real-time feedback, which significantly enhances the manufacturability and quality of the final products. Despite these advancements, the full potential of DTs in AM has yet to be completely realized. Continued research and development is essential to address the existing challenges and expand the capabilities of DTs. Enhancing the fidelity of simulations, improving data integration, and refining control mechanisms are critical areas that require further exploration to fully leverage the benefits of DTs in metal AM. Such ongoing efforts will ensure that DT technology not only supports current manufacturing needs but also adapts to future demands and innovations in the industry.
8. Conclusions
The field of metal AM has seen substantial growth, driven by its potential to revolutionize traditional manufacturing through enhanced geometrical flexibility and material customization. Among the various AM technologies, DED stands out due to its capability to fabricate complex geometries directly from digital models using focused thermal energy. This review critically evaluates recent advancements in DED, identifying its pivotal role and distinct challenges within the broader AM landscape. DED technology, while promising, contends with significant challenges stemming from the complex interplay between laser and powder. This interaction often influences the melt pool’s geometrical characteristics, contributing to defect formations such as non-uniform layer thickness and edge collapsing. Additionally, this paper has explored morphological defects including porosity and spatters, highlighting their impact on the integrity and functionality of DED-produced components. The necessity of rigorous inspection methods is emphasized, showcasing their role as a cornerstone of quality assurance in the DED process.
Furthermore, the review clarifies terminology and definitions related to measurement and monitoring techniques to address inconsistencies within the manufacturing literature. By discussing various sensing signals—optical, acoustic, spectral, and electronic—the paper aids in the selection of appropriate sensors to capture specific process signatures, enhancing the reliability of in situ process inspection despite the inherent variability of process parameters and environmental factors like plume and spatter generation.
While spatter generation is a common occurrence in laser-based metal AM processes, this review outlines effective mitigation strategies that minimize its impact. However, challenges persist as spatters may sometimes be misinterpreted as anomalies, leading to transient signal spikes that, while potentially insightful, could cause concept drift in acquired signals. This underscores the necessity of advanced process monitoring techniques as a foundation for improving build quality and advancing AM towards automation and control.
Lastly, the paper surveys state-of-the-art metal AM data analytics and statistical approaches for in situ defect detection. It discusses reliable methods to distinguish between point anomalies and concept drift, leveraging spatiotemporal analysis based on point cloud data structures for precise defect identification and melt pool geometrical modelling. The review concludes by mapping future directions, particularly emphasizing the development of Digital Twins in metal AM and highlighting research gaps that warrant further investigation to harness the full potential of DED technology.
Funding
This research was funded by the National Research Foundation of Korea (NRF) grant, which is funded by the Korean government of the Ministry of Science and ICT, with grant number [NRF-2022R1A2C1013147]. The APC was funded by the Universiti Brunei Darussalam Research Grant [UBD/RSCH/1.3/FICBF(b)/2024/023].
Acknowledgments
The authors are grateful to Universiti Brunei Darussalam for funding the first author’s research work at Sungkyunkwan University. Additionally, we would like to express appreciation to Hwacheon Co., Ltd. for providing valuable insights into DED technology.
Conflicts of Interest
Author Azam Che Idris was employed by the company Herbalogi.ai. The remaining authors declare that the research was conducted in the absence of any commercial or financial relationships that could be construed as a potential conflict of interest.
Nomenclature
| AE | Acoustic Emission |
| AM | Additive Manufacturing |
| ANN | Artificial Neural Network |
| AISI | American Iron and Steel Institute |
| ASTM | American Society for Testing and Materials |
| BJT | Binder Jetting |
| CAD | Computer-Aided Design |
| CAGR | Compounded Annual Growth Rate |
| CCD | Charge-Coupled Device |
| CMOS | Complementary Metal Oxide Semiconductor |
| CNC | Computer Numerical Control |
| CNN | Convolutional Neural Network |
| CO2 | Carbon Dioxide |
| CT | Computed Tomography |
| DAOSE | Deviation Along the Overhanging Surface Edge |
| DBSCAN | Density-Based Spatial Clustering of Applications with Noise |
| DDM | Drift Detection Method |
| DED | Directed Energy Deposition |
| DMD | Direct Metal Deposition |
| DFAM | Design For Additive Manufacturing |
| DFMA | Design For Manufacture and Assembly |
| DSPOT | Drift Streaming Peak-Over-Threshold |
| DT | Digital Twin |
| EBAM | Electron Beam Additive Manufacturing |
| FBG | Fiber Bragg Grating |
| FEA | Finite Element Analysis |
| FGM | Functionally Graded Material |
| G-CODE | Geometric Code |
| GPD | Generalized Pareto Distribution |
| GRU | Gated Recurrent Unit |
| HAZ | Heat-Affected Zone |
| H/D | Height-over-Depth |
| HIP | Hot Isostatic Pressing |
| ICI | Inline Coherent Imaging |
| INGAAS | Indium Gallium Arsenide |
| IR | Infrared |
| ISO | International Organization of Standardization |
| KNN | K-Nearest Neighbours |
| LENS™ | Laser Engineered Net Shaping |
| LMD | Laser Metal Deposition |
| LoF | Lack-of-Fusion |
| LP-DED | Laser–Powder-based Directed Energy Deposition |
| LSTM | Long Short-Term Memory |
| ME | Material Extrusion |
| MRO | Maintenance, Repair, and Overhaul |
| NASA | National Aeronautics and Space Administration |
| NCC | Numerical Control Code |
| ND:YAG | Neodymium-Doped Yttrium Aluminium Garnet |
| NDT | Non-Destructive Testing |
| NIR | Near-Infrared |
| NiCr | Nickel–Chromium |
| OD | Orthogonal Deviation |
| OES | Optical Emission Spectroscopy |
| PBF | Powder Bed Fusion |
| PCA | Principal Component Analysis |
| PCAST | President’s Council of Advisors on Science and Technology |
| POT | Peaks-Over-Threshold |
| RANSAC | Random Sample Consensus |
| R&D | Research and Development |
| RE | Relative Error |
| RL | Reinforcement Learning |
| RMSE | Root Mean Squared Error |
| SDAM | Secondary Dendrite Arm Spacing |
| SoD | Standoff Distance |
| SL | Sheet Lamination |
| SLA | Stereolithography |
| SLM | Selective Laser Melting |
| SPC | Statistical Process Control |
| STL | Standard Tessellation Language |
| TiC | Titanium Carbide |
| TVP | Tensor-to-Vector Projection |
| UV | Ultraviolet |
| USD | United States Dollar |
| WAAM | Wire Arc Additive Manufacturing |
| XCT | X-Ray Computed Tomography |
| XGBOOST | Extreme Gradient Boosting |
| X-Ray | X-radiation |
| Yb | Ytterbium |
References
- ISO/ASTM 52900:2021; Additive Manufacturing—General Principles—Fundamentals and Vocabulary. ISO/ASTM: Geneva, Switzerland, 2021.
- Executive Office of the US President. Capturing a Domestic Competitive Advantage in Advanced Manufacturing. 2012. Available online: https://www.energy.gov/sites/prod/files/2013/11/f4/pcast_annex1_july2012.pdf (accessed on 12 January 2024).
- Scott, C. United Nations Encourages More Countries to Invest in 3D Printing. 2015. Available online: https://3dprint.com/105046/united-nations-wipo-report/ (accessed on 12 January 2024).
- World Intellectual Property Organization. Getting Rid of Bulky Plasters with 3-D Printed Technology. 2022. Available online: https://www.wipo.int/wipo_magazine/en/ip-at-work/2022/3d-printed-technology.html (accessed on 12 January 2024).
- Research and Markets. Additive Manufacturing Global Market Report 2024. 5807051. 2024. Available online: https://www.researchandmarkets.com/reports/5807051/additive-manufacturing-global-market-report# (accessed on 12 January 2024).
- Toyserkani, E.; Sarker, D.; Ibhadode, O.O.; Liravi, F.; Russo, P.; Taherkhani, K. Metal Additive Manufacturing; John Wiley & Sons, Inc.: Hoboken, NJ, USA, 2021; p. 624. [Google Scholar]
- Baumers, M.; Dickens, P.; Tuck, C.; Hague, R. The cost of additive manufacturing: Machine productivity, economies of scale and technology-push. Technol. Forecast. Soc. Chang. 2016, 102, 193–201. [Google Scholar] [CrossRef]
- Atzeni, E.; Salmi, A. Economics of additive manufacturing for end-usable metal parts. Int. J. Adv. Manuf. Technol. 2012, 62, 1147–1155. [Google Scholar] [CrossRef]
- Thomas, D.S.; Gilbert, S.W. Costs and cost effectiveness of additive manufacturing. NIST Spec. Publ. 2014, 1176, 12. [Google Scholar]
- Blakey-Milner, B.; Gradl, P.; Snedden, G.; Brooks, M.; Pitot, J.; Lopez, E.; Leary, M.; Berto, F.; du Plessis, A. Metal additive manufacturing in aerospace: A review. Mater. Des. 2021, 209, 110008. [Google Scholar] [CrossRef]
- Ngo, T.D.; Kashani, A.; Imbalzano, G.; Nguyen, K.T.Q.; Hui, D. Additive manufacturing (3D printing): A review of materials, methods, applications and challenges. Compos. Part B Eng. 2018, 143, 172–196. [Google Scholar] [CrossRef]
- Bourell, D.; Kruth, J.P.; Leu, M.; Levy, G.; Rosen, D.; Beese, A.M.; Clare, A. Materials for additive manufacturing. CIRP Ann. 2017, 66, 659–681. [Google Scholar] [CrossRef]
- Gibson, I.; Rosen, D.W.; Stucker, B.; Khorasani, M.; Rosen, D.; Stucker, B.; Khorasani, M. Additive Manufacturing Technologies; Springer: Berlin/Heidelberg, Germany, 2021. [Google Scholar]
- Vafadar, A.; Guzzomi, F.; Rassau, A.; Hayward, K. Advances in metal additive manufacturing: A review of common processes, industrial applications, and current challenges. Appl. Sci. 2021, 11, 1213. [Google Scholar] [CrossRef]
- Bhatia, A.; Sehgal, A.K. Additive manufacturing materials, methods and applications: A review. Mater. Today Proc. 2023, 81, 1060–1067. [Google Scholar] [CrossRef]
- Gradl, P.R.; Mireles, O.R.; Protz, C.S.; Garcia, C.P. Metal Additive Manufacturing for Propulsion Applications; AIAA Progress in Astronautics and Aeronautics Book Series; American Institute of Aeronautics and Astronautics: Reston, VA, USA, 2022. [Google Scholar]
- Mazzucato, F.; Avram, O.; Valente, A.; Carpanzano, E. Recent advances toward the industrialization of metal additive manufacturing. Syst. Eng. Fourth Ind. Revolut. 2019, 273–319. [Google Scholar] [CrossRef]
- Praveena, B.; Lokesh, N.; Buradi, A.; Santhosh, N.; Praveena, B.; Vignesh, R. A comprehensive review of emerging additive manufacturing (3D printing technology): Methods, materials, applications, challenges, trends and future potential. Mater. Today Proc. 2022, 52, 1309–1313. [Google Scholar]
- Gao, W.; Zhang, Y.; Ramanujan, D.; Ramani, K.; Chen, Y.; Williams, C.B.; Wang, C.C.L.; Shin, Y.C.; Zhang, S.; Zavattieri, P.D. The status, challenges, and future of additive manufacturing in engineering. Comput.-Aided Des. 2015, 69, 65–89. [Google Scholar] [CrossRef]
- Srivastava, M.; Rathee, S. Additive manufacturing: Recent trends, applications and future outlooks. Prog. Addit. Manuf. 2022, 7, 261–287. [Google Scholar] [CrossRef]
- Lettori, J.; Raffaeli, R.; Peruzzini, M.; Schmidt, J.; Pellicciari, M. Additive manufacturing adoption in product design: An overview from literature and industry. Procedia Manuf. 2020, 51, 655–662. [Google Scholar] [CrossRef]
- Tuvayanond, W.; Prasittisopin, L. Design for Manufacture and Assembly of Digital Fabrication and Additive Manufacturing in Construction: A Review. Buildings 2023, 13, 429. [Google Scholar] [CrossRef]
- Schmelzle, J.; Kline, E.V.; Dickman, C.J.; Reutzel, E.W.; Jones, G.; Simpson, T.W. (Re) Designing for part consolidation: Understanding the challenges of metal additive manufacturing. J. Mech. Des. 2015, 137, 111404. [Google Scholar] [CrossRef]
- Nayyeri, P.; Zareinia, K.; Bougherara, H. Planar and nonplanar slicing algorithms for fused deposition modeling technology: A critical review. Int. J. Adv. Manuf. Technol. 2022, 119, 2785–2810. [Google Scholar] [CrossRef]
- Feldhausen, T.; Heinrich, L.; Saleeby, K.; Burl, A.; Post, B.; MacDonald, E.; Saldana, C.; Love, L. Review of Computer-Aided Manufacturing (CAM) strategies for hybrid directed energy deposition. Addit. Manuf. 2022, 56, 102900. [Google Scholar] [CrossRef]
- Liu, J.; Gaynor, A.T.; Chen, S.; Kang, Z.; Suresh, K.; Takezawa, A.; Li, L.; Kato, J.; Tang, J.; Wang, C.C.L.; et al. Current and future trends in topology optimization for additive manufacturing. Struct. Multidiscip. Optim. 2018, 57, 2457–2483. [Google Scholar] [CrossRef]
- Zhang, C.; Chen, F.; Huang, Z.; Jia, M.; Chen, G.; Ye, Y.; Lin, Y.; Liu, W.; Chen, B.; Shen, Q.; et al. Additive manufacturing of functionally graded materials: A review. Mater. Sci. Eng. A 2019, 764, 138209. [Google Scholar] [CrossRef]
- Carrozza, A.; Aversa, A.; Mazzucato, F.; Lombardi, M.; Biamino, S.; Valente, A.; Fino, P. An innovative approach on directed energy deposition optimization: A study of the process environment’s influence on the quality of Ti-6Al-4V samples. Appl. Sci. 2020, 10, 4212. [Google Scholar] [CrossRef]
- Gaikwad, A.; Yavari, R.; Montazeri, M.; Cole, K.; Bian, L.; Rao, P. Toward the digital twin of additive manufacturing: Integrating thermal simulations, sensing, and analytics to detect process faults. IISE Trans. 2020, 52, 1204–1217. [Google Scholar] [CrossRef]
- Hu, K.; Wang, Y.; Li, W.; Wang, L. CNN-BiLSTM enabled prediction on molten pool width for thin-walled part fabrication using Laser Directed Energy Deposition. J. Manuf. Process. 2022, 78, 32–45. [Google Scholar] [CrossRef]
- Gao, X.; Yao, X.X.; Niu, F.Y.; Zhang, Z. The influence of nozzle geometry on powder flow behaviors in directed energy deposition additive manufacturing. Adv. Powder Technol. 2022, 33, 103487. [Google Scholar] [CrossRef]
- Tan, H.; Zhang, F.; Wen, R.; Chen, J.; Huang, W. Experiment study of powder flow feed behavior of laser solid forming. Opt. Lasers Eng. 2012, 50, 391–398. [Google Scholar] [CrossRef]
- Saboori, A.; Biamino, S.; Lombardi, M.; Tusacciu, S.; Busatto, M.; Lai, M.; Fino, P. How the nozzle position affects the geometry of the melt pool in directed energy deposition process. Powder Metall. 2019, 62, 213–217. [Google Scholar] [CrossRef]
- Zhang, Y.; Jing, H.; Xu, L.; Han, Y.; Zhao, L. Effects of different scanning patterns on nickel alloy-directed energy deposition based on thermal analysis. Virtual Phys. Prototyp. 2021, 16 (Suppl. S1), S98–S115. [Google Scholar] [CrossRef]
- Moradi, M.; Hasani, A.; Beiranvand, Z.M.; Ashoori, A. Additive manufacturing of stellite 6 superalloy by direct laser metal deposition—Part 2: Effects of scanning pattern and laser power reduction in differrent layers. Opt. Laser Technol. 2020, 131, 106455. [Google Scholar] [CrossRef]
- Chua, Z.Y.; Ahn, I.H.; Moon, S.K. Process monitoring and inspection systems in metal additive manufacturing: Status and applications. Int. J. Precis. Eng. Manuf.-Green Technol. 2017, 4, 235–245. [Google Scholar] [CrossRef]
- Zhu, K.; Fuh, J.Y.H.; Lin, X. Metal-based additive manufacturing condition monitoring: A review on machine learning based approaches. IEEE/ASME Trans. Mechatron. 2021, 27, 2495–2510. [Google Scholar] [CrossRef]
- Cai, Y.; Xiong, J.; Chen, H.; Zhang, G. A review of in-situ monitoring and process control system in metal-based laser additive manufacturing. J. Manuf. Syst. 2023, 70, 309–326. [Google Scholar] [CrossRef]
- Maleki, E.; Bagherifard, S.; Bandini, M.; Guagliano, M. Surface post-treatments for metal additive manufacturing: Progress, challenges, and opportunities. Addit. Manuf. 2021, 37, 101619. [Google Scholar] [CrossRef]
- Laleh, M.; Sadeghi, E.; Revilla, R.I.; Chao, Q.; Haghdadi, N.; Hughes, A.E.; Xu, W.; De Graeve, I.; Qian, M.; Gibson, I.; et al. Heat treatment for metal additive manufacturing. Prog. Mater. Sci. 2023, 133, 101051. [Google Scholar]
- Seifi, M.; Salem, A.; Beuth, J.; Harrysson, O.; Lewandowski, J.J. Overview of materials qualification needs for metal additive manufacturing. JOM 2016, 68, 747–764. [Google Scholar] [CrossRef]
- Seifi, M.; Gorelik, M.; Waller, J.; Hrabe, N.; Shamsaei, N.; Daniewicz, S.; Lewandowski, J.J. Progress towards metal additive manufacturing standardization to support qualification and certification. JOM 2017, 69, 439–455. [Google Scholar] [CrossRef]
- Chen, Z.; Han, C.; Gao, M.; Kandukuri, S.Y.; Zhou, K. A review on qualification and certification for metal additive manufacturing. Virtual Phys. Prototyp. 2022, 17, 382–405. [Google Scholar] [CrossRef]
- Jamroz, W.; Szafraniec, J.; Kurek, M.; Jachowicz, R. 3D printing in pharmaceutical and medical applications–recent achievements and challenges. Pharm. Res. 2018, 35, 176. [Google Scholar] [CrossRef] [PubMed]
- Gradl, P.R.; Teasley, T.W.; Protz, C.S.; Katsarelis, C.; Chen, P. Process development and hot-fire testing of additively manufactured NASA HR-1 for liquid rocket engine applications. In AIAA Propulsion and Energy 2021 Forum; American Institute of Aeronautics and Astronautics: Reston, VA, USA, 2021; p. 3236. [Google Scholar]
- Gardner, L.; Kyvelou, P.; Herbert, G.; Buchanan, C. Testing and initial verification of the world’s first metal 3D printed bridge. J. Constr. Steel Res. 2020, 172, 106233. [Google Scholar] [CrossRef]
- Herzog, D.; Seyda, V.; Wycisk, E.; Emmelmann, C. Additive manufacturing of metals. Acta Mater. 2016, 117, 371–392. [Google Scholar] [CrossRef]
- Mahale, R.S.; Shamanth, V.; Hemanth, K.; Nithin, S.; Sharath, P.; Shashanka, R.; Patil, A.; Shetty, D. Processes and applications of metal additive manufacturing. Mater. Today Proc. 2022, 54, 228–233. [Google Scholar] [CrossRef]
- Murugan, P.D.; Vijayananth, S.; Natarajan, M.; Jayabalakrishnan, D.; Arul, K.; Jayaseelan, V.; Elanchezhian, J. A current state of metal additive manufacturing methods: A review. Mater. Today Proc. 2022, 59, 1277–1283. [Google Scholar] [CrossRef]
- Brennan, M.; Keist, J.; Palmer, T. Defects in Metal Additive Manufacturing Processes; Springer: Berlin/Heidelberg, Germany, 2021. [Google Scholar]
- Mohd Yusuf, S.; Cutler, S.; Gao, N. The impact of metal additive manufacturing on the aerospace industry. Metals 2019, 9, 1286. [Google Scholar] [CrossRef]
- Frazier, W.E. Metal additive manufacturing: A review. J. Mater. Eng. Perform. 2014, 23, 1917–1928. [Google Scholar] [CrossRef]
- Lewandowski, J.J.; Seifi, M. Metal additive manufacturing: A review of mechanical properties. Annu. Rev. Mater. Res. 2016, 46, 151–186. [Google Scholar] [CrossRef]
- Cooke, S.; Ahmadi, K.; Willerth, S.; Herring, R. Metal additive manufacturing: Technology, metallurgy and modelling. J. Manuf. Process. 2020, 57, 978–1003. [Google Scholar] [CrossRef]
- Megahed, M.; Mindt, H.-W.; N’dri, N.; Duan, H.; Desmaison, O. Metal additive-manufacturing process and residual stress modeling. Integr. Mater. Manuf. Innov. 2016, 5, 61–93. [Google Scholar] [CrossRef]
- Vayre, B.; Vignat, F.; Villeneuve, F. Metallic additive manufacturing: State-of-the-art review and prospects. Mech. Ind. 2012, 13, 89–96. [Google Scholar] [CrossRef]
- Sames, W.J.; List, F.A.; Pannala, S.; Dehoff, R.R.; Babu, S.S. The metallurgy and processing science of metal additive manufacturing. Int. Mater. Rev. 2016, 61, 315–360. [Google Scholar] [CrossRef]
- Armstrong, M.; Mehrabi, H.; Naveed, N. An overview of modern metal additive manufacturing technology. J. Manuf. Process. 2022, 84, 1001–1029. [Google Scholar] [CrossRef]
- Bandyopadhyay, A.; Zhang, Y.; Bose, S. Recent developments in metal additive manufacturing. Curr. Opin. Chem. Eng. 2020, 28, 96–104. [Google Scholar] [CrossRef]
- Yakout, M.; Elbestawi, M.; Veldhuis, S.C. A review of metal additive manufacturing technologies. Solid State Phenom. 2018, 278, 1–14. [Google Scholar] [CrossRef]
- Market.Us. Additive Manufacturing with Metal Powders Market. 22861. 2024. Available online: https://market.us/report/additive-manufacturing-with-metal-powders-market/#overview (accessed on 12 January 2024).
- Singh, A.; Kapil, S.; Das, M. A comprehensive review of the methods and mechanisms for powder feedstock handling in directed energy deposition. Addit. Manuf. 2020, 35, 101388. [Google Scholar] [CrossRef]
- Özel, T.; Shokri, H.; Loizeau, R. A review on wire-fed directed energy deposition based metal additive manufacturing. J. Manuf. Mater. Process. 2023, 7, 45. [Google Scholar] [CrossRef]
- Gradl, P.; Tinker, D.C.; Park, A.; Mireles, O.R.; Garcia, M.; Wilkerson, R.; Mckinney, C. Robust metal additive manufacturing process selection and development for aerospace components. J. Mater. Eng. Perform. 2022, 31, 6013–6044. [Google Scholar] [CrossRef]
- Babuska, T.F.; Krick, B.A.; Susan, D.F.; Kustas, A.B. Comparison of powder bed fusion and directed energy deposition for tailoring mechanical properties of traditionally brittle alloys. Manuf. Lett. 2021, 28, 30–34. [Google Scholar] [CrossRef]
- Chechik, L.; Todd, I. Inconel 718 two ways: Powder bed fusion vs. directed energy deposition. Addit. Manuf. Lett. 2023, 6, 100145. [Google Scholar] [CrossRef]
- Ansari, M.; Jabari, E.; Toyserkani, E. Opportunities and challenges in additive manufacturing of functionally graded metallic materials via powder-fed laser directed energy deposition: A review. J. Mater. Process. Technol. 2021, 294, 117117. [Google Scholar] [CrossRef]
- Yi, H.; Wang, Q.; Cao, H. Wire-arc directed energy deposition of magnesium alloys: Microstructure, properties and quality optimization strategies. J. Mater. Res. Technol. 2022, 20, 627–649. [Google Scholar] [CrossRef]
- Gonzalez, L.C.; Tuominen, J.; Ahmed, S.; Patnamsetty, M.; Peura, P. Directed energy deposition of AA7075-Effect of TiC nanoparticles on microstructure. Results Mater. 2022, 16, 100341. [Google Scholar] [CrossRef]
- Mukherjee, T.; Zuback, J.S.; De, A.; DebRoy, T. Printability of alloys for additive manufacturing. Sci. Rep. 2016, 6, 19717. [Google Scholar] [CrossRef]
- Svetlizky, D.; Das, M.; Zheng, B.; Vyatskikh, A.L.; Bose, S.; Bandyopadhyay, A.; Schoenung, J.M.; Lavernia, E.J.; Eliaz, N. Directed energy deposition (DED) additive manufacturing: Physical characteristics, defects, challenges and applications. Mater. Today 2021, 49, 271–295. [Google Scholar] [CrossRef]
- Liu, R.; Wang, Z.; Sparks, T.; Liou, F.; Newkirk, J. Aerospace applications of laser additive manufacturing. In Laser Additive Manufacturing: Materials, Design, Technologies, and Applications; Woodhead Publishing: Cambridge, UK, 2017; pp. 351–371. [Google Scholar] [CrossRef]
- Vartanian, K.; Brewer, L.; Manley, K.; Cobbs, T. Powder bed fusion vs. directed energy deposition benchmark study: Mid-size part with simple geometry. Optomec Tech. Rep. 2016, 1, 1–4. [Google Scholar]
- Shamsaei, N.; Yadollahi, A.; Bian, L.; Thompson, S.M. An overview of Direct Laser Deposition for additive manufacturing; Part II: Mechanical behavior, process parameter optimization and control. Addit. Manuf. 2015, 8, 12–35. [Google Scholar] [CrossRef]
- Thompson, S.M.; Bian, L.; Shamsaei, N.; Yadollahi, A. An overview of Direct Laser Deposition for additive manufacturing; Part I: Transport phenomena, modeling and diagnostics. Addit. Manuf. 2015, 8, 36–62. [Google Scholar] [CrossRef]
- DebRoy, T.; Wei, H.L.; Zuback, J.S.; Mukherjee, T.; Elmer, J.W.; Milewski, J.O.; Beese, A.M.; Wilson-Heid, A.D.; De, A.; Zhang, W. Additive manufacturing of metallic components–process, structure and properties. Prog. Mater. Sci. 2018, 92, 112–224. [Google Scholar] [CrossRef]
- Mazzucato, F.; Menerini, M.; Valente, A. Laser-based Hybrid System for Inconel 718 part repairing. Procedia CIRP 2020, 95, 29–34. [Google Scholar] [CrossRef]
- Mazzucato, F.; Forni, D.; Valente, A.; Cadoni, E. Laser metal deposition of Inconel 718 alloy and as-built mechanical properties compared to casting. Materials 2021, 14, 437. [Google Scholar] [CrossRef]
- Gibson, I.; Rosen, D.; Stucker, B.; Gibson, I.; Rosen, D.; Stucker, B. Directed energy deposition processes. In Additive Manufacturing Technologies: 3D Printing, Rapid Prototyping, and Direct Digital Manufacturing; Springer: New York, NY, USA, 2015; pp. 245–268. [Google Scholar]
- Gu, D.; Shi, X.; Poprawe, R.; Bourell, D.L.; Setchi, R.; Zhu, J. Material-structure-performance integrated laser-metal additive manufacturing. Science 2021, 372, eabg1487. [Google Scholar] [CrossRef] [PubMed]
- Yilmaz, O.; Ugla, A.A. Shaped metal deposition technique in additive manufacturing: A review. Proc. Inst. Mech. Eng. Part B J. Eng. Manuf. 2016, 230, 1781–1798. [Google Scholar] [CrossRef]
- Zhang, H.; Xu, J.; Wang, G. Fundamental study on plasma deposition manufacturing. Surf. Coat. Technol. 2003, 171, 112–118. [Google Scholar] [CrossRef]
- Kumar, S.P.; Elangovan, S.; Mohanraj, R.; Narayanan, V.S. Significance of continuous wave and pulsed wave laser in direct metal deposition. Mater. Today Proc. 2021, 46, 8086–8096. [Google Scholar] [CrossRef]
- Dass, A.; Moridi, A. State of the art in directed energy deposition: From additive manufacturing to materials design. Coatings 2019, 9, 418. [Google Scholar] [CrossRef]
- Mazzarisi, M.; Errico, V.; Angelastro, A.; Campanelli, S.L. Influence of standoff distance and laser defocusing distance on direct laser metal deposition of a nickel-based superalloy. Int. J. Adv. Manuf. Technol. 2022, 120, 2407–2428. [Google Scholar] [CrossRef]
- Carrozza, A.; Mazzucato, F.; Aversa, A.; Lombardi, M.; Bondioli, F.; Biamino, S.; Valente, A.; Fino, P. Single scans of Ti-6Al-4V by directed energy deposition: A cost and time effective methodology to assess the proper process window. Met. Mater. Int. 2021, 27, 3590–3602. [Google Scholar] [CrossRef]
- Aversa, A.; Marchese, G.; Bassini, E. Directed energy deposition of aisi 316l stainless steel powder: Effect of process parameters. Metals 2021, 11, 932. [Google Scholar] [CrossRef]
- Liu, M.; Kumar, A.; Bukkapatnam, S.; Kuttolamadom, M. A review of the anomalies in directed energy deposition (DED) processes & potential solutions-Part quality & defects. Procedia Manuf. 2021, 53, 507–518. [Google Scholar]
- Haley, J.C.; Schoenung, J.M.; Lavernia, E.J. Observations of particle-melt pool impact events in directed energy deposition. Addit. Manuf. 2018, 22, 368–374. [Google Scholar] [CrossRef]
- Wei, H.; Mukherjee, T.; Zhang, W.; Zuback, J.; Knapp, G.; De, A.; DebRoy, T. Mechanistic models for additive manufacturing of metallic components. Prog. Mater. Sci. 2021, 116, 100703. [Google Scholar] [CrossRef]
- Bayat, M.; Nadimpalli, V.K.; Biondani, F.G.; Jafarzadeh, S.; Thorborg, J.; Tiedje, N.S.; Bissacco, G.; Pedersen, D.B.; Hattel, J.H. On the role of the powder stream on the heat and fluid flow conditions during directed energy deposition of maraging steel—Multiphysics modeling and experimental validation. Addit. Manuf. 2021, 43, 102021. [Google Scholar] [CrossRef]
- Volkov, A.N.; Zhigilei, L.V. Melt dynamics and melt-through time in continuous wave laser heating of metal films: Contributions of the recoil vapor pressure and Marangoni effects. Int. J. Heat Mass Transf. 2017, 112, 300–317. [Google Scholar] [CrossRef]
- Leung, C.L.A.; Marussi, S.; Atwood, R.C.; Towrie, M.; Withers, P.J.; Lee, P.D. In situ X-ray imaging of defect and molten pool dynamics in laser additive manufacturing. Nat. Commun. 2018, 9, 1355. [Google Scholar] [CrossRef]
- Ki, H.; Mazumder, J.; Mohanty, P.S. Modeling of laser keyhole welding: Part I. Mathematical modeling, numerical methodology, role of recoil pressure, multiple reflections, and free surface evolution. Metall. Mater. Trans. A 2002, 33, 1817–1830. [Google Scholar] [CrossRef]
- Sreekanth, S. Laser-Directed Energy Deposition: Influence of Process Parameters and Heat-Treatments. Ph.D. Dissertation, University West, Trollhättan, Sweden, 2020. [Google Scholar]
- Sampson, R.; Lancaster, R.; Sutcliffe, M.; Carswell, D.; Hauser, C.; Barras, J. The influence of key process parameters on melt pool geometry in direct energy deposition additive manufacturing systems. Opt. Laser Technol. 2021, 134, 106609. [Google Scholar] [CrossRef]
- Bax, B.; Rajput, R.; Kellet, R.; Reisacher, M. Systematic evaluation of process parameter maps for laser cladding and directed energy deposition. Addit. Manuf. 2018, 21, 487–494. [Google Scholar] [CrossRef]
- Pinkerton, A.J. Advances in the modeling of laser direct metal deposition. J. Laser Appl. 2015, 27, S15001. [Google Scholar] [CrossRef]
- Goodarzi, D.M.; Pekkarinen, J.; Salminen, A. Effect of process parameters in laser cladding on substrate melted areas and the substrate melted shape. J. Laser Appl. 2015, 27, S29201. [Google Scholar] [CrossRef]
- Shim, D.-S.; Baek, G.-Y.; Seo, J.-S.; Shin, G.-Y.; Kim, K.-P.; Lee, K.-Y. Effect of layer thickness setting on deposition characteristics in direct energy deposition (DED) process. Opt. Laser Technol. 2016, 86, 69–78. [Google Scholar] [CrossRef]
- Ocylok, S.; Alexeev, E.; Mann, S.; Weisheit, A.; Wissenbach, K.; Kelbassa, I. Correlations of melt pool geometry and process parameters during laser metal deposition by coaxial process monitoring. Phys. Procedia 2014, 56, 228–238. [Google Scholar] [CrossRef]
- Zhang, K.; Liu, W.; Shang, X. Research on the processing experiments of laser metal deposition shaping. Opt. Laser Technol. 2007, 39, 549–557. [Google Scholar] [CrossRef]
- Corbin, D.J.; Nassar, A.R.; Reutzel, E.W.; Beese, A.M.; Kistler, N.A.; Zhong, C.; Biermann, T.; Gasser, A.; Poprawe, R.; Kujanpää, V.P.; et al. Effect of directed energy deposition processing parameters on laser deposited Inconel® 718: External morphology. J. Laser Appl. 2017, 29, 022001. [Google Scholar] [CrossRef]
- Peyre, P.; Aubry, P.; Fabbro, R.; Neveu, R.; Longuet, A. Analytical and numerical modelling of the direct metal deposition laser process. J. Phys. D Appl. Phys. 2008, 41, 025403. [Google Scholar] [CrossRef]
- Pinkerton, A.J.; Li, L. Multiple-layer cladding of stainless steel using a high-powered diode laser: An experimental investigation of the process characteristics and material properties. Thin Solid Film. 2004, 453, 471–476. [Google Scholar] [CrossRef]
- Lee, E.M.; Shin, G.Y.; Yoon, H.S.; Shim, D.S. Study of the effects of process parameters on deposited single track of M4 powder based direct energy deposition. J. Mech. Sci. Technol. 2017, 31, 3411–3418. [Google Scholar] [CrossRef]
- Zardoshtian, A.; Ansari, M.; Esmaeilzadeh, R.; Keshavarzkermani, A.; Jahed, H.; Toyserkani, E. Laser-directed energy deposition of CuCrZr alloy: From statistical process parameter optimization to microstructural analysis. Int. J. Adv. Manuf. Technol. 2023, 126, 4407–4418. [Google Scholar] [CrossRef]
- Gullipalli, C.; Thawari, N.; Chandak, A.; Gupta, T. Statistical analysis of clad geometry in direct energy deposition of inconel 718 single tracks. J. Mater. Eng. Perform. 2022, 31, 6922–6932. [Google Scholar] [CrossRef]
- Saeedi, R.; Razavi, R.S.; Bakhshi, S.R.; Erfanmanesh, M.; Bani, A.A. Optimization and characterization of laser cladding of NiCr and NiCr–TiC composite coatings on AISI 420 stainless steel. Ceram. Int. 2021, 47, 4097–4110. [Google Scholar] [CrossRef]
- Nabhani, M.; Razavi, R.S.; Barekat, M. An empirical-statistical model for laser cladding of Ti-6Al-4V powder on Ti-6Al-4V substrate. Opt. Laser Technol. 2018, 100, 265–271. [Google Scholar] [CrossRef]
- Ansari, M.; Razavi, R.S.; Barekat, M. An empirical-statistical model for coaxial laser cladding of NiCrAlY powder on Inconel 738 superalloy. Opt. Laser Technol. 2016, 86, 136–144. [Google Scholar] [CrossRef]
- Alizadeh-Sh, M.; Marashi, S.P.H.; Ranjbarnodeh, E.; Shoja-Razavi, R.; Oliveira, J.P. Prediction of solidification cracking by an empirical-statistical analysis for laser cladding of Inconel 718 powder on a non-weldable substrate. Opt. Laser Technol. 2020, 128, 106244. [Google Scholar] [CrossRef]
- Svetlizky, D.; Zheng, B.; Steinberg, D.M.; Schoenung, J.M.; Lavernia, E.J.; Eliaz, N. The influence of laser directed energy deposition (DED) processing parameters for Al5083 studied by central composite design. J. Mater. Res. Technol. 2022, 17, 3157–3171. [Google Scholar] [CrossRef]
- Feenstra, D.; Molotnikov, A.; Birbilis, N. Utilisation of artificial neural networks to rationalise processing windows in directed energy deposition applications. Mater. Des. 2021, 198, 109342. [Google Scholar] [CrossRef]
- Sun, Y.; Hao, M. Statistical analysis and optimization of process parameters in Ti6Al4V laser cladding using Nd: YAG laser. Opt. Lasers Eng. 2012, 50, 985–995. [Google Scholar] [CrossRef]
- Sreekanth, S.; Ghassemali, E.; Hurtig, K.; Joshi, S.; Andersson, J. Effect of direct energy deposition process parameters on single-track deposits of alloy 718. Metals 2020, 10, 96. [Google Scholar] [CrossRef]
- Lee, Y.; Nordin, M.; Babu, S.; Farson, D. Influence of fluid convection on weld pool formation in laser cladding. Weld. J. 2014, 93, 292–300. [Google Scholar]
- Srivastava, D.; Chang, I.; Loretto, M. The optimisation of processing parameters and characterisation of microstructure of direct laser fabricated TiAl alloy components. Mater. Des. 2000, 21, 425–433. [Google Scholar] [CrossRef]
- Kono, D.; Yamaguchi, H.; Oda, Y.; Sakai, T. Stabilization of standoff distance by efficient and adaptive updating of layer height command in directed energy deposition. CIRP J. Manuf. Sci. Technol. 2020, 31, 244–250. [Google Scholar] [CrossRef]
- Lin, P.-Y.; Shen, F.-C.; Wu, K.-T.; Hwang, S.-J.; Lee, H.-H. Process optimization for directed energy deposition of SS316L components. Int. J. Adv. Manuf. Technol. 2020, 111, 1387–1400. [Google Scholar] [CrossRef]
- Ermurat, M.; Arslan, M.A.; Erzincanli, F.; Uzman, I. Process parameters investigation of a laser-generated single clad for minimum size using design of experiments. Rapid Prototyp. J. 2013, 19, 452–462. [Google Scholar] [CrossRef]
- Odermatt, A.E.; Dorn, F.; Ventzke, V.; Kashaev, N. Coaxial laser directed energy deposition with wire of thin-walled duplex stainless steel parts: Process discontinuities and their impact on the mechanical properties. CIRP J. Manuf. Sci. Technol. 2022, 37, 443–453. [Google Scholar] [CrossRef]
- Bremer, J.; Walderich, P.; Pirch, N.; Schleifenbaum, J.H.; Gasser, A.; Schopphoven, T. Effects of path accuracy on additively manufactured specimens by laser material deposition using six-axis robots. J. Laser Appl. 2021, 33, 012045. [Google Scholar] [CrossRef]
- Fayazfar, H.; Salarian, M.; Rogalsky, A.; Sarker, D.; Russo, P.; Paserin, V.; Toyserkani, E. A critical review of powder-based additive manufacturing of ferrous alloys: Process parameters, microstructure and mechanical properties. Mater. Des. 2018, 144, 98–128. [Google Scholar] [CrossRef]
- Pinkerton, A. Laser direct metal deposition: Theory and applications in manufacturing and maintenance. In Advances in Laser Materials Processing; Elsevier: Amsterdam, The Netherlands, 2010; pp. 461–491. [Google Scholar]
- Amine, T.; Newkirk, J.W.; Liou, F. Investigation of effect of process parameters on multilayer builds by direct metal deposition. Appl. Therm. Eng. 2014, 73, 500–511. [Google Scholar] [CrossRef]
- Elkington, H. Laser Direct Energy Deposition—The Effect of Process Parameters on Inconel 718; Sheffield Hallam University: Sheffield, UK, 2021. [Google Scholar]
- Thanumoorthy, R.S.; Sekar, P.; Bontha, S.; Balan, A. A study on the effect of process parameters and scan strategies on microstructure and mechanical properties of laser directed energy deposited IN718. J. Mater. Process. Technol. 2023, 319, 118096. [Google Scholar] [CrossRef]
- He, B.; Li, D.; Zhang, A.; Ge, J.; Yang, X.; Hu, X. Influence of scanning pattern on the edge collapse of solid parts in laser metal direct forming. Opt. Laser Technol. 2013, 48, 171–177. [Google Scholar] [CrossRef]
- de Oliveira, U.; Ocelík, V.; De Hosson, J. Analysis of coaxial laser cladding processing conditions. Surf. Coat. Technol. 2005, 197, 127–136. [Google Scholar] [CrossRef]
- Sun, J.; Zhao, Y.; Yang, L.; Zhao, X.; Qu, W.; Yu, T. Effect of shielding gas flow rate on cladding quality of direct laser fabrication AISI 316L stainless steel. J. Manuf. Process. 2019, 48, 51–65. [Google Scholar] [CrossRef]
- Traxel, K.D.; Malihi, D.; Starkey, K.; Bandyopadhyay, A. Model-driven directed-energy-deposition process workflow incorporating powder flowrate as key parameter. Manuf. Lett. 2020, 25, 88–92. [Google Scholar] [CrossRef]
- Mazzarisi, M.; Campanelli, S.L.; Angelastro, A.; Dassisti, M. Phenomenological modelling of direct laser metal deposition for single tracks. Int. J. Adv. Manuf. Technol. 2020, 111, 1955–1970. [Google Scholar] [CrossRef]
- AbouelNour, Y.; Gupta, N. In-situ monitoring of sub-surface and internal defects in additive manufacturing: A review. Mater. Des. 2022, 222, 111063. [Google Scholar] [CrossRef]
- Qin, L.; Wang, K.; Li, X.; Zhou, S.; Yang, G. Review of the formation mechanisms and control methods of geometrical defects in laser deposition manufacturing. Chin. J. Mech. Eng. Addit. Manuf. Front. 2022, 1, 100052. [Google Scholar] [CrossRef]
- Khairallah, S.A.; Anderson, A.T.; Rubenchik, A.; King, W.E. Laser powder-bed fusion additive manufacturing: Physics of complex melt flow and formation mechanisms of pores, spatter, and denudation zones. Acta Mater. 2016, 108, 36–45. [Google Scholar] [CrossRef]
- Kiani, P.; Dupuy, A.D.; Ma, K.; Schoenung, J.M. Directed energy deposition of AlSi10Mg: Single track nonscalability and bulk properties. Mater. Des. 2020, 194, 108847. [Google Scholar] [CrossRef]
- Craig, O.; Bois-Brochu, A.; Plucknett, K. Geometry and surface characteristics of H13 hot-work tool steel manufactured using laser-directed energy deposition. Int. J. Adv. Manuf. Technol. 2021, 116, 699–718. [Google Scholar] [CrossRef]
- Ponche, R.; Kerbrat, O.; Mognol, P.; Hascoet, J.-Y. A novel methodology of design for Additive Manufacturing applied to Additive Laser Manufacturing process. Robot. Comput.-Integr. Manuf. 2014, 30, 389–398. [Google Scholar] [CrossRef]
- Su, Y.; Wang, C.; Xu, X.; Luo, K.; Lu, J. Pore defects and corrosion behavior of AISI 316L stainless steel fabricated by laser directed energy deposition under closed-loop control. Surf. Coat. Technol. 2023, 463, 129527. [Google Scholar] [CrossRef]
- Donadello, S.; Motta, M.; Demir, A.G.; Previtali, B. Monitoring of laser metal deposition height by means of coaxial laser triangulation. Opt. Lasers Eng. 2019, 112, 136–144. [Google Scholar] [CrossRef]
- Ščetinec, A.; Klobčar, D.; Bračun, D. In-process path replanning and online layer height control through deposition arc current for gas metal arc based additive manufacturing. J. Manuf. Process. 2021, 64, 1169–1179. [Google Scholar] [CrossRef]
- Pi, G.; Zhang, A.; Zhu, G.; Li, D.; Lu, B. Research on the forming process of three-dimensional metal parts fabricated by laser direct metal forming. Int. J. Adv. Manuf. Technol. 2011, 57, 841–847. [Google Scholar] [CrossRef]
- Wang, X.; Deng, D.; Hu, Y.; Ning, F.; Wang, H.; Cong, W.; Zhang, H. Overhang structure and accuracy in laser engineered net shaping of Fe-Cr steel. Opt. Laser Technol. 2018, 106, 357–365. [Google Scholar] [CrossRef]
- Yu, R.; Yu, S.; Yu, Z.; Zheng, B. Directed energy deposition-arc of thin-walled aerobat shell with structures of internal ribs and overhanging gaps. Int. J. Adv. Manuf. Technol. 2023, 127, 305–321. [Google Scholar] [CrossRef]
- Jiang, J.; Stringer, J.; Xu, X.; Zhong, R.Y. Investigation of printable threshold overhang angle in extrusion-based additive manufacturing for reducing support waste. Int. J. Comput. Integr. Manuf. 2018, 31, 961–969. [Google Scholar] [CrossRef]
- Kaji, F.; Jinoop, A.N.; Zimny, M.; Frikel, G.; Tam, K.; Toyserkani, E. Process planning for additive manufacturing of geometries with variable overhang angles using a robotic laser directed energy deposition system. Addit. Manuf. Lett. 2022, 2, 100035. [Google Scholar] [CrossRef]
- Rodrigues, T.A.; Duarte, V.; Miranda, R.M.; Santos, T.G.; Oliveira, J.P. Current status and perspectives on wire and arc additive manufacturing (WAAM). Materials 2019, 12, 1121. [Google Scholar] [CrossRef] [PubMed]
- Gruber, S.; Grunert, C.; Riede, M.; Lopez, E.; Marquardt, A.; Brueckner, F.; Leyens, C. Comparison of dimensional accuracy and tolerances of powder bed based and nozzle based additive manufacturing processes. J. Laser Appl. 2020, 32, 032016. [Google Scholar] [CrossRef]
- Wang, Y.; Hu, K.; Li, W.; Wang, L. Prediction of melt pool width and layer height for Laser Directed Energy Deposition enabled by physics-driven temporal convolutional network. J. Manuf. Syst. 2023, 69, 1–17. [Google Scholar] [CrossRef]
- Wang, P.; Tan, X.; He, C.; Nai, M.L.S.; Huang, R.; Tor, S.B.; Wei, J. Scanning optical microscopy for porosity quantification of additively manufactured components. Addit. Manuf. 2018, 21, 350–358. [Google Scholar] [CrossRef]
- Huang, Y.; Wu, D.; Zhao, D.; Niu, F.; Zhang, H.; Yan, S.; Ma, G. Process optimization of melt growth alumina/aluminum titanate composites directed energy deposition: Effects of scanning speed. Addit. Manuf. 2020, 35, 101210. [Google Scholar] [CrossRef]
- Chen, Y.; Clark, S.J.; Sinclair, L.; Leung, C.L.A.; Marussi, S.; Connolley, T.; Atwood, R.C.; Baxter, G.J.; Jones, M.A.; Todd, I.; et al. Synchrotron X-ray imaging of directed energy deposition additive manufacturing of titanium alloy Ti-6242. Addit. Manuf. 2021, 41, 101969. [Google Scholar] [CrossRef]
- Sohn, H.; Liu, P.; Yoon, H.; Yi, K.; Yang, L.; Kim, S. Real-time porosity reduction during metal directed energy deposition using a pulse laser. J. Mater. Sci. Technol. 2022, 116, 214–223. [Google Scholar] [CrossRef]
- Wang, L.; Zhang, Y.; Chia, H.Y.; Yan, W. Mechanism of keyhole pore formation in metal additive manufacturing. npj Comput. Mater. 2022, 8, 22. [Google Scholar] [CrossRef]
- Young, Z.A.; Guo, Q.; Parab, N.D.; Zhao, C.; Qu, M.; Escano, L.; Fezzaa, K.; Everhart, W.; Sun, T.; Chen, L. Types of spatter and their features and formation mechanisms in laser powder bed fusion additive manufacturing process. Addit. Manuf. 2020, 36, 101438. [Google Scholar] [CrossRef]
- Stair, A.J.; Webler, B.A.; Beuth, J.L.; de Boer, M.P. Demonstration and Analysis of Conditions to Obtain a High Strength Inconel 625 to Stainless Steel 304L Interface by Directed Energy Deposition. Metall. Mater. Trans. A 2024, 1–14. [Google Scholar] [CrossRef]
- Mishurova, T.; Evsevleev, S.; Piault, P.; King, A.; Henry, L.; Bruno, G. Understanding the hot isostatic pressing effectiveness of laser powder bed fusion Ti-6Al-4V by in-situ X-ray imaging and diffraction experiments. Sci. Rep. 2023, 13, 18433. [Google Scholar] [CrossRef] [PubMed]
- Wang, D.; Yang, Y.; Liu, Y.; Bai, Y.; Tan, C. Formation Mechanism of Spatter and Its Influence on Mechanical Properties in Process of Laser Powder Bed Fusion. In Laser Powder Bed Fusion of Additive Manufacturing Technology; Springer: Berlin/Heidelberg, Germany, 2023; pp. 135–177. [Google Scholar]
- Wu, D.; Hua, X.; Li, F.; Huang, L. Understanding of spatter formation in fiber laser welding of 5083 aluminum alloy. Int. J. Heat Mass Transf. 2017, 113, 730–740. [Google Scholar] [CrossRef]
- Zhao, C.; Guo, Q.; Li, X.; Parab, N.; Fezzaa, K.; Tan, W.; Chen, L.; Sun, T. Bulk-explosion-induced metal spattering during laser processing. Phys. Rev. X 2019, 9, 021052. [Google Scholar] [CrossRef]
- Qu, M.; Guo, Q.; Escano, L.I.; Nabaa, A.; Hojjatzadeh, S.M.H.; Young, Z.A.; Chen, L. Controlling process instability for defect lean metal additive manufacturing. Nat. Commun. 2022, 13, 1079. [Google Scholar] [CrossRef] [PubMed]
- Prasad, H.S.; Brueckner, F.; Kaplan, A.F. Powder incorporation and spatter formation in high deposition rate blown powder directed energy deposition. Addit. Manuf. 2020, 35, 101413. [Google Scholar] [CrossRef]
- Wolff, S.J.; Wu, H.; Parab, N.; Zhao, C.; Ehmann, K.F.; Sun, T.; Cao, J. In-situ high-speed X-ray imaging of piezo-driven directed energy deposition additive manufacturing. Sci. Rep. 2019, 9, 962. [Google Scholar] [CrossRef]
- Iquebal, A.S.; Yadav, A.; Botcha, B.; Gorthi, R.K.; Bukkapatnam, S. Tracking and quantifying spatter characteristics in a laser directed energy deposition process using Kalman filter. Manuf. Lett. 2022, 33, 692–700. [Google Scholar] [CrossRef]
- Wang, S.; Ning, J.; Zhu, L.; Yang, Z.; Yan, W.; Dun, Y.; Xue, P.; Xu, P.; Bose, S.; Bandyopadhyay, A. Role of porosity defects in metal 3D printing: Formation mechanisms, impacts on properties and mitigation strategies. Mater. Today 2022, 59, 133–160. [Google Scholar] [CrossRef]
- Li, S.; Chen, G.; Katayama, S.; Zhang, Y. Relationship between spatter formation and dynamic molten pool during high-power deep-penetration laser welding. Appl. Surf. Sci. 2014, 303, 481–488. [Google Scholar] [CrossRef]
- Zheng, H.; Li, H.; Lang, L.; Gong, S.; Ge, Y. Effects of scan speed on vapor plume behavior and spatter generation in laser powder bed fusion additive manufacturing. J. Manuf. Process. 2018, 36, 60–67. [Google Scholar] [CrossRef]
- Ly, S.; Rubenchik, A.M.; Khairallah, S.A.; Guss, G.; Matthews, M.J. Metal vapor micro-jet controls material redistribution in laser powder bed fusion additive manufacturing. Sci. Rep. 2017, 7, 4085. [Google Scholar] [CrossRef] [PubMed]
- Liu, Y.; Yang, Y.; Mai, S.; Wang, D.; Song, C. Investigation into spatter behavior during selective laser melting of AISI 316L stainless steel powder. Mater. Des. 2015, 87, 797–806. [Google Scholar] [CrossRef]
- Li, Z.; Li, H.; Yin, J.; Li, Y.; Nie, Z.; Li, X.; You, D.; Guan, K.; Duan, W.; Cao, L.; et al. A review of spatter in laser powder bed fusion additive manufacturing: In situ detection, generation, effects, and countermeasures. Micromachines 2022, 13, 1366. [Google Scholar] [CrossRef] [PubMed]
- Ikeshoji, T.-T.; Yonehara, M.; Kato, C.; Yanaga, Y.; Takeshita, K.; Kyogoku, H. Spattering mechanism of laser powder bed fusion additive manufacturing on heterogeneous surfaces. Sci. Rep. 2022, 12, 20384. [Google Scholar] [CrossRef] [PubMed]
- Nakamura, H.; Kawahito, Y.; Nishimoto, K.; Katayama, S. Elucidation of melt flows and spatter formation mechanisms during high power laser welding of pure titanium. J. Laser Appl. 2015, 27, 032012. [Google Scholar] [CrossRef]
- Repossini, G.; Laguzza, V.; Grasso, M.; Colosimo, B.M. On the use of spatter signature for in-situ monitoring of Laser Powder Bed Fusion. Addit. Manuf. 2017, 16, 35–48. [Google Scholar] [CrossRef]
- Taatali, A.; Sadaoui, S.E.; Louar, M.A.; Mahiddini, B. On-machine dimensional inspection: Machine vision-based approach. Int. J. Adv. Manuf. Technol. 2024, 131, 393–407. [Google Scholar] [CrossRef]
- Leach, R.; Bourell, D.; Carmignato, S.; Donmez, A.; Senin, N.; Dewulf, W. Geometrical metrology for metal additive manufacturing. CIRP Ann. 2019, 68, 677–700. [Google Scholar] [CrossRef]
- Dickins, A.; Widjanarko, T.; Lawes, S.; Leach, R. Design of a multi-sensor in-situ inspection system for additive manufacturing. In ASPE and EUSPEN Summer Topical Meeting on Advancing Precision in Additive Manufacturing; 2018; pp. 152–248. [Google Scholar]
- Leach, R. Integrated metrology 10-year roadmap for advanced manufacturing. In HVM Catapult Coventry; High Value Manufacturing Catapult: Birmingham, UK, 2020; pp. 4–7. [Google Scholar]
- Leach, R.; Carmignato, S. Precision Metal Additive Manufacturing; CRC Press: Boca Raton, FL, USA, 2020. [Google Scholar]
- Lin, X.; Zhu, K.; Fuh, J.Y.H.; Duan, X. Metal-based additive manufacturing condition monitoring methods: From measurement to control. ISA Trans. 2022, 120, 147–166. [Google Scholar] [CrossRef]
- Tang, Z.-J.; Liu, W.-W.; Wang, Y.-W.; Saleheen, K.M.; Liu, Z.-C.; Peng, S.-T.; Zhang, Z.; Zhang, H.-C. A review on in situ monitoring technology for directed energy deposition of metals. Int. J. Adv. Manuf. Technol. 2020, 108, 3437–3463. [Google Scholar] [CrossRef]
- Zhang, P.; Zhou, X.; Ma, H.; Hu, J.; He, Y.; Wang, X.; Duan, Y. Anomaly detection in laser metal deposition with photodiode-based melt pool monitoring system. Opt. Laser Technol. 2021, 144, 107454. [Google Scholar] [CrossRef]
- Park, H.; Rhee, S.; Kim, D. A fuzzy pattern recognition based system for monitoring laser weld quality. Meas. Sci. Technol. 2001, 12, 1318. [Google Scholar] [CrossRef]
- Kanko, J.A.; Sibley, A.P.; Fraser, J.M. In situ morphology-based defect detection of selective laser melting through inline coherent imaging. J. Mater. Process. Technol. 2016, 231, 488–500. [Google Scholar] [CrossRef]
- Souflas, T.; Bikas, H.; Ghassempouri, M.; Salmi, A.; Atzeni, E.; Saboori, A.; Brugnetti, I.; Valente, A.; Mazzucato, F.; Stavropoulos, P. A comparative study of dry and cryogenic milling for Directed Energy Deposited IN718 components: Effect on process and part quality. Int. J. Adv. Manuf. Technol. 2022, 119, 745–758. [Google Scholar] [CrossRef]
- He, W.; Shi, W.; Li, J.; Xie, H. In-situ monitoring and deformation characterization by optical techniques; part I: Laser-aided direct metal deposition for additive manufacturing. Opt. Lasers Eng. 2019, 122, 74–88. [Google Scholar] [CrossRef]
- Zhang, Y.; Shen, S.; Li, H.; Hu, Y. Review of in situ and real-time monitoring of metal additive manufacturing based on image processing. Int. J. Adv. Manuf. Technol. 2022, 123, 1–20. [Google Scholar] [CrossRef]
- Ding, Y.; Dwivedi, R.; Kovacevic, R. Process planning for 8-axis robotized laser-based direct metal deposition system: A case on building revolved part. Robot. Comput.-Integr. Manuf. 2017, 44, 67–76. [Google Scholar] [CrossRef]
- Iravani-Tabrizipour, M.; Toyserkani, E. An image-based feature tracking algorithm for real-time measurement of clad height. Mach. Vis. Appl. 2007, 18, 343–354. [Google Scholar] [CrossRef]
- Naiel, M.A.; Ertay, D.S.; Vlasea, M.; Fieguth, P. Adaptive vision-based detection of laser-material interaction for directed energy deposition. Addit. Manuf. 2020, 36, 101468. [Google Scholar] [CrossRef]
- Perani, M.; Baraldo, S.; Decker, M.; Vandone, A.; Valente, A.; Paoli, B. Track geometry prediction for Laser Metal Deposition based on on-line artificial vision and deep neural networks. Robot. Comput.-Integr. Manuf. 2023, 79, 102445. [Google Scholar] [CrossRef]
- Yang, L.; Sohn, H.; Ma, Z.; Jeon, I.; Liu, P.; Cheng, J.C. Real-time layer height estimation during multi-layer directed energy deposition using domain adaptive neural networks. Comput. Ind. 2023, 148, 103882. [Google Scholar] [CrossRef]
- Hsu, H.-W.; Lo, Y.-L.; Lee, M.-H. Vision-based inspection system for cladding height measurement in Direct Energy Deposition (DED). Addit. Manuf. 2019, 27, 372–378. [Google Scholar] [CrossRef]
- Song, L.; Mazumder, J. Feedback control of melt pool temperature during laser cladding process. IEEE Trans. Control. Syst. Technol. 2010, 19, 1349–1356. [Google Scholar] [CrossRef]
- Farshidianfar, M.H.; Khajepour, A.; Zeinali, M.; Gelrich, A. System identification and height control of laser cladding using adaptive neuro-fuzzy inference systems. In International Congress on Applications of Lasers & Electro-Optics; Laser Institute of America: Orlando, FL, USA, 2013; Volume 2013, pp. 615–623. [Google Scholar]
- Zeinali, M.; Khajepour, A. Height control in laser cladding using adaptive sliding mode technique: Theory and experiment. J. Manuf. Sci. Eng. 2010, 132, 041016. [Google Scholar] [CrossRef]
- Borovkov, H.; de la Yedra, A.G.; Zurutuza, X.; Angulo, X.; Alvarez, P.; Pereira, J.C.; Cortes, F. In-line height measurement technique for directed energy deposition processes. J. Manuf. Mater. Process. 2021, 5, 85. [Google Scholar] [CrossRef]
- Pandiyan, V.; Cui, D.; Le-Quang, T.; Deshpande, P.; Wasmer, K.; Shevchik, S. In situ quality monitoring in direct energy deposition process using co-axial process zone imaging and deep contrastive learning. J. Manuf. Process. 2022, 81, 1064–1075. [Google Scholar] [CrossRef]
- Sun, Z.; Guo, W.; Li, L. In-process measurement of melt pool cross-sectional geometry and grain orientation in a laser directed energy deposition additive manufacturing process. Opt. Laser Technol. 2020, 129, 106280. [Google Scholar] [CrossRef]
- Tang, Z.-J.; Liu, W.-W.; Zhang, N.; Wang, Y.-W.; Zhang, H.-C. Real–time prediction of penetration depths of laser surface melting based on coaxial visual monitoring. Opt. Lasers Eng. 2020, 128, 106034. [Google Scholar] [CrossRef]
- Song, L.; Wang, F.; Li, S.; Han, X. Phase congruency melt pool edge extraction for laser additive manufacturing. J. Mater. Process. Technol. 2017, 250, 261–269. [Google Scholar] [CrossRef]
- Lin, W.; Shen, H.; Fu, J.; Wu, S. Online quality monitoring in material extrusion additive manufacturing processes based on laser scanning technology. Precis. Eng. 2019, 60, 76–84. [Google Scholar] [CrossRef]
- Bacciaglia, A.; Ceruti, A.; Liverani, A. Photogrammetry and additive manufacturing based methodology for decentralized spare Part Production in automotive industry. In Proceedings of the Intelligent Human Systems Integration 2020: Proceedings of the 3rd International Conference on Intelligent Human Systems Integration (IHSI 2020): Integrating People and Intelligent Systems, Modena, Italy, 19–21 February 2020; Springer: Berlin/Heidelberg, Germany, 2020; pp. 796–802. [Google Scholar]
- Ye, Z.; Liu, C.; Kan, C. Stereo vision enabled flexible in-situ process authentication of additive manufacturing. Manuf. Lett. 2023, 35, 1155–1162. [Google Scholar] [CrossRef]
- Li, Z.; Liu, X.; Wen, S.; He, P.; Zhong, K.; Wei, Q.; Shi, Y.; Liu, S. In situ 3D monitoring of geometric signatures in the powder-bed-fusion additive manufacturing process via vision sensing methods. Sensors 2018, 18, 1180. [Google Scholar] [CrossRef]
- Chen, L.; Yao, X.; Xu, P.; Moon, S.K.; Bi, G. Rapid surface defect identification for additive manufacturing with in-situ point cloud processing and machine learning. Virtual Phys. Prototyp. 2021, 16, 50–67. [Google Scholar] [CrossRef]
- Chen, L.; Yao, X.; Xu, P.; Moon, S.K.; Bi, G. Surface monitoring for additive manufacturing with in-situ point cloud processing. In Proceedings of the 2020 6th International Conference on Control, Automation and Robotics (ICCAR), Singapore, 20–23 April 2020; IEEE: Piscataway, NJ, USA, 2020; pp. 196–201. [Google Scholar]
- Heralić, A.; Christiansson, A.-K.; Lennartson, B. Height control of laser metal-wire deposition based on iterative learning control and 3D scanning. Opt. Lasers Eng. 2012, 50, 1230–1241. [Google Scholar] [CrossRef]
- Donadello, S.; Motta, M.; Demir, A.G.; Previtali, B. Coaxial laser triangulation for height monitoring in laser metal deposition. Procedia Cirp 2018, 74, 144–148. [Google Scholar] [CrossRef]
- Ye, Z.; Liu, C.; Tian, W.; Kan, C. In-situ point cloud fusion for layer-wise monitoring of additive manufacturing. J. Manuf. Syst. 2021, 61, 210–222. [Google Scholar] [CrossRef]
- Zhang, X.; Shen, W.; Suresh, V.; Hamilton, J.; Yeh, L.-H.; Jiang, X.; Zhang, Z.; Li, Q.; Li, B.; Rivero, I.V.; et al. In situ monitoring of direct energy deposition via structured light system and its application in remanufacturing industry. Int. J. Adv. Manuf. Technol. 2021, 116, 959–974. [Google Scholar] [CrossRef]
- Wang, R.; Law, A.C.; Garcia, D.; Yang, S.; Kong, Z. Development of structured light 3D-scanner with high spatial resolution and its applications for additive manufacturing quality assurance. Int. J. Adv. Manuf. Technol. 2021, 117, 845–862. [Google Scholar] [CrossRef]
- Stavroulakis, P.I.; Leach, R.K. Invited review article: Review of post-process optical form metrology for industrial-grade metal additive manufactured parts. Rev. Sci. Instrum. 2016, 87, 041101. [Google Scholar] [CrossRef]
- Tootooni, M.S.; Dsouza, A.; Donovan, R.; Rao, P.K.; Kong, Z.; Borgesen, P. Classifying the dimensional variation in additive manufactured parts from laser-scanned three-dimensional point cloud data using machine learning approaches. J. Manuf. Sci. Eng. 2017, 139, 091005. [Google Scholar] [CrossRef]
- Tang, S.; Wang, G.; Zhang, H. In situ 3D monitoring and control of geometric signatures in wire and arc additive manufacturing. Surf. Topogr. Metrol. Prop. 2019, 7, 025013. [Google Scholar] [CrossRef]
- Vavilov, V.; Burleigh, D. Infrared Thermography and Thermal Nondestructive Testing; Springer: Berlin/Heidelberg, Germany, 2020. [Google Scholar]
- Nuñez, L.; Sabharwall, P.; van Rooyen, I.J. In situ embedment of type K sheathed thermocouples with directed energy deposition. Int. J. Adv. Manuf. Technol. 2023, 127, 3611–3623. [Google Scholar] [CrossRef]
- De Baere, D.; Devesse, W.; De Pauw, B.; Smeesters, L.; Thienpont, H.; Guillaume, P. Spectroscopic monitoring and melt pool temperature estimation during the laser metal deposition process. J. Laser Appl. 2016, 28, 022303. [Google Scholar] [CrossRef]
- Hooper, P.A. Melt pool temperature and cooling rates in laser powder bed fusion. Addit. Manuf. 2018, 22, 548–559. [Google Scholar] [CrossRef]
- Zhang, Z.; Liu, Z.; Wu, D. Prediction of melt pool temperature in directed energy deposition using machine learning. Addit. Manuf. 2021, 37, 101692. [Google Scholar] [CrossRef]
- Mazzarisi, M.; Angelastro, A.; Latte, M.; Colucci, T.; Palano, F.; Campanelli, S.L. Thermal monitoring of laser metal deposition strategies using infrared thermography. J. Manuf. Process. 2023, 85, 594–611. [Google Scholar] [CrossRef]
- Nair, A.M.; Muvvala, G.; Sarkar, S.; Nath, A.K. Real-time detection of cooling rate using pyrometers in tandem in laser material processing and directed energy deposition. Mater. Lett. 2020, 277, 128330. [Google Scholar] [CrossRef]
- Miyagi, M.; Tsukamoto, T.; Kawanaka, H. Adaptive shape control of laser-deposited metal structures by adjusting weld pool size. J. Laser Appl. 2014, 26, 032003. [Google Scholar] [CrossRef]
- Zanini, F.; Sbettega, E.; Carmignato, S. X-ray computed tomography for metal additive manufacturing: Challenges and solutions for accuracy enhancement. Procedia Cirp 2018, 75, 114–118. [Google Scholar] [CrossRef]
- du Plessis, A.; Yadroitsava, I.; Yadroitsev, I. Effects of defects on mechanical properties in metal additive manufacturing: A review focusing on X-ray tomography insights. Mater. Des. 2020, 187, 108385. [Google Scholar] [CrossRef]
- Khosravani, M.R.; Reinicke, T. On the use of X-ray computed tomography in assessment of 3D-printed components. J. Nondestruct. Eval. 2020, 39, 75. [Google Scholar] [CrossRef]
- Gobert, C.; Reutzel, E.W.; Petrich, J.; Nassar, A.R.; Phoha, S. Application of supervised machine learning for defect detection during metallic powder bed fusion additive manufacturing using high resolution imaging. Addit. Manuf. 2018, 21, 517–528. [Google Scholar] [CrossRef]
- Snow, Z.; Diehl, B.; Reutzel, E.W.; Nassar, A. Toward in-situ flaw detection in laser powder bed fusion additive manufacturing through layerwise imagery and machine learning. J. Manuf. Syst. 2021, 59, 12–26. [Google Scholar] [CrossRef]
- Forien, J.-B.; Calta, N.P.; DePond, P.J.; Guss, G.M.; Roehling, T.T.; Matthews, M.J. Detecting keyhole pore defects and monitoring process signatures during laser powder bed fusion: A correlation between in situ pyrometry and ex situ X-ray radiography. Addit. Manuf. 2020, 35, 101336. [Google Scholar] [CrossRef]
- Oliveira, J.P.; LaLonde, A.D.; Ma, J. Processing parameters in laser powder bed fusion metal additive manufacturing. Mater. Des. 2020, 193, 108762. [Google Scholar] [CrossRef]
- du Plessis, A.; Yadroitsev, I.; Yadroitsava, I.; Le Roux, S.G. X-ray microcomputed tomography in additive manufacturing: A review of the current technology and applications. 3D Print. Addit. Manuf. 2018, 5, 227–247. [Google Scholar] [CrossRef]
- Warnett, J.M.; Titarenko, V.; Kiraci, E.; Attridge, A.; Lionheart, W.R.B.; Withers, P.J.; A Williams, M. Towards in-process x-ray CT for dimensional metrology. Meas. Sci. Technol. 2016, 27, 035401. [Google Scholar] [CrossRef]
- Davies, S. Nikon Metrology Inspection Technology and Additive Manufacturing Advance Patient-Specific Implants. TCT Magazine 3D Printing & Additive Manufacturing Intelligence. Available online: https://www.tctmagazine.com/additive-manufacturing-3d-printing-news/nikon-metrology-inspection-technology-patient-specific-implants/ (accessed on 12 January 2024).
- Wolff, S.J.; Wang, H.; Gould, B.; Parab, N.; Wu, Z.; Zhao, C.; Greco, A.; Sun, T. In situ X-ray imaging of pore formation mechanisms and dynamics in laser powder-blown directed energy deposition additive manufacturing. Int. J. Mach. Tools Manuf. 2021, 166, 103743. [Google Scholar] [CrossRef]
- Chen, L.; Yao, X.; Tan, C.; He, W.; Su, J.; Weng, F.; Chew, Y.; Ng, N.P.H.; Moon, S.K. In-situ crack and keyhole pore detection in laser directed energy deposition through acoustic signal and deep learning. Addit. Manuf. 2023, 69, 103547. [Google Scholar] [CrossRef]
- Tempelman, J.R.; Wachtor, A.J.; Flynn, E.B.; Depond, P.J.; Forien, J.-B.; Guss, G.M.; Calta, N.P.; Matthews, M.J. Sensor fusion of pyrometry and acoustic measurements for localized keyhole pore identification in laser powder bed fusion. J. Mater. Process. Technol. 2022, 308, 117656. [Google Scholar] [CrossRef]
- Tempelman, J.R.; Wachtor, A.J.; Flynn, E.B.; Depond, P.J.; Forien, J.-B.; Guss, G.M.; Calta, N.P.; Matthews, M.J. Detection of keyhole pore formations in laser powder-bed fusion using acoustic process monitoring measurements. Addit. Manuf. 2022, 55, 102735. [Google Scholar] [CrossRef]
- Plotnikov, Y.; Henkel, D.; Burdick, J.; French, A.; Sions, J.; Bourne, K. Infrared-assisted acoustic emission process monitoring for additive manufacturing. In AIP Conference Proceedings; AIP Publishing: Melville, NY, USA, 2019; Volume 2102. [Google Scholar]
- Hauser, T.; Reisch, R.T.; Kamps, T.; Kaplan, A.F.; Volpp, J. Acoustic emissions in directed energy deposition processes. Int. J. Adv. Manuf. Technol. 2022, 119, 3517–3532. [Google Scholar] [CrossRef]
- Hossain, M.S.; Taheri, H. In situ process monitoring for additive manufacturing through acoustic techniques. J. Mater. Eng. Perform. 2020, 29, 6249–6262. [Google Scholar] [CrossRef]
- Ito, K.; Kusano, M.; Demura, M.; Watanabe, M. Detection and location of microdefects during selective laser melting by wireless acoustic emission measurement. Addit. Manuf. 2021, 40, 101915. [Google Scholar] [CrossRef]
- Ye, D.; Zhang, Y.; Zhu, K.; Hong, G.; YingHsi, J. Characterization of acoustic signals during a direct metal laser sintering process. In Proceedings of the International Conference on Energy Equipment Science and Engineering II, (ICEESE 2016), Guangzhou, China, 12–14 November 2016; CRC Press: Boca Raton, FL, USA, 2017; pp. 1315–1320. [Google Scholar]
- Whiting, J.; Springer, A.; Sciammarella, F. Real-time acoustic emission monitoring of powder mass flow rate for directed energy deposition. Addit. Manuf. 2018, 23, 312–318. [Google Scholar] [CrossRef] [PubMed]
- Shevchik, S.A.; Kenel, C.; Leinenbach, C.; Wasmer, K. Acoustic emission for in situ quality monitoring in additive manufacturing using spectral convolutional neural networks. Addit. Manuf. 2018, 21, 598–604. [Google Scholar] [CrossRef]
- Dryburgh, P.; Pieris, D.; Martina, F.; Patel, R.; Sharples, S.; Li, W.; Clare, A.T.; Williams, S.; Smith, R.J. Spatially resolved acoustic spectroscopy for integrity assessment in wire–arc additive manufacturing. Addit. Manuf. 2019, 28, 236–251. [Google Scholar] [CrossRef]
- Li, S.; Chen, B.; Tan, C.; Song, X. In situ identification of laser directed energy deposition condition based on acoustic emission. Opt. Laser Technol. 2024, 169, 110152. [Google Scholar] [CrossRef]
- Shi, Y.; Zhao, N.; Chen, Y.; Liu, J.; Li, J.; Hou, Z.; Zhou, G. Spectroscopic analysis of Nd/Al co-doped silica glass fabricated by laser additive manufacturing. J. Non-Cryst. Solids 2023, 604, 122139. [Google Scholar] [CrossRef]
- Huang, Y.; Zhang, F.; Yuan, J.; Jia, C.; Ren, X.; Yang, L. Investigation on surface morphology and microstructure of double-wire+ arc additive manufactured aluminum alloys based on spectral analysis. J. Manuf. Process. 2022, 84, 639–651. [Google Scholar] [CrossRef]
- Lough, C.S.; Escano, L.; Qu, M.; Smith, C.C.; Landers, R.G.; Bristow, D.A.; Chen, L.; Kinzel, E.C. In-situ optical emission spectroscopy of selective laser melting. J. Manuf. Process. 2020, 53, 336–341. [Google Scholar] [CrossRef]
- Liu, S.; Liu, W.; Harooni, M.; Ma, J.; Kovacevic, R. Real-time monitoring of laser hot-wire cladding of Inconel 625. Opt. Laser Technol. 2014, 62, 124–134. [Google Scholar] [CrossRef]
- Montazeri, M.; Nassar, A.R.; Dunbar, A.J.; Rao, P. In-process monitoring of porosity in additive manufacturing using optical emission spectroscopy. IISE Trans. 2020, 52, 500–515. [Google Scholar] [CrossRef]
- Lison, M.; Devesse, W.; de Baere, D.; Hinderdael, M.; Guillaume, P. Hyperspectral and thermal temperature estimation during laser cladding. J. Laser Appl. 2019, 31, 022313. [Google Scholar] [CrossRef]
- Gerdes, N.; Hoff, C.; Hermsdorf, J.; Kaierle, S.; Overmeyer, L. Hyperspectral imaging for prediction of surface roughness in laser powder bed fusion. Int. J. Adv. Manuf. Technol. 2021, 115, 1249–1258. [Google Scholar] [CrossRef]
- Gao, X.; Chen, Y. Detection of micro gap weld using magneto-optical imaging during laser welding. Int. J. Adv. Manuf. Technol. 2014, 73, 23–33. [Google Scholar] [CrossRef]
- Ning, J.; Zhao, Y.; Zhu, L.; Yang, C.; Yu, M.; Yang, Z.; Qin, S.; Jiang, Z.; Xu, L.; Li, J.; et al. Height consistency compensation in laser-directed energy deposition of thin-walled parts. Int. J. Mech. Sci. 2024, 266, 108963. [Google Scholar] [CrossRef]
- Li, B.; Zhang, Y.; Lei, Y.; Wei, H.; Chen, C.; Liu, F.; Zhao, P.; Wang, K. A single-sensor multi-scale quality monitoring methodology for laser-directed energy deposition: Example with height instability and porosity monitoring in additive manufacturing of ceramic thin-walled parts. Addit. Manuf. 2024, 79, 103923. [Google Scholar] [CrossRef]
- Slodczyk, M.; Ilin, A.; Kiedrowski, T.; Bareth, T.; Ploshikhin, V. Spatter reduction by multi-beam illumination in laser powder-bed fusion. Mater. Des. 2021, 212, 110206. [Google Scholar] [CrossRef]
- Rezaeifar, H.; Elbestawi, M. Minimizing the surface roughness in L-PBF additive manufacturing process using a combined feedforward plus feedback control system. Int. J. Adv. Manuf. Technol. 2022, 121, 7811–7831. [Google Scholar] [CrossRef]
- Zhang, Y.; Fuh, J.Y.; Ye, D.; Hong, G.S. In-situ monitoring of laser-based PBF via off-axis vision and image processing approaches. Addit. Manuf. 2019, 25, 263–274. [Google Scholar] [CrossRef]
- Feng, W.; Mao, Z.; Yang, Y.; Ma, H.; Zhao, K.; Qi, C.; Hao, C.; Liu, Z.; Xie, H.; Liu, S. Online defect detection method and system based on similarity of the temperature field in the melt pool. Addit. Manuf. 2022, 54, 102760. [Google Scholar] [CrossRef]
- Yan, H.; Grasso, M.; Paynabar, K.; Colosimo, B.M. Real-time detection of clustered events in video-imaging data with applications to additive manufacturing. IISE Trans. 2022, 54, 464–480. [Google Scholar] [CrossRef]
- Wu, Z.; Xu, Z.; Fan, W. Online detection of powder spatters in the additive manufacturing process. Measurement 2022, 194, 111040. [Google Scholar] [CrossRef]
- Cannizzaro, D.; Varrella, A.G.; Paradiso, S.; Sampieri, R.; Macii, E.; Patti, E.; Di Cataldo, S. Image analytics and machine learning for in-situ defects detection in Additive Manufacturing. In Proceedings of the 2021 Design, Automation & Test in Europe Conference & Exhibition (DATE), Grenoble, France, 1–5 February 2021; IEEE: Piscataway, NJ, USA, 2021; pp. 603–608. [Google Scholar]
- Kalami, H.; Urbanic, J. Exploration of surface roughness measurement solutions for additive manufactured components built by multi-axis tool paths. Addit. Manuf. 2021, 38, 101822. [Google Scholar] [CrossRef]
- Lyu, J.; Manoochehri, S. Online convolutional neural network-based anomaly detection and quality control for fused filament fabrication process. Virtual Phys. Prototyp. 2021, 16, 160–177. [Google Scholar] [CrossRef]
- Akhavan, J.; Lyu, J.; Manoochehri, S. A deep learning solution for real-time quality assessment and control in additive manufacturing using point cloud data. J. Intell. Manuf. 2023, 35, 1389–1406. [Google Scholar] [CrossRef]
- Wang, M.; Zhang, Q.; Li, Q.; Wu, Z.; Chen, C.; Xu, J.; Xue, J. Research on morphology detection of metal additive manufacturing process based on fringe projection and binocular vision. Appl. Sci. 2022, 12, 9232. [Google Scholar] [CrossRef]
- Chen, Y.; Jiang, L.; Peng, Y.; Wang, M.; Xue, Z.; Wu, J.; Yang, Y.; Zhang, J. Ultra-fast laser ultrasonic imaging method for online inspection of metal additive manufacturing. Opt. Lasers Eng. 2023, 160, 107244. [Google Scholar] [CrossRef]
- Binega, E.; Yang, L.; Sohn, H.; Cheng, J.C. Online geometry monitoring during directed energy deposition additive manufacturing using laser line scanning. Precis. Eng. 2022, 73, 104–114. [Google Scholar] [CrossRef]
- Agrahari, S.; Singh, A.K. Concept drift detection in data stream mining: A literature review. J. King Saud Univ.-Comput. Inf. Sci. 2022, 34, 9523–9540. [Google Scholar] [CrossRef]
- Baena-Garcıa, M.; del Campo-Ávila, J.; Fidalgo, R.; Bifet, A.; Gavalda, R.; Morales-Bueno, R. Early drift detection method. In Fourth International Workshop on Knowledge Discovery from Data Streams; Citeseer: Princeton, NJ, USA, 2006; Volume 6, pp. 77–86. [Google Scholar]
- Mouss, H.; Mouss, D.; Mouss, N.; Sefouhi, L. Test of page-hinckley, an approach for fault detection in an agro-alimentary production system. In Proceedings of the 2004 5th Asian Control Conference (IEEE Cat. No. 04EX904), Melbourne, Australia, 20–23 July 2004; IEEE: Piscataway, NJ, USA, 2004; Volume 2, pp. 815–818. [Google Scholar]
- Vallim, R.M.; De Mello, R.F. Proposal of a new stability concept to detect changes in unsupervised data streams. Expert Syst. Appl. 2014, 41, 7350–7360. [Google Scholar] [CrossRef]
- Siffer, A.; Fouque, P.-A.; Termier, A.; Largouet, C. Anomaly detection in streams with extreme value theory. In Proceedings of the 23rd ACM SIGKDD International Conference on Knowledge Discovery and Data Mining, Halifax, NS, Canada, 13–17 August 2017; pp. 1067–1075. [Google Scholar]
- Imran, M.M.; Jung, G.; Kim, Y.; Abas, P.E.; De Silva, L.C.; Kim, Y.B. A computational method for improving the data acquisition process in the Laser Metal Deposition. In Proceedings of the 2023 57th Annual Conference on Information Sciences and Systems (CISS), Baltimore, MD, USA, 22–24 March 2023; IEEE: Piscataway, NJ, USA; pp. 1–6. [Google Scholar]
- Mu’az Imran, M.; Jung, G.; Kim, Y.; Chandratilak De Silva, L.; Che Idris, A.; Abas, P.E.; Kim, Y.B. Detection of spatter signature for streaming data in the laser metal deposition process. Int. J. Comput. Digit. Syst. 2023, 14, 1–15. [Google Scholar]
- Lee, E.T.; Fan, Z.; Sencer, B. A new approach to detect surface defects from 3D point cloud data with surface normal Gabor filter (SNGF). J. Manuf. Process. 2023, 92, 196–205. [Google Scholar] [CrossRef]
- Rusu, R.B.; Cousins, S. 3d is here: Point cloud library (pcl). In Proceedings of the 2011 IEEE International Conference on Robotics and Automation, Shanghai, China, 9–13 May 2011; IEEE: Piscataway, NJ, USA; pp. 1–4. [Google Scholar]
- Schnabel, R.; Wahl, R.; Klein, R. Efficient RANSAC for point-cloud shape detection. In Computer Graphics Forum; Wiley Online Library: Hoboken, NJ, USA, 2007; Volume 26, pp. 214–226. [Google Scholar]
- Ye, Z.; Liu, C.; Tian, W.; Kan, C. A deep learning approach for the identification of small process shifts in additive manufacturing using 3D point clouds. Procedia Manuf. 2020, 48, 770–775. [Google Scholar] [CrossRef]
- Petrich, J.; Snow, Z.; Corbin, D.; Reutzel, E.W. Multi-modal sensor fusion with machine learning for data-driven process monitoring for additive manufacturing. Addit. Manuf. 2021, 48, 102364. [Google Scholar] [CrossRef]
- Gronle, M.; Grasso, M.; Granito, E.; Schaal, F.; Colosimo, B.M. Open data for open science in Industry 4.0: In-situ monitoring of quality in additive manufacturing. J. Qual. Technol. 2023, 55, 253–265. [Google Scholar] [CrossRef]
- Garmendia, I.; Leunda, J.; Pujana, J.; Lamikiz, A. In-process height control during laser metal deposition based on structured light 3D scanning. Procedia Cirp 2018, 68, 375–380. [Google Scholar] [CrossRef]
- Bernhard, R.; Neef, P.; Wiche, H.; Hoff, C.; Hermsdorf, J.; Kaierle, S.; Wesling, V. Defect detection in additive manufacturing via a toolpath overlaid melt-pool-temperature tomography. J. Laser Appl. 2020, 32, 022055. [Google Scholar] [CrossRef]
- Kahl, M.; Schramm, S.; Neumann, M.; Kroll, A. Identification of a spatio-temporal temperature model for laser metal deposition. Metals 2021, 11, 2050. [Google Scholar] [CrossRef]
- Seifi, S.H.; Tian, W.; Doude, H.; Tschopp, M.A.; Bian, L. Layer-wise modeling and anomaly detection for laser-based additive manufacturing. J. Manuf. Sci. Eng. 2019, 141, 081013. [Google Scholar] [CrossRef]
- Colosimo, B.M.; Grasso, M. Spatially weighted PCA for monitoring video image data with application to additive manufacturing. J. Qual. Technol. 2018, 50, 391–417. [Google Scholar] [CrossRef]
- Yang, Z.; Lu, Y.; Yeung, H.; Krishnamurty, S. From scan strategy to melt pool prediction: A neighboring-effect modeling method. J. Comput. Inf. Sci. Eng. 2020, 20, 051001. [Google Scholar] [CrossRef]
- Yang, H.; Zhang, S.; Lu, Y.; Witherell, P.; Kumara, S. Spatiotemporal monitoring of melt-pool variations in metal-based additive manufacturing. IEEE Robot. Autom. Lett. 2022, 7, 8249–8256. [Google Scholar] [CrossRef]
- Imran, M.M.; Kim, Y.; Jung, G.; De Silva, L.C.; Suh, J.-H.; Abas, P.E.; Kim, Y.B. In-Situ Process Monitoring and Defects Detection Based on Geometrical Topography With Streaming Point Cloud Processing in Directed Energy Deposition. IEEE Access 2023, 11, 131319–131337. [Google Scholar] [CrossRef]
- Khanzadeh, M.; Tian, W.; Yadollahi, A.; Doude, H.R.; Tschopp, M.A.; Bian, L. Dual process monitoring of metal-based additive manufacturing using tensor decomposition of thermal image streams. Addit. Manuf. 2018, 23, 443–456. [Google Scholar] [CrossRef]
- Guerra, M.G.; Errico, V.; Fusco, A.; Lavecchia, F.; Campanelli, S.L.; Galantucci, L.M. High resolution-optical tomography for in-process layerwise monitoring of a laser-powder bed fusion technology. Addit. Manuf. 2022, 55, 102850. [Google Scholar] [CrossRef]
- Yang, L.; Lo, L.; Ding, S.; Ozel, T. Monitoring and detection of meltpool and spatter regions in laser powder bed fusion of super alloy Inconel 625. Prog. Addit. Manuf. 2020, 5, 367–378. [Google Scholar] [CrossRef]
- Ertay, D.S.; Naiel, M.A.; Vlasea, M.; Fieguth, P. Process performance evaluation and classification via in-situ melt pool monitoring in directed energy deposition. CIRP J. Manuf. Sci. Technol. 2021, 35, 298–314. [Google Scholar] [CrossRef]
- Estalaki, S.M.; Lough, C.S.; Landers, R.G.; Kinzel, E.C.; Luo, T. Predicting defects in laser powder bed fusion using in-situ thermal imaging data and machine learning. Addit. Manuf. 2022, 58, 103008. [Google Scholar] [CrossRef]
- Guan, X.; Zhao, Y.F. Modeling of the laser powder–based directed energy deposition process for additive manufacturing: A review. Int. J. Adv. Manuf. Technol. 2020, 107, 1959–1982. [Google Scholar] [CrossRef]
- Ansari, M.; Martinez-Marchese, A.; Huang, Y.; Toyserkani, E. A mathematical model of laser directed energy deposition for process mapping and geometry prediction of Ti-5553 single-tracks. Materialia 2020, 12, 100710. [Google Scholar] [CrossRef]
- De La Batut, B.; Fergani, O.; Brotan, V.; Bambach, M.; El Mansouri, M. Analytical and numerical temperature prediction in direct metal deposition of Ti6Al4V. J. Manuf. Mater. Process. 2017, 1, 3. [Google Scholar] [CrossRef]
- Picasso, M.; Marsden, C.F.; Wagniere, J.D.; Frenk, A.; Rappaz, M. A simple but realistic model for laser cladding. Metall. Mater. Trans. B 1994, 25, 281–291. [Google Scholar] [CrossRef]
- Huang, Y.; Khamesee, M.B.; Toyserkani, E. A comprehensive analytical model for laser powder-fed additive manufacturing. Addit. Manuf. 2016, 12, 90–99. [Google Scholar] [CrossRef]
- Ansari, M.; Khamooshi, M.; Huang, Y.; Toyserkani, E. Analytical solutions for rapid prediction of transient temperature field in powder-fed laser directed energy deposition based on different heat source models. Appl. Phys. A 2021, 127, 445. [Google Scholar] [CrossRef]
- Huang, Y.; Khamesee, M.B.; Toyserkani, E. A new physics-based model for laser directed energy deposition (powder-fed additive manufacturing): From single-track to multi-track and multi-layer. Opt. Laser Technol. 2019, 109, 584–599. [Google Scholar] [CrossRef]
- Mozaffar, M.; Paul, A.; Al-Bahrani, R.; Wolff, S.; Choudhary, A.; Agrawal, A.; Ehmann, K.; Cao, J. Data-driven prediction of the high-dimensional thermal history in directed energy deposition processes via recurrent neural networks. Manuf. Lett. 2018, 18, 35–39. [Google Scholar] [CrossRef]
- Nalajam, P.K.; Varadarajan, R. A hybrid deep learning model for layer-wise melt pool temperature forecasting in wire-arc additive manufacturing process. IEEE Access 2021, 9, 100652–100664. [Google Scholar] [CrossRef]
- Marko, A.; Bähring, S.; Raute, J.; Biegler, M.; Rethmeier, M. Quality Prediction in Directed Energy Deposition Using Artificial Neural Networks Based on Process Signals. Appl. Sci. 2022, 12, 3955. [Google Scholar] [CrossRef]
- Zhu, Z.; Ferreira, K.; Anwer, N.; Mathieu, L.; Guo, K.; Qiao, L. Convolutional neural network for geometric deviation prediction in additive manufacturing. Procedia Cirp 2020, 91, 534–539. [Google Scholar] [CrossRef]
- DebRoy, T.; Zhang, W.; Turner, J.; Babu, S.S. Building digital twins of 3D printing machines. Scr. Mater. 2017, 135, 119–124. [Google Scholar] [CrossRef]
- Knapp, G.L.; Mukherjee, T.; Zuback, J.S.; Wei, H.L.; Palmer, T.A.; De, A.; DebRoy, T. Building blocks for a digital twin of additive manufacturing. Acta Mater. 2017, 135, 390–399. [Google Scholar] [CrossRef]
- Hartmann, S.; Murua, O.; Arrizubieta, J.I.; Lamikiz, A.; Mayr, P. Digital Twin of the laser-DED process based on a multiscale approach. Simul. Model. Pract. Theory 2024, 132, 102881. [Google Scholar] [CrossRef]
- Sharma, S.; Joshi, S.S.; Pantawane, M.V.; Radhakrishnan, M.; Mazumder, S.; Dahotre, N.B. Multiphysics multi-scale computational framework for linking process–structure–property relationships in metal additive manufacturing: A critical review. Int. Mater. Rev. 2023, 68, 943–1009. [Google Scholar] [CrossRef]
- Khairallah, S.A.; Chin, E.B.; Juhasz, M.J.; Dayton, A.L.; Capps, A.; Tsuji, P.H.; Bertsch, K.M.; Perron, A.; Mccall, S.K.; Mckeown, J.T. High fidelity model of directed energy deposition: Laser-powder-melt pool interaction and effect of laser beam profile on solidification microstructure. Addit. Manuf. 2023, 73, 103684. [Google Scholar] [CrossRef]
- Chen, L.; Bi, G.; Yao, X.; Tan, C.; Su, J.; Ng, N.P.H.; Chew, Y.; Liu, K.; Moon, S.K. Multisensor fusion-based digital twin for localized quality prediction in robotic laser-directed energy deposition. Robot. Comput.-Integr. Manuf. 2023, 84, 102581. [Google Scholar] [CrossRef]
- Regulin, D.; Barucci, R. A benchmark of approaches for closed loop control of melt pool shape in DED. Int. J. Adv. Manuf. Technol. 2023, 126, 829–843. [Google Scholar] [CrossRef]
- Gawade, V.; Singh, V. Leveraging simulated and empirical data-driven insight to supervised-learning for porosity prediction in laser metal deposition. J. Manuf. Syst. 2022, 62, 875–885. [Google Scholar] [CrossRef]
- Dharmadhikari, S.; Menon, N.; Basak, A. A reinforcement learning approach for process parameter optimization in additive manufacturing. Addit. Manuf. 2023, 71, 103556. [Google Scholar] [CrossRef]
Disclaimer/Publisher’s Note: The statements, opinions and data contained in all publications are solely those of the individual author(s) and contributor(s) and not of MDPI and/or the editor(s). MDPI and/or the editor(s) disclaim responsibility for any injury to people or property resulting from any ideas, methods, instructions or products referred to in the content. |
© 2024 by the authors. Licensee MDPI, Basel, Switzerland. This article is an open access article distributed under the terms and conditions of the Creative Commons Attribution (CC BY) license (https://creativecommons.org/licenses/by/4.0/).