Investigating the Impact of Mental Stress on Electrocardiological Signals through the Use of Virtual Reality


Abstract
:1. Introduction
2. Materials and Methods
2.1. Types of Virtual Reality
- Immersive VR: This form of virtual reality offers complete user immersion in the virtual world. This is achieved through special devices such as helmets that cover the user’s entire field of vision and often include sound sensors to enhance the sense of realism. As a result, the user can experience being in a virtual environment and interact with it in a way that resembles the real world. Immersive virtual reality provides an opportunity to simulate different scenarios and experience situations that may be difficult or dangerous to experience in the real world [28,29].
- Non-immersive VR: This type of virtual reality provides an interactive experience without special VR helmets or equipment for total immersion. This technology uses anaglyph glasses, which are popular for watching 3D movies and TV at home, offering a convenient and affordable way to experience the three-dimensional experience without the need for complex electronics or additional power supply. The screen that displays the 3D content sends two different pictures or video frames, one to the left eye and one to the right eye, and these images are polarized differently. Anaglyph glasses consist of two filters: one in red (often with colour filtration) and one in blue. This type of glasses allows the viewer to see different images with both eyes, which merge into a three-dimensional perception of the scene. The principle of operation of 3D glasses and helmets is based on human eyes seeing each image from a different angle. Thus, by using the filtering lenses, the images are split and intersected, creating the illusion of three-dimensionality [30,31].
2.2. The Relationship between the Autonomic Nervous System, Heart Rate Variability, and Stress
2.3. Methods for Heart Rate Variability Analysis
2.3.1. Time-Domain Analysis
- MeanRR: This is the average time between successive R peaks in the ECG. This parameter can help estimate the average heart rate and its changes over time.
- SDNN (Standard Deviation of NN intervals)—This parameter shows the variation in normal RR intervals (NN intervals) compared to their mean value. A more significant standard deviation may indicate higher heart rate variability.
- RMSSD (Root Mean Square of Successive Differences): This parameter represents the square root of the arithmetic mean of squares of the differences between successive normal RR intervals. Higher values of RMSSD usually indicate increased heart activity.
- pNN50%: This is the percentage of all normal RR intervals that differ by more than 50 ms.
- TINN (triangular interpolation of NN intervals): This parameter shows the distribution of intervals that is approximated to a triangle.
- HRVti: This parameter measures the number of variations in the time series of the normal RR intervals.
2.3.2. Frequency Domain Analysis
2.3.3. Non-Linear Methods
- Rescaled Range (R/S) Method
- If H = 0.5, there are no long-term correlations;
- If H < 0.5, this indicates anti-persistence and shows that the high values tend to be followed by low values and vice versa;
- If H > 0.5, this indicates persistence and shows a long-term relationship where high values tend to be followed by highs and low values by lows.
- Poincaré Plot
- Recurrence Plot and Recurrence Quantification Analysis
- Recurrence Rate or Recurrence Count (REC%): The percentage of recurrent points in RP. A high REC may indicate high heart rate variability and good autonomic regulation.
- Determinism (DET%): The percentage of the recurring points that are part of the diagonal lines. A high DET indicates high predictability and regularity in the heart rhythm.
- Entropy (ENTR): A measure of the complexity of diagonal lines. A high ENTR value indicates complex and unpredictable dynamics of the studied time series.
- Entropy Methods
2.4. Statistical Analysis
2.5. Data
3. Results and Discussion
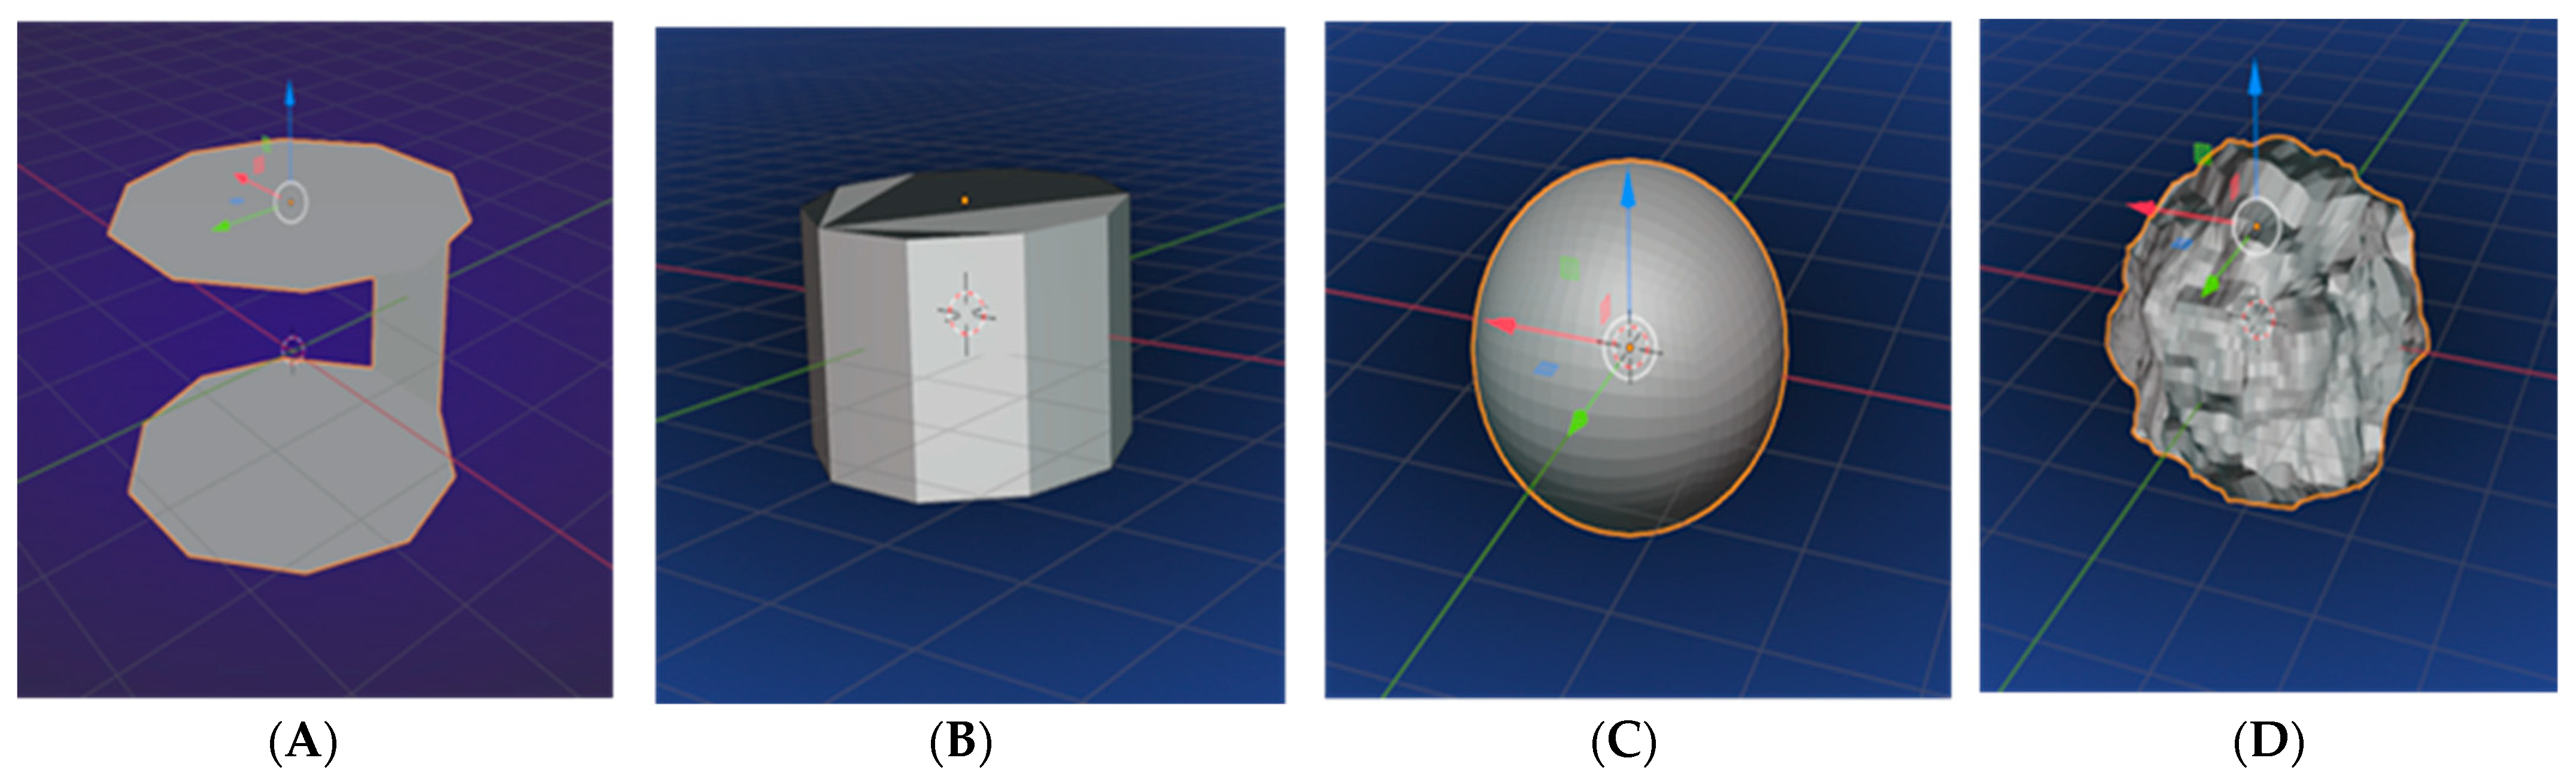
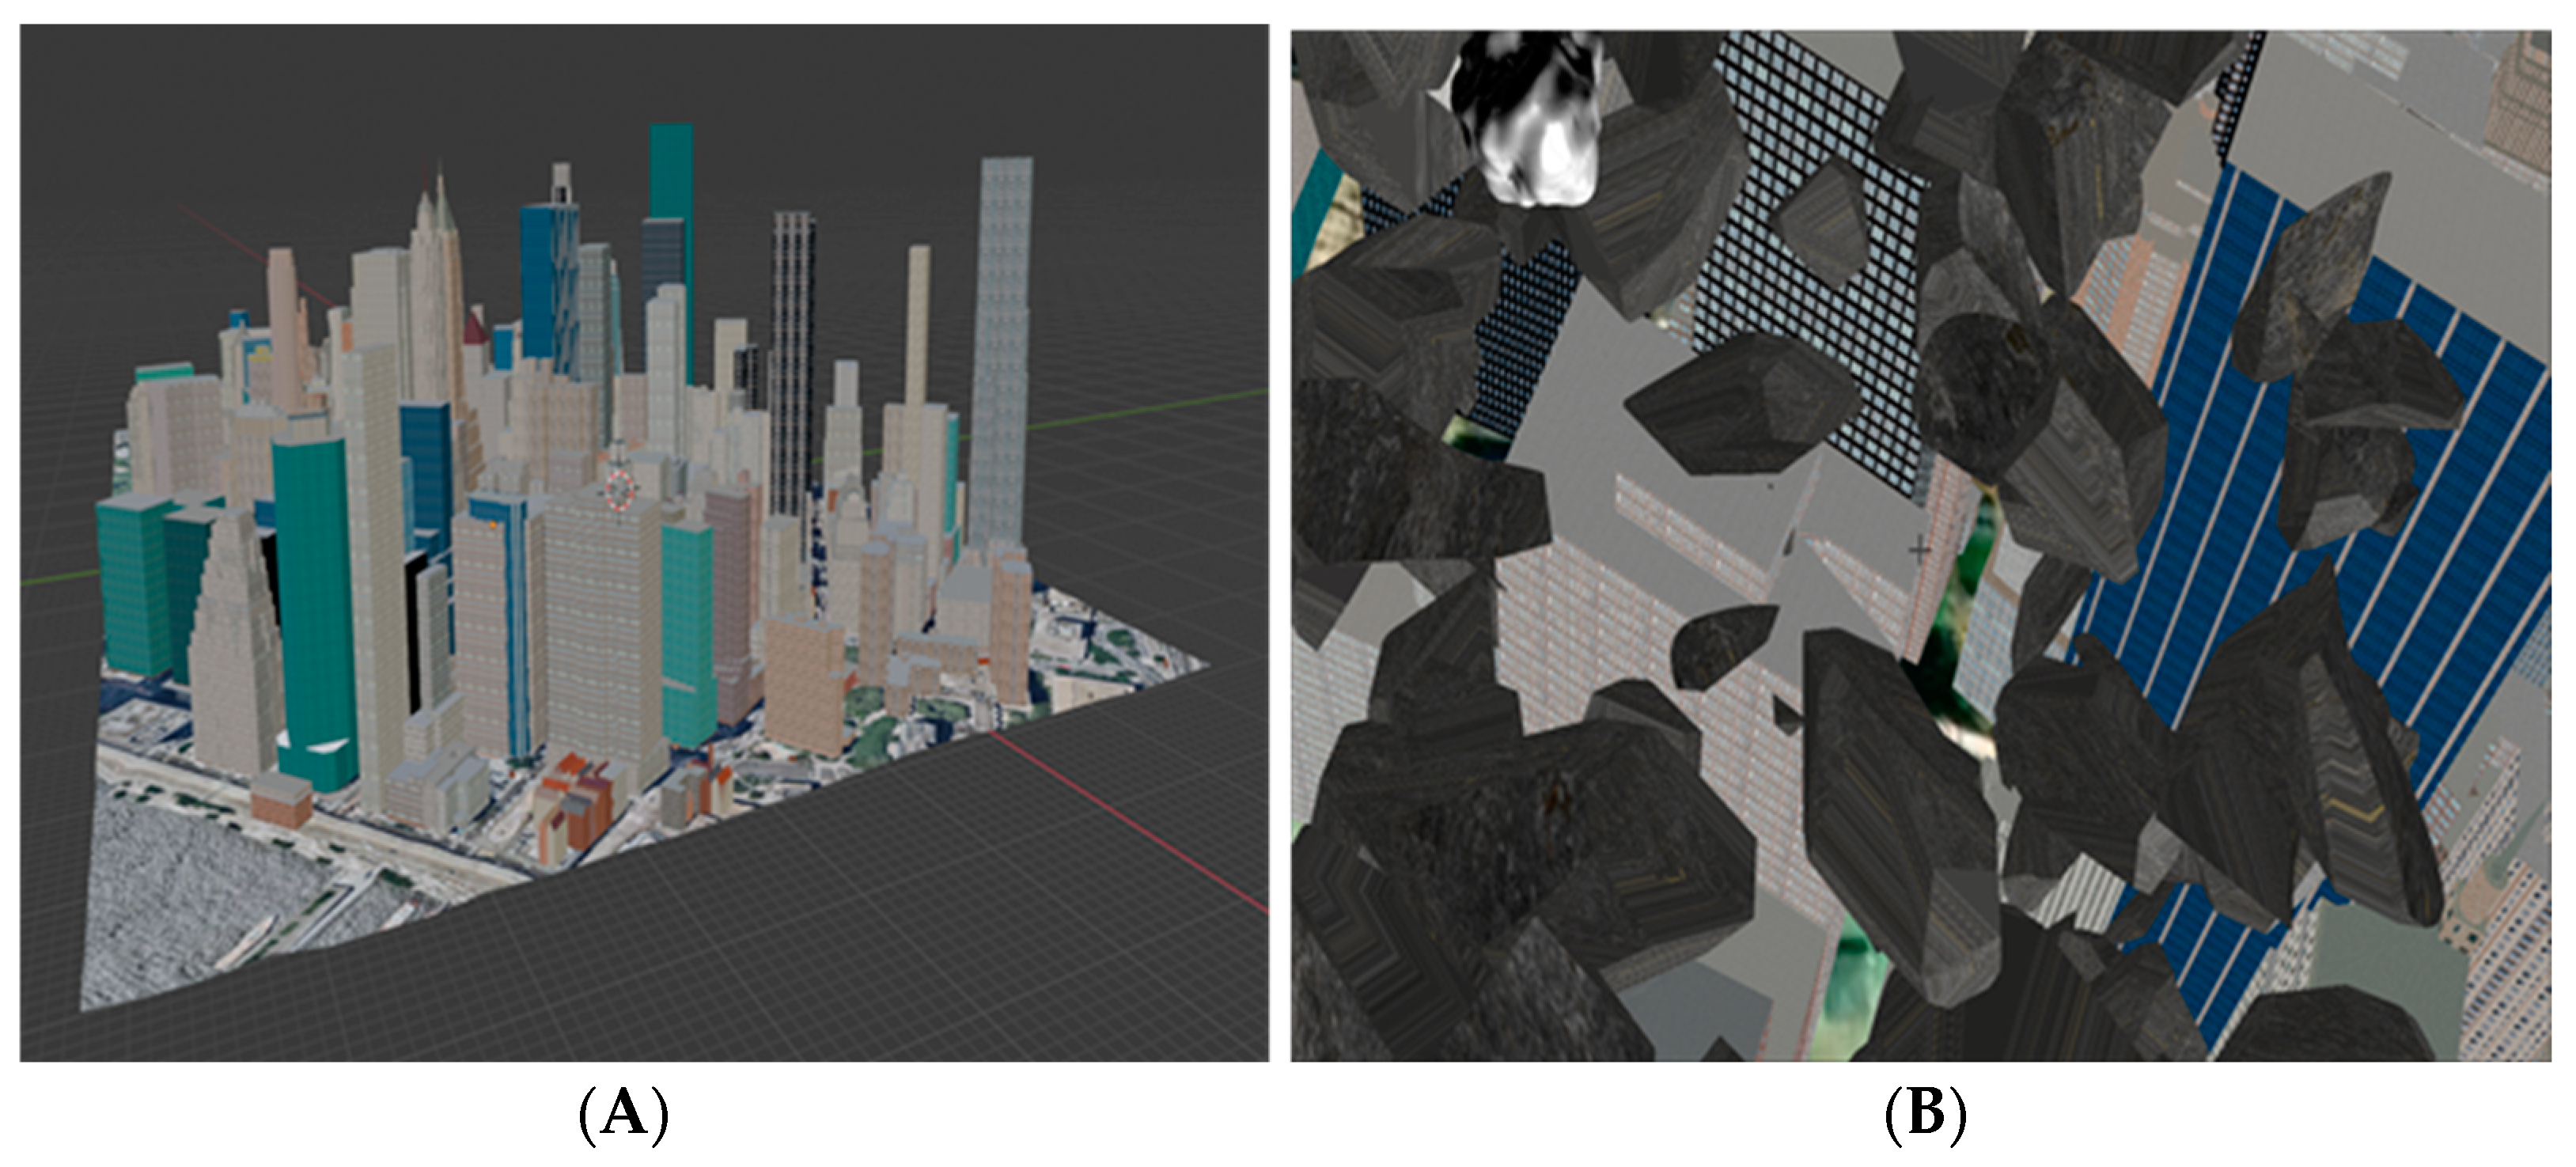
3.1. Three-Dimensional Extreme Game
- Morphism—the animation of objects from the game, the explosion of asteroids, as well as their scattering are realized by using this technique, which allows the transition from one form of the object to another. A weapon was added to the app’s camera to shoot asteroids.
- Translation, rotation, and spline curves are three ways to drive the app’s camera. The most suitable is the use of a spline curve because it can be used to realize both rectilinear and curvilinear movements.
- Collision detection and sound effects are applied when the asteroids explode.
- The main features of the game are as follows:
- It simulates a stressful situation;
- The game can be played with varying degrees of extremity, resulting in asteroids falling from space to earth at varying speeds and rotations;
- The number of asteroids hit and the duration of the game are displayed.
3.2. Analysis of HRV
3.2.1. Linear Analysis of HRV
- The values of statistical parameters in the time domain, such as MeanRR, SDNN, RMSSD, and pNN50%, decreased in both groups, reporting the stress (Group 2 and Group 3), indicating a dominance of the sympathetic nervous system and reduced parasympathetic activity. Group 1, showing the pregame data, had higher values for these parameters, and therefore, their HRV was higher, which is an indicator of a good balance between sympathetic and parasympathetic activity. From the obtained results, it follows that the statistical parameters are sensitive to the changes caused by the generated stress with the proposed 3D extreme game, and the game can be used to monitor and evaluate the impact of stress on the HRV and ANS of the human organism. Similar results were reported in [36].
- Geometric parameters, such as TINN and HRVti, also provide information about the autonomic nervous system and its response to stress. These parameters are based on the representation of intervals between heartbeats (RR intervals). Higher values of these two parameters at rest indicate greater heart rate variability and better autonomic nervous system function. A decrease in their values is an indicator of the presence of stress.
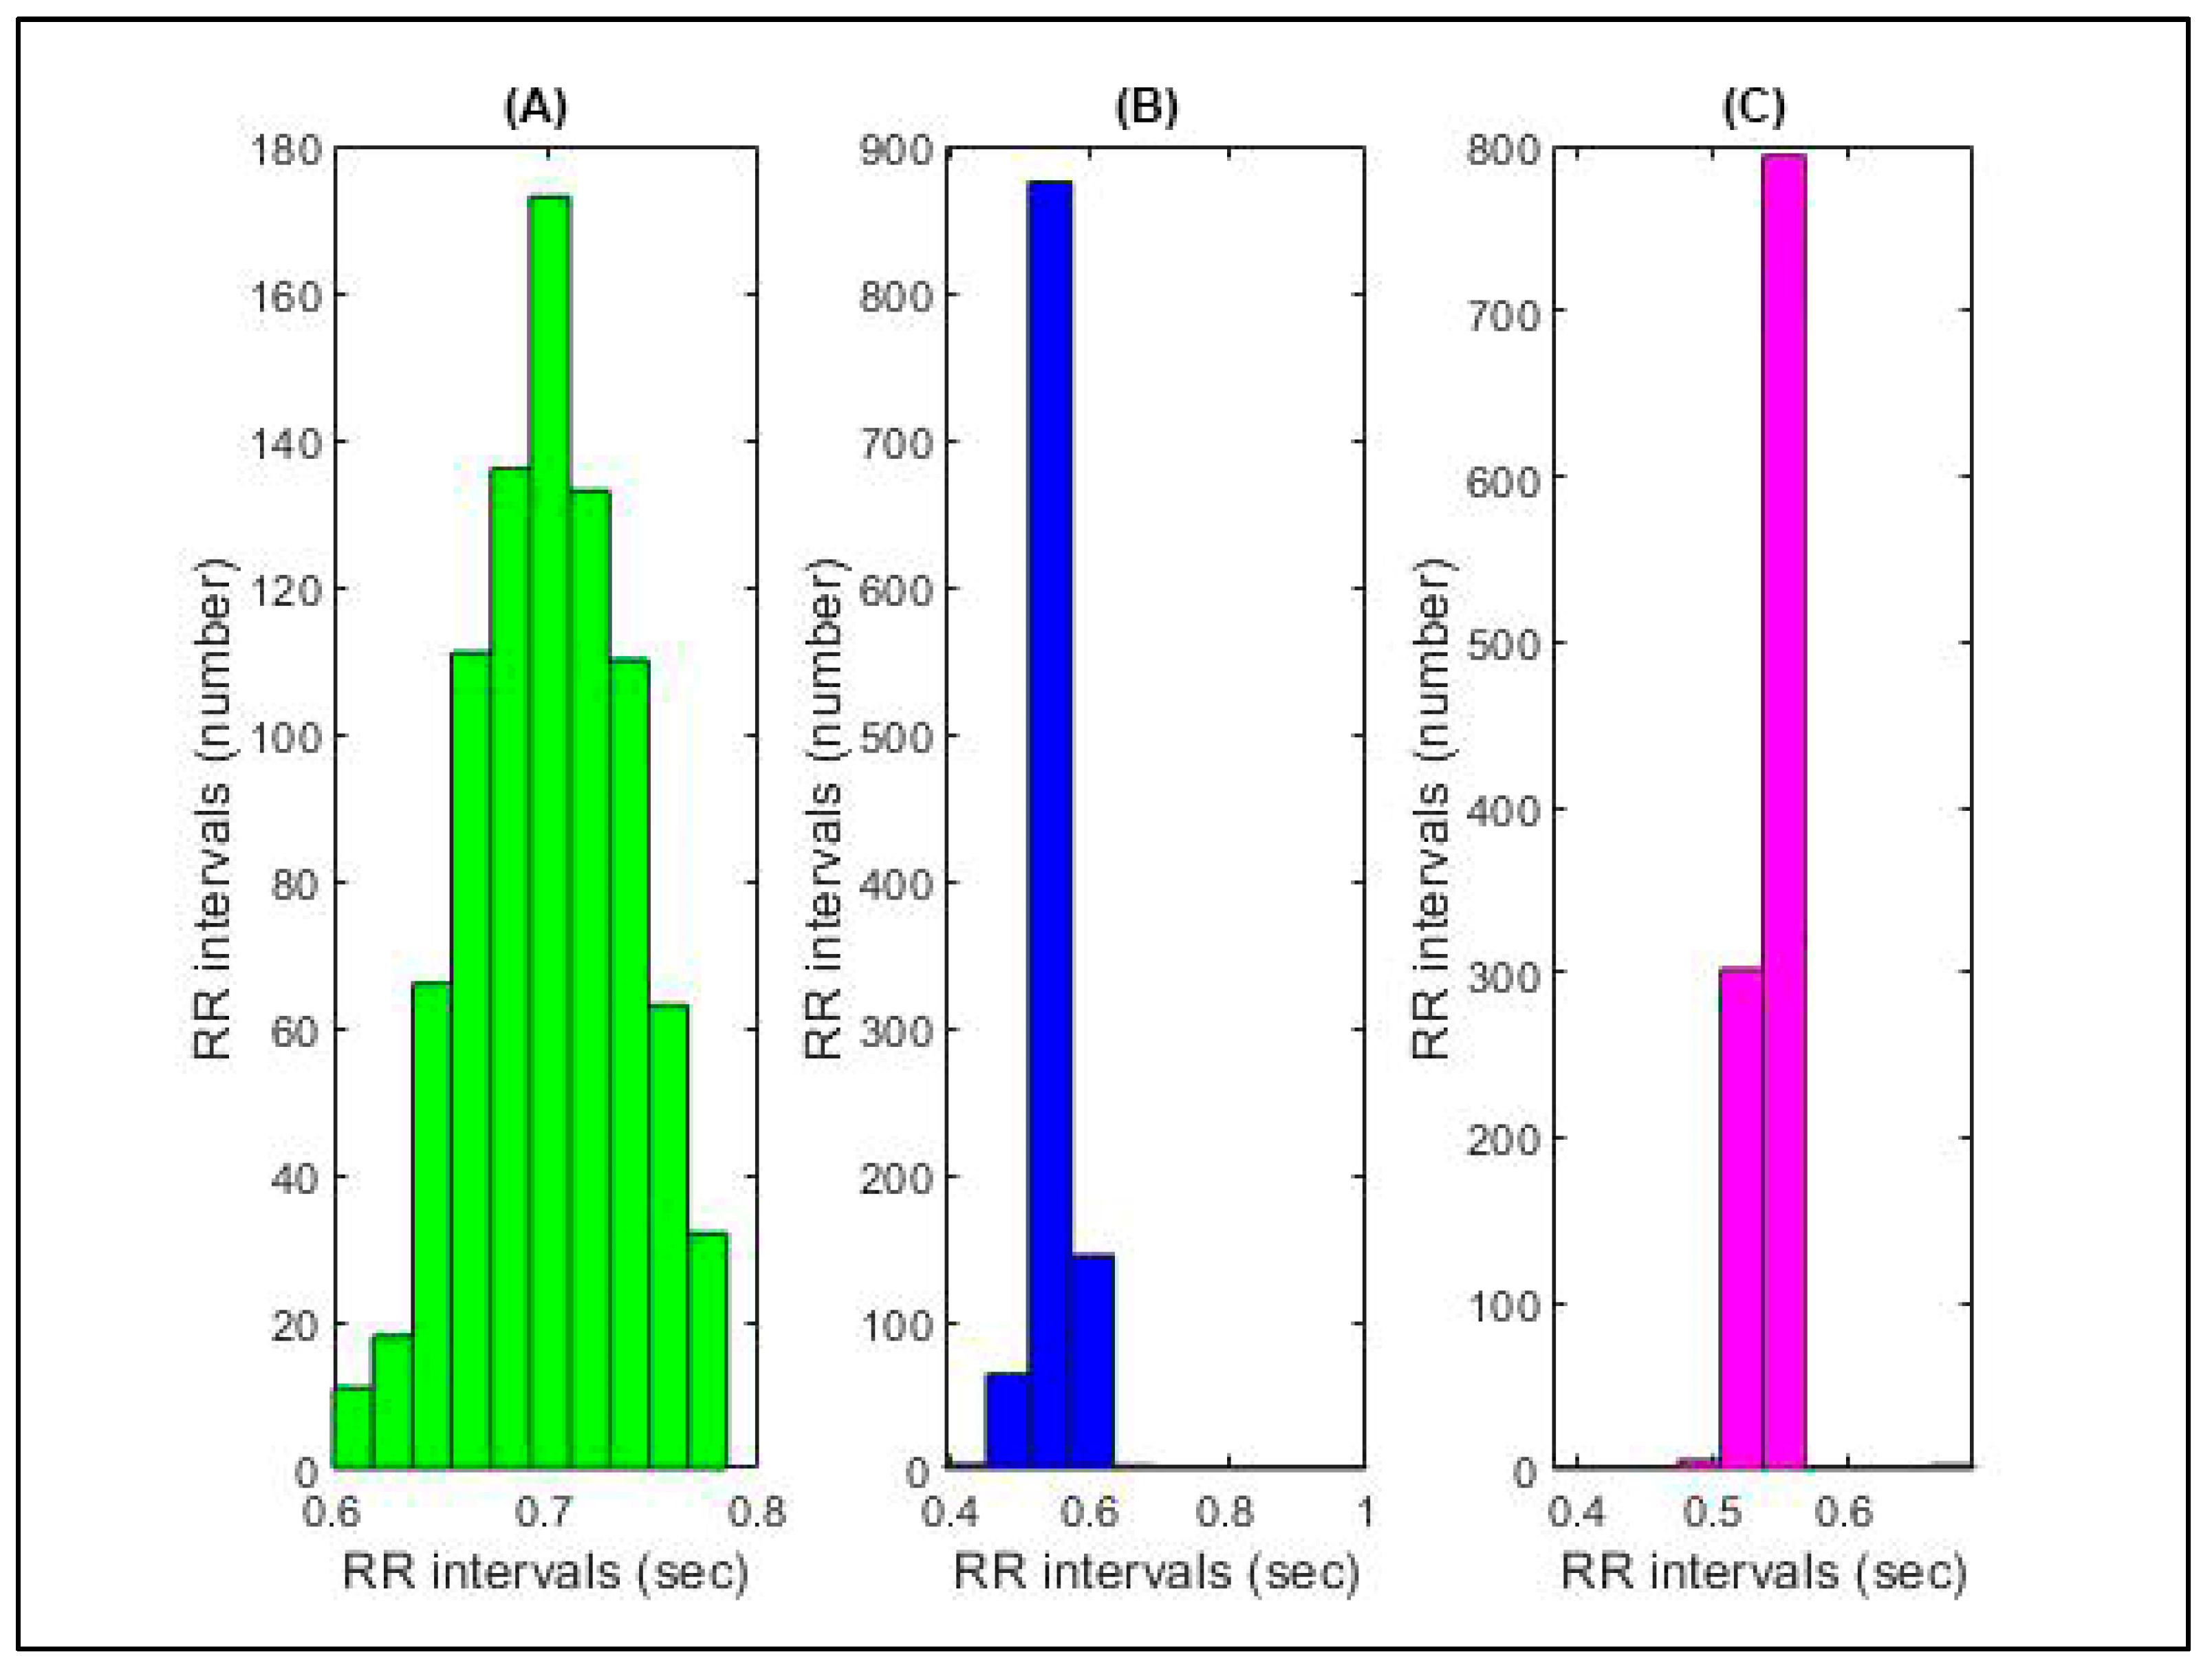
- The histograms shown in Figure 3 can be useful visual tools for studying HRV when assessing the body’s response to stressful conditions. The histograms show the distribution of the RR intervals, with the duration of the individual cardiac intervals on the horizontal axis and their number on the vertical axis. Figure 3A shows an individual’s pregame (resting) histogram, which consists of multiple RR intervals of varying length. A wide histogram with a symmetrical distribution of the individual’s pregame intervals suggests high heart rate variability, which is associated with a good balance between the sympathetic and parasympathetic nervous systems. The histograms shown in Figure 3B,C were obtained after play with immersive VR and with non-immersive VR. These histograms are narrow with a highly concentrated distribution around a certain value of the RR intervals (0.5–0.55 s), which are shifted to the left compared to the pregame histogram. This behaviour is due to the fact that due to the generated stress, the RR intervals have become more uniform and monotonous with small fluctuations, which indicate a low HRV and are signs of the dominance of sympathetic activity.
- A frequency analysis of HRV provides information about different components of the autonomic nervous system by analyzing fluctuations in RR intervals at different frequency ranges. This approach was applied to evaluate the effect of stress, resulting from the 3D game, on cardiac activity through the parameters LF, HF, and LF/HF, which reflect both sympathetic activity and parasympathetic activity. A frequency analysis of cardiac recordings taken immediately after the game showed that in both Group 2 and Group 3, individuals had higher LF (n.u.) values, while the HF (n.u.) values were lower compared to those of the group before the game. The increased value of LF/HF in these two groups indicates a dominance of sympathetic activity over parasympathetic activity. Similar results were reported in [36]. This behaviour is again due to the stress generated during the extreme 3D game, resulting in an increased heart rate and decreased HRV.
3.2.2. Non-Linear Analysis of HRV
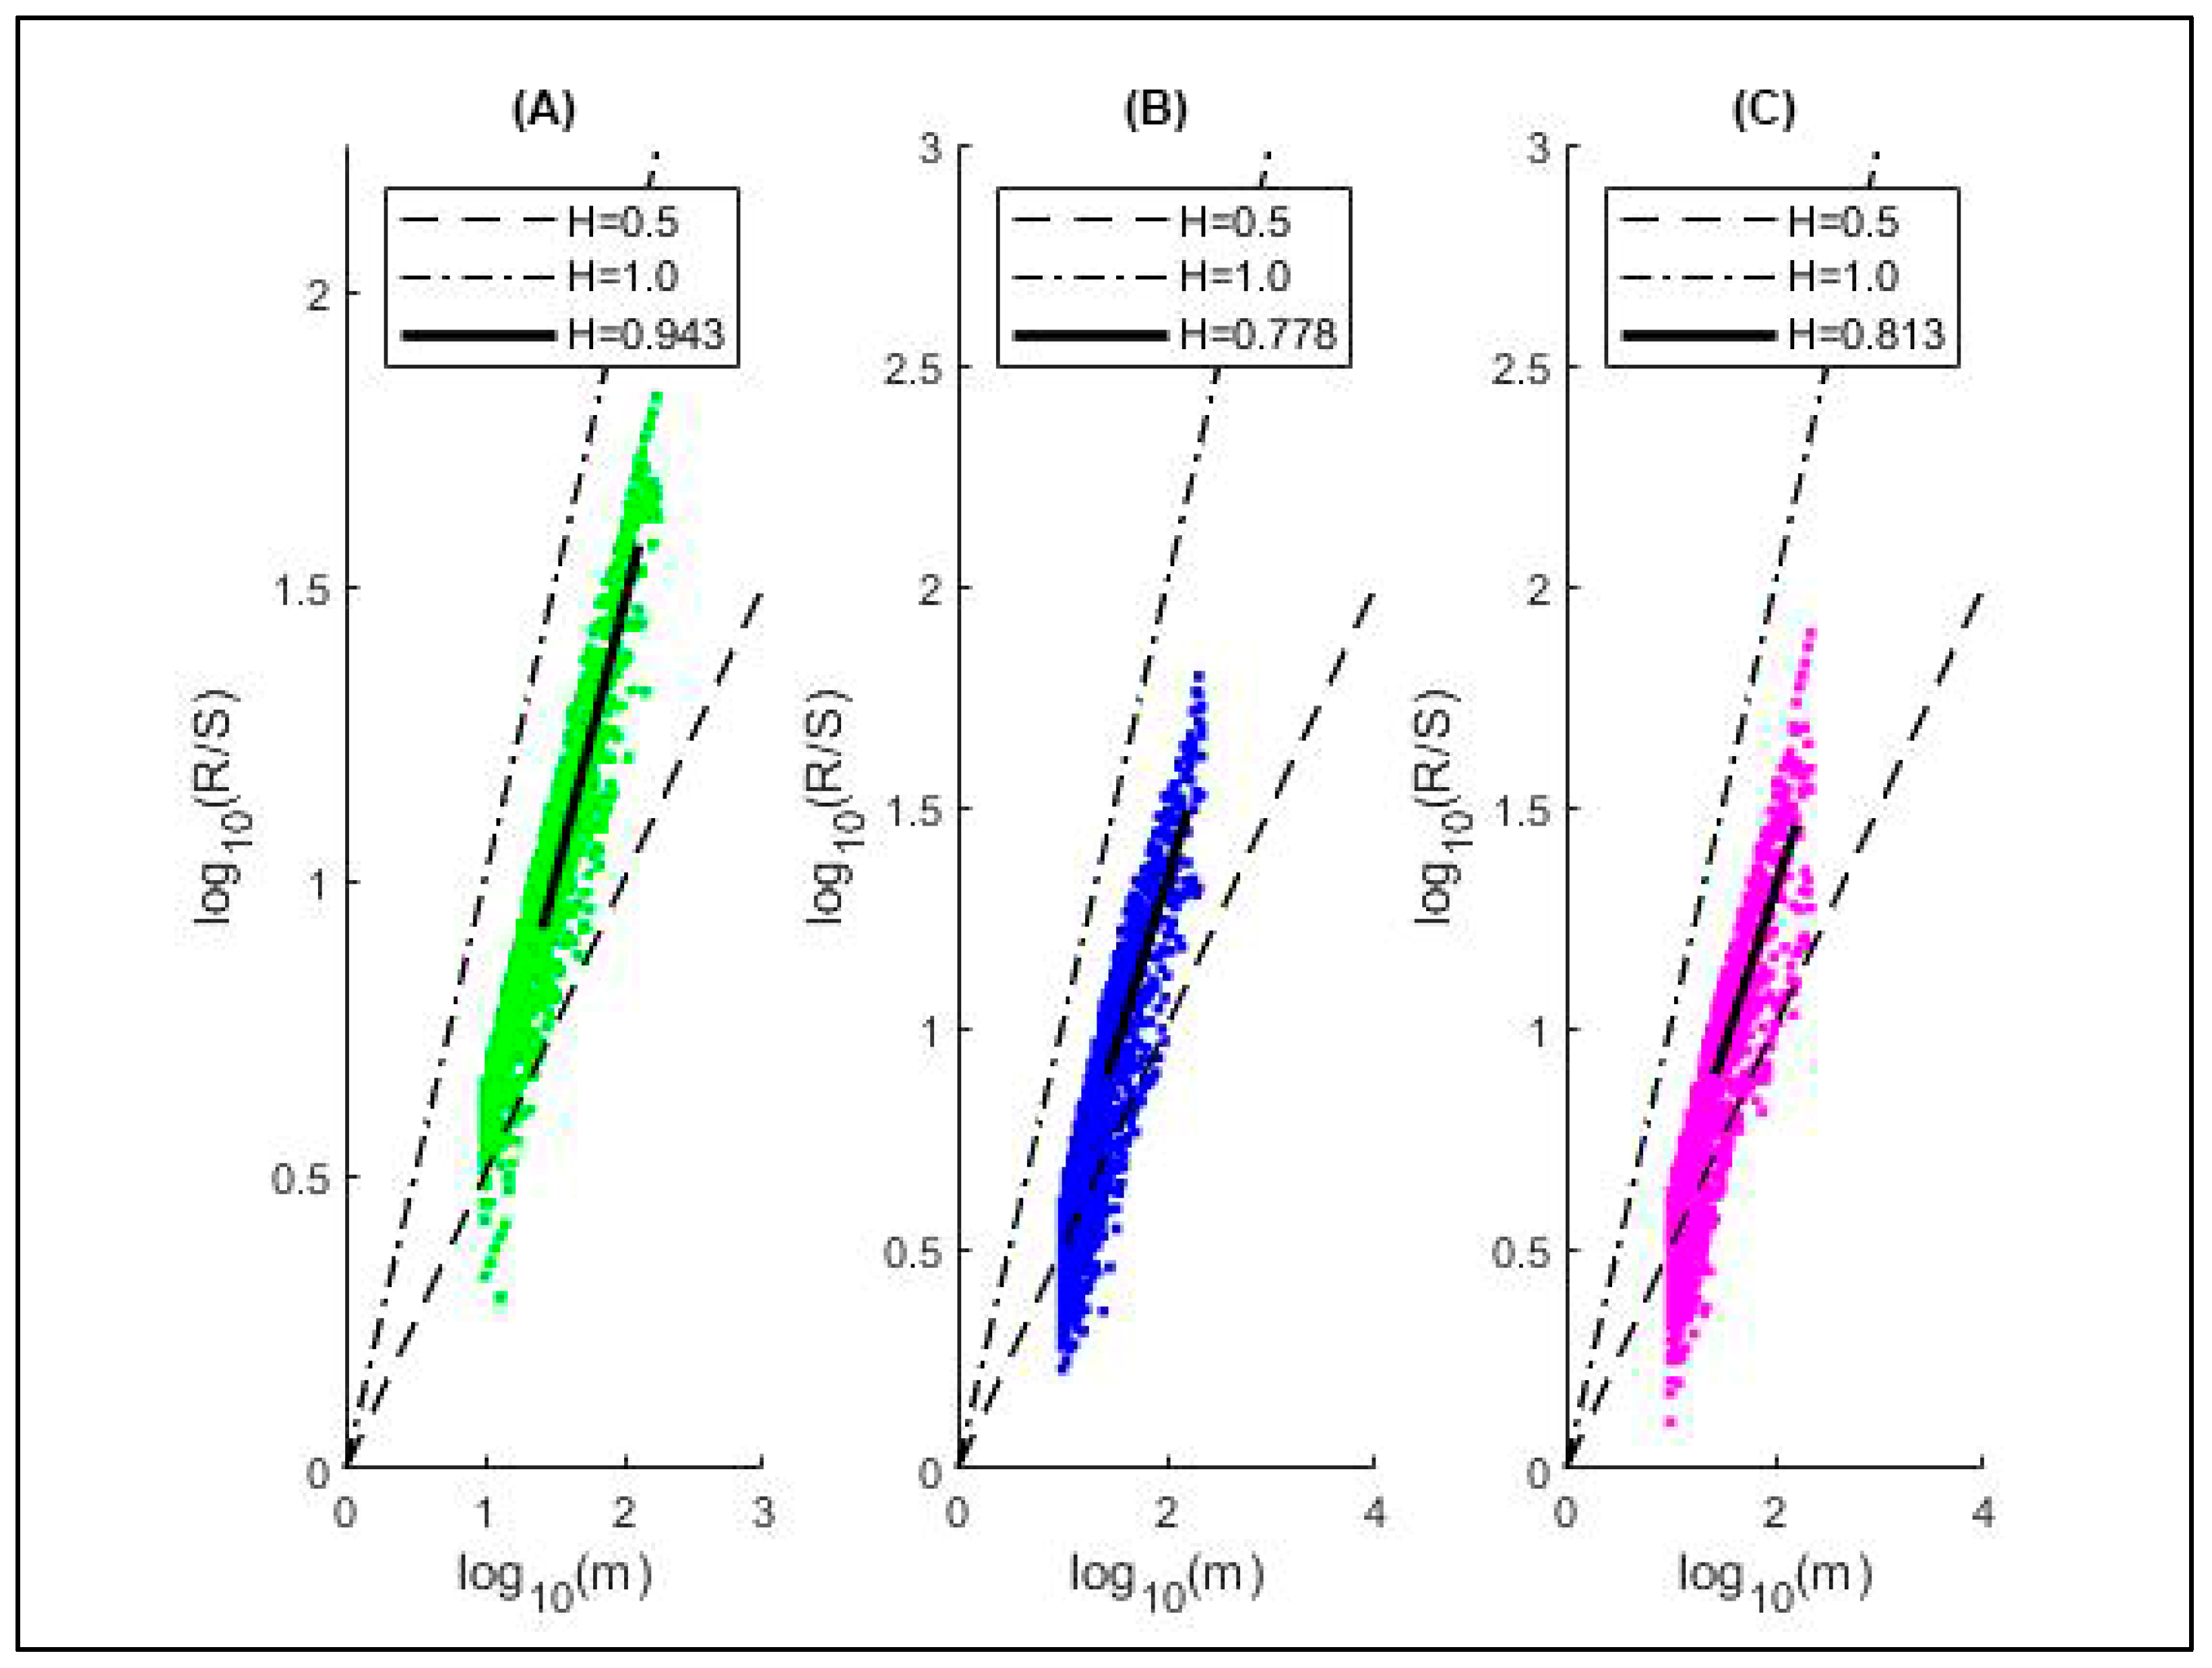
- The determination of the Hurst exponent using the R/S method plays an important role in the study of signals (RR time series) with fractal characteristics, i.e., the value of this parameter is between 0.5 and 1.0. The value of this parameter decreases with stress (Group 2 and Group 3) generated during the game, which is due to the reduction in the fractal complexity of the signal. Figure 4 shows the graphic results when determining the Hurst exponent values for the three studied groups. Similar results were reported in [49] when evaluating the HRV of patients with stress-induced cardiomyopathy, and it was found that the Hurst parameter value in the control group was greater compared to that in the cardiomyopathy group. This is due to the fact that in healthy individuals, as well as in those in a state of rest, the value of this parameter is higher than those with cardiovascular disease, as well as those in a stressful situation. This shows a higher degree of persistence as well as a higher HRV. High values of the Hurst exponent are usually associated with long-term correlation and stability in the heart rate, while low values show greater chaos and less predictability.
- A visual analysis of RR time intervals with a Poincarè plot (Figure 5) can reveal important features of HRV and be used for autonomic nervous system monitoring. At rest (Figure 5A), the points in the graph are more concentrated around the line of identity (the main diagonal), and the graph has a comet-like appearance with a pointed bottom, indicating that HRV is higher and has a greater balance in the autonomic nervous system. Under stress (Group 1 and Group 2), there is less scatter of the points in the graph (Figure 5B,C), which are more compact (compressed) and have lower values for the RR intervals, which is more noticeable in the stress generated during full-immersion gameplay. The obtained results show that under stress, there is lower heart rate variability, and in this condition, the sympathetic nervous system is activated. Similar results were reported in a publication [50]. A quantitative evaluation with Poincarè plot is performed with the parameters SD1 and SD2, and in a state of rest, they have higher values. Under stress, the values of these two parameters decrease, which is due to the increased influence of the sympathetic nervous system, as a result of which HRV decreases.
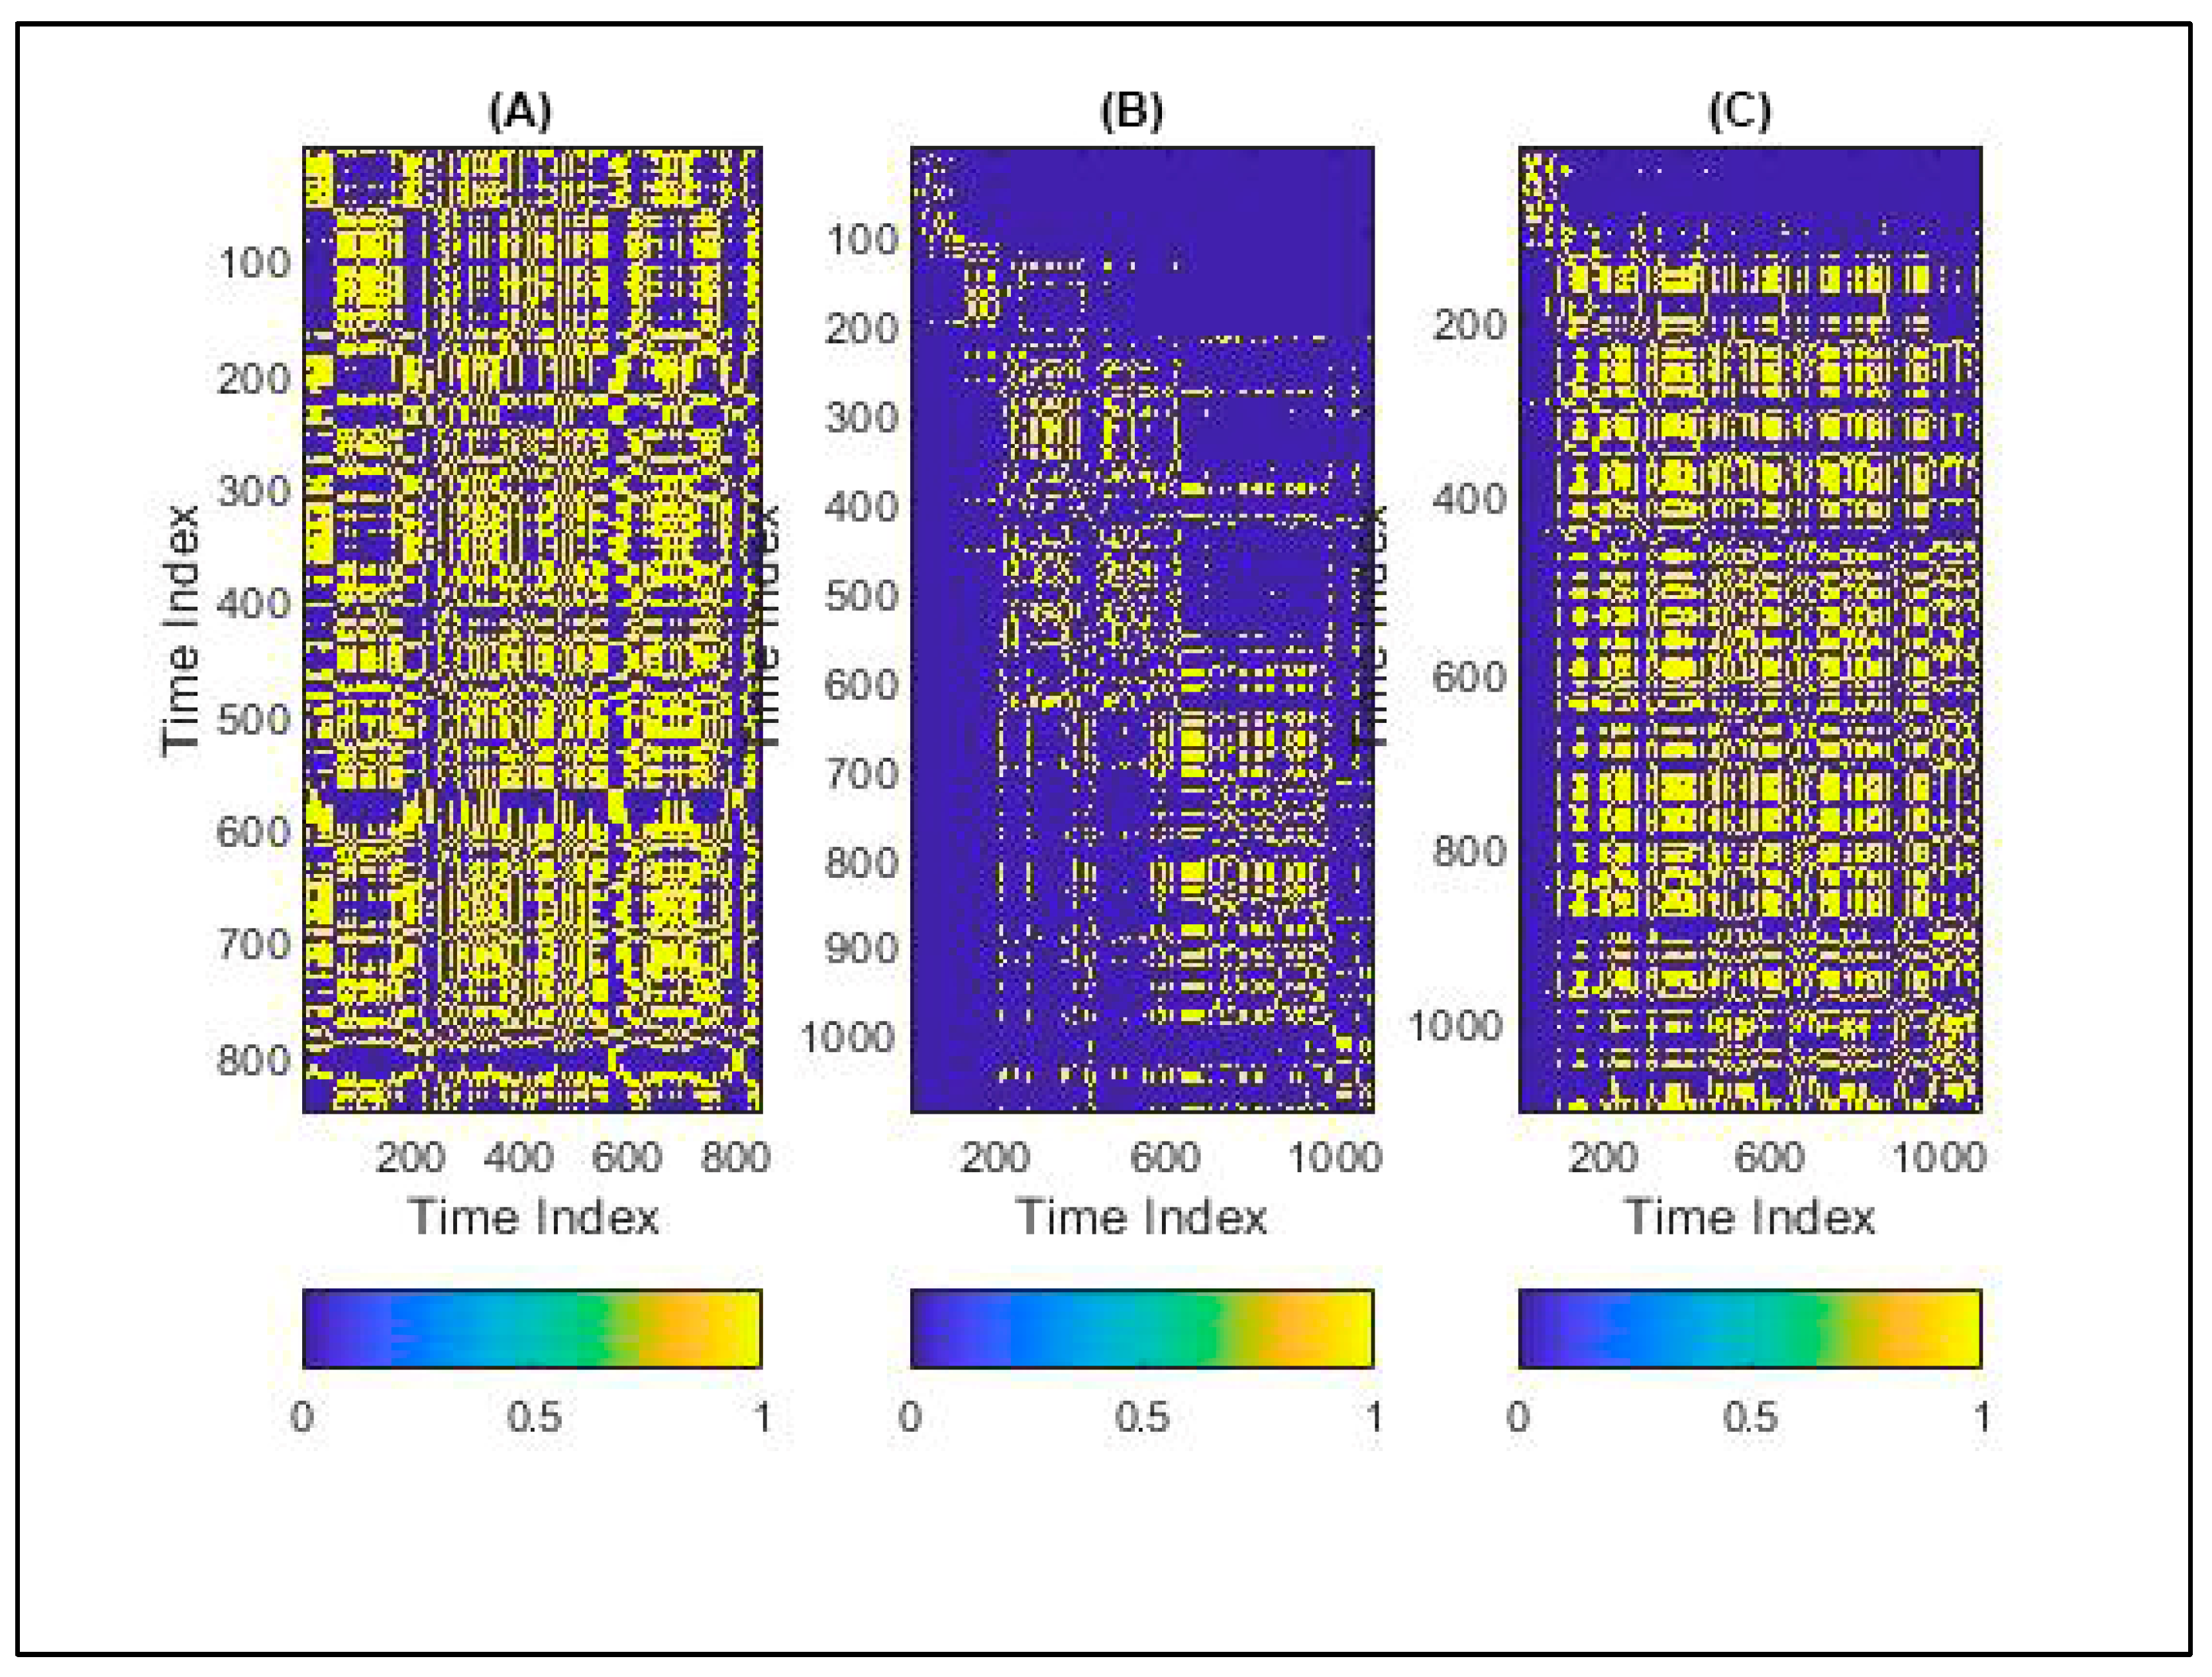
- A recurrence plot is a visual tool for a time series analysis that shows how system states repeat over time. The method constructs a two-dimensional matrix in which each point indicates whether two states of the system are close to each other. Figure 6 shows the graphs of an individual at rest (pre-game) immediately after a game with VR with and without immersion. At rest, the RP has a more ordered and structured matrix, indicating that the system states repeat regularly and with high correlation. This is an indication of stability and regularity in the data, resulting in higher HRV. Under stress, the RP exhibits a more chaotic and unstructured matrix. The points are scattered and do not form distinct clusters, indicating a reduced correlation and increased randomness in the data. Similar results were reported in [51]. The quantitative evaluation with the method was performed with the parameters REC%, DET%, and ENTR. The REC% parameter values measured using the RP may vary depending on the data being analyzed. In a resting state, the system is more stable and returns more often to previous states, and these result in higher REC% values due to the balance between the sympathetic and parasympathetic nervous systems. Under stress, the system is more dynamic and chaotic, resulting in lower REC% values and lower HRV. The DET% parameter values are also lower under stress, indicating that the system is more unpredictable and chaotic. The ENTR parameter also provides an estimate of the degree of chaoticity and variability in the system, providing information on how the dynamics change in response to different physiological states, such as rest and stress. At rest, the value of this parameter is smaller, and conversely, at stress, it is higher, which indicates increased chaos and complexity in the dynamics of the time series.
- ApEn and SampEn are used to study the complexity and predictability of the RR time series, which are identical but use different algorithms for their calculation. Higher values of ApEn/SampEn generally indicate greater unpredictability and chaos, while lower values indicate more regularity and predictability of the investigated signals. At rest, the RR signals are more stable and regular, resulting in lower ApEn/SampEn values, while under stress, the signals become more dynamic and chaotic, and the regulation of physiological processes is disturbed. Similar results were reported in [51].
3.3. Statistical Analysis Results
4. Conclusions, Limitations, and Future Work
- Creating a 3D VR game to generate positive stress that can be applied for therapeutic purposes. This game will enable users to face challenges and stressful situations in a way that leads to positive emotions, confidence, and reduction in anxiety and stress.
- Creating a 3D VR game for smartphones by applying CardBoard technology. Using CardBoard technology is a cost-effective way to deliver a VR experience, allowing users to use their smartphones. This technology is supported by both Android and iOS devices.
- Creating 3D games for students to help them train in the subject of discipline stereometry, which is one of the most problematic disciplines for students who lack spatial imagination. These games will allow for a visual representation of the learning material being studied, and students will be able to generate, observe, and manipulate geometric figures themselves.
Author Contributions
Funding
Institutional Review Board Statement
Informed Consent Statement
Data Availability Statement
Conflicts of Interest
References
- Bouchard, S.; Bernier, F.; Boivin, É.; Guitard, T.; Laforest, M.; Dumoulin, S.; Robillard, G. Modes of immersion and stress induced by commercial (off-the-shelf) 3D games. J. Def. Model. Simul. Appl. Methodol. Technol. 2014, 11, 339–352. [Google Scholar] [CrossRef]
- Radkowski, R.; Huck, W.; Domik, G.; Holtmann, M. Serious Games for the Therapy of the Posttraumatic Stress Disorder of Children and Adolescents. In Virtual and Mixed Reality—Systems and Applications; Shumaker, R., Ed.; Springer: Berlin/Heidelberg, Germany, 2011; Volume 6774. [Google Scholar] [CrossRef]
- Mühling, T.; Späth, I.; Backhaus, J.; Milke, N.; Oberdörfer, S.; Meining, A.; Latoschik, M.E.; König, S. Virtual reality in medical emergencies training: Benefits, perceived stress, and learning success. Multimed. Syst. 2023, 29, 2239–2252. [Google Scholar] [CrossRef]
- Zhao, X.; Ren, Y.; Cheah, K.S.L. Leading Virtual Reality (VR) and Augmented Reality (AR) in Education: Bibliometric and Content Analysis from the Web of Science (2018–2022). SAGE J. 2023, 13. [Google Scholar] [CrossRef]
- World Health Organization (WHO). Stress. Available online: https://www.who.int/news-room/questions-and-answers/item/stress (accessed on 21 February 2023).
- Schneiderman, N.; Ironson, G.; Siegel, S.D. Stress And Health: Psychological, Behavioral, and Biological Determinants. Annu. Rev. Clin. Psychol. 2005, 1, 607–628. [Google Scholar] [CrossRef]
- Yaribeygi, H.; Panahi, Y.; Sahraei, H.; Johnston, T.P.; Sahebkar, A. The impact of stress on body function: A review. EXCLI J. 2017, 16, 1057–1072. [Google Scholar] [CrossRef]
- Segerstrom, S.C.; Miller, G.E. Psychological stress and the human immune system: A meta-analytic study of 30 years of inquiry. Psychol. Bull. 2004, 130, 601–630. [Google Scholar] [CrossRef]
- Benson, H.; Greenwood, M.M.; Klemchuk, H. The relaxation response: Psychophysiologic aspects and clinical applications. Int. J. Psychiatry Med. 1975, 6, 87–98. [Google Scholar] [CrossRef]
- Cohen, S.; Janicki-Deverts, D.; Miller, G.E. Psychological stress and disease. JAMA 2007, 298, 1685–1687. [Google Scholar] [CrossRef]
- Mahindru, A.; Patil, P.; Agrawal, V. Role of Physical Activity on Mental Health and Well-Being: A Review. Cureus 2023, 15, e33475. [Google Scholar] [CrossRef]
- Henein, M.Y.; Vancheri, S.; Longo, G.; Vancheri, F. The Impact of Mental Stress on Cardiovascular Health-Part II. J Clin. Med. 2022, 11, 4405. [Google Scholar] [CrossRef]
- Subhani, A.R.; Xia, L.; Malik, A.S. Evaluation of mental stress using physiological signals. In Proceedings of the 2011 National Postgraduate Conference, Perak, Malaysia, 19–20 September 2011; pp. 1–4. [Google Scholar] [CrossRef]
- Conrad, C. The Handbook of Stress: Neuropsychological Effects on the Brain. Wiley-Blackwell: Hoboken, NJ, USA, 2011. [Google Scholar] [CrossRef]
- Faisal, A. Computer science: Visionary of virtual reality. Nature 2017, 551, 298–299. [Google Scholar] [CrossRef]
- Hamad, A.; Jia, B. How Virtual Reality Technology Has Changed Our Lives: An Overview of the Current and Potential Applications and Limitations. Int. J. Environ. Res. Public Health 2022, 19, 11278. [Google Scholar] [CrossRef]
- Ishaque, S.; Khan, N.; Krishnan, S. Physiological Signal Analysis and Stress Classification from VR Simulations Using Decision Tree Methods. Bioengineering 2023, 10, 766. [Google Scholar] [CrossRef] [PubMed]
- Shaw, A.J.; Lubetzky, A.V. A Short Bout of Exercise with and Without an Immersive Virtual Reality Game Can Reduce Stress and Anxiety in Adolescents: A Pilot Randomized Controlled Trial. Front. Virtual Real. 2021, 1, 598506. [Google Scholar] [CrossRef]
- Velana, M.; Sobieraj, S.; Digutsch, J.; Rinkenauer, G. The Advances of Immersive Virtual Reality Interventions for the Enhancement of Stress Management and Relaxation among Healthy Adults: A Systematic Review. Appl. Sci. 2022, 12, 7309. [Google Scholar] [CrossRef]
- Comparcini, D.; Simonetti, V.; Galli, F.; Saltarella, I.; Altamura, C.; Tomietto, M.; Desaphy, J.-F.; Cicolini, G. Immersive and Non-Immersive Virtual Reality for Pain and Anxiety Management in Pediatric Patients with Hematological or Solid Cancer: A Systematic Review. Cancers 2023, 15, 985. [Google Scholar] [CrossRef]
- Rizvi, J.; Farooqui, S.I.; Khan, A.; Soomro, B.A.; Hassan, B. The Impact of Immersive and Non-Immersive Virtual Reality Trends in Sensorimotor Recovery of Post-Stroke Patients-A Meta-Analysis. J. Intellect. Disabil.—Diagn. Treat. 2021, 9, 555–564. [Google Scholar] [CrossRef]
- Achleitner, M.; Bergmann, M.E.; Evangelatos, P.; Eder, V.; Schlögl, S. Google Cardboard in Social Science Research—Exploring low-cost virtual reality and its potential. In Proceedings of the Research Forum of the Austrian Universities of Applied Sciences, Krems, Austria, 19–20 January 2017. [Google Scholar]
- Chen, Y.; Li, X.; Chen, C.; An, Y.; Shi, J.; Huang, J.; Zhao, Y. Influence of avoidant coping on posttraumatic stress symptoms and job burnout among firefighters: The mediating role of perceived social support. Disaster. Med. Public Health Prep. 2022, 16, 1476–1481. [Google Scholar] [CrossRef]
- Parvaresh-Masoud, M.; Abdollahyar, A.; Molavi-Taleghani, Y.; Salahi, S.; Farahmandnia, H. Exploring coping strategies of emergency medical technicians against COVID-19 stress: A qualitative study. Front. Psychiatry 2023, 14, 1212769. [Google Scholar] [CrossRef]
- Riches, S.; Kaleva, I.; Nicholson, S.L.; Payne-Gill, J.; Steer, N.; Azevedo, L.; Vasile, R.; Rumball, F.; Fisher, H.L.; Veling, W.; et al. Virtual Reality Relaxation for Stress in Young Adults: A Remotely Delivered Pilot Study in Participants’ Homes. J. Technol. Behav. Sci. 2024. [Google Scholar] [CrossRef]
- Nakayama, N.; Arakawa, N.; Ejiri, H.; Matsuda, R.; Makino, T. Heart rate variability can clarify students’ level of stress during nursing simulation. PLoS ONE 2018, 13, e0195280. [Google Scholar] [CrossRef] [PubMed]
- Hou, C.-J.; Chen, Y.-T.; Capilayan, M.; Lin, Y.-S.; Huang, M.-W.; Huang, J.-J. Analysis of Heart Rate Variability in Response to Serious Games in Elderly People. Sensors 2021, 21, 6549. [Google Scholar] [CrossRef] [PubMed]
- Malińska, M.; Zużewicz, K.; Bugajska, J.; Grabowski, A. Heart rate variability (HRV) during virtual reality immersion. Int. J. Occup. Saf. Ergon. 2015, 21, 47–54. [Google Scholar] [CrossRef] [PubMed]
- Ishaque, S. Heart-rate Variability Analysis for Stress Assessment in a Video-Game Setup. Bachelor of Engineering. Bachelor’s Thesis, Toronto Metropolitan University, Toronto, ON, Canada, 2021. [Google Scholar] [CrossRef]
- Garay-Sánchez, A.; Suarez-Serrano, C.; Ferrando-Margelí, M.; Jimenez-Rejano, J.J.; Marcén-Román, Y. Effects of Immersive and Non-Immersive Virtual Reality on the Static and Dynamic Balance of Stroke Patients: A Systematic Review and Meta-Analysis. J. Clin. Med. 2021, 10, 4473. [Google Scholar] [CrossRef]
- Omlor, A.J.; Schwärzel, L.S.; Bewarder, M.; Casper, M.; Damm, E.; Danziger, G.; Mahfoud, F.; Rentz, K.; Sester, U.; Bals, R.; et al. Comparison of immersive and non-immersive virtual reality videos as substitute for in-hospital teaching during coro-navirus lockdown: A survey with graduate medical students in Germany. Med. Educ. Online 2022, 27, 2101417. [Google Scholar] [CrossRef]
- Malik, M. Heart rate variability: Standards of measurement, physiological interpretation and clinical use. Task Force of the European Society of Cardiology and the North American Society of Pacing and Electrophysiology. Circulation 1996, 93, 1043–1065. [Google Scholar] [CrossRef]
- Kim, H.G.; Cheon, E.J.; Bai, D.S.; Lee, Y.H.; Koo, B.H. Stress and Heart Rate Variability: A Meta-Analysis and Review of the Literature. Psychiatry Investig. 2018, 15, 235–245. [Google Scholar] [CrossRef]
- Jarczok, M.N.; Jarczok, M.; Mauss, D.; Koenig, J.; Li, J.; Herr, R.M.; Thayer, J.F. Autonomic nervous system activity and workplace stressors--a systematic review. Neurosci. Biobehav. Rev. 2013, 37, 1810–1823. [Google Scholar] [CrossRef]
- Shaffer, F.; Ginsberg, J.P. An Overview of Heart Rate Variability Metrics and Norms. Front. Public Health 2017, 28, 258. [Google Scholar] [CrossRef] [PubMed]
- Ernst, G. Heart Rate Variability; Springer: London, UK, 2014. [Google Scholar]
- Georgieva-Tsaneva, G. Time and Frequency Analysis of Heart Rate Variability Data in Heart Failure Patients. Int. J. Adv. Comput. Sci. Appl. 2019, 10, 456–562. [Google Scholar] [CrossRef]
- Georgieva-Tsaneva, G. Interactive Cardio System for Healthcare Improvement. Sensors 2023, 23, 1186. [Google Scholar] [CrossRef]
- Hurst, H.E. Long term storage capacity of reservoirs. Trans. Am. Soc. Eng. 1951, 116, 770–799. [Google Scholar] [CrossRef]
- Raubitzek, S.; Corpaci, L.; Hofer, R.; Mallinger, K. Scaling Exponents of Time Series Data: A Machine Learning Approach. Entropy 2023, 25, 1671. [Google Scholar] [CrossRef]
- Mariani, M.C.; Kubin, W.; Asante, P.K.; Guthrie, J.A.; Tweneboah, O.K. Relationship between Continuum of Hurst Exponents of Noise-like Time Series and the Cantor Set. Entropy 2021, 23, 1505. [Google Scholar] [CrossRef]
- Pham, T.; Lau, Z.J.; Chen, S.H.A.; Makowski, D. Heart Rate Variability in Psychology: A Review of HRV Indices and an Analysis Tutorial. Sensors 2021, 21, 3998. [Google Scholar] [CrossRef]
- Donisi, L.; Ricciardi, C.; Cesarelli, G.; Coccia, A.; Amitrano, F.; Adamo, S.; D’Addio, G. Bidimensional and Tridimensional Poincaré Maps in Cardiology: A Multiclass Machine Learning Study. Electronics 2022, 11, 448. [Google Scholar] [CrossRef]
- Khandoker, A.H.; Karmakar, C.; Brennan, M.; Voss, A.; Palaniswami, M. Poincaré Plot Methods for Heart Rate Variability Analysis. Springer: New York, NY, USA, 2013. [Google Scholar]
- Roh, D.; Shin, H. Recurrence Plot and Machine Learning for Signal Quality Assessment of Photoplethysmogram in Mobile Environment. Sensors 2021, 21, 2188. [Google Scholar] [CrossRef]
- Błażkiewicz, M.; Hadamus, A.; Borkowski, R. Recurrence Quantification Analysis as a Form of Postural Control Assessment: A Systematic Review. Appl. Sci. 2023, 13, 5587. [Google Scholar] [CrossRef]
- Delgado-Bonal, A.; Marshak, A. Approximate Entropy and Sample Entropy: A Comprehensive Tutorial. Entropy 2019, 21, 541. [Google Scholar] [CrossRef]
- Lebamovski, P. New Method for Generating a Regular Polygon. In Lecture Notes in Networks and Systems, Proceedings of the ICICT 2023 Eighth International Congress on Information and Communication Technology, London, UK, 20–23 February 2023; Yang, X.S., Sherratt, R.S., Dey, N., Joshi, A., Eds.; Springer: Singapore, 2023; Volume 693, pp. 931–938. ISSN 2367-3389. [Google Scholar] [CrossRef]
- Krstacic, G.; Parati, G.; Gamberger, D.; Castiglioni, P.; Krstacic, A.; Steiner, R. Heart rate variability and nonlinear dynamic analysis in patients with stress-induced cardiomyopathy. Med. Biol. Eng. Comput. 2012, 50, 1037–1046. [Google Scholar] [CrossRef]
- Hoshi, R.A.; Pastre, C.M.; Vanderlei, L.C.; Godoy, M.F. Poincaré plot indexes of heart rate variability: Relationships with other nonlinear variables. Auton. Neurosci. Basic Clin. 2013, 177, 271–274. [Google Scholar] [CrossRef] [PubMed]
- Acharya, U.R.; Suri, J.S.; Spaan, J.A.E.; Krishnan, S.M. Advances in Cardiac Signal Processing; Springer: Berlin/Heidelberg, Germany, April 2007; Available online: https://link.springer.com/book/10.1007/978-3-540-36675-1 (accessed on 4 April 2007).


| Parameter | Before Game Group 1 (n = 19) [Mean ± Std] | Fully Immersive VR Group 2 (n = 19) [Mean ± Std] | Non-Immersive VR Group 3 (n = 19) [Mean ± Std] | Pgr1,Gr2 Value | PGr1,Gr3 Value |
|---|---|---|---|---|---|
| Statistical analysis | |||||
| MeanRR [ms] | 725.98 ± 85.11 | 551.02 ± 61.33 | 605.33 ± 52.03 | <0.0001 | <0.0001 |
| SDNN [ms] | 87.27 ± 31.26 | 61.11 ± 19.03 | 77.01 ± 20.19 | 0.0036 | 0.2373 |
| RMSSD [ms] | 29.36 ± 10.02 | 16.67 ± 7.51 | 21.12 ± 8.99 | <0.0001 | 0.0114 |
| pNN50 [%] | 21.51 ± 3.50 | 11.01 ± 6.83 | 19.09 ± 2.15 | <0.0001 | 0.0145 |
| Geometrical analysis | |||||
| TINN [ms] | 460.05 ± 101.71 | 230.21 ± 75.34 | 412.10 ± 90.06 | <0.0001 | 0.1327 |
| HRVti [-] | 15.97 ± 6.71 | 10.02 ± 3.23 | 13.21 ± 3.08 | 0.0013 | 0.1119 |
| Frequency analysis | |||||
| LF [n.u] | 58.06 ± 3.19 | 79.11 ± 11.05 | 63.76 ± 4.12 | <0.0001 | <0.0001 |
| HF [n.u] | 31.41 ± 1.89 | 27.01 ± 9.05 | 29.11 ± 2.03 | <0.0001 | 0.0009 |
| LF/HF [-] | 1.80 ± 0.19 | 2.91 ± 0.34 | 2.16 ± 0.17 | <0.0001 | <0.0001 |
| Non-linear analysis | |||||
| Hurst [-] (R/S) | 0.956 ± 0.05 | 0.753 ± 0.10 | 0.811 ± 0.09 | <0.0001 | <0.0001 |
| SD1 [ms] (PP) | 29.795 ± 7.34 | 11.228 ± 4.12 | 18.228 ± 5.34 | <0.0001 | <0.0001 |
| SD2 [ms] (PP) | 61.987 ± 9.13 | 30.912 ± 10.39 | 40.781 ± 9.210 | <0.0001 | <0.0001 |
| DET [%] (RP) | 81.013 ± 4.19 | 53.711 ± 3.92 | 65.019 ± 10.421 | <0.0001 | <0.0001 |
| REC [%] (RP) | 26.011 ± 3.65 | 11.721 ± 0.231 | 17.032 ± 9.023 | <0.0001 | 0.0003 |
| ENTR [-] (RP) | 3.311 ± 0.121 | 4.657 ± 0.891 | 4.120 ± 0.095 | <0.0001 | <0.0001 |
| ApEn [-] | 0.913 ± 0.128 | 0.541 ± 0.012 | 0.783 ± 0.093 | <0.0001 | 0.0194 |
| SampEn [-] | 0.896 ± 0.216 | 0.497 ± 0.109 | 0.801 ± 0.186 | <0.0001 | 0.1550 |
Disclaimer/Publisher’s Note: The statements, opinions and data contained in all publications are solely those of the individual author(s) and contributor(s) and not of MDPI and/or the editor(s). MDPI and/or the editor(s) disclaim responsibility for any injury to people or property resulting from any ideas, methods, instructions or products referred to in the content. |
© 2024 by the authors. Licensee MDPI, Basel, Switzerland. This article is an open access article distributed under the terms and conditions of the Creative Commons Attribution (CC BY) license (https://creativecommons.org/licenses/by/4.0/).
Share and Cite
Lebamovski, P.; Gospodinova, E. Investigating the Impact of Mental Stress on Electrocardiological Signals through the Use of Virtual Reality. Technologies 2024, 12, 159. https://doi.org/10.3390/technologies12090159
Lebamovski P, Gospodinova E. Investigating the Impact of Mental Stress on Electrocardiological Signals through the Use of Virtual Reality. Technologies. 2024; 12(9):159. https://doi.org/10.3390/technologies12090159
Chicago/Turabian StyleLebamovski, Penio, and Evgeniya Gospodinova. 2024. "Investigating the Impact of Mental Stress on Electrocardiological Signals through the Use of Virtual Reality" Technologies 12, no. 9: 159. https://doi.org/10.3390/technologies12090159