Abstract
In today’s world, advanced technologies are indispensable. In the field of mining, the use of machine-learning techniques is a reliable and productive way to solve various problems. This article touches upon the issues of increasing the recovery rate at potash mines, using the technology of backfilling with hardening materials. The compositions of backfills with increased strength are developed. The results of laboratory studies are given. To reduce the labor intensity of the experimental work, as well as to develop and validate methodological approaches to machine-learning introduction in the fields of mining and geomechanical research, this paper also presents the results of the predicted calculated values of the multi-component backfill strength, obtained with the help of neural networks.
1. Introduction
Potash–magnesium and rock salt mining is characterized by significant losses of valuable minerals (up to 75%). These losses are primarily caused by the need to ensure the waterproof strata continuity by maintaining it on ore rib pillars [1,2,3]. However, even with such safety measures, salt deposit mining remains a highly hazardous process, as evidenced by numerous cases of mine flooding from overlying aquifers [4,5,6]. The causes of such flooding include difficult-to-predict geological [7,8,9], mining [10,11,12], and technical factors [13,14,15,16], which are the subject of ongoing discussions in the scientific and industrial communities [17,18,19,20].
One of the well-known methods to address the high mineral loss rates and accident rates at potash mines is the implementation of mining methods with backfill. This approach reduces the subsidence of layers, thereby minimizing the curvature of rock layers at the edges of the mass, where the likelihood of water-conducting fractures is the highest. Furthermore, the reinforcing effect of the fill mass enables a reduction in the widths of ore pillars and, thus, an increase in the ore recovery rate [21,22,23,24,25]. Backfill is also used to mitigate the consequences of emergency situations and to decrease the activity of geomechanical processes in potentially hazardous zones [26,27,28,29,30]. Lastly, backfill can serve as a structural element in mining methods for implementing several-stage stoping at potash mines [5,31]. This technology should provide the most qualitative and productive extraction of minerals [32,33,34,35] while maintaining safe conditions for deposit development [36,37,38,39] and favorable environmental conditions in the region [40,41,42,43].
Hydraulic backfill typically consists of an aggregate, binder, various additives, and a liquid phase, which facilitates transportation and acts as a grouting fluid. The backfill formulation must ensure a range of physical and mechanical properties for both the mixture itself (e.g., viscosity and mobility) and the artificial mass (e.g., strength development and shrinkage) while maintaining low material costs [44,45,46].
From the perspective of controlling the disturbed rock mass’s behavior, the most critical property of the constructed fill mass is its strength. Calculations of the normative compressive strength of the backfill for the room-and-pillar mining method with single-stage stoping, according to the “Mine Backfill Operations” handbook [47], the VNIIMI methodology [48], and the scientific literature [49,50,51], indicate that the backfill strength should be no less than 3–5 MPa. However, during ore pillar extraction in several-stage stoping, the artificial fill mass must bear the load of overlying rocks, which requires backfill with increased load-bearing capacity and minimal shrinkage.
Moreover, the issue of developing high-strength, low-shrinkage backfill becomes particularly relevant as potash mining progresses to greater depths. For instance, the productive layer of the Gremyachinskoye deposit lies at a depth of approximately 1100 m, with similar depths observed at the promising Novo-Gremyachinskoye, Nivenskoye, and Severo-Krasnoborskoye potash deposits [52]. Currently, mining companies are paying significant attention to improving the ore recovery ratios at these and other potash deposits, using backfill technology based on salt tailings.
However, at potash mines, the compressive strength of the hydraulic fill mass, based on waste tailings, does not exceed 1–4 MPa [53,54,55], whereas, for example, modern metal ore mines achieve fill mass strengths of 10 MPa or more [56,57]. In the latter case, increased strength is often achieved by incorporating cement binders into the backfill (Table 1). But the use of cement significantly raises ore extraction costs, making its implementation challenging at potash mines.

Table 1.
Composition and strength of hardening backfills at various deposits.
Therefore, to develop promising potash ore mining technologies aimed at improving ore recovery ratio, particularly at greater depths, alternative methods must be explored to increase the strength and reduce the shrinkage of the fill mass, based on mining and processing waste.
This article proposes formulations for multi-component cement-free backfills based on salt tailings. These formulations provide higher fill mass strengths compared to those of the dry and hydraulic backfills traditionally used at potash mines.
It should be noted that considering all the possible combinations of the components selected for investigation would require a large number of laboratory experiments. To reduce the labor intensity of the experimental work, as well as to develop and test methodological approaches for integrating machine learning in the fields of mining and geomechanical research, this study also includes predictive strength calculations for multi-component backfills, using neural networks, based on data from laboratory tests.
It is worth noting that previously conducted studies in the field of uniaxial compressive strength (UCS) forecasting [58,59,60] reflect the results of modeling using the cement formulations of backfills. At the same time, the study of the feature space of models for forecasting the strength of backfills based on salt tailings differs from those presented in the literature. Considering that the reliability of forecasting depends on the structure of the initial data and their quality and composition, it is necessary to study in detail the correlation dependencies between the features to identify their significance for the target value (UCS forecast) and to obtain an idea of the model factors’ interrelations [61,62,63]. This allows us to conclude that the studies aimed at generalizing the forecasting experience in terms of determining the feature space and criteria for selecting an algorithm for forecasting the strength of backfills based on salt tailings are relevant. Thus, these research results contain conclusions and recommendations of theoretical and applied natures, which determined the innovative significance of this work.
This article is further organized as follows: the Materials and Methods section presents descriptions of the backfill materials and laboratory experiments and data selection and modeling; the Results section presents the laboratory experiments and predicted values and their interpretations; the Discussion section describes the economic feasibility of the optimal formula and its potential for widespread application, as well as directions for future research; the Conclusions section contains the main findings of this study; the Patents section contains patent identification data for the backfill composition.
2. Materials and Methods
2.1. Backfill Material
Flotation is the most common method for potash ore processing. Potash ore processing waste primarily consists of sodium chloride (NaCl) with small amounts of sylvinite and other salts, as well as insoluble residues (IRs) composed mainly of clay fractions. The chemical and particle size distribution of real potash flotation waste is presented in Table 2 and Table 3. Salt tailings are used as aggregates in the present study.

Table 2.
Chemical composition of sylvinite flotation tailings.

Table 3.
Particle size distribution of sylvinite flotation tailings.
A saturated salt solution was used as a grouting fluid in the laboratory studies. In the field conditions of potash mines, such a liquid phase reduces the dissolution rate of pillars and surrounding rocks during the feeding of the backfill into the rooms.
The required strength of the artificial fill mass is ensured by the main component, such as a binder. As a general rule, cement is used as a binder. However, the use of such an expensive component is problematic when mining low-value ores. To optimize the composition, this study used activated blast furnace slag instead of cement. Previous research has demonstrated the binding properties of blast furnace slag [64,65,66] at a lower cost. Furthermore, the maximum utilization of mining waste meets resource conservation requirements during mining operations [67,68,69,70]. For this study, slags from the Chusovoy Metallurgical Plant were used, and their chemical composition and moduli are presented in Table 4.

Table 4.
Blast furnace slag characterization.
In addition to the binder, a reinforcing component, fiber, was added to the backfill to enhance the strength characteristics of the material. Fiber is a material used primarily in construction to strengthen and improve the properties of concrete (e.g., reducing shrinkage, preventing cracking, and increasing durability) [71,72,73]. Because of these properties, fibers are often referred to as “micro-reinforcements” and are considered as an alternative to traditional reinforcement methods [74,75,76]. There are several types of fibers: metallic, glass, polymer, basalt, and carbon. The drawbacks of metallic and glass fibers include their susceptibility to corrosion in cement hydration environments, and metallic fibers cannot be used in the presence of chloride salts.
Thus, based on a series of laboratory experiments, this study examined the strength properties of backfills incorporating the following components in various proportions:
- Salt tailings (aggregate—A);
- Smelter slag (binder—B);
- Fiber (basalt (BF), carbon (CF), or polymer (PF));
- Grouting fluid—NaCl-saturated salt solution.
2.2. Laboratory Test Methods and Investigated Compositions
To prepare samples of the backfill material, a saturated salt solution was created by dissolving salt in water at a ratio of 300 grams of salt per 1 liter of water (at 20 °C). The resulting brine density was at least 1.235 t/m3. The brine was left to settle for two hours before use.
Simultaneously, the required amounts of dry components (salt tailings, slag, and fiber) were weighed and mixed until uniform. The saturated salt solution was gradually added to the dry mixture while stirring continuously to achieve a solid-to-liquid ratio of 1:3. The resulting slurry density was 1.582 t/m3.
Freshly prepared slurry was poured into filtering cylindrical molds, which were then set aside to dry after the brine was filtered out.
The molds were made from mesh material with 1 mm × 1 mm openings. The mesh was durable enough to maintain its shape during sample pouring, allowed efficient brine filtration, and prevented solid particles from seeping through.
The mold dimensions were selected to comply with the geometric requirements of all-Union State Standards 21153.2-84: “Rock Testing Methods: Determining Compressive Strength” and “Methodological Guidelines for Backfill Quality Controlling”. The final dimensions of the dried cylindrical test samples were 100 mm in height and 50 mm in diameter, with allowable deviations.
To expedite testing, the samples were dried in an oven at 60–70 °C until a constant mass was achieved, typically requiring 14 days. The samples were then cooled at room temperature and tested for uniaxial compression strength.
The number of samples for each test series was determined to ensure a 95% reliability of the results. Typically, at least 10 samples were tested for each recipe variant.
Testing was conducted for a single-component material (only salt tailings: A), two-component materials (combinations of salt tailings and fiber, A + BF, A + CF, A + PF, and a combination of salt tailings and smelter slag, A + B), and three-component materials (salt tailings, fiber, and smelter slag, A + B + BF and A + B + CF). This study includes 550 samples. The next page continues with the detailed experimental results.
The single-component material consists of 100% salt tailings (A) (Table 5).

Table 5.
The tested single-component material.
For testing the two-component material A + B, the smelter slag content (B) was varied at 5%, 10%, 20%, 25%, 30%, and 40% by dry weight, with the remaining portion consisting of salt tailings (A). A total of six recipe variants were studied (Table 6).

Table 6.
Variants of the tested two-component materials.
For the two-component materials A + BF, A + CF, and A + PF, the fiber content (F) was varied at 0.1%, 0.3%, 0.5%, 0.7%, 0.9%, 1.1%, 1.3%, and 1.5% by dry weight, with the remaining portion consisting of salt tailings (A). A total of 24 recipe variants were tested (Table 6).
For the three-component material A + F + B, the smelter slag content (B) was set at 10%, 20%, 25%, and 30% by dry weight, while the basalt fiber (BF) content was set at 0.3%, 0.5%, and 0.7%, and the carbon fiber (CF) content was set at 0.7%, 0.9%, and 1.1%. Salt tailings (A) accounted for the remainder of the dry weight. A total of 24 recipe variants were tested (Table 7). The three-component material with PF was excluded because the PF in the two-component A + PF material did not produce a significant strength gain (Results section).

Table 7.
Variants of the tested three-component materials.
To explore additional combinations for three-component materials (A + B + F), machine-learning algorithms were used (Table 8). Specifically, the compressive strengths of the backfills were predicted for the following combinations that were not physically tested in the laboratory: slag (B) contents at 5% and 40%, basalt fiber (BF) contents at 0.1%, 0.9%, 1.1%, 1.3%, and 1.5%, and carbon fiber (CF) contents at 0.1%, 0.3%, 0.5%, 1.3%, and 1.5%.

Table 8.
Variants of three-component materials studied using machine learning algorithms.
2.3. Strength Forecasting by Machine-Learning Algorithms
Machine learning is widely used in various fields of research [77,78,79,80,81,82], including mining [58,83,84]. In general, the key difference and main advantage of machine learning, compared to classical statistical approaches (such as, for example, multivariate regression), are the discovery of hidden dependencies in the data and their use in modeling. Forecasting the strength of backfills, using machine learning, is presented in a number of papers [58,59,60]. As a review of literature shows, for similar research tasks, the choice of the algorithm is individual and depends on a number of factors, such as the data dimension, the features, and the composition of the backfill. Thus, a previous paper [58] presents the best performance indicators of the model for predicting the uniaxial compressive strength of the fill mass that were obtained using the extreme learning machine (ELM) with the application of the sparrow search algorithm (SSA). At the same time, the models of the radial basis function neural network (RBFNN), the general regression neural network (GRNN), and the backpropagation neural network (BPNN) produced large deviations between the actual data and the predicted ones. As a result, the generalization abilities of those algorithms are worse than that of the ELM model [58].
However, other studies on backfill strength forecasting also present the use of other machine-learning algorithms. In [59], the best results for predicting the uniaxial compressive strength of the fill mass (a cement material with a titanium tailing replacement) were obtained using a random forest model (RF) and the whale optimization algorithm (WOA). The authors in [59] used the Ti–tailing ratio, concentration, curing age, P.O42.5 cement ratio, and cement–sand ratio as input data.
Another previous study [60] noted that the strength of the fill mass is affected by factors such as the pulp concentration and cement content. According to the results described in [60], an artificial-neural-network-based long short-term memory (LSTM) with the gray wolf optimization algorithm (GWO) is the best way to express the nonlinear relationships between the bottom flow performance and the pulp concentration and cement content when forecasting the strength of the fill mass. The authors compared the model’s performance results with those of other optimization algorithms (particle swarm optimization (PSO) and SSA) and neural network architectures (BPNN, RBFNN, and GRNN), quantitatively proving the superiority of the performance of the GWO-LSTM model.
Thus, the analysis of literary sources allowed us to note the variability of algorithms used in forecasting the strength of the fill mass. Consequently, it is not possible to unambiguously state the superiority of any algorithm. As a result, the relevance of conducting empirical studies consisting of forecasting fill mass strengths, using data-mining models, and their comparative analysis for the conditions and materials described in this study is beyond doubt.
This paper presents the results of the quantitative modeling of the component compositions of backfills.
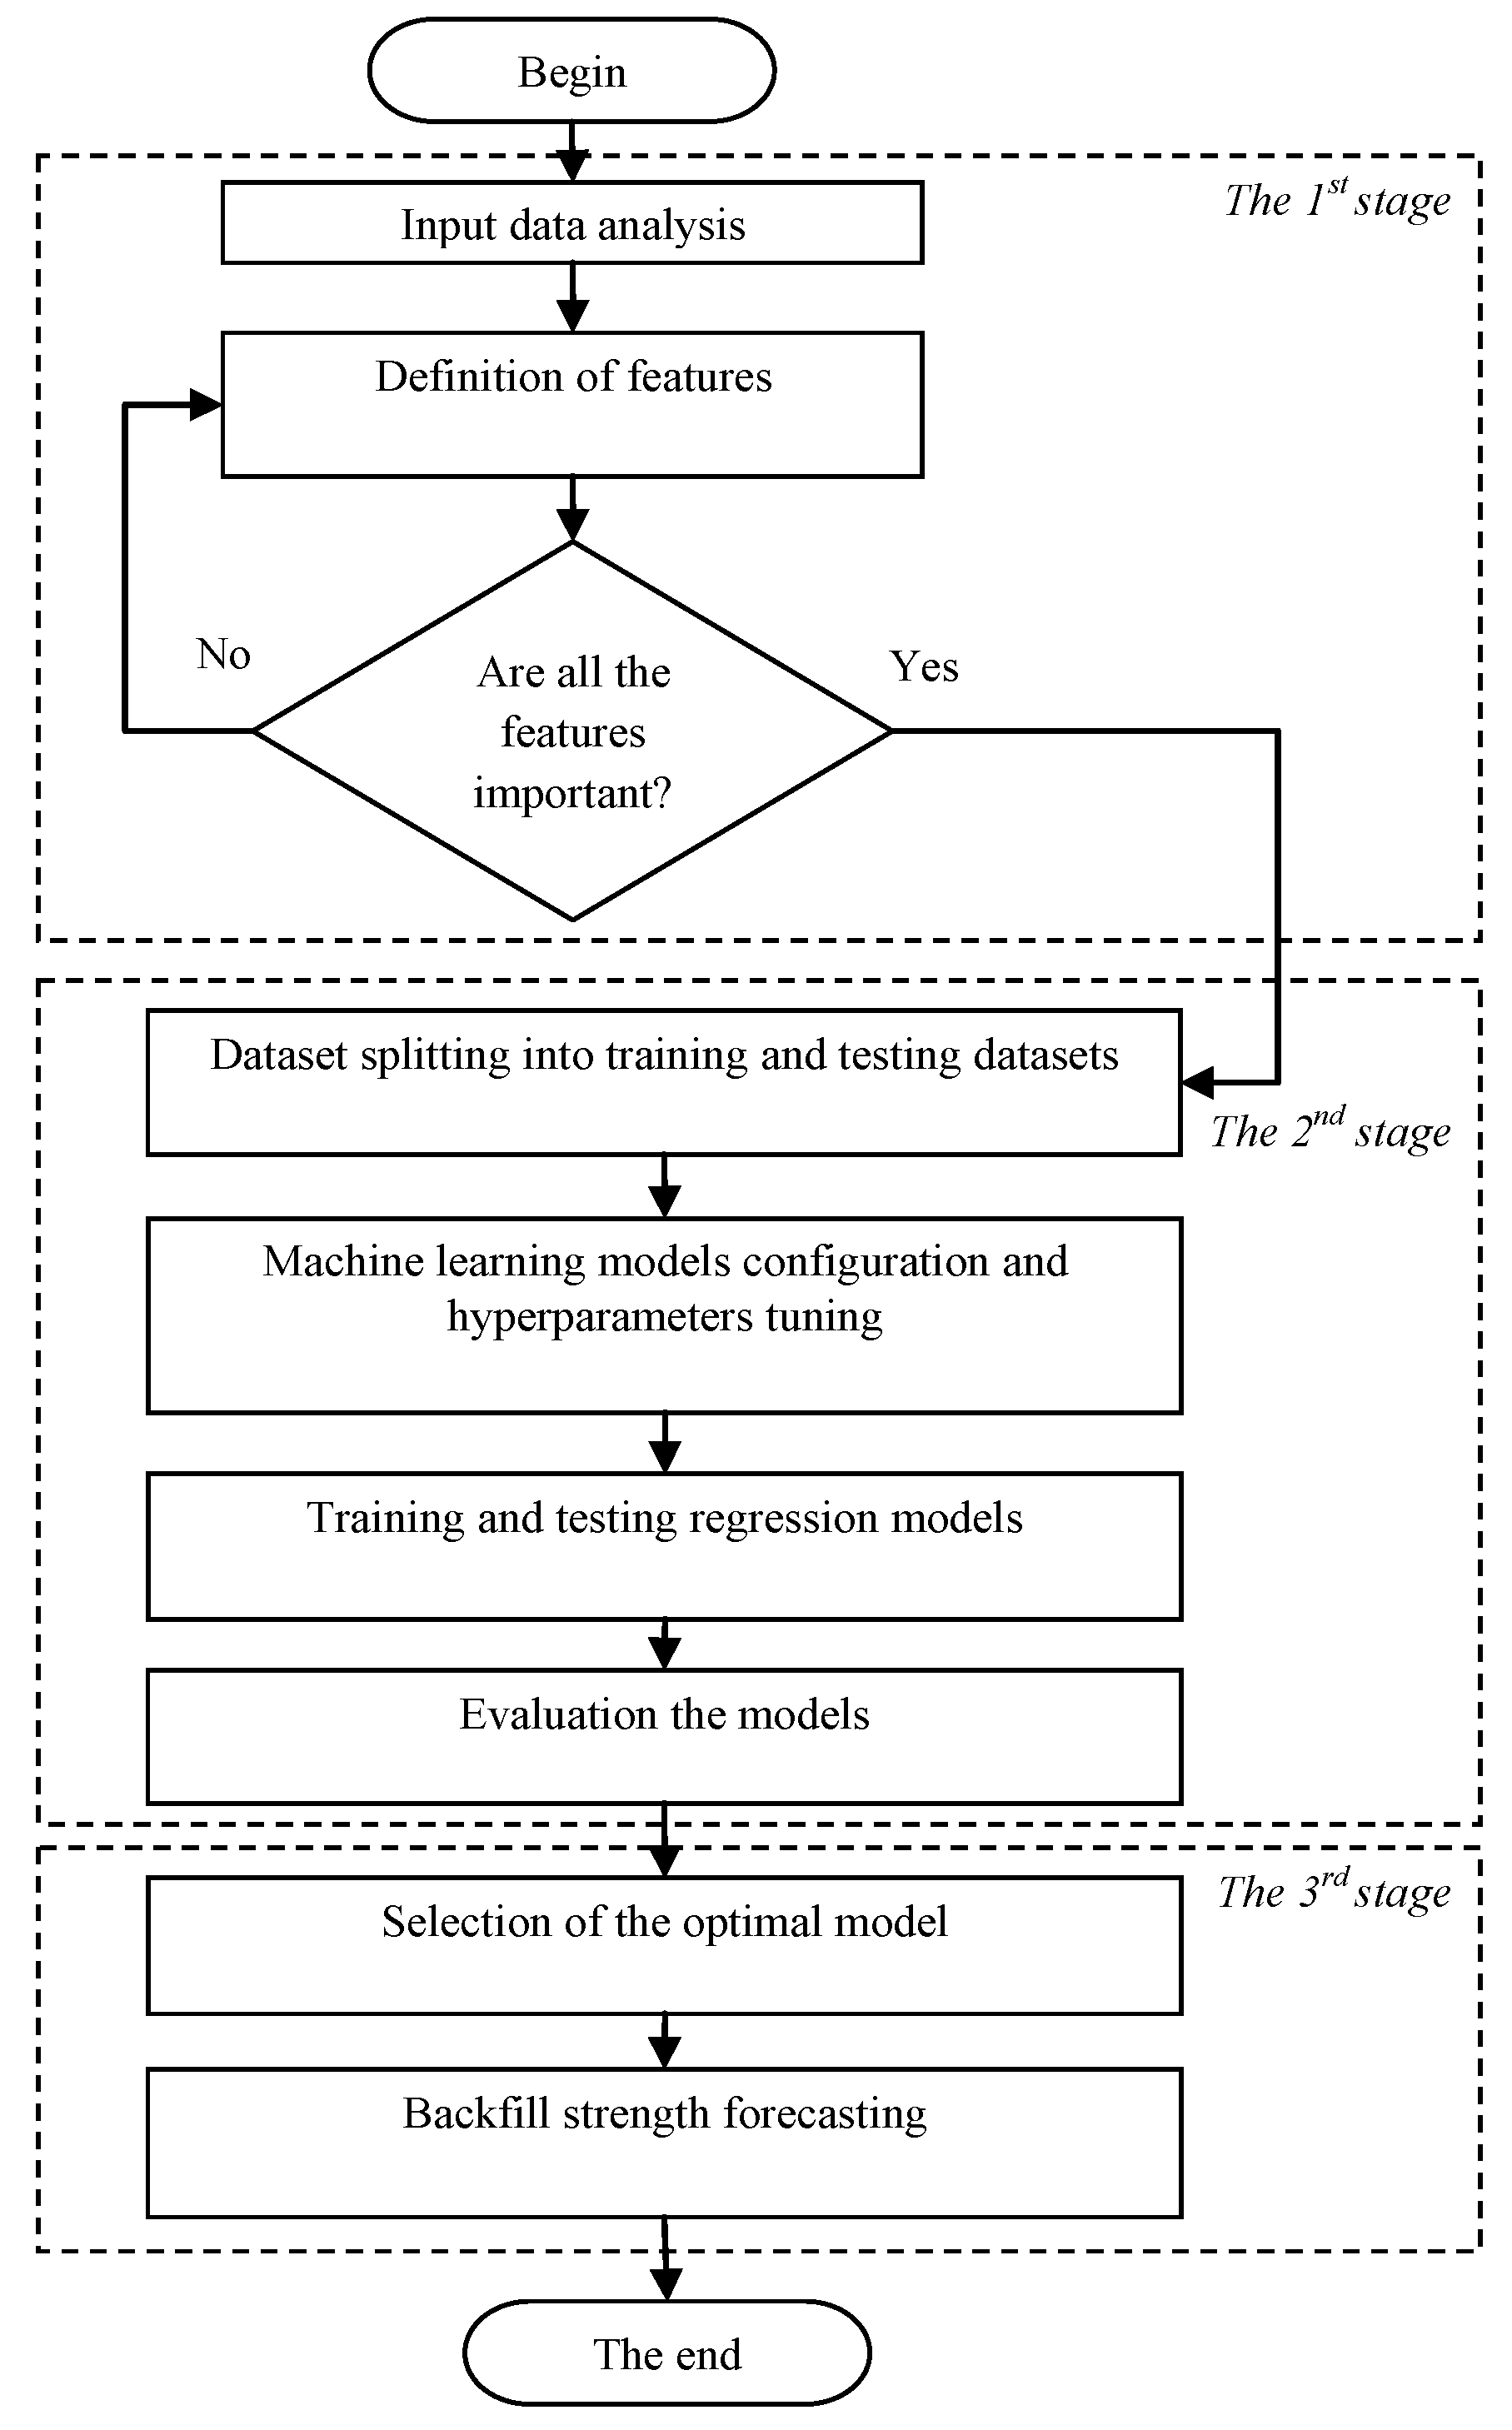
Figure 1 shows a flowchart of the main stages of the machine-learning application in this study: data preprocessing; data splitting into training and test datasets; evaluation of the results, using quality metrics; and forecasting of the fill mass strength. Previous papers [78,79] present the application of these stages in more detail.
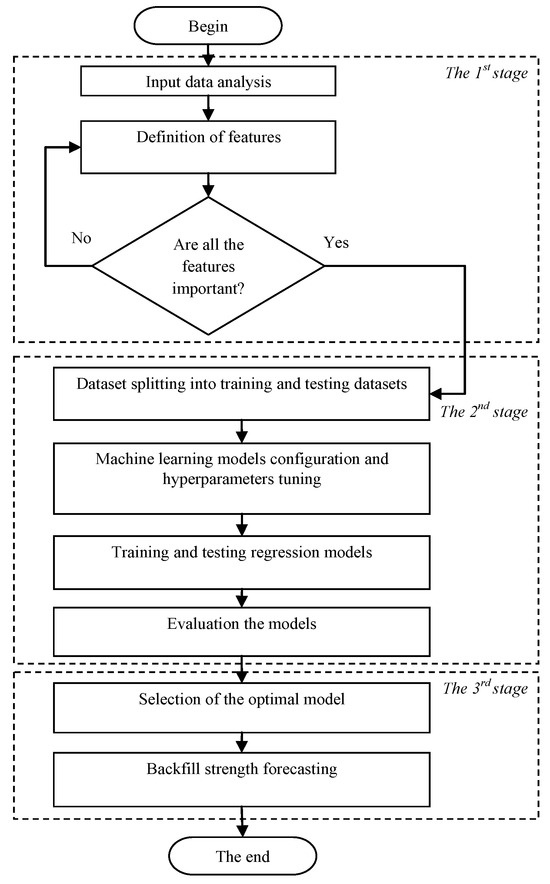
Figure 1.
Flowchart of the machine-learning application for backfill strength forecasting.
Forecasting of the samples’ strengths was performed using the Python programming language in a Jupyter Notebook and the following libraries: Numpy and Pandas (for calculations and data manipulation); Matplotlib and Seaborn (for data visualization); Scikit-learn, XGBoost, and CatBoost (for data preprocessing and loading regression model instances); and Keras for creating an artificial neural network.
At the preliminary stage of the calculations, the initial data were analyzed. The strengths of the samples (parameter: sigma_final) were adopted as the target results—the predicted values. The contents of the components (%) and the strengths of the actually tested laboratory samples (MPa) were selected as the features influencing the target results (Table 9).

Table 9.
Features influencing the strengths of the samples.
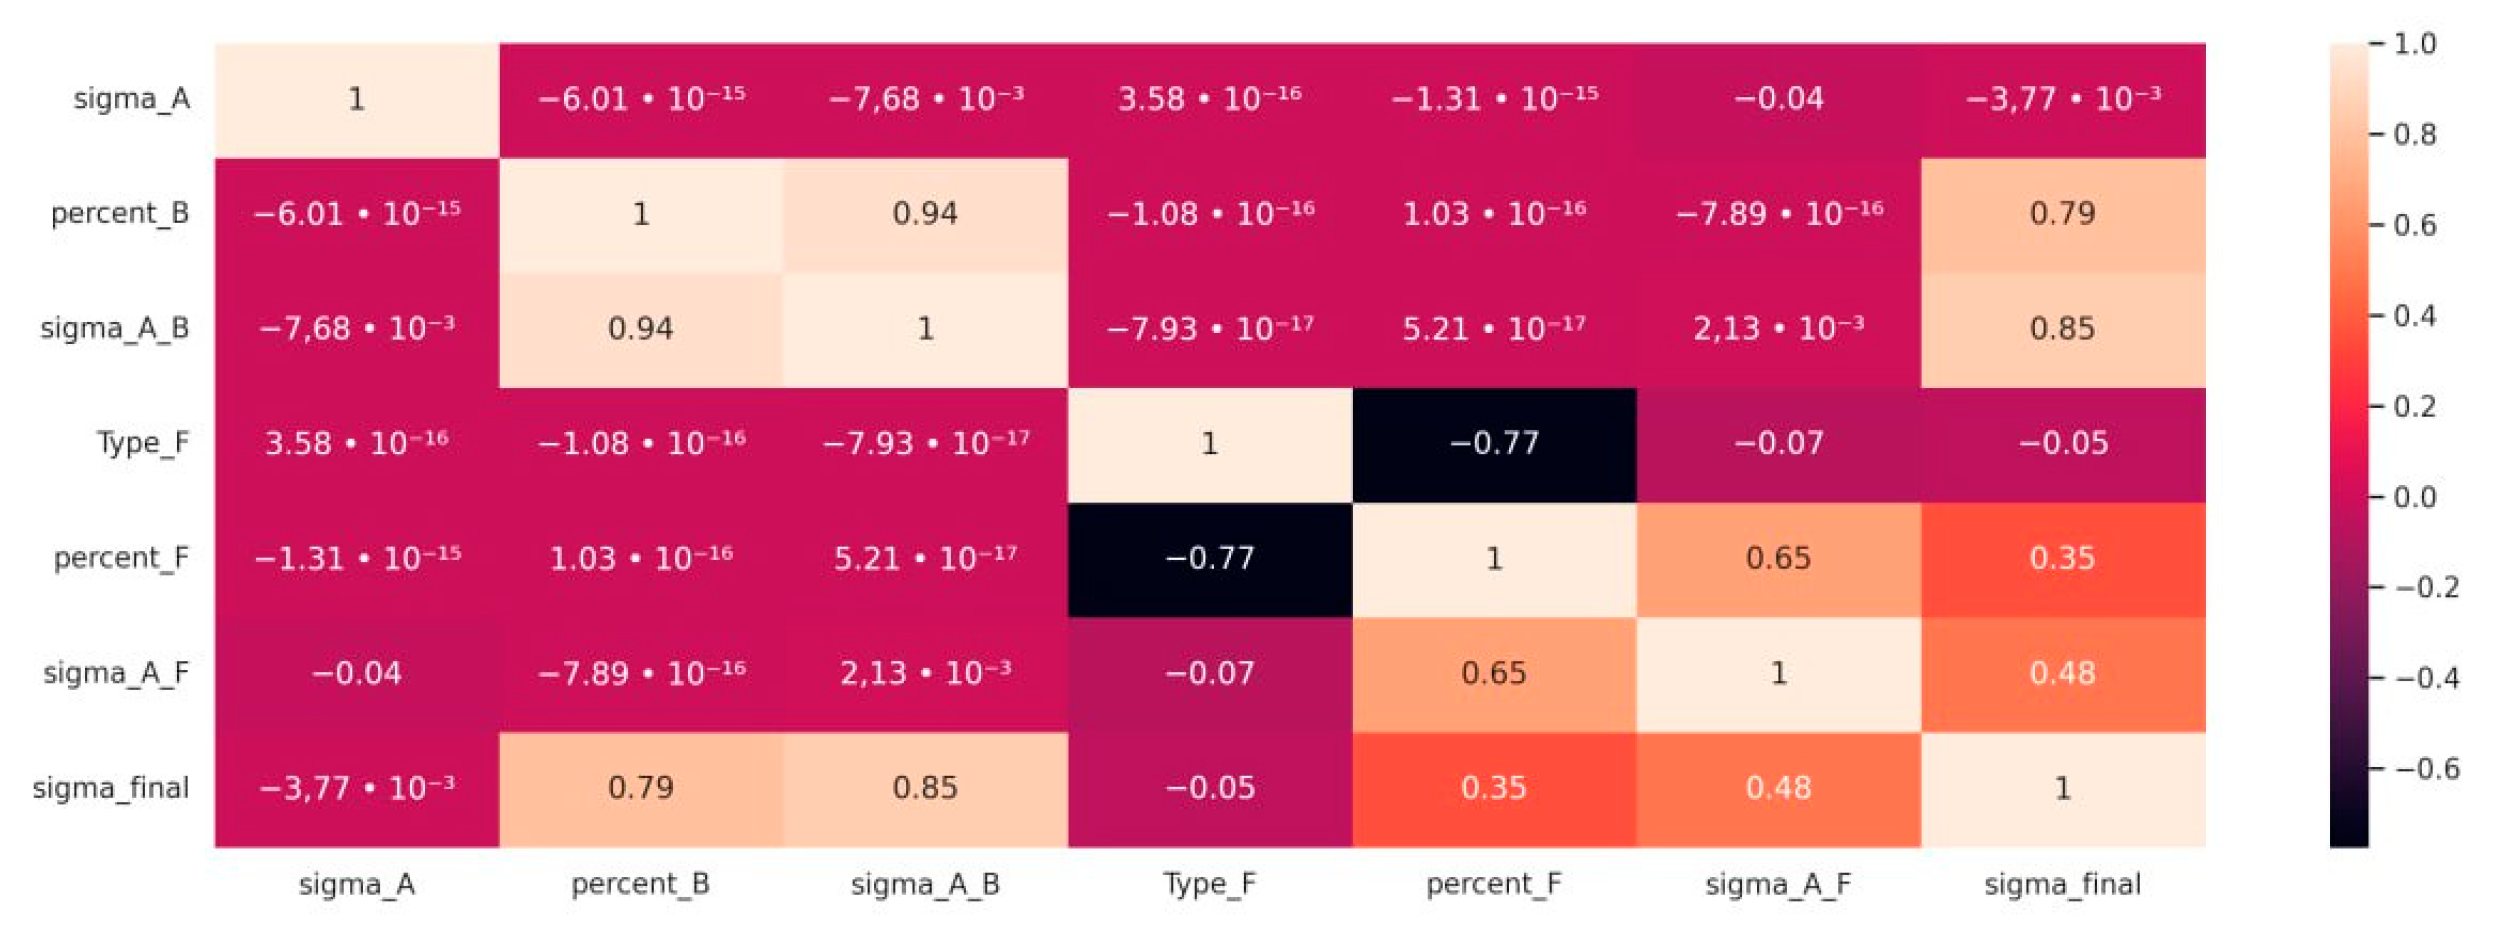
The linear relationships between the features and the targets were determined using the Pearson pair correlation coefficient (1) and are presented as a correlation matrix (Figure 2) as follows:
where is the Pearson pair correlation coefficient, x and y are the pairwise enumerated features, and σ is the standard deviation.
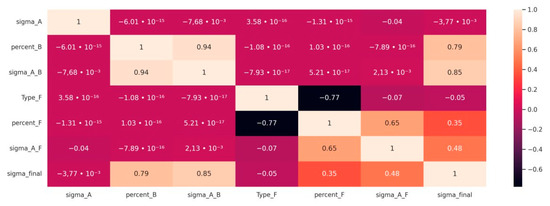
Figure 2.
Matrix of correlations between the features and target result.
In order to rank the influencing features, the information gain (IG) feature-filtering method was used. The core of this method consists of calculating the information entropy, , using Equation (2), and the relative entropy, , using Equation (3). Then, the difference between these values is calculated using Equation (4) as follows:
where is the probability that the variable will take the value ,
where is the entropy calculated for records for which ,
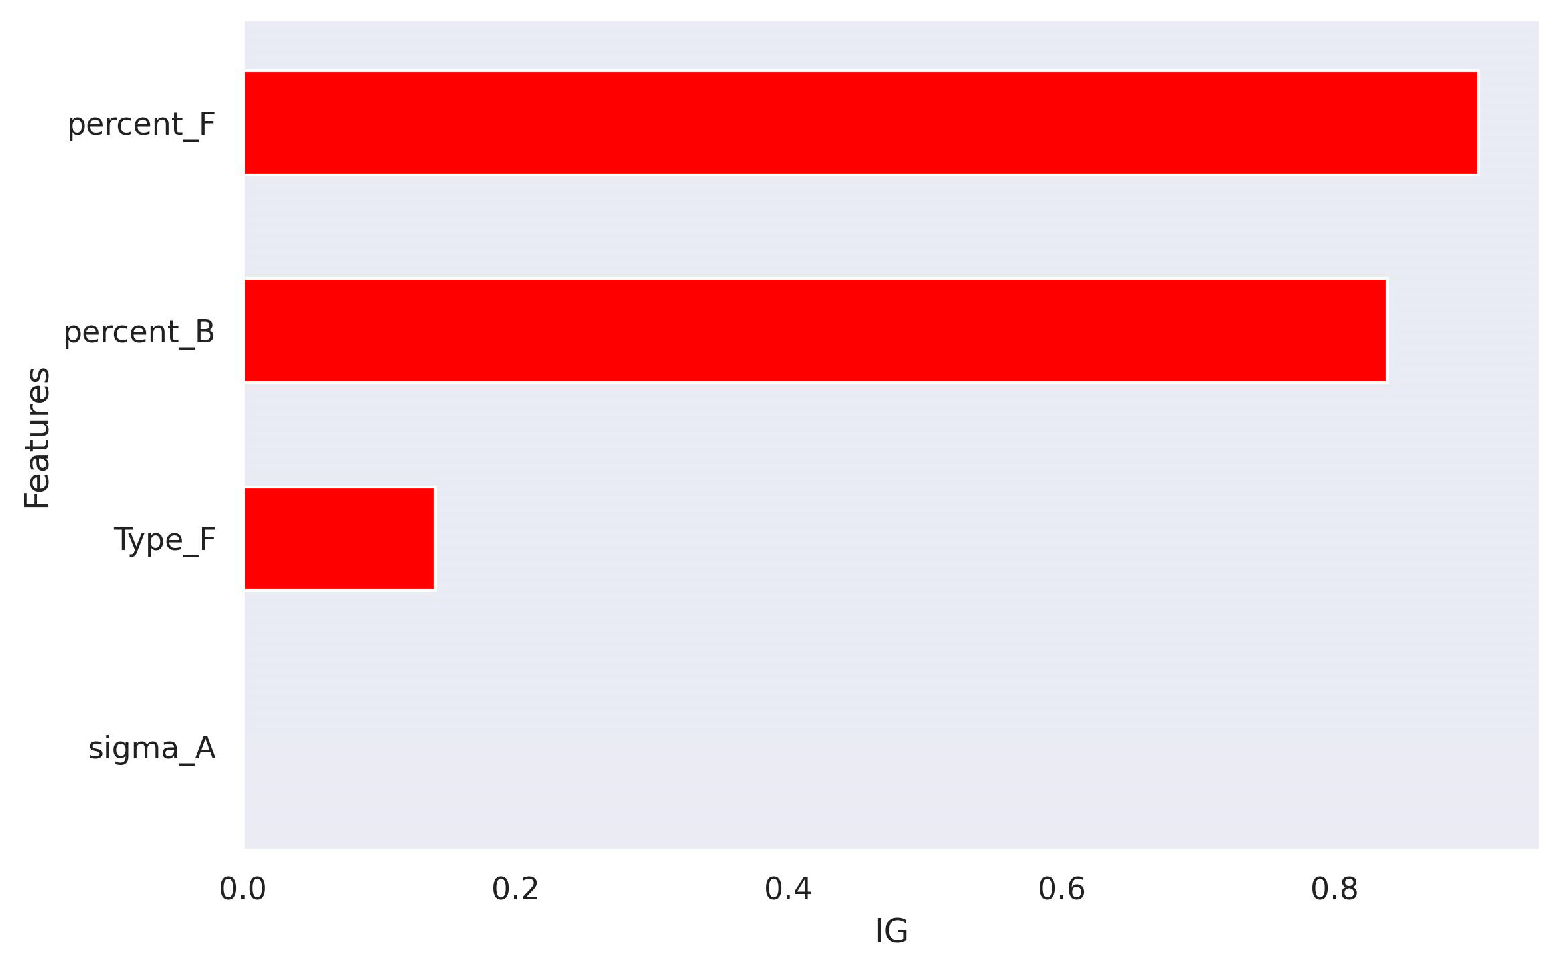
The obtained values characterize the relationships between the dependent variables and the target results: the higher the IG values, the more the factors affect the target variables; that is, IG is the amount by which the uncertainty about Y is changed by the information gain of each factor with respect to the target variable (Y) [79].
The results of applying information gain filtering show that when ranking the factors that have the greatest impacts on the strengths of backfills consisting of three components (A + B + F), the first place in importance should be given to the fiber content; the second place, to the slag content; and the third place, to the fiber type (Figure 3).
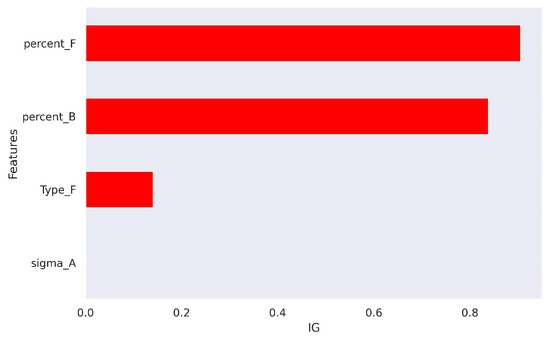
Figure 3.
Diagram of the influences of features according to the IG.
For different combinations of parameters, the correlations between the target variables and factors are calculated according to Equation (1); that is, for pairs of factors and target variables, the sums of all the values (which are different for each combination of parameters), the arithmetic means, the products, the standard deviations, etc. are calculated. All of this was performed for a sample consisting of 240 records—data from actual laboratory experiments. Despite the strong linear dependence between some factors and the target variable (rsigma_A_B/sigma_final = 0.9, rpercent_B/sigma_final = 0.8, and rsigma_A_F/sigma_final = 0.5), there is a nonlinear nature of the relationship between the strength data from the factors we described; that is, the values of the Pearson pair correlation coefficients do not fully reveal the relationships between the data. Therefore, a study of the feature space and its impact on the target result was carried out in accordance with the entropy approach of the information gain, which allowed us to obtain slightly different results. The nonlinear structure of the data is confirmed further in this study: The linear regression model has less reliability compared to those of machine-learning methods.
The records obtained as a result of performing laboratory experiments (240 data rows in total) were used as training and test samples. The ratio of the training to the test datasets was 80:20; that is, 192 records of laboratory experiments were used for training and 48 for testing. When splitting the data using the train_test_split function, the shuffle parameter was set to True; that is, data were added to the test and training sets in a random order, which is necessary for better generalization of the algorithms. The features of the training and test datasets were standardized according to the Z-normalization methodology, Equation (5), to bring the original data to the same scale and combat overfitting of the models.
The quality of the predictive models is justified by the need to consider errors on relative and absolute scales and was carried out using the following metrics: the mean absolute percentage error (MAPE), calculated according to Equation (6); the mean absolute error (MAE), calculated according to Equation (7); and the determination coefficient (R2), calculated according to Equation (8).
In order to create predictive models, regression algorithms of varying complexities were selected, such as linear regression (LR), the random forest regressor (RFR), the extreme gradient-boosting regressor (XGBoost), the CatBoost regressor (CatBoost), multi-layer perceptron (MLP), and artificial neural networks RBFNN and LSTM. The choice of algorithms is justified by their different computational complexities (which will allow a comparative analysis of their applications under the same conditions) and the ambiguity of recommendations in the literature [58,59,60,83], in terms of choosing models for predicting the strengths of backfills and the researchers’ own experiences [78,79].
For the reproducibility and stability of the algorithms, an initial random number was set. The random number (random_state) was selected as a result of a series of experiments (the results were assessed according to the MAPE, R2) and was set at 42.
Table 10 presents the values of the model parameters selected using the GridSearchCV cross-validation tool and a series of experiments. Given that the dataset is small, the probability of overfitting was taken into account when using neural network models, so several mechanisms were used to combat overfitting: data normalization, the early stopping parameter of the algorithm (EarlyStopping), and the Dropout layer. The deviations of the metrics of the training and test datasets were also compared.

Table 10.
Model hyperparameter values and network architectures.
During the assessment of the quality of the forecast models, it was found that similar results were obtained using the LSTM recurrent neural network model and the RFR random forest model. The forecast error of both models does not exceed 2% (in the test dataset sample, MAPE RFR = 1.86% and LSTM = 1.79); therefore, they can be used in forecasting (Table 11). From the point of view of the overfitting of neural network models, it can be concluded that there is no or minimal overfitting because the quality metrics of the models in the training and test datasets differ insignificantly.

Table 11.
Forecast quality metrics.
The choice was made in favor of the random forest model because it takes less time and computing resources to obtain a forecast and train the model. Based on the model, 720 forecast strength values of samples with various formulations were obtained, where the initial data (features) were composition variations.
3. Results
Based on the uniaxial compression tests and machine-predicted backfill strengths, the following key results were obtained:
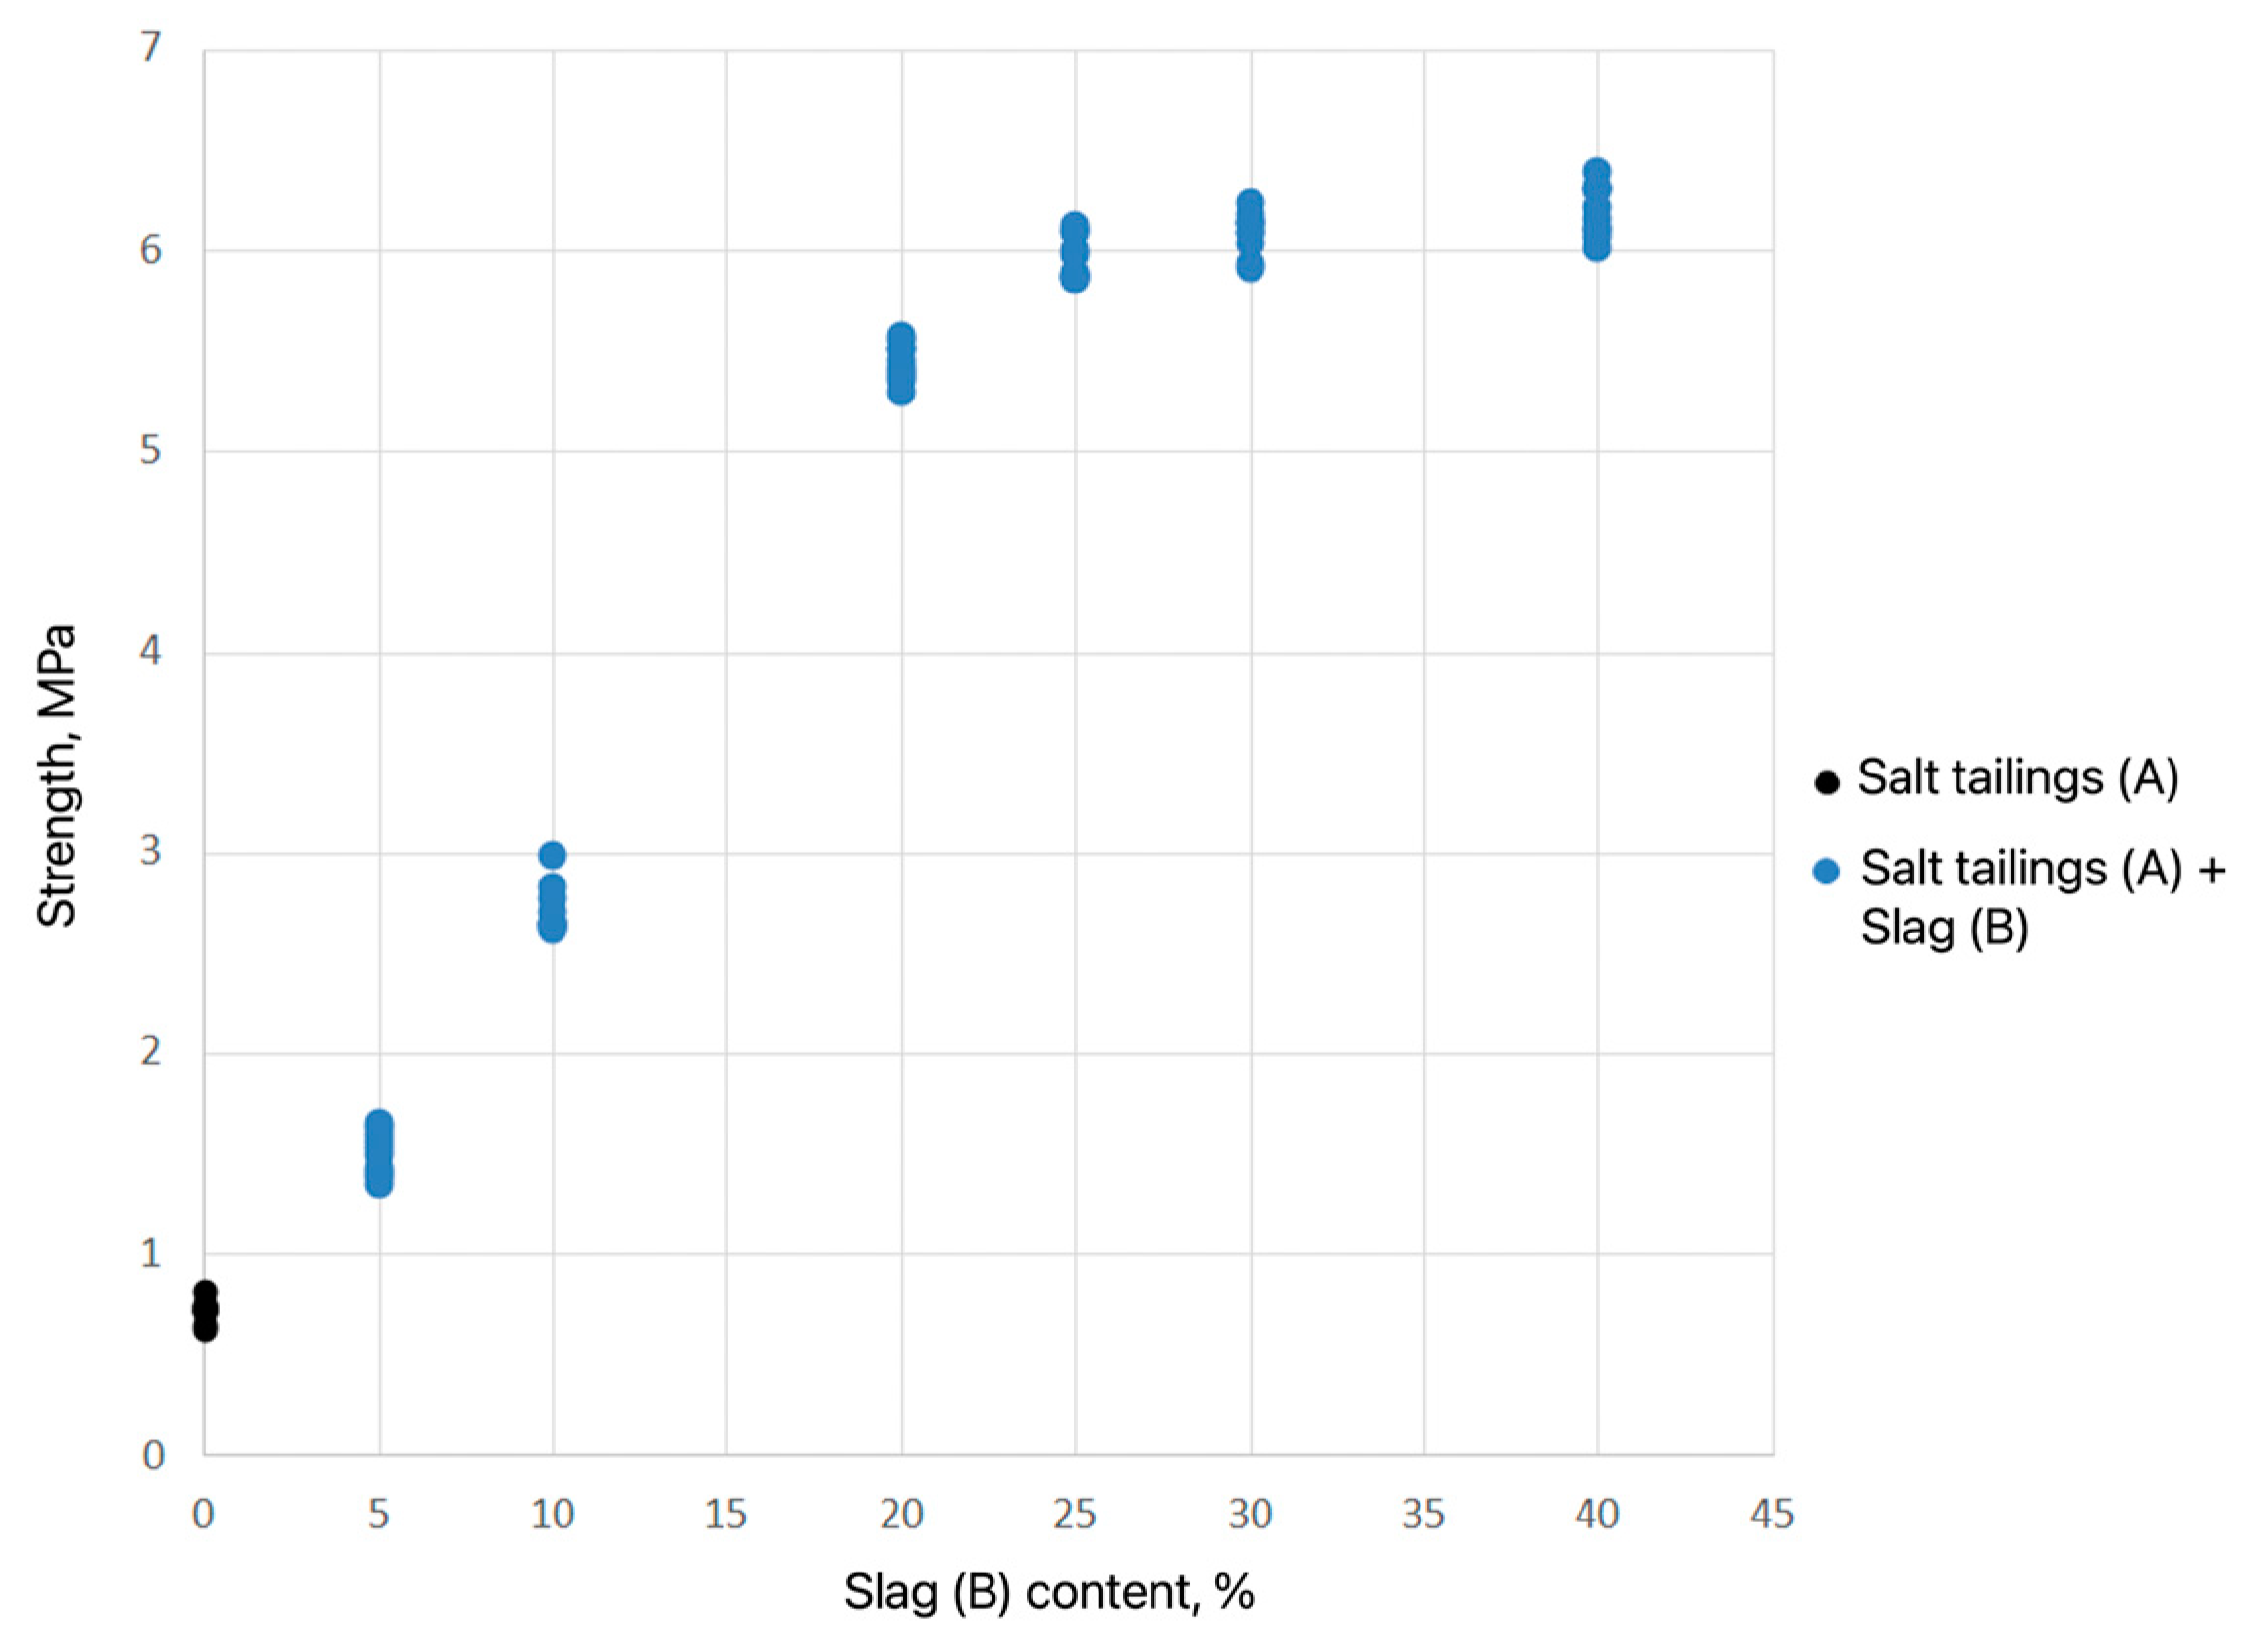
The compressive strength of the samples made solely from salt tailings was 0.72 MPa. The binder (blast furnace slag) increased the strength to 1.5 MPa at a slag content of 5% and to 6.0 MPa at a slag content of 25%. Further increases in the slag content beyond 25% had from little to no effect on strength improvement (Figure 4).
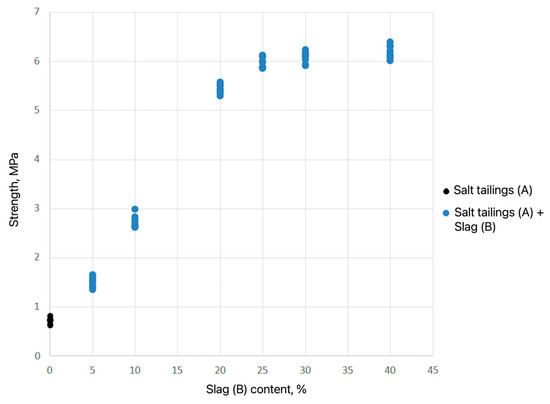
Figure 4.
Dependence of the strengths of the laboratory samples (A + B) on the binder content (smelter slag).
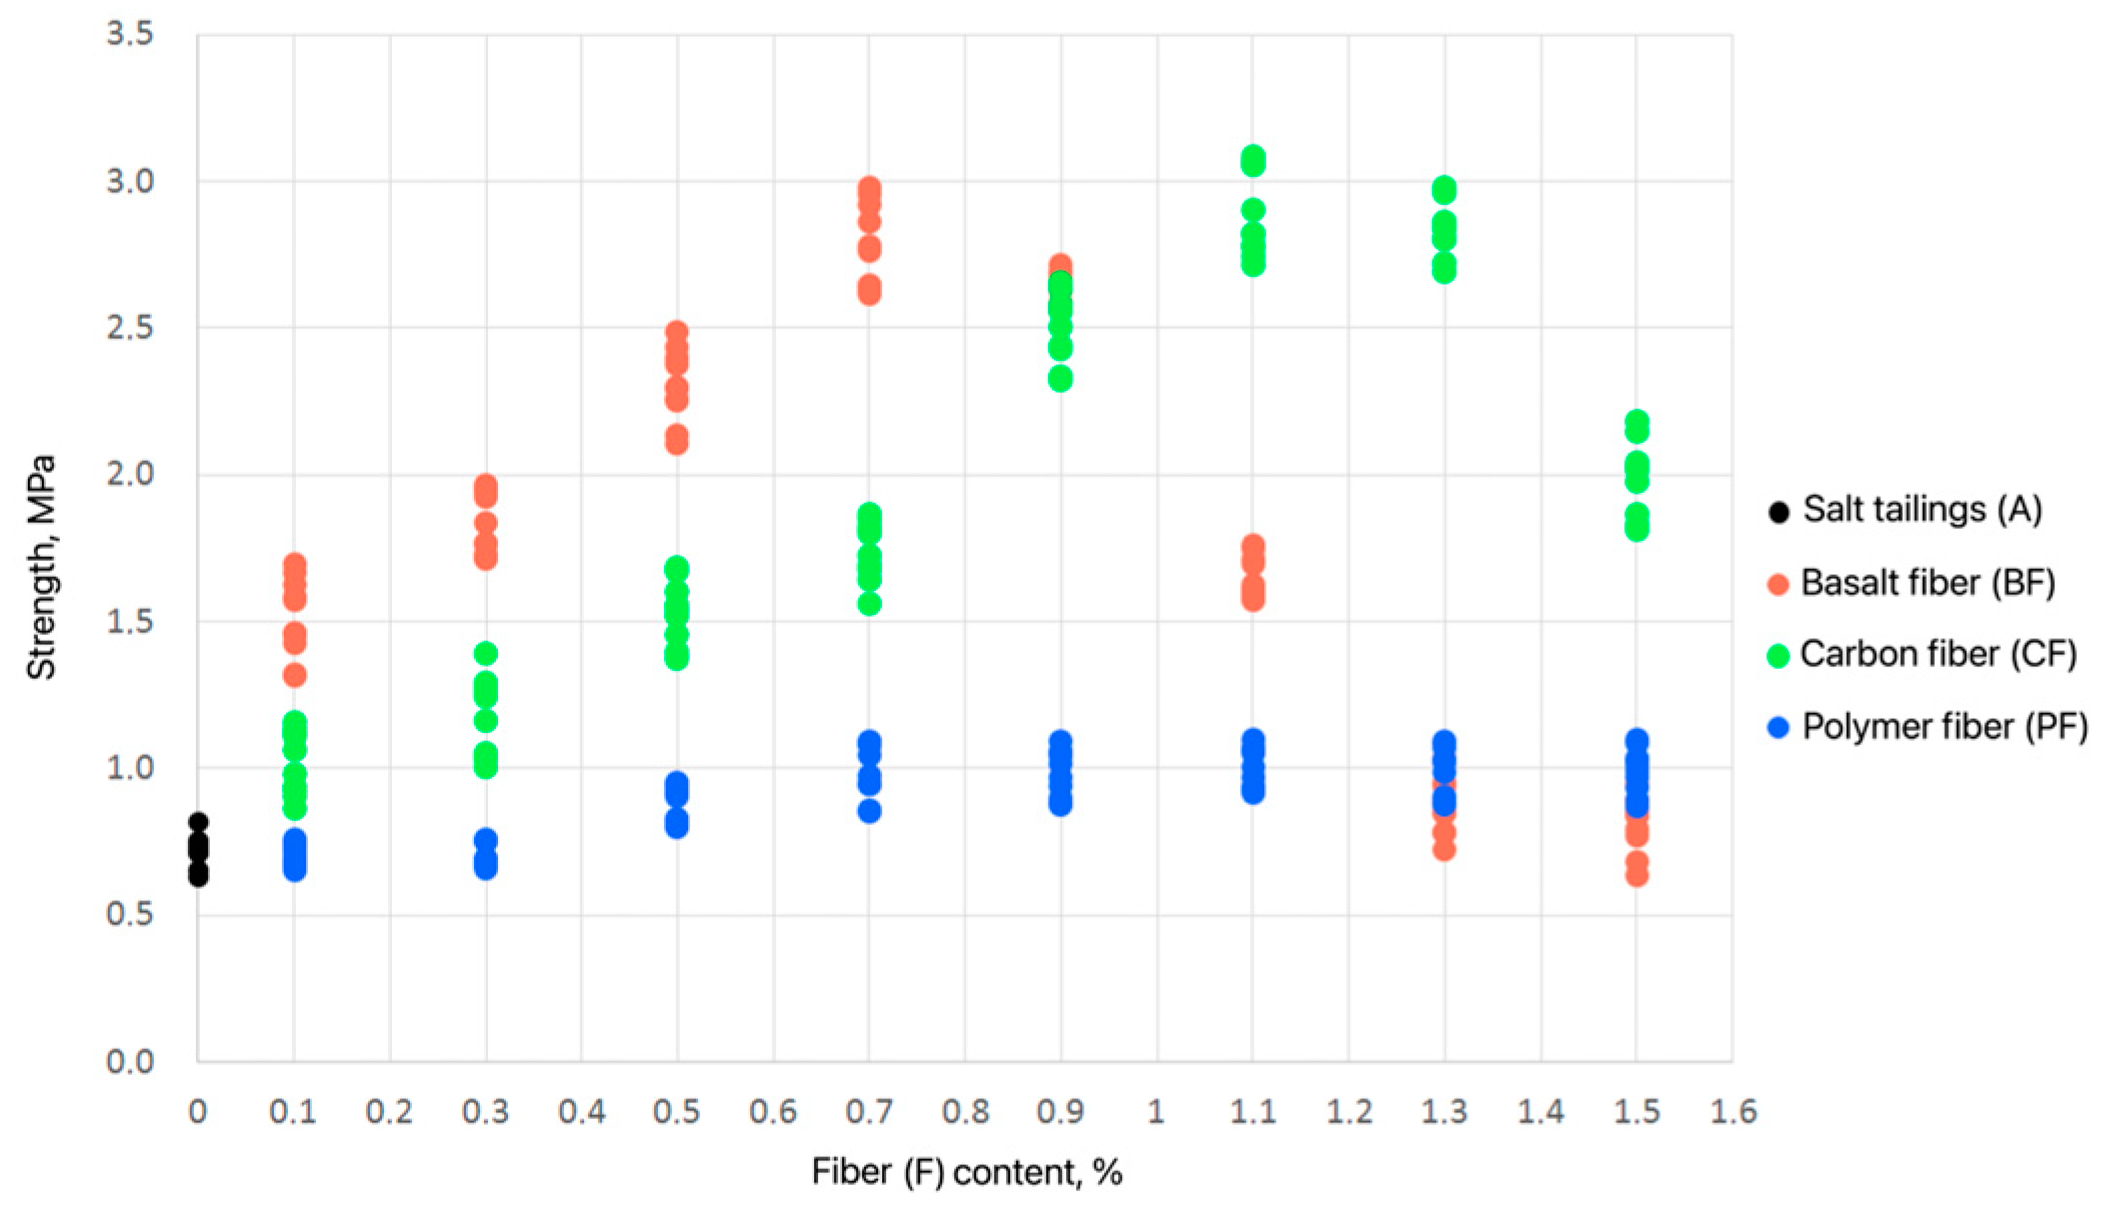
Tests of samples with fibers (A + F) showed the greatest strength increases when basalt fiber (BF) and carbon fiber (CF) were added at 0.7% and 1.1%, respectively (Figure 5). The average strength values were 2.78 MPa for BF and 2.87 MPa for CF, which are roughly comparable, although the application of CF is characterized by higher material expenditure. Further increases in the fiber content resulted in reduced strength.
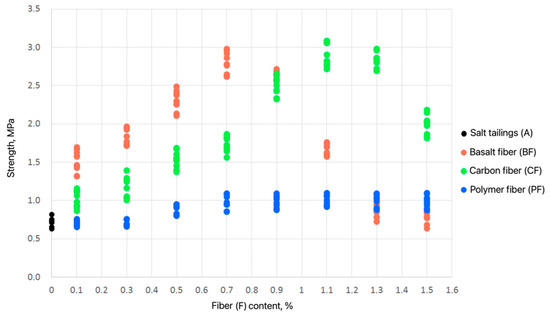
Figure 5.
Dependence of the strength of the laboratory samples (A + F) on the type and content of the fiber.
Polymer fiber (PF) produced only a minor strength increase, with a maximum strength of 1.0 MPa at 0.7% PF content. Additional increases in the PF content had no effect on the strength improvement. Because of its insignificant impacts on strength properties, polymer fiber was excluded from further research.
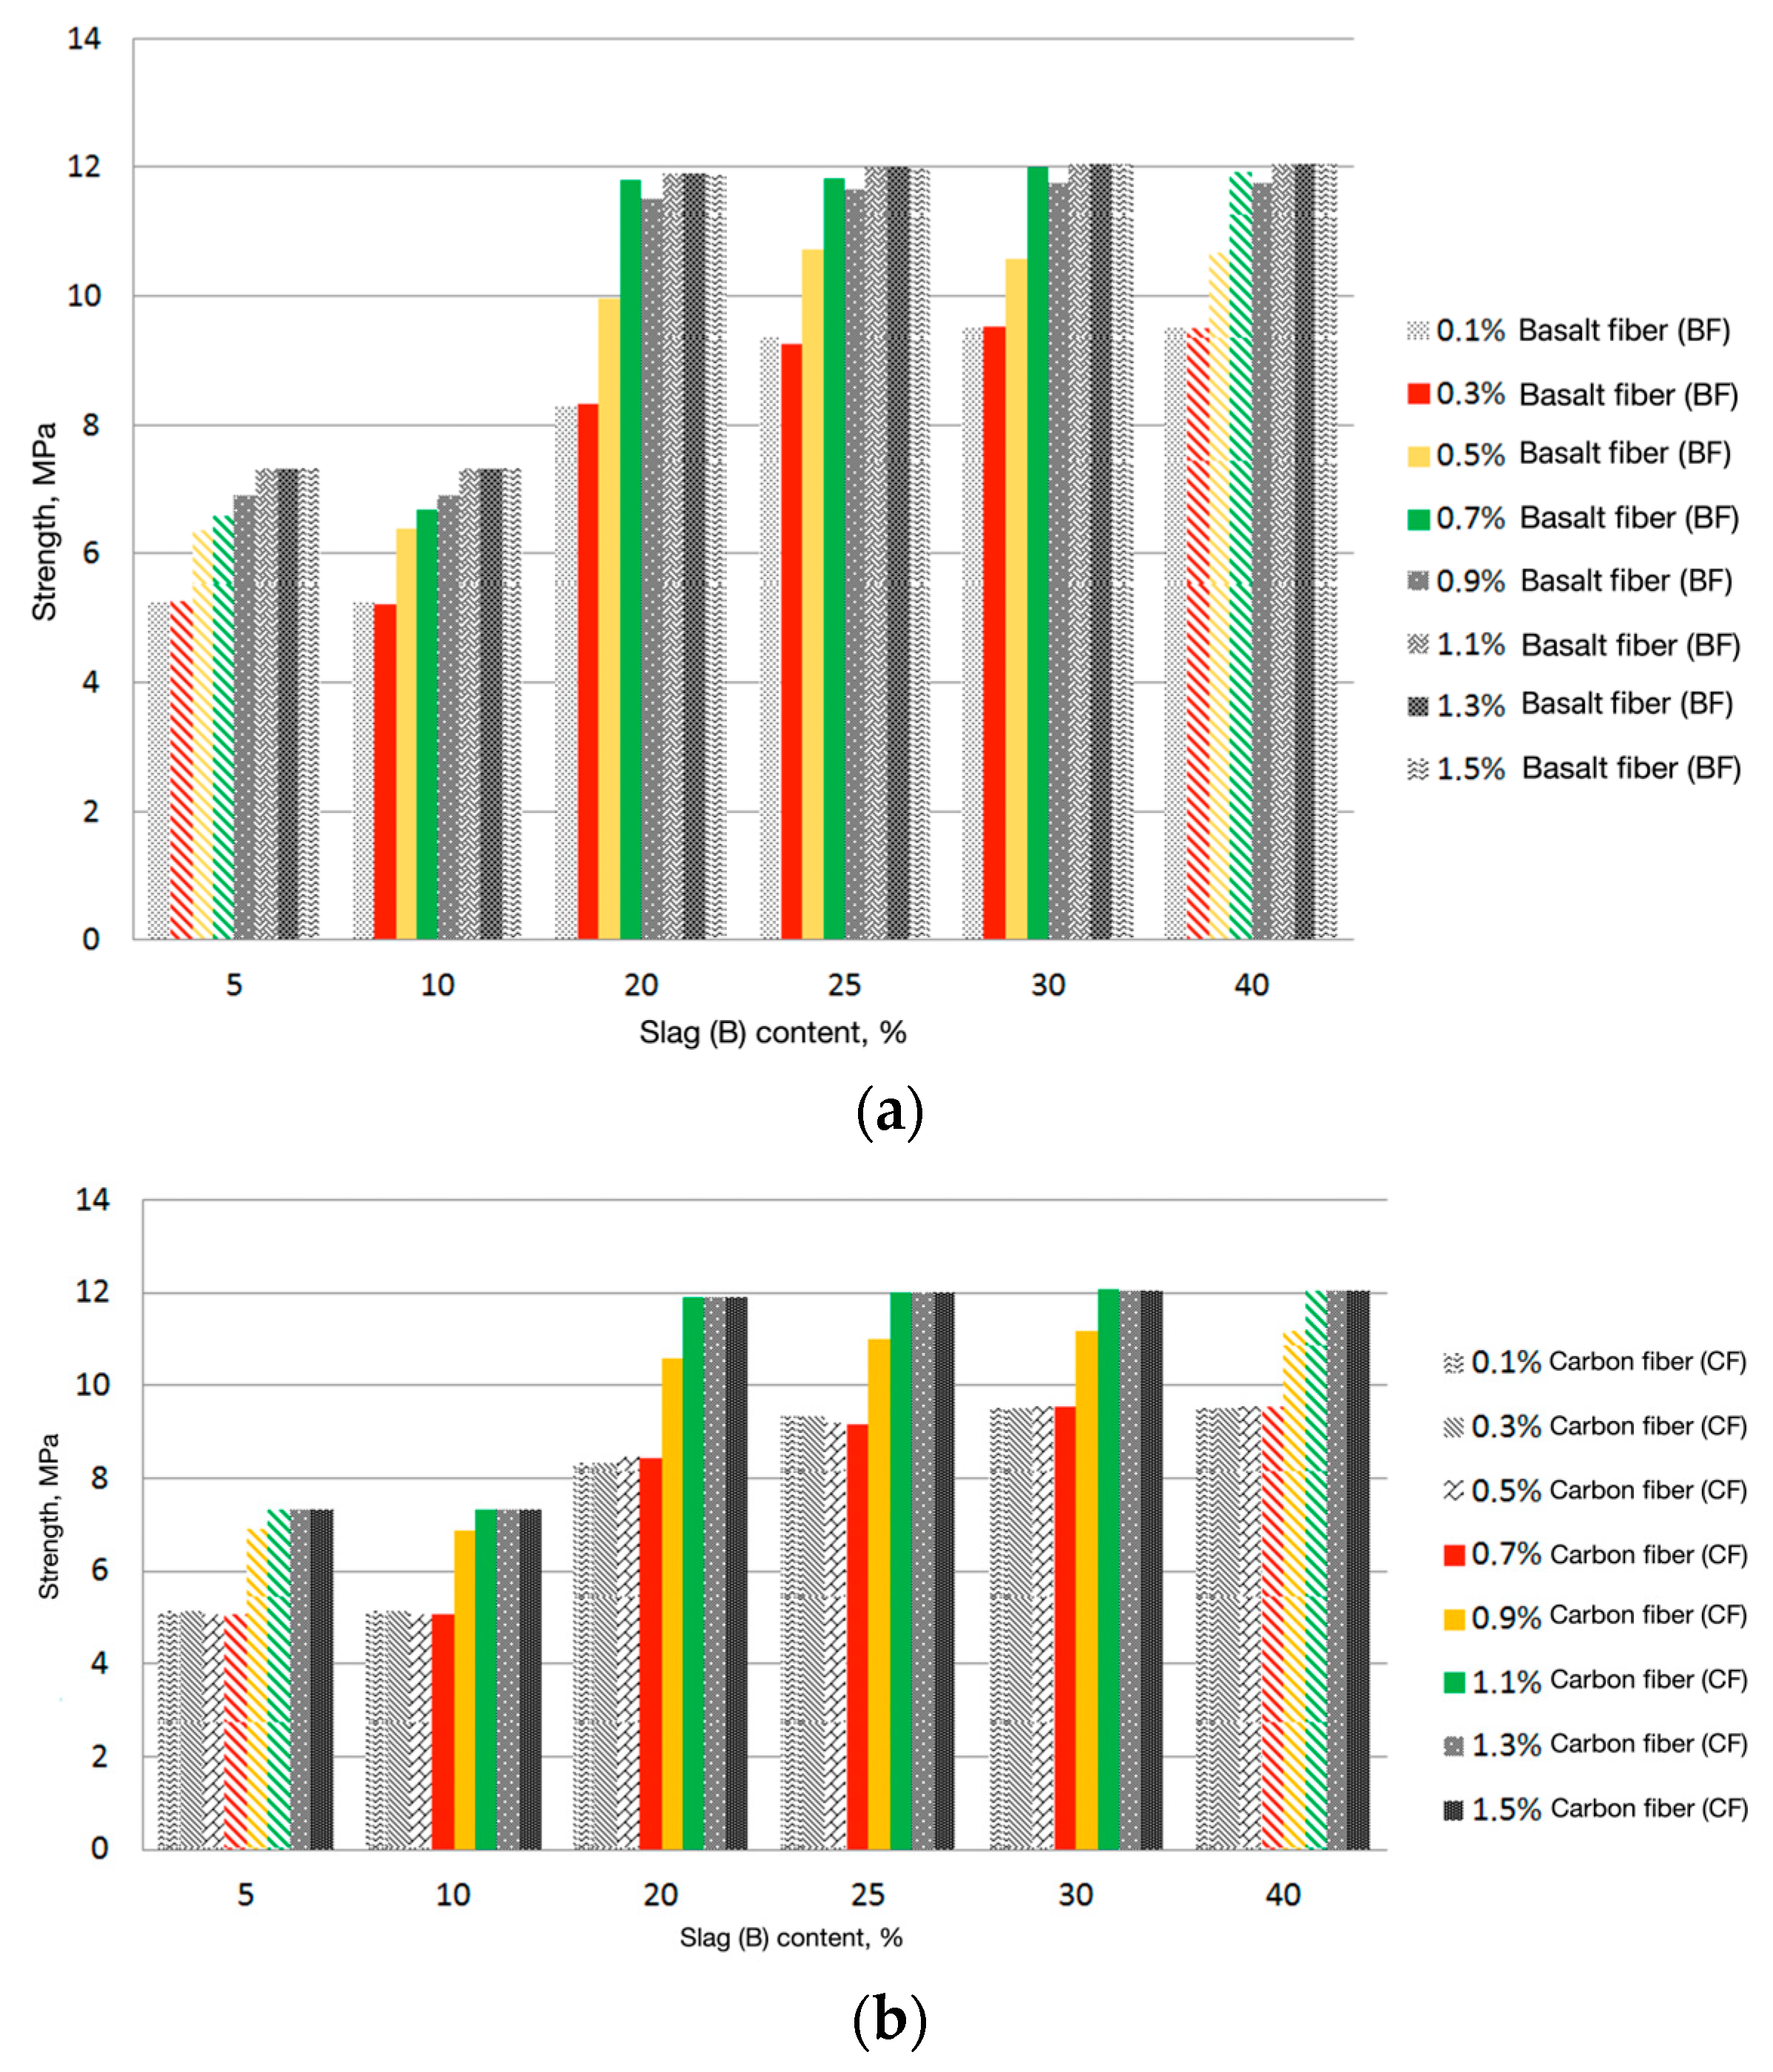
The combined results of physical laboratory tests and machine-learning predictions for three-component materials are presented in Figure 6. The maximum compressive strength achieved was 12 MPa. These values were attained with various combinations and proportions of A, B, and F.
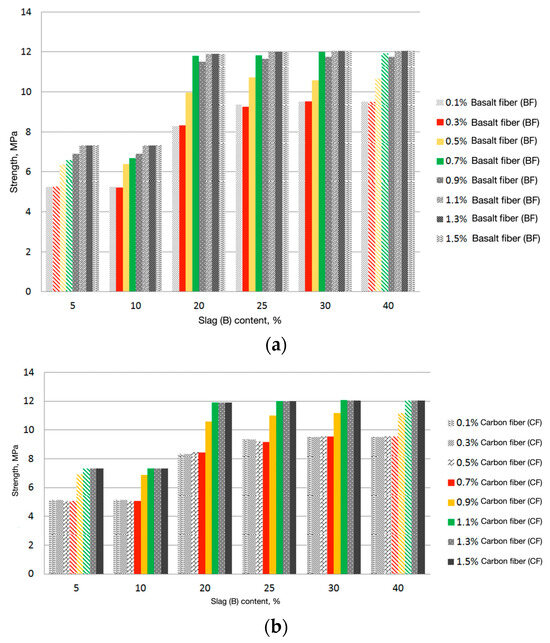
Figure 6.
Strength of three-component materials (A + B + F) (solid fill—laboratory tests; patterned fill—machine-learning algorithms): (a) composition with basalt fiber (BF); (b) composition with carbon fiber (CF).
4. Discussion
The implementation of the proposed technology [5] with the developed backfill undoubtedly requires the justification of the economic feasibility. This issue is quite complex because the advantage of this technology is expressed in several areas at once. First of all, it increases the mineral extraction rate; second, mine safety. In the practice of potash deposit exploitation in different countries, there are numerous cases of the emergency flooding of potash mines. Most often, water breakthroughs ultimately lead to a complete loss of reserves and closure of the mine. In addition, world experience shows that accidents are often associated with karst processes. Sudden subsidence can lead to the loss of land areas and pose dangers to cities, buildings, the functioning of railway routes, thermal power plants, and the industrial facilities of the mine located in this area, as well as increase emissions and explosions of natural gas. All these consequences are closely related to the third area—ecology [85,86,87,88]. In addition to the above, backfill based on industrial waste allows for the preservation of the environment by reducing the areas allocated for waste dumps and water and air pollution. This will reduce the costs of the construction and maintenance of waste dumps and compensate and eliminate environmental damage in the field of mining.
The bottleneck of this technology, in terms of cost effectiveness and technological efficiency, is the need for stowage operations. However, such a need for modern potash mines is already dictated by the very negative experience of potash mining. Therefore, the costs of the stowage complex, as well as the entire range of complex organizational and technological problems that arise during its operation, can be considered as inevitable for new potash mines under design. In this regard, the need for large-scale stowage operations should not be considered solely as a shortcoming of this technology.
The compressive strengths of backfills based only on waste tailings do not exceed 1–4 MPa. This case will probably reduce the intensities of dangerous geomechanical processes but will not solve the main problem of reducing the loss of a large amount of minerals in the subsoil.
Thus, an economic feasibility study must be carried out taking into account all the areas, which is certainly a subject for future research.
The problems of experimental studies, which are regulated by scientific methods, are also a debatable issue.
It is worth noting the importance of complex environmental factors present in potash mining (temperature, humidity, and groundwater chemical composition [46,89]), as well as technological issues of technology application (material sourcing, large-scale mixing, as well as long-term durability [90,91,92]), which can vary significantly at different enterprises. In addition, the behavior of the hardened fill mass must be studied from the point of view of microstructural analysis, which is important in the development of new materials. These issues must be considered and studied for the specific conditions of a mining enterprise.
From the point of view of computer-modeling development, a promising direction for further research is to increase the sample size, which involves taking into account other component compositions and laboratory experimental data, in order to increase the reliability of modeling the strength of the fill mass. It is also important to use other methods of data mining for comparative analysis, more comprehensive generalization of the results, and the creation of methodological approaches, in terms of modeling the strength of the fill mass.
5. Conclusions
Artificial fill masses, based on salt tailings, with enhanced strength, open up new possibilities for implementing several-stage stoping at potash deposits while ensuring the necessary support for the water-protective layer, even at greater depths.
In the scope of this study, it was proposed to use smelter slag as a binder and fiber as a reinforcing component in the formulation of backfills. Combining these components with salt tailings yielded the following results: Adding fiber to salt waste increased the compressive strengths of the samples to approximately 3 MPa, adding slag achieved compressive strengths of up to 6 MPa, and combining fiber and slag allowed compressive strength values to reach 12 MPa.
Because the compressive strengths of hydraulic fill masses based on waste tailings do not exceed 1–4 MPa [53,54,55], the three-component material increases the strength of the fill mass by at least three times.
To further enhance the fill mass strength, high-modulus fibers made from materials with higher elastic moduli than that of concrete (19–34.5 GPa) should be used. The high-modulus fibers significantly improve the tensile and compressive strengths of materials, their resistance to static deformations, and their crack resistance. Thus, the higher the elastic modulus, the greater the final material strength.
6. Patents
There is patent with the title “Backfill composition” resulting from the work reported in this manuscript: registration number 2024114126; the date of registration is 24 May 2024; patent holder: Empress Catherine II Saint Petersburg Mining University.
Author Contributions
Conceptualization, E.K., R.K. and M.K.; methodology, E.K. and R.K.; software, A.M.; validation, A.M.; formal analysis, A.M. and C.K.-S.; investigation, C.K.-S.; resources, C.K.-S.; data curation, A.M. and C.K.-S.; writing—original draft preparation, E.K.; writing—review and editing, C.K.-S. and A.M.; visualization, C.K.-S. and A.M.; supervision, E.K. and C.K.-S.; project administration, M.K. and R.K. All authors have read and agreed to the published version of the manuscript.
Funding
This research received no external funding.
Institutional Review Board Statement
Not applicable.
Informed Consent Statement
Not applicable.
Data Availability Statement
All data generated or analyzed during this study are included in this published article.
Conflicts of Interest
Author Marat Khayrutdinov was employed by the
Itasca Consultants GmbH. The remaining authors declare that the research was conducted in the absence of any commercial or financial relationships that could be construed as a potential conflict of interest.
References
- Zubov, V.P. Applied technologies and actual problems of resource saving during underground development of bedded mineral deposits. Gorn. Zhurnal 2018, 6, 77–83. [Google Scholar] [CrossRef][Green Version]
- Schleinig, J.-P.; Höntzsch, S.; Barnasch, J.; Günther, M.; Jungmann, O.; Zienert, H.; Knauth, M.; Günther, R.-M. A new technology to increase the extraction rate in potash mining areas—An approach for a safe secondary mining concept. In New Challenges in Rock Mechanics and Rock Engineering, 1st ed.; CRC Press: Boca Raton, FL, USA, 2024; pp. 772–777. ISBN 9781003429234. [Google Scholar]
- Sanmiquel, L.; Bascompta, M.; Vintró, C.; Yubero, T. Subsidence Management System for Underground Mining. Minerals 2018, 8, 243. [Google Scholar] [CrossRef]
- Kowalewski, O.; Śpiewanowski, P. Stock Market Response to Potash Mine Disasters (March 3, 2017). IESEG Working Papers 2017-ACF-02. 2017. Available online: http://www.ssrn.com/abstract=2926890 (accessed on 28 January 2025). [CrossRef]
- Kovalski, E.R.; Kongar-Syuryun, C.B.; Petrov, D.N. Challenges and prospects for several-stage stoping in potash minining. Sustain. Dev. Mt. Territ. 2023, 15, 349–364. [Google Scholar] [CrossRef]
- Sidki-Rius, N.; Sanmiquel, L.; Bascompta, M.; Parcerisa, D. Subsidence Management and Prediction System: A Case Study in Potash Mining. Minerals 2022, 12, 1155. [Google Scholar] [CrossRef]
- Kaskiw, L.M.; Morgan, R.M.; Ruse, D.C. Backfilling at IMC Canada K-2 potash mine. In Innovations in Mining Backfill Technology; CRC Press: Boca Raton, FL, USA, 2021; pp. 315–325. [Google Scholar] [CrossRef]
- Wang, J.; Zhang, Q.; Li, M.; Liu, H.; Zhu, C. Effect of Compressive Behaviours of Tail Salt Filling Materials on Roof Deformation in Potash Mine. Adv. Civ. Eng. 2021, 2021, 6678258. [Google Scholar] [CrossRef]
- Karasev, M.A.; Petrushin, V.V. Methodological issues in determination of initial parameters for modeling deformation of rock salt as a polycrystalline discrete medium. MIAB Min. Inf. Anal. Bull. 2024, 9, 47–64. [Google Scholar] [CrossRef]
- Zabulonov, Y.; Khevpa, Z.; Bahrii, I.; Kryl, I.; Vyzhva, S. Analysis of natural and technological factors of changes in exogeodynamic conditions of mine no. 2 of the Stebnytsky potassium deposit as a consequence of self-rehabilitation flooding. Miner. Resour. Ukr. 2024, 4, 16–22. [Google Scholar] [CrossRef]
- Qu, H.; Yin, H.; Li, C.; Wang, W. Deformation characteristics and mechanism of salt structure: Research and discussion based on seismic analysis and tectonic simulation and implications for rock salt migration and mineralization in complex tectonic regions. Dizhi Xuebao/Acta Geol. Sin. 2024, 98, 2916–2930. [Google Scholar] [CrossRef]
- Sidorenko, A.A.; Dmitriev, P.N.; Alekseev, V.Y.; Sidorenko, S.A. Improvement of technological schemes of mining of coal seams prone to spontaneous combustion and rock bumps. J. Min. Inst. 2023, 264, 949–961. [Google Scholar] [CrossRef]
- Zhang, Y.; Lapatsin, S.; Zhuravkov, M.; Yu, G.; Karpovich, I. The Stability and Failure of Deep Underground Structures at Potash Mining Deposits. Appl. Sci. 2024, 14, 9434. [Google Scholar] [CrossRef]
- Trushko, V.L.; Baeva, E.K. Substantiation of rational parameters of mine support system for underground roadways in difficult geological conditions. MIAB Min. Inf. Anal. Bull. 2023, 12, 55–69. [Google Scholar] [CrossRef]
- Loginov, E.V.; Volf, V.V. Parameters of flow charts for hydraulic backhoe excavation of sand-and-gravel deposits. MIAB Min. Inf. Anal. Bull. 2022, 8, 71–84. [Google Scholar] [CrossRef]
- Marinin, M.A.; Pospehov, G.B.; Sushkova, V.I.; Pomortseva, A.A.; Moseykin, V.V. Experience of trial percolation in heap leaching pile of sandy–clayey rocks. MIAB Min. Inf. Anal. Bull. 2024, 8, 51–62. [Google Scholar] [CrossRef]
- Baryakh, A.A.; Smirnov, E.V.; Kvitkin, S.Y.; Tenison, L.O. Russian potash industry: Issues of rational and safe mining. Russ. Min. Ind. 2022, 1, 41–50. [Google Scholar] [CrossRef]
- Wang, S.; Qi, C.; Cui, B.; Li, X.; Li, D.; Zhang, B.; Zhou, Y.; Liu, W.; Sun, X.; Ding, X.; et al. Analysis and prospect of exploration trends of potassium salt resources in China. Dizhi Xuebao/Acta Geol. Sin. 2024, 98, 2978–2988. [Google Scholar] [CrossRef]
- Semin, M.A.; Maltsev, S.V.; Rodionov, V.A. Improving methods for calculating the equivalent pressure of jet fans in large-section mine workings. Bull. Tomsk Polytech. Univ. Geo Assets Eng. 2024, 335, 185–195. [Google Scholar] [CrossRef]
- Zubov, V.P.; Trofimov, A.V.; Kolganov, A.V. Influence of ground control features on indicators of dilution in mines of the Talanakh ore province. MIAB Min. Inf. Anal. Bull. 2024, 12-1, 87–106. [Google Scholar] [CrossRef]
- Ryl’nikova, M.V.; Berger, R.V.; Yakovlev, I.V.; Tatarnikov, V.I.; Zubkov, P.O. Backfill Technologies and Designs for Deep-Level Sylvinite Mining. J. Min. Sci. 2024, 60, 332–340. [Google Scholar] [CrossRef]
- Liu, Y.; Li, G.; Hou, J.; Fan, C.; Tong, C.; Wang, P. Optimization Model for Mine Backfill Scheduling Under Multi-Resource Constraints. Minerals 2024, 14, 1183. [Google Scholar] [CrossRef]
- Tyulyaeva, Y.S.; Khayrutdinov, A.M. Creation of a backfill composite based on coal industry waste. Ugol 2024, 10, 24–27. [Google Scholar] [CrossRef]
- Gets, A.K.; Onika, S.G.; Kologrivko, A.A.; Shodiev, A.N. Prediction of ore flow quality in a potash mine with regard to the ore face-to-shaft haulage logistics. Gorn. Zhurnal 2022, 4, 49–51. [Google Scholar] [CrossRef]
- Hu, G.; Liu, S.; Zhou, B.; Wang, Y.; Miao, X.; Zhong, Y. Geological Characteristics, Genetic Analysis and Extraction Technology of Potassium Salt Deposits along Hormuz Strait, Iran. Multipurp. Util. Miner. Resour. 2024, 45, 8–14. [Google Scholar] [CrossRef]
- Shkuratsky, D.N.; Skopinov, M.V.; Smirnov, E.V.; Baryakh, A.A. Closure of potentially hazardous sites in potash mines. Gorn. Zhurnal 2023, 3, 5–12. [Google Scholar] [CrossRef]
- Baryah, A.A.; Evseev, A.V. Closure of potash and salt mines: Review and analysis of the problem. MIAB Min. Inf. Anal. Bull. 2019, 9, 5–29. [Google Scholar] [CrossRef]
- Huo, W.; Li, H.; Guo, G.; Wang, Y.; Yuan, Y. Surface Subsidence Prediction Method for Backfill Mining in Shallow Coal Seams with Hard Roofs for Building Protection. Sustainability 2023, 15, 15791. [Google Scholar] [CrossRef]
- Kazanin, O.I.; Sidorenko, A.A.; Evsiukova, A.A.; Liu, Z. Justification of the longwall panel entries support technology when mining gently inclined coal seams at large depths. MIAB Min. Inf. Anal. Bull. 2023, 9, 5–21. [Google Scholar] [CrossRef]
- Repin, S.V.; Afanasyev, A.S.; Dobromirov, V.N.; Barsukov, V.O. Innovative method for disposal of waste of monolithic building structures. Sustain. Dev. Mt. Territ. 2023, 15, 771–783. [Google Scholar] [CrossRef]
- Konstantinova, S.A.; Anikin, M.F.; Gilev, M.V. Hydraulic backfill as a structural element of mining system at the Verkhnekamskoye deposit of potassium and potassium-magnesium salts. MIAB Min. Inf. Anal. Bull. 2001, 12, 89–92. [Google Scholar]
- Spearing, A.J.S.; Zhang, J.; Ma, L. A new automated, safe, environmentally sustainable, and high extraction soft-rock underground mining method. J. South. Afr. Inst. Min. Metall. 2021, 121, 89–96. [Google Scholar] [CrossRef]
- Sedghizadeh, M.; van den Berghe, M.; Shcherbakov, R. Leveraging the ETAS model to forecast mining microseismicity. Geophys. J. Int. 2024, 238, 1491–1504. [Google Scholar] [CrossRef]
- Sidorenko, S.; Trushnikov, V.; Sidorenko, A. Methane Emission Estimation Tools as a Basis for Sustainable Underground Mining of Gas-Bearing Coal Seams. Sustainability 2024, 16, 3457. [Google Scholar] [CrossRef]
- Samsonov, S.V.; Feng, W.; Blais-Stevens, A.; Eaton, D.W. Ground deformation due to natural resource extraction in the Western Canada Sedimentary Basin. Remote Sens. Appl. Soc. Environ. 2024, 34, 101159. [Google Scholar] [CrossRef]
- Zhang, L.; Ren, G.; Ge, Y.; Zhang, C.; Chu, F. Damage Self-Healing Property of Dissolved Salt Columns in Solid Potash Mine. ACS Omega 2024, 9, 31136–31147. [Google Scholar] [CrossRef] [PubMed]
- Duan, R.; Chang, L.; Gu, X.; Li, X.; You, X.; Zhang, Q.; Wang, Q. The Hydrogeochemical Processes of Groundwater in the Bieletan Area, the Western Potash Production Region in China. Water 2024, 16, 1833. [Google Scholar] [CrossRef]
- Babyr, N.V.; Gabov, V.V.; Nosov, A.A.; Nikiforov, A.V. Features of design and work method of mining module at coal deposits in the Russian Arctic. MIAB. Min. Inf. Anal. Bull. 2024, 6, 5–16. [Google Scholar] [CrossRef]
- Malozyomov, B.V.; Martyushev, N.V.; Babyr, N.V.; Pogrebnoy, A.V.; Efremenkov, E.A.; Valuev, D.V.; Boltrushevich, A.E. Modelling of Reliability Indicators of a Mining Plant. Mathematics 2024, 12, 2842. [Google Scholar] [CrossRef]
- Igmailov, A.; Israilov, M.; Latipov, Z.; Olimov, F. Determination of the optimal location of workings to reduce losses and difference of panels №7 and №7 of H2A formation at the mining complex of JSC Dekhkanobad potash plant. AIP Conf. Proc. 2024, 3152, 040012. [Google Scholar] [CrossRef]
- Maksarov, V.V.; Minin, A.O.; Vasilkov, D.V. The use of high-frequency wave action as part of the process to ensure the quality of boring surfaces in products made of corrosion-resistant aluminum alloys. Tsvetnye Metally 2025, 1, 76–83. [Google Scholar] [CrossRef]
- Gendler, S.G.; Kryukova, M.S.; Alferova, E.L. Investigation of thermodynamic parameters of the air environment in subway lines with single-track and double-track tunnels. Min. Sci. Technol. 2024, 9, 250–262. [Google Scholar] [CrossRef]
- Gendler, S.G.; Kryukova, M.S.; Galachiev, K.V.; Dydegkaeva, N.T. Control of thermodynamic parameters of the air environment of subway lines with single-track deep tunnels. Sustain. Dev. Mt. Territ. 2024, 16, 1343–1352. [Google Scholar] [CrossRef]
- Jin, R.; Wang, X.; Zhang, S.; Huo, H.; Li, J.; Ni, W. Slurry Transportation Characteristics of Potash Mine Cemented Paste Backfills via Loop Test Processing. Processes 2024, 12, 2929. [Google Scholar] [CrossRef]
- Liu, Y.; Li, G.; Hou, J.; Guo, G.; Pan, D.; Yu, Q. An Underground Mine Safety-Oriented Optimization Model for Mine Tailings Backfill Scheduling Considering Multi-Process and Multi-Cycle Issues. Minerals 2023, 13, 1409. [Google Scholar] [CrossRef]
- Kongar-Syuryun, C.B. Influence of mine water on the strength of artificial mass based on industrial waste. Ugol 2024, 12, 75–78. [Google Scholar] [CrossRef]
- Bronnikov, D.M.; Tsygalov, M.N. Backfill in Mines; Nedra: Moscow, Russia, 1980; 400p. [Google Scholar]
- Paliy, V.D.; Smelyanskiy, E.S.; Kravchenko, V.T.; Maletin, L.V. Guidelines for Determining the Standard Strength of Hardening Backfill and Assessing the Strength Properties of Artificial Mass; All-Union Research Institute of Mining Geomechanics and Mine Surveying VNIMI: Saint Petersburg, Russia, 1975; 42p. [Google Scholar]
- Khomyakov, V.I. Foreign Experience of Backfilling; Nedra: Moscow, Russia, 1984; 187p. [Google Scholar]
- Bitimbaev, M.Z.; Krupnik, L.A.; Shaposhnik, Y.N. Theory and Practice of Stowage Operations in the Development of Mineral Deposits; TOO RPIK “Dauir”: Almaty, Kazakhstan, 2012; 624p. [Google Scholar]
- Adigamov, A.E. Mathematical method for determining the standard strength of a backfill taking into account mining and geological factors. MIAB. Min. Inf. Anal. Bull. 2008, 10, 204–206. [Google Scholar]
- Baryakh, A.A.; Fedoseev, A.K.; Lobanov, S.Y. Deformations and fracture of rock strata during deep level potash mining. Procedia Struct. Integr. 2021, 32, 109–116. [Google Scholar] [CrossRef]
- Fang, A.; Yang, Y.; Yang, Z.; Hua, S.; Wang, J.; Zhou, F. Consolidation Properties of Soil/Modified Bentonite Backfill in Salt Solution. Water 2022, 14, 1967. [Google Scholar] [CrossRef]
- Sample-Lord, K.M.; Zhang, W.; Tong, S.; Shackelford, C.D. Apparent salt diffusion coefficients for soil–bentonite backfills. Can. Geotech. J. 2020, 57, 623–634. [Google Scholar] [CrossRef]
- Somtong, S.; Khamrat, S.; Fuenkajorn, K. Laboratory performance assessment of consolidated crushed salt for backfill material in potash mine openings. Res. Dev. J. 2015, 26, 15–22. [Google Scholar]
- Volkov, E.P. Development of Technology for Hardening Backfill with Tailings. Ph.D. Thesis, Siberian Federal University, Krasnoyarsk, Russia, 2020; 140p. [Google Scholar]
- Anushenkov, A.N.; Stovmanenko, A.Y.; Volkov, E.P. Fundamentals of Production and Transportation Processes of Backfill in Underground Mining; Siberian Federal University: Krasnoyarsk, Russia, 2015; 208p, ISBN 978-5-7638-3153-5. [Google Scholar]
- Liu, W.; Liu, Z.; Xiong, S.; Wang, M. Comparative prediction performance of the strength of a new type of Ti tailings cemented backfilling body using PSO-RF, SSA-RF, and WOA-RF models. Case Stud. Constr. Mater. 2024, 20, e02766. [Google Scholar] [CrossRef]
- Zhang, B.; Li, K.; Zhang, S.; Hu, Y.; Han, B. Strength prediction and application of cemented paste backfill based on machine learning and strength correction. Heliyon 2022, 8, e10338. [Google Scholar] [CrossRef] [PubMed]
- Qi, C.; Fourie, A.; Chen, Q.; Zhang, Q. A strength prediction model using artificial intelligence for recycling waste tailings as cemented paste backfill. J. Clean. Prod. 2018, 183, 566–578. [Google Scholar] [CrossRef]
- Thotakura, V.; Bala, G.S.; Prasad, C.D.; Ravindran, G.; Biswal, M. Machine Learning–Informed Geomaterial Design for Embankment Construction. Transp. Infrastruct. Geotech. 2025, 12, 56. [Google Scholar] [CrossRef]
- Hu, Y.; Hu, R.; Zhang, B.; Han, B. Research on mechanical properties and mix proportion design of solid waste-based cemented paste backfill. Case Stud. Constr. Mater. 2024, 21, e03618. [Google Scholar] [CrossRef]
- Hu, Y.; Ye, Y.; Zhang, B.; Li, K.; Han, B. Distribution characterization and strength prediction of backfill in underhand drift stopes based on sparrow search algorithm-extreme learning machine and field experiments. Case Stud. Constr. Mater. 2024, 21, e03784. [Google Scholar] [CrossRef]
- Golik, V.I.; Kongar-Syuryun, C.B.; Tyulyaeva, Y.S.; Khairutdinov, A.M. The use of binders based on metallurgical slags in the composition of based mixtures. Proc. TSU 2020, 4, 384–400. [Google Scholar]
- Pashkevich, M.A.; Kulikova, Y.A. Current trends in blast furnace waste management. Eurasian Sci. J. 2022, 14, 30NZVN622. Available online: https://esj.today/PDF/30NZVN622.pdf (accessed on 28 January 2025).
- Golik, V.I.; Dmitrak, Y.V.; Komashchenko, V.I.; Kachurin, N.M. Management of hardening mixtures properties when stowing mining sites of ore deposits. J. Min. Inst. 2020, 243, 285–292. [Google Scholar] [CrossRef]
- Tyulyaeva, Y.S.; Khayrutdinov, A.M.; Gorelkina, E.I. Increasing Classification of georesources in the paradigm of their integrated development. Russ. Min. Ind. 2024, 6, 140–143. [Google Scholar] [CrossRef]
- Argimbaev, K.R.; Ligotsky, D.N.; Mironova, K.V.; Loginov, E.V. Investigations on Material Composition of Iron-containing Tails of Enrichment of Combined Mining and Processing in Kursk Magnetic Anomaly of Russia. Int. J. Eng. Trans. A Basics 2020, 33, 1431–1439. [Google Scholar]
- Ran, J.J. Safe mining practices under wide spans in underground non-caving mines—Case studies. Int. J. Min. Sci. Technol. 2019, 29, 535–540. [Google Scholar] [CrossRef]
- Aleksandrova, T.N.; Prokhorova, E.O. Modification of properties of rock-forming minerals during flotation. MIAB Min. Inf. Anal. Bull. 2023, 12, 123–138. [Google Scholar] [CrossRef]
- Zhang, Z.; Ahmad, N.; Shrestha, A.; Tang, Z.; Cai, Z.; Ergashev, R.; Kalandarbekov, I.; Liu, L.; Li, L. Investigation of fresh, shrinkage, and mechanical properties in iron sand high-strength engineered cementitious composites: Effects of water-to-binder ratio and fiber volume fraction. Case Stud. Constr. Mater. 2025, 22, e04138. [Google Scholar] [CrossRef]
- Long, Z.; Long, G.; Chen, Y.; Shangguan, M.; Wang, J.; Zhang, Y.; Yi, M.; Gao, C.; Tang, Z. Regulating drying shrinkage behavior of cement-based materials in low vacuum environments and developing a predictive model. J. Build. Eng. 2025, 99, 11639. [Google Scholar] [CrossRef]
- Rodríguez-Marcos, M.; Pacheco-Torres, R.; Fernández-Gómez, J.; Villanueva-Llaurado, P. Durable Performance of Cement-Based Repair Mortars for Retrofitting and Protection Applications. J. Mater. Civ. Eng. 2025, 37, 04024539. [Google Scholar] [CrossRef]
- Chen, X.; Jiao, H.; Liu, J.; Yang, Y.; Chen, X.; Yang, L.; Zhang, W.; Yang, T. The Influence of Multi-Size Basalt Fiber on Cemented Paste Backfill Mechanical Properties and Meso-Structure Characteristics. Minerals 2023, 13, 1215. [Google Scholar] [CrossRef]
- Liu, W.; Yin, S.; Hou, Y.; Zhang, M. Study on Mechanical and Flow Properties of Cemented Sulfur Tailings Backfill Considering the Influence of Fiber Type, Fiber Content and Addition Method. Minerals 2023, 13, 1105. [Google Scholar] [CrossRef]
- Jafari, M.M.; Jahandari, S.; Ozbakkaloglu, T.; Rasekh, H.; Armaghani, D.J.; Rahmani, A. Mechanical Properties of Polyamide Fiber-Reinforced Lime–Cement Concrete. Sustainability 2023, 15, 11484. [Google Scholar] [CrossRef]
- Edianto, A.; Trencher, G.; Manych, N.; Matsubae, K. Forecasting coal power plant retirement ages and lock-in with random forest regression. Patterns 2023, 4, 100776. [Google Scholar] [CrossRef] [PubMed]
- Klyuev, R.V.; Morgoeva, A.D.; Gavrina, O.A.; Bosikov, I.I.; Morgoev, I.D. Forecasting planned electricity consumption for the united power system using machine learning. J. Min. Inst. 2023, 261, 392–402. [Google Scholar]
- Morgoeva, A.D.; Morgoev, I.D.; Klyuev, R.V.; Kochkovskaya, S.S. Forecasting hourly electricity generation by a solar power plant using machine learning algorithms. Bull. Tomsk Polytech. Univ. Geo Assets Eng. 2023, 334, 7–19. [Google Scholar] [CrossRef]
- Dong, L.; Shu, H.; Tang, Z.; Yan, X. Microseismic event waveform classification using CNN-based transfer learning models. Int. J. Min. Sci. Technol. 2023, 33, 1203–1216. [Google Scholar] [CrossRef]
- Fu, D.; Shi, H.; Gueymard, C.A.; Yang, D.; Zheng, Y.; Che, H.; Fan, X.; Han, X.; Gao, L.; Bian, J.; et al. A Deep-Learning and Transfer-Learning Hybrid Aerosol Retrieval Algorithm for FY4-AGRI: Development and Verification over Asia. Engineering 2024, 38, 164–174. [Google Scholar] [CrossRef]
- Guo, Y.-J.; Cui, Y.-A.; Chen, H.; Xie, J.; Zhang, C.; Liu, J.-X. Self-potential inversion based on Attention U-Net deep learning network. J. Cent. South Univ. 2024, 31, 3156–3167. [Google Scholar] [CrossRef]
- Nikitin, V.I. Mathematical modeling of drilling fluid filter penetration into the bottom-hole of formation taking into account oil viscoplastic properties. Bull. Tomsk. Polytech. Univ. Geo Assets Eng. 2023, 334, 130–137. [Google Scholar] [CrossRef]
- Zhou, X.; Zhao, X.; Qu, Q.; Huang, Y. Enhancing stability graphs for stope design in deep metal mines using machine learning. Int. J. Rock Mech. Min. Sci. 2024, 181, 105837. [Google Scholar] [CrossRef]
- Avkopashvili, M.; Avkopashvili, I.; Avkopashvili, G.; Ayo-Bali, A.E. 50 years of mining-induced environmental changes: Topography, hydrology, and vegetation health in Kazreti, Georgia. Environ. Res. Commun. 2024, 6, 085008. [Google Scholar] [CrossRef]
- Kaldybayev, N.; Teshebayeva, Z.; Akkulov, A.; Abdulazizov, T.; Bektashov, B. Substantiation of Rational Parameters of Rock Salt Extraction in High-Altitude Conditions Using Environmentally Friendly Combined Geotechnologies. E3S Web Conf. 2024, 537, 10004. [Google Scholar] [CrossRef]
- Bykowa, E.; Banikevich, T.; Zalivatskaya, N.; Pirogova, O. Modeling the Cadastral Value of Land Plots of Gardening and Horticultural Non-Profit Partnerships Taking into Account the Influence of Local Factors of the Territory. Land 2024, 13, 1004. [Google Scholar] [CrossRef]
- Banikevich, T.D.; Bykowa, E.N.; Zalivatskaya, N.V.; Pirogova, O.E. Pattern determination of the territory local factors influence on the land plots’ cadastral value of gardening and horticultural non-profit partnerships. Popul. Econ. 2024, 8, 86–107. [Google Scholar] [CrossRef]
- Tan, X.; Ren, G.; Zhang, L.; Zhang, C.; Jiang, K.; Ge, Y. Research on temperature distribution rule and influencing factors of integrated mechanized stope in potassium salt mine. Case Stud. Therm. Eng. 2024, 61, 104942. [Google Scholar] [CrossRef]
- Quan, W.; Fall, M. Temperature-driven crack self-healing and performance recovery in cemented tailings materials. Case Stud. Constr. Mater. 2024, 21, e04105. [Google Scholar] [CrossRef]
- Egoshin, A.M.; Afanasyev, A.S.; Alekseev, S.V. Procedure of mineral delivery system selection based on economic analysis of alternatives. MIAB Min. Inf. Anal. Bull. 2024, 6, 135–148. [Google Scholar] [CrossRef]
- Trigueros, E.; Cánovas, M.; Arzúa, J.; Baraibar, J.M. Evaluating the influence of backfilling on the stability of an abandoned room-and-pillar mine: A case study in northern Spain. Geomech. Geophys. Geo-Energy Geo-Resour. 2024, 10, 116. [Google Scholar] [CrossRef]
Disclaimer/Publisher’s Note: The statements, opinions and data contained in all publications are solely those of the individual author(s) and contributor(s) and not of MDPI and/or the editor(s). MDPI and/or the editor(s) disclaim responsibility for any injury to people or property resulting from any ideas, methods, instructions or products referred to in the content. |
© 2025 by the authors. Licensee MDPI, Basel, Switzerland. This article is an open access article distributed under the terms and conditions of the Creative Commons Attribution (CC BY) license (https://creativecommons.org/licenses/by/4.0/).

