Article

Solid-State Kinetic Modeling and Experimental Validation of Cu-Fe Bimetallic Catalyst Synthesis and Its Application to Furfural Hydrogenation

by
Bárbara Jazmín Lino Galarza
1,2,
Javier Rivera De la Rosa
1,*,
Eduardo Maximino Sánchez Cervantes
1,
Carlos J. Lucio-Ortiz
1,
Marco Antonio Garza-Navarro
3,
Carolina Solís Maldonado
4,
Ramón Moreno-Tost
2,
Juan Antonio Cecilia-Buenestado
2 and
Antonia Infantes Molina
2
1
Facultad de Ciencias Químicas, Universidad Autónoma de Nuevo León (UANL), Av. Universidad S/N, Cd. Universitaria, San Nicolás de Los Garza, Nuevo León 64455, Mexico
2
Departamento de Química Inorgánica, Cristaloquímica y Mineralogía, Facultad de Ciencias, Universidad de Málaga, Campus de Teatinos, 29071 Málaga, Spain
3
Facultad de Ingeniería Mecánica y Eléctrica, Universidad Autónoma de Nuevo León (UANL), Av. Universidad S/N, Cd. Universitaria, San Nicolás de Los Garza, Nuevo León 64455, Mexico
4
Facultad de Ciencias Químicas, Universidad Veracruzana, Prolongación Venustiano Carranza S/N, Poza Rica, Veracruz 93390, Mexico
*
Author to whom correspondence should be addressed.
Technologies 2025, 13(2), 63; https://doi.org/10.3390/technologies13020063
Submission received: 20 December 2024 / Revised: 18 January 2025 / Accepted: 30 January 2025 / Published: 3 February 2025
(This article belongs to the Section Innovations in Materials Processing)

Abstract

:
In this work, combined experimental and modeling techniques were used to understand the bimetallic catalyst formation of Cu and Fe. The first part of this study aims to address this gap by employing analytical techniques such as X-ray diffraction (XRD), thermal and gravimetric (TGA), thermoprogrammed oxidation and reduction. These were used to track the evolution of the different crystalline phases formed for CuFe-Bulk and CuFe/Al2O3 catalysts, as well as hydrogen thermoprogrammed reduction (H2-TPR), to evaluate the reducibility of the oxide phases. Both bulk and supported catalysts were also studied in the hydrogenation of furfural at 170 °C, and 4 MPa of H2. The research provides insights into the thermal events and structural transformations that occur during oxidation and reduction processes, revealing the formation of multiple oxide and metallic phases. The proposed reaction mechanism obtained from XRD analysis and TG-based mathematical modeling provides valuable information about the chemical reaction and the diffusion control mechanisms. Furthermore, a catalytic test using furfural, a biomass-derived molecule, was conducted. This interconnects with the initial section of the study, in which we found that active Cu4Fe sites have superior performance in the CuFe/Al2O3 catalyst in the hydrogenation batch test.

1. Introduction

Catalysts play an indispensable role in chemical reactions and have widespread application across various industries, including pharmaceuticals, polymers, petrochemicals, and food processing. Among these, bimetallic catalysts emerged in the 1960s and have since constituted an intriguing area of exploration due to their unique textural properties and possible catalytic applications. However, until 1996, Schöllhorn emphasized that there was still a significant gap in our understanding of the synthesis required to obtain the catalyst, and that this constituted a “black box” in the context of catalyst research. Bimetallic copper and iron catalysts have exhibited promising outcomes in diverse catalytic reactions, encompassing selective hydrogenation and oxidation processes [1,2,3].
However, advancements in comprehending reaction systems involving solid-state catalyst formation and understanding the kinetics of associated reactions in bimetallic systems have been relatively limited. Despite this, mounting evidence showcases the feasibility of tracking these reactions employing analytical techniques such as X-ray diffraction (XRD), thermoprogrammed reduction (TPR), and thermogravimetric analyses (TGA). The correlation between these techniques is evidenced in the case of the Cu/Al2O3 catalyst, as reported in a previous work [4], where it not only enables the development and formulation of a kinetic approach but also provides essential insights into the interaction between the support and the metal. Such insights hold significant value in employing the catalyst in related reactions.
As a valuable source of information for material design and solid-state chemistry modeling, the study of the formation and kinetics associated with solid-state catalyst synthesis is a vital and indispensable endeavor. Reaction mechanism elucidation, facilitated by advanced analytical techniques, not only opens avenues for improving the efficiency, selectivity, and stability of bimetallic catalysts, but also allows in-depth exploration of the intricate interplay between structural properties, active sites, and catalytic performance [3,5,6]. For the ongoing advancement of catalysis science, this in-depth understanding provides invaluable insights. Consequently, the knowledge gained plays a key role in optimizing catalytic performance and tailoring bimetallic catalysts for specific applications.
Exploring the formation mechanisms and kinetics involved in bimetallic catalysts, focusing specifically on copper and iron, two abundant metals with notable potential in various catalytic processes can be of great interest. These catalysts have shown promising results in fundamental biomass transformation reactions [7]. The integration of various analytical techniques, particularly XRD, TPR, and TGA, can facilitate a comprehensive understanding of the intricate mechanisms behind their formation and transformation.
While characterizing catalysts and understanding their formation provide valuable insights into their behavior, these characteristics lack significance until they are applied. In light of the need for new processes and sustainable technologies from renewable sources to provide an alternative to fossil products, furfural (FUR) is one of the platform molecules of great interest to the scientific community for the production of useful biofuels [8]. This is achieved with the use of transition metal catalysts, such as Cu-doped Ni, Fe2O3, or SiO2, which are being increasingly studied for various reactions such as hydrogenation to obtain furfuryl alcohol (FA) and 2-methylfuran (MF) [9,10,11].
The objective of the present work is to identify a solid-state reaction mechanism to analyze the kinetics of the decomposition and formation of the species involved in the formation of the bulk CuFe obtained by wet impregnation at different oxidation and reduction temperatures with H2. This will provide valuable information on how to relate the copper and iron metal phases to obtain CuFe/Al2O3 catalysts. The study of furfural hydrogenation to obtain value-added products is also presented.

2. Materials and Methods

2.1. Reagent and Materials

Copper(II) chloride dihydrate (ACS reagent, ≥99.0%) and iron(III) nitrate nonahydrate (≥99.95% trace metals basis) were purchased from Aldrich (St. Louis, MI, USA). Commercial alumina was purchased from SASOL CATALOX SBa-200 (Sandton, South Africa). For the catalytic tests, we used furfural (99% for synthesis) from Aldrich, 2-propanol as a solvent (HPLC grade) from GWR-chemicals, H2 (99.999%, Air Liquide), and o-xylene (98% grade HPLC) as an internal standard from Aldrich.

2.2. Preparation of CuFe Samples

The bulk sample was prepared using an adapted version of the impregnation method originally described by Dimas-Rivera. This involved the dissolution of the precursors, thorough mixing of the resulting solution, and subsequent drying [12]. Two solutions containing the desired amounts of each of the precursor salts to obtain a Cu:Fe 3:1 mass ratio were prepared and mixed. We finally maintained the mixed solution by stirring it at room temperature for 1 h. Subsequently, the aqueous solution was preheated under stirring by slowly increasing from room temperature to 40 °C, 60 °C, 80 °C, and 100 °C in a heating plate until evaporation, followed by an air-treatment at 120 °C for three hours to obtain the precursor sample (CuFe prec). The precursor was then homogenized in a mortar and air-treated at different temperatures with a heating ramp of 1 °C/min and maintained at the desired temperature for one hour. The samples were referred to as CuFe-cT where T indicates the treatment temperature (from 200 to 600 °C).
Moreover, to evaluate the reactions involved during reduction, a similar procedure as previously reported [4] was carried out. To this end, the CuFe-c600 sample was placed in a tubular reactor and treated under an H2/N2 (30/70) flow of 30 mL/min at different temperatures with a heating ramp of 2 °C/min, and maintained at the desired temperature for one hour. The samples were referred to as CuFe-rT, where T indicates the treatment temperature (from 200 to 600 °C).

2.3. Preparation of CuFe Supported over Al2O3 Samples

The proper amount of precursor salts to prepare samples containing 10 wt.% of total metal loading and a Cu:Fe mass ratio of 3:1 was weighed. Firstly, each of the precursor salts were dissolved in 50 mL of water until a total synthesis volume of 100 mL was obtained. Then, they were mixed together and maintained under stirring for 24 h at room temperature. The resulting solution was preheated under stirring in a heating plate at 100 °C for one hour until evaporation, followed by an air-treatment at 120 °C for 3 h to obtain the precursor sample (CuFe/Al2O3-prec). The precursor was then homogenized in a mortar and air-treated at different temperatures with a heating ramp of 1 °C/min and maintained at the desired temperature for one hour. The samples were referred to as CuFe/Al2O3-cT, where T indicates the treatment temperature (from 200 to 600 °C). To evaluate the reactions involved during the reduction step, a similar procedure such as that described for bulk samples was employed. The resultant materials were named CuFe/Al2O3-rT, where r refers to the reduction temperature employed (from 200 to 600 °C).

2.4. Characterization of CuFe and CuFe/Al2O3

The oxidation and reduction stage behavior for CuFe was determined by TGA and differential thermal analysis (DTA) using a TA instrument (model SDT 2960, series 2960-172). The analysis was conducted from room temperature to 600 °C with a heating ramp of 10 °C/min, using extra dry air for oxidation or with a H2/N2 (6/94) mixture at a constant flow rate of 50 mL/min for reduction. TPR was carried out to analyze the characteristics of the reduction using a TPR AMI-EZ (Pittsburg, PA, USA) instrument. Thus, the catalysts were pre-treated at 600 °C for one hour in an N2 atmosphere. Then, 50 mg of the sample placed in a quartz U-tube and pre-treated at 30 °C/min under an Ar flow rate of 25 mL/min, increasing to 50 °C for two minutes. The sample was exposed to 25 mL/min of H2/Ar (10/90) stream and then heated at 10 °C/min until reaching 600 °C for 30 min. The H2 consumption was monitored by using a thermal conductivity detector (TCD).
The CuFe and CuFe/Al2O3 samples obtained were subjected to various types of analysis to determine their characteristics: X-ray diffraction (XRD) was carried out to determine and follow the crystalline phases of the synthesized materials at different temperatures by using Siemens equipment (Munich, Germany), model D5000, series E04-0012. The equipment was operated with an accelerating current of 25 mA, an accelerating voltage of 35 kV, a radiation source corresponding to a Cu K 1.5418 Å (wavelength). Each specimen was prepared by placing the powdered sample into a glass holder. Intensity data were obtained through step scanning over the 2θ range from 5° to 90°, utilizing a 2θ step size of 0.02° and a measurement time of 2 s per point. The high-resolution transmission electron microscopy (HRTEM) analysis of the dispersed sample, which had been placed on a nickel grid, was developed using the FEI-TITAN (Hillsboro, OR, USA) microscope operating at an accelerating voltage of 300 kV. In addition, energy dispersive spectrometry (EDS) was performed to identify the elements present in the samples. The same HRTEM equipment was used to carry out selected area electron diffraction (SAED) as reported previously [4].

2.5. Catalytic Test: Hydrogenation of Furfural

The one-pot reactions were conducted in accordance with the methodology outlined previously by Maderuelo-Solera. The error bars were found to be less than 3%, as was reported in previous work [13]. The reaction was conducted in a pressure batch Teflon reactor with a magnetic stirrer, which was loaded with 100 mg of catalyst, 5 mL of 2-propanol, and 1.0 mmol furfural (ratio 1:50). The reactor was purged in duplicate with He to subsequently load it with 4 MPa of H2 at 170 °C, stirring at 440 RPM for six hours.
In order to perform the analysis, 20 mL of o-xylene was introduced (serving as an analytical standard). An aliquot of one ml was filtered through a 0.22 mm filter and then diluted to five ml with 2-propanol, ready for analysis by gas chromatography (GC) using a Shimadzu GC-14B (Canby, OR, USA) instrument with a Flame Ionization Detector (FID) and a CP-WAX 52 CB column (30 m, 0.25 mm, 0.25 mm). The injection volume for analysis was 3 mL with an initial temperature of 60 °C for one minute and a heating ramp of 2 °C to 100 °C for 17 min. The retention times were 2.6, 7.5, 8.3, 10.8 and 13.5 min for MF, isopropyl levulinate (iPL), isopropyl furfuryl ether (iPFE), FUR, and FA, respectively.
The furfural conversion and yield values were calculated as follows:
C o n v e r s i o n   ( % ) = m o l   o f   F U R   c o n v e r t e d m o l   o f   F U R f e d × 100
Y i e l d % = m o l   o f   p r o d u c t m o l   o f   F U R f e d × 100 .

3. Results and Discussion

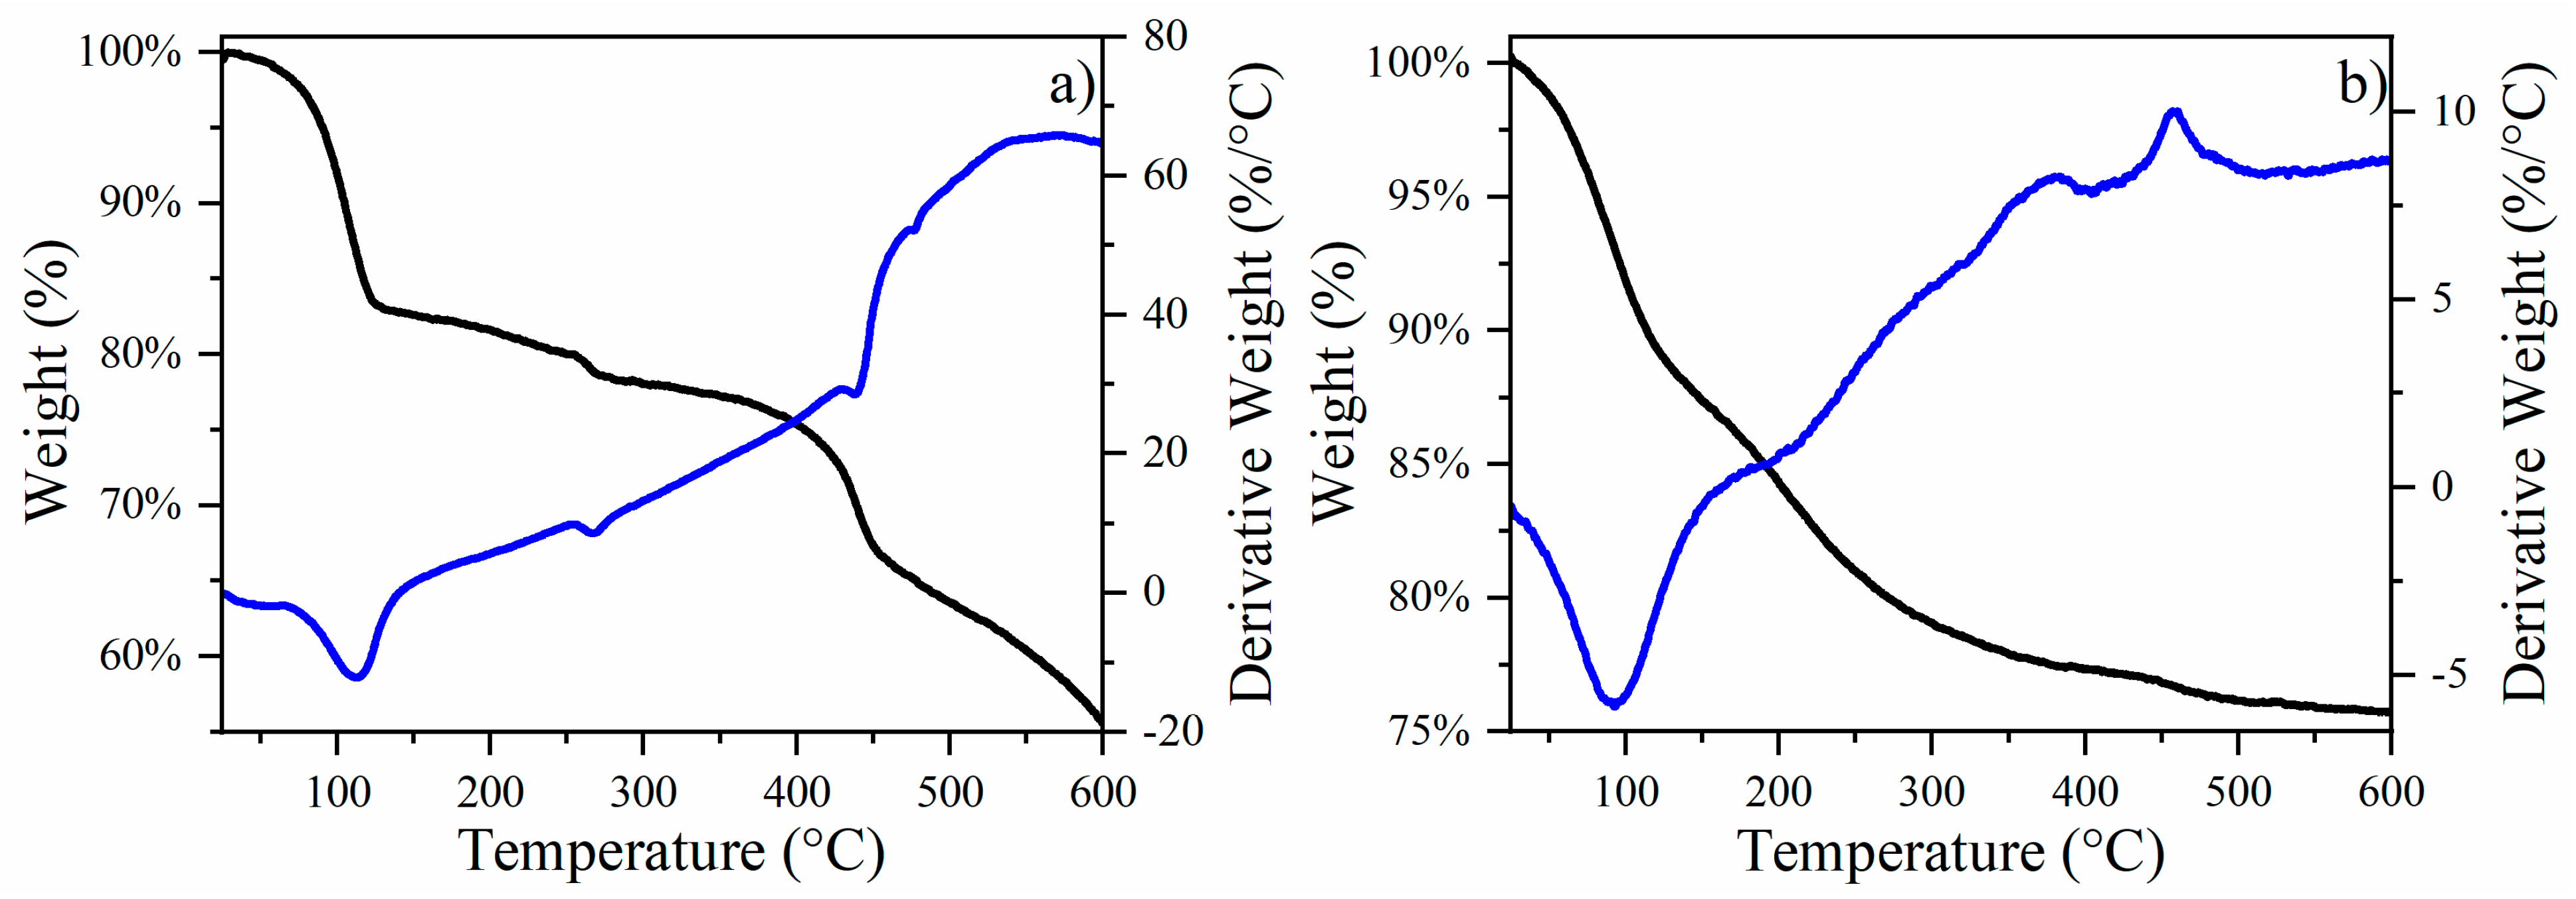
3.1. Thermal Analysis and Structural

Transformations of CuFe and CuFe/Al2O3 catalysts. The DTA and TGA analysis of the air atmosphere of the CuFe-prec sample is depicted in Figure 1a, where several thermal events were noticeable. The first occurred between room temperature and 120 °C, resulting in 12% weight loss. This weight loss is attributed to the loss of physisorbed water from the sample surface, a common occurrence in porous materials. In the temperature range of 120 to 450 °C, an additional weight loss of approximately 22% was observed, which aligns with the expected reactions of CuCl2·2H2O transitioning to CuCl2 and then to Cu2Cl2O, and ultimately to CuO [14]. This progression corresponds with the expected mass losses during these transformations, reinforcing our interpretation and ensuring consistency with the subsequent steps and overall analysis, from Fe(NO3)3·9H2O to FeO and Fe2O3 [15]. Finally, a 10% decrease is observed between 450 and 600 °C, attributed to the final transformation of the remaining oxychlorides into oxides, and the possible formation of bimetallic oxide species, such as CuFe2O4, due to the interactions between CuO and Fe2O3 as reported previously within this temperature range [16]. The thermal events were further confirmed by XRD patterns obtained for the catalysts, as illustrated in Figure 2a.
The CuFe/Al2O3-prec (Figure 1b) shows a similar thermal event between room temperature and 120 °C, resulting in a weight loss of 12%, which is, once again, associated with physisorbed water on the sample surface. Between 125 and 600 °C, a weight loss of about 11% is recorded, which is associated with different processes such as the decomposition of precursor salts, the formation and decomposition of Cu2Cl2O, CuO, and Fe2O3 species, bimetallic spinels such as CuFe2O4, and the formation of CuAl2O4 [4,17]. The thermal events were further validated by the XRD patterns acquired for the catalysts, as shown in Figure 2b.

3.2. XRD Analysis and Thermal Evolution of CuFe-prec, CuFe-cT, CuFe/Al2O3-prec and CuFe/Al2O3-cT Samples

The evolution of the different crystalline phases formed under both oxidizing and reduction conditions was followed by XRD. Thus, the first eight XRD patterns in Figure 2a and four in Figure 2b (from bottom to top) are the reference patterns according to the Joint Committee on Powder Diffraction Standards (JCPDS).
The X-ray diffraction (XRD) patterns of CuFe-prec and CuFe-cT samples are presented in Figure 2a.
The CuFe-prec sample exhibited characteristic diffraction peaks for the precursor salt using CuCl2H2O (JCPDS N° 01-088-1697). As the temperature increases, the loss of water from this salt is clearly observed, leading to the formation of CuCl2 (JCPDS N° 00-001-0185), its transformation into oxychloride Cu2Cl2O (JCPDS N° 01-070-0446), and subsequently, the formation of CuO (JCPDS N° 00-041-0254). Regarding iron phases, it is only until reaching 300 °C that tiny diffraction peaks appear as FeO (JCPDS N° 01-089-0687), and at higher temperatures it is transformed to Fe2O3 (JCPDS N° 01-089-8104). At lower temperatures, it is expected that the iron precursor salt Fe(NO3)3·9H2O undergoes first partial dehydration, turning into Fe(NO3)3·6H2O (JCPDS N° 96-201-8520) as reported in the literature [18,19,20], to then further evolve into FeO. Figure 2a for CuFe-prec demonstrates that the detected intensity of this salt is lower compared to that of the copper species. This is due to the fact that the precursor salt must be in the form of small particles, therefore the detection limit of XRD was likely reached.
At 600 °C, the highest treatment temperature, the CuFe-c600 sample only shows the diffraction peaks arising from the presence of CuO and Fe2O3. However, the presence of CuFe2O4 (JCPDS N° 96-901-2439) cannot be ruled out, as its main diffraction peak overlaps with the primary peak of CuO and the secondary peak of Fe2O3.
In Figure 2b, the X-ray diffraction pattern of CuFe/Al2O3-prec and CuFe/Al2O3-cT samples the presence of CuOHCl (JCPSD N° 01-074-1650) as the starting phase. The formation of this phase is reported to be due to the interaction between the precursor salt CuCl2·2H2O and CuO [21], which is transformed as the temperature increases into the next phase of copper oxychloride Cu2Cl2O (JCPSD N° 01-070-0446) at 400 °C. At higher temperatures, only the diffraction peaks of alumina (JCPSD N° 01-1303) are noticeable. The presence of oxide species is expected, but only in the form of small particles below the detection limit of the XRD technique.

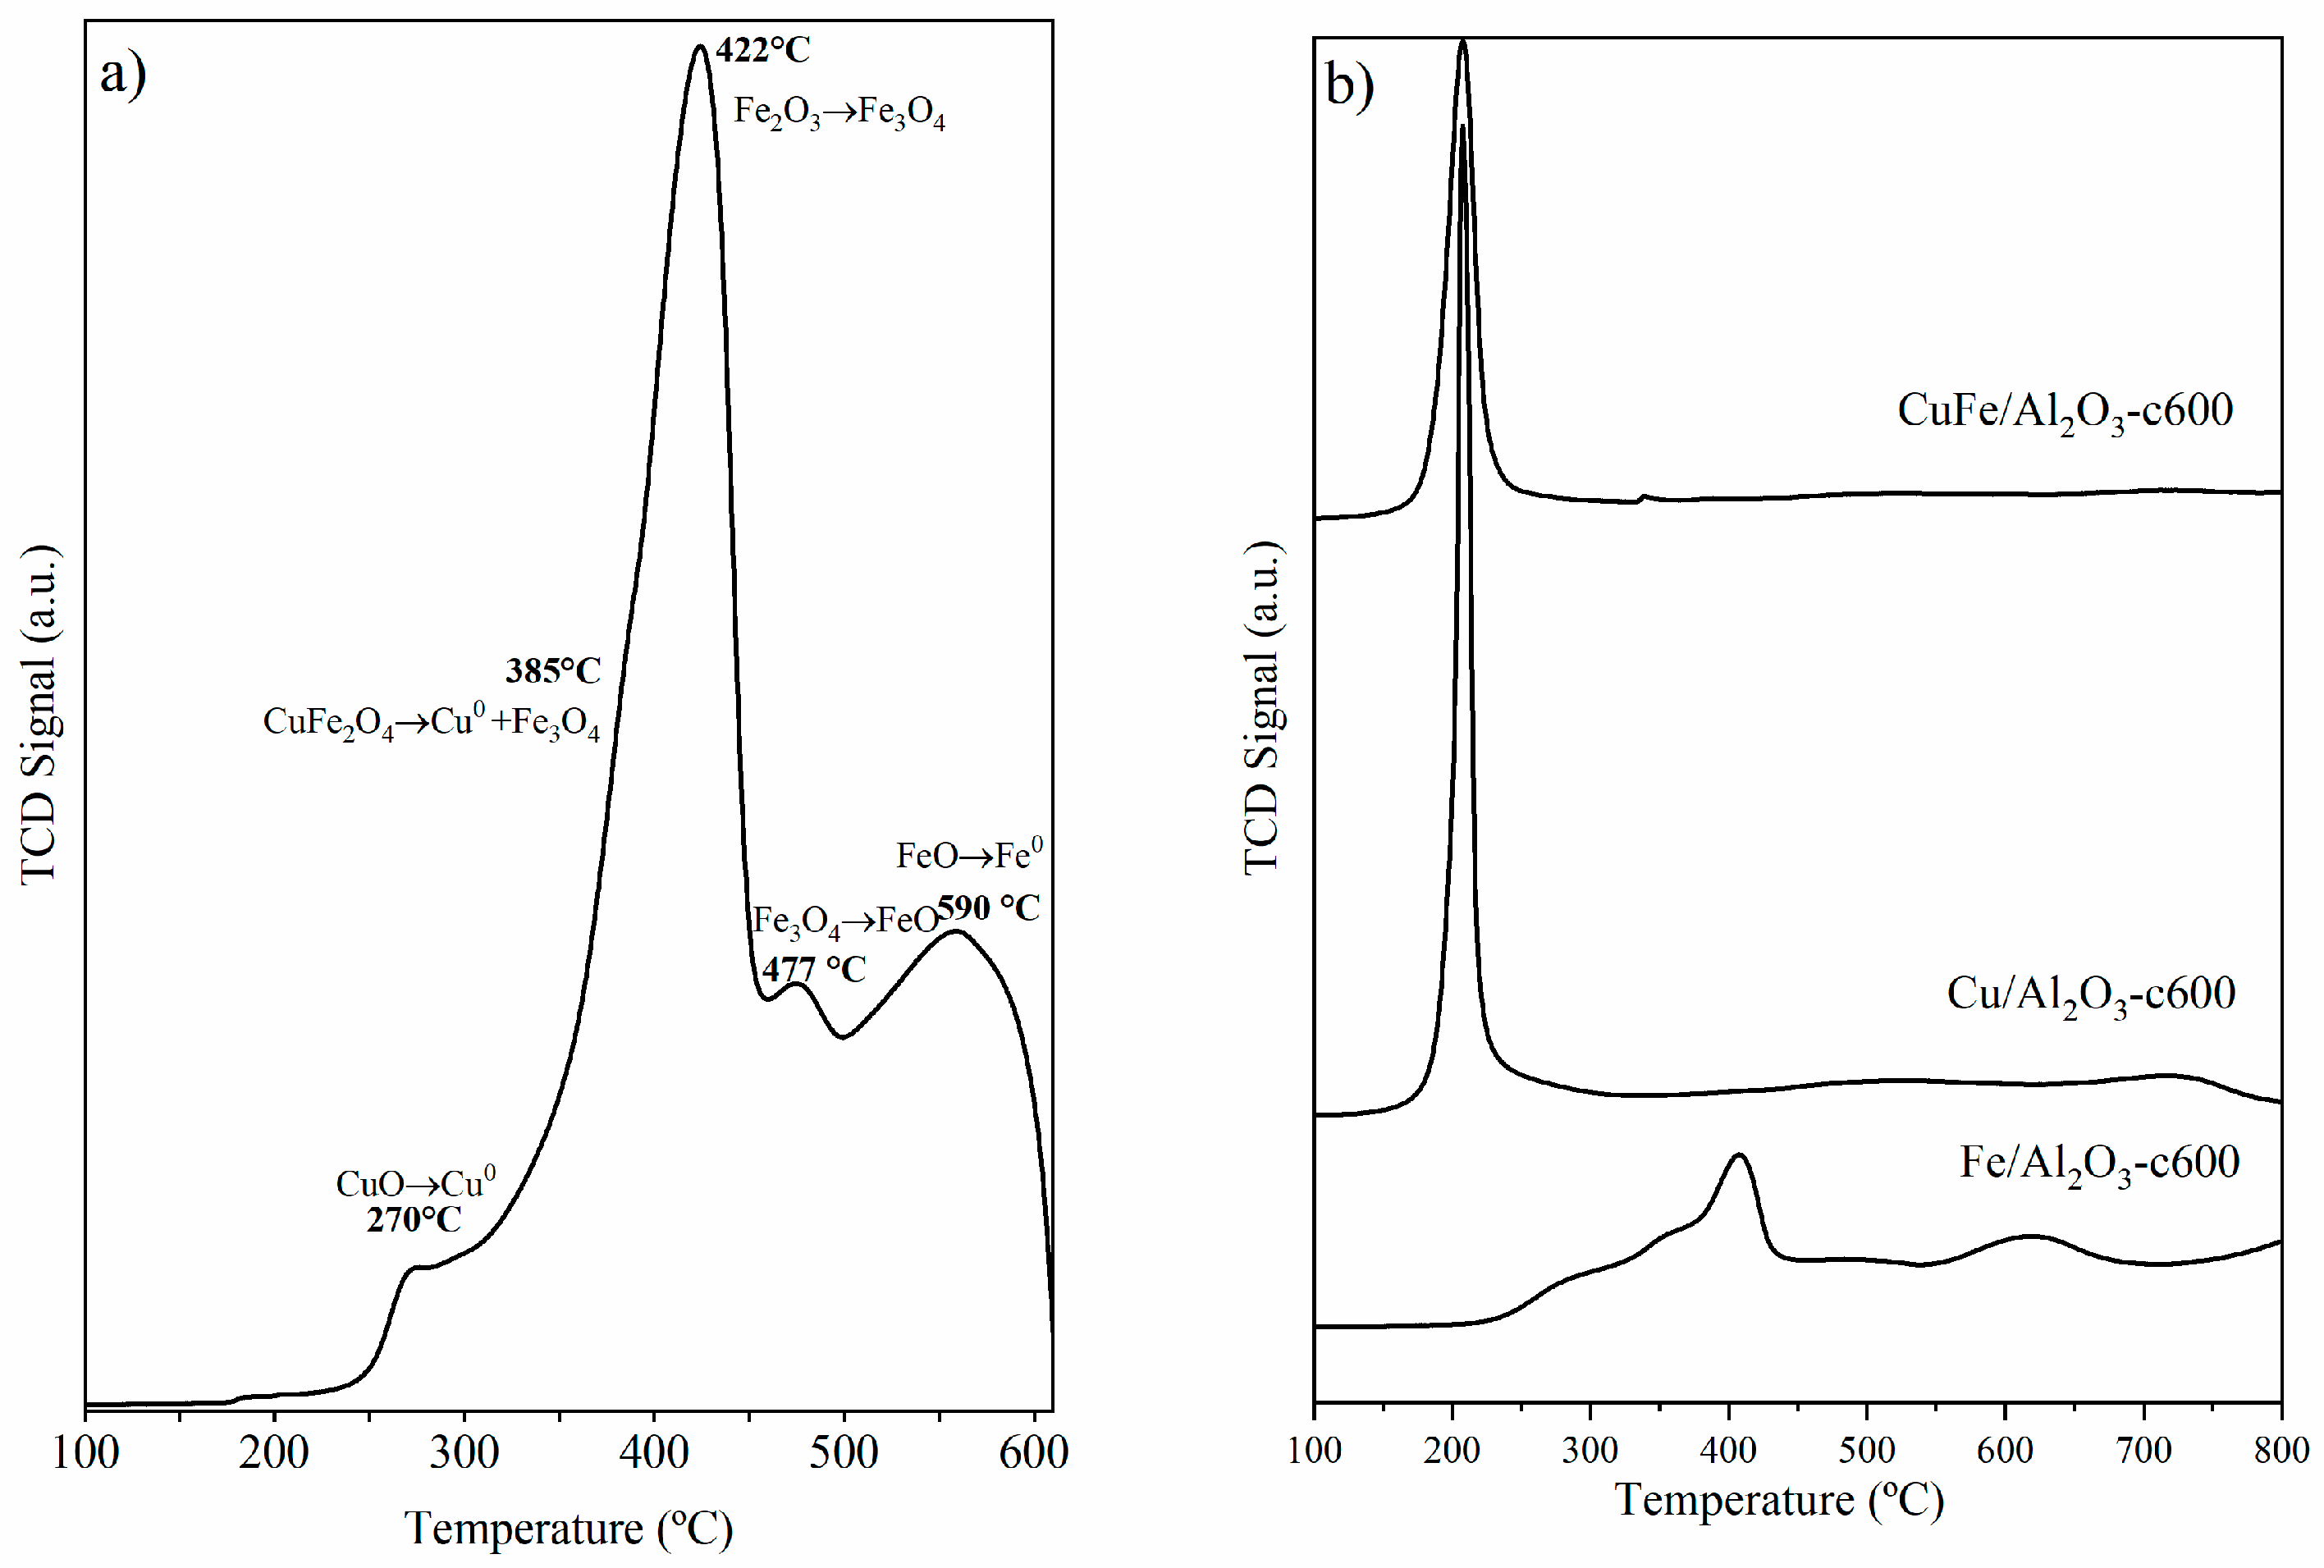
3.3. TPR Analysis: Reduction Behavior of CuFe-c600 and CuFe/Al2O3-c600 Samples

The TPR profiles for CuFe-c600 (Figure 3a) showed a multi-stage transition behavior, with an initial reduction step at T = 270 °C due to the reduction of CuO to Cu [22]. This was followed by the decomposition of CuFe2O4 into Cu and Fe3O4 at T = 385 °C [23,24], and the subsequent reduction of Fe2O3 to Fe3O4, Fe3O4 to FeO and FeO to Fe as the temperature increased between 422 °C and 590 °C [25,26]. As observed from XRD, the diffraction peaks of the CuFe2O4 phase remain at 600 °C, showing that higher temperatures are required for its reduction [27] and, therefore, are responsible for the band at higher temperatures.
The TPR profile for the CuFe/Al2O3-c600 sample (Figure 3b) showed a similar profile to that observed for the bulk sample, but it shifted at higher temperatures. The first step occurs close to 300 °C, due to the reduction from CuO to Cu, followed by the two reduction steps from Fe2O3 to Fe3O4 to Fe. The reduction process at higher temperatures can be associated with the reduction of iron and/or copper species strongly interacting with the support. The thermal events were further validated by the XRD patterns acquired for the catalysts, as shown in Figure 4.

3.4. XRD Analysis and Thermal Evolution of CuFe-c600, CuFe-rT, CuFe/Al2O3-c600, and CuFe/Al2O3-rT Samples

The reduction behavior in terms of crystalline phases was evaluated through XRD. In this regard, the CuFe-c600 sample was treated as described above at different temperatures in an H2/N2 flow; the corresponding diffractograms are included in Figure 4a.
It was observed that upon increasing the temperature, the initial phases, CuO, Fe2O3, and CuFe2O4 (JCPDS N° 96-901-2439), decomposed into iron (JCPDS N° 01-087-0722) and two metallic copper phases. The first phase appeared at 400 °C, identified as Cu4 (JCPDS N° 96-431-3208), which, as the temperature increased, showed an increase in its lattice parameter and a shift in its diffraction peaks, leading to the next phase, Cu (JCPDS N° 01-070-3039) [28]. In addition, the transformation into the Cu4Fe bimetallic phase (JCPDS N° 03-065-7002) occurred; however CuFe2O4 is still observed. It is important to note that the reduced Fe, Cu, Cu4, and Cu4Fe phases show a face-centered cubic symmetry (fcc). In order to understand the behavior of the CuFe bulk sample, we have monitored the average size of the crystallites during the temperature changes and the calcination and reduction stages (see Section 3.5).
In the case of the supported sample (Figure 4b), CuFe/Al2O3-c600, only the diffraction peaks arising from the material support are noticeable.

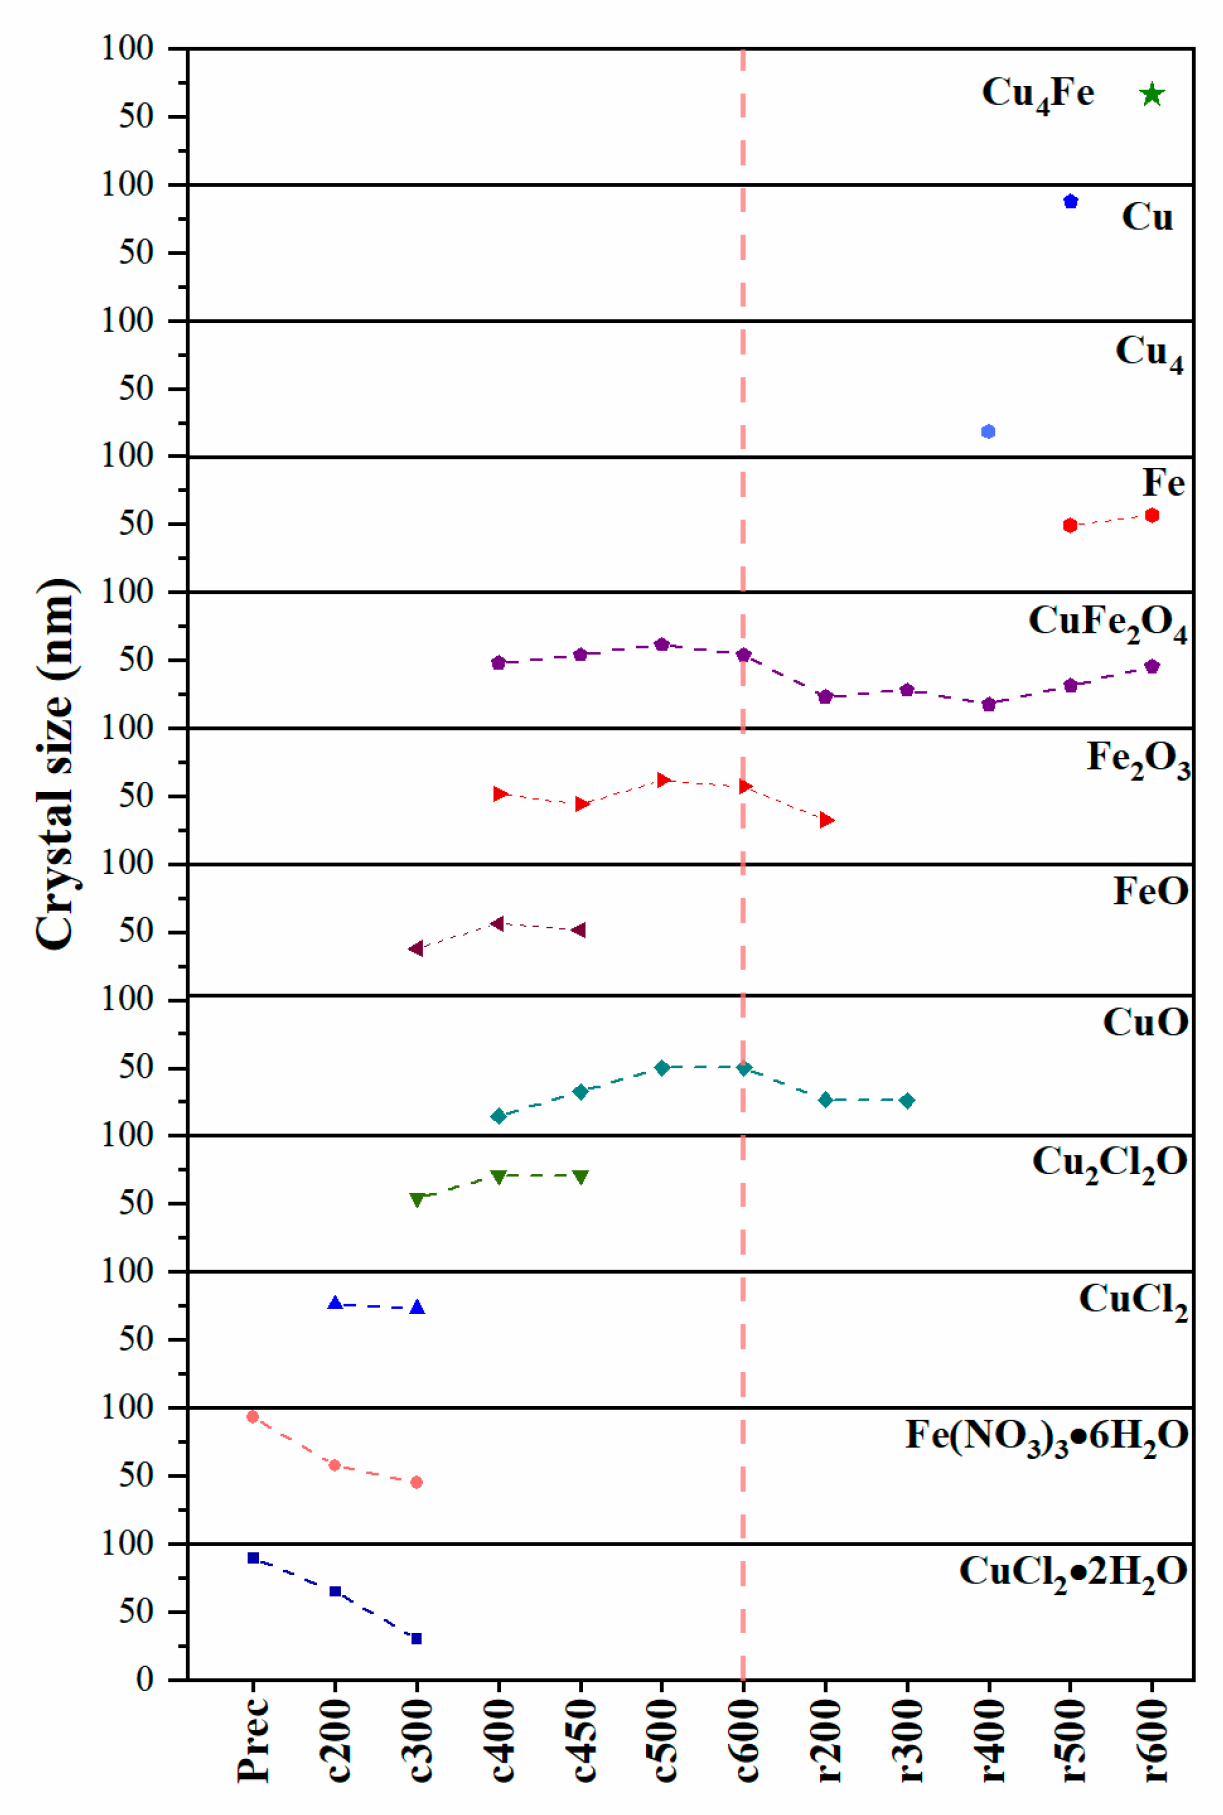
3.5. Mean Crystal Size as a Function of Treatment Temperature

In addition, to better understand the formation of CuFe bulk during calcination and reduction, we have used XRD analysis to calculate the average crystallite size and its temperature-dependent changes using the Scherrer Equation (3), where D is the crystallite size (Å), λ is the wavelength (1.5418 Å), Scherrer’s constant K (0.9) is for good approximation [29], and β is the full width at half maximum (FWHM). The potential influence of error propagation and other factors that could contribute to peak broadening, such as variations in particle composition, was not considered in the determination of FWHM. The measurement was performed on the peak with the highest intensity within each phase. That is: Fe(NO3)3·6H2O, 22.3°; CuCl2·2H2O, 16.2°; CuCl2, 15.5°; Cu2Cl2O, 17.6°; CuO, 38.7°; FeO, 41.7°; Fe2O3, 33.2°; Fe, 44.8°; CuFe2O4, 62.7°; Cu4, 43.6 °: Cu, 43.3°; Cu4Fe, 43.2°.
D = K λ β cos θ .
This parameter shows the thermal behavior of the different phases of iron and copper as the temperature increases, transitioning from an oxidative to a reductive system, as shown in Figure 5 (in order to optimize visual clarity, the zero value was rendered transparent, and a uniform 50 nm separation was maintained for all data points), following the proposed reaction system for CuFe bulk formation. It can be observed that the copper precursor salt undergoes major changes first, with dehydration and the formation of chloride species, which react until they are completely consumed to form copper oxide. However, the iron precursor salt is initially observed to decompose into FeO, which is consumed as the temperature increases, until it is exhausted and transformed into Fe2O3.
During the reduction stage, the formation of CuO and Fe2O3 species was observed, which subsequently led to the creation of the initial bimetallic specie, CuFe2O4. Throughout the reduction process, these species were exclusively present. The transformation continued until both CuO and Fe2O3 were entirely consumed, ultimately yielding metallic Cu and Fe, as well as the bimetallic Cu4Fe.
Crystallite size analysis is a valuable tool for understanding how the species are formed or consumed with respect to the temperature and their current stage. Of particular interest is the formation of the bimetallic species, which was found at the temperature of 600 °C in the reduction stage. The reduction in CuFe2O4, an inverse spinel where copper and iron atoms occupy tetrahedral and octahedral sites in an oxygen lattice, in which copper and metallic iron atoms diffuse and coalesce, forms an intermetallic phase. This process involves the migration of atoms through the crystal structure as the reduction proceeds. Another process to which this formation is attributed is the reduction in CuFe2O4. The reduction in spinel CuFe2O4 is attributed to the susceptibility of Cu2+ atoms in octahedral sites to be reduced to metallic Cu, due to their location and coordination. Simultaneously, Fe3+ in octahedral sites can be reduced to metallic Fe, and the resulting Cu4Fe phase is organized in an ordered and repetitive structure [30,31,32].

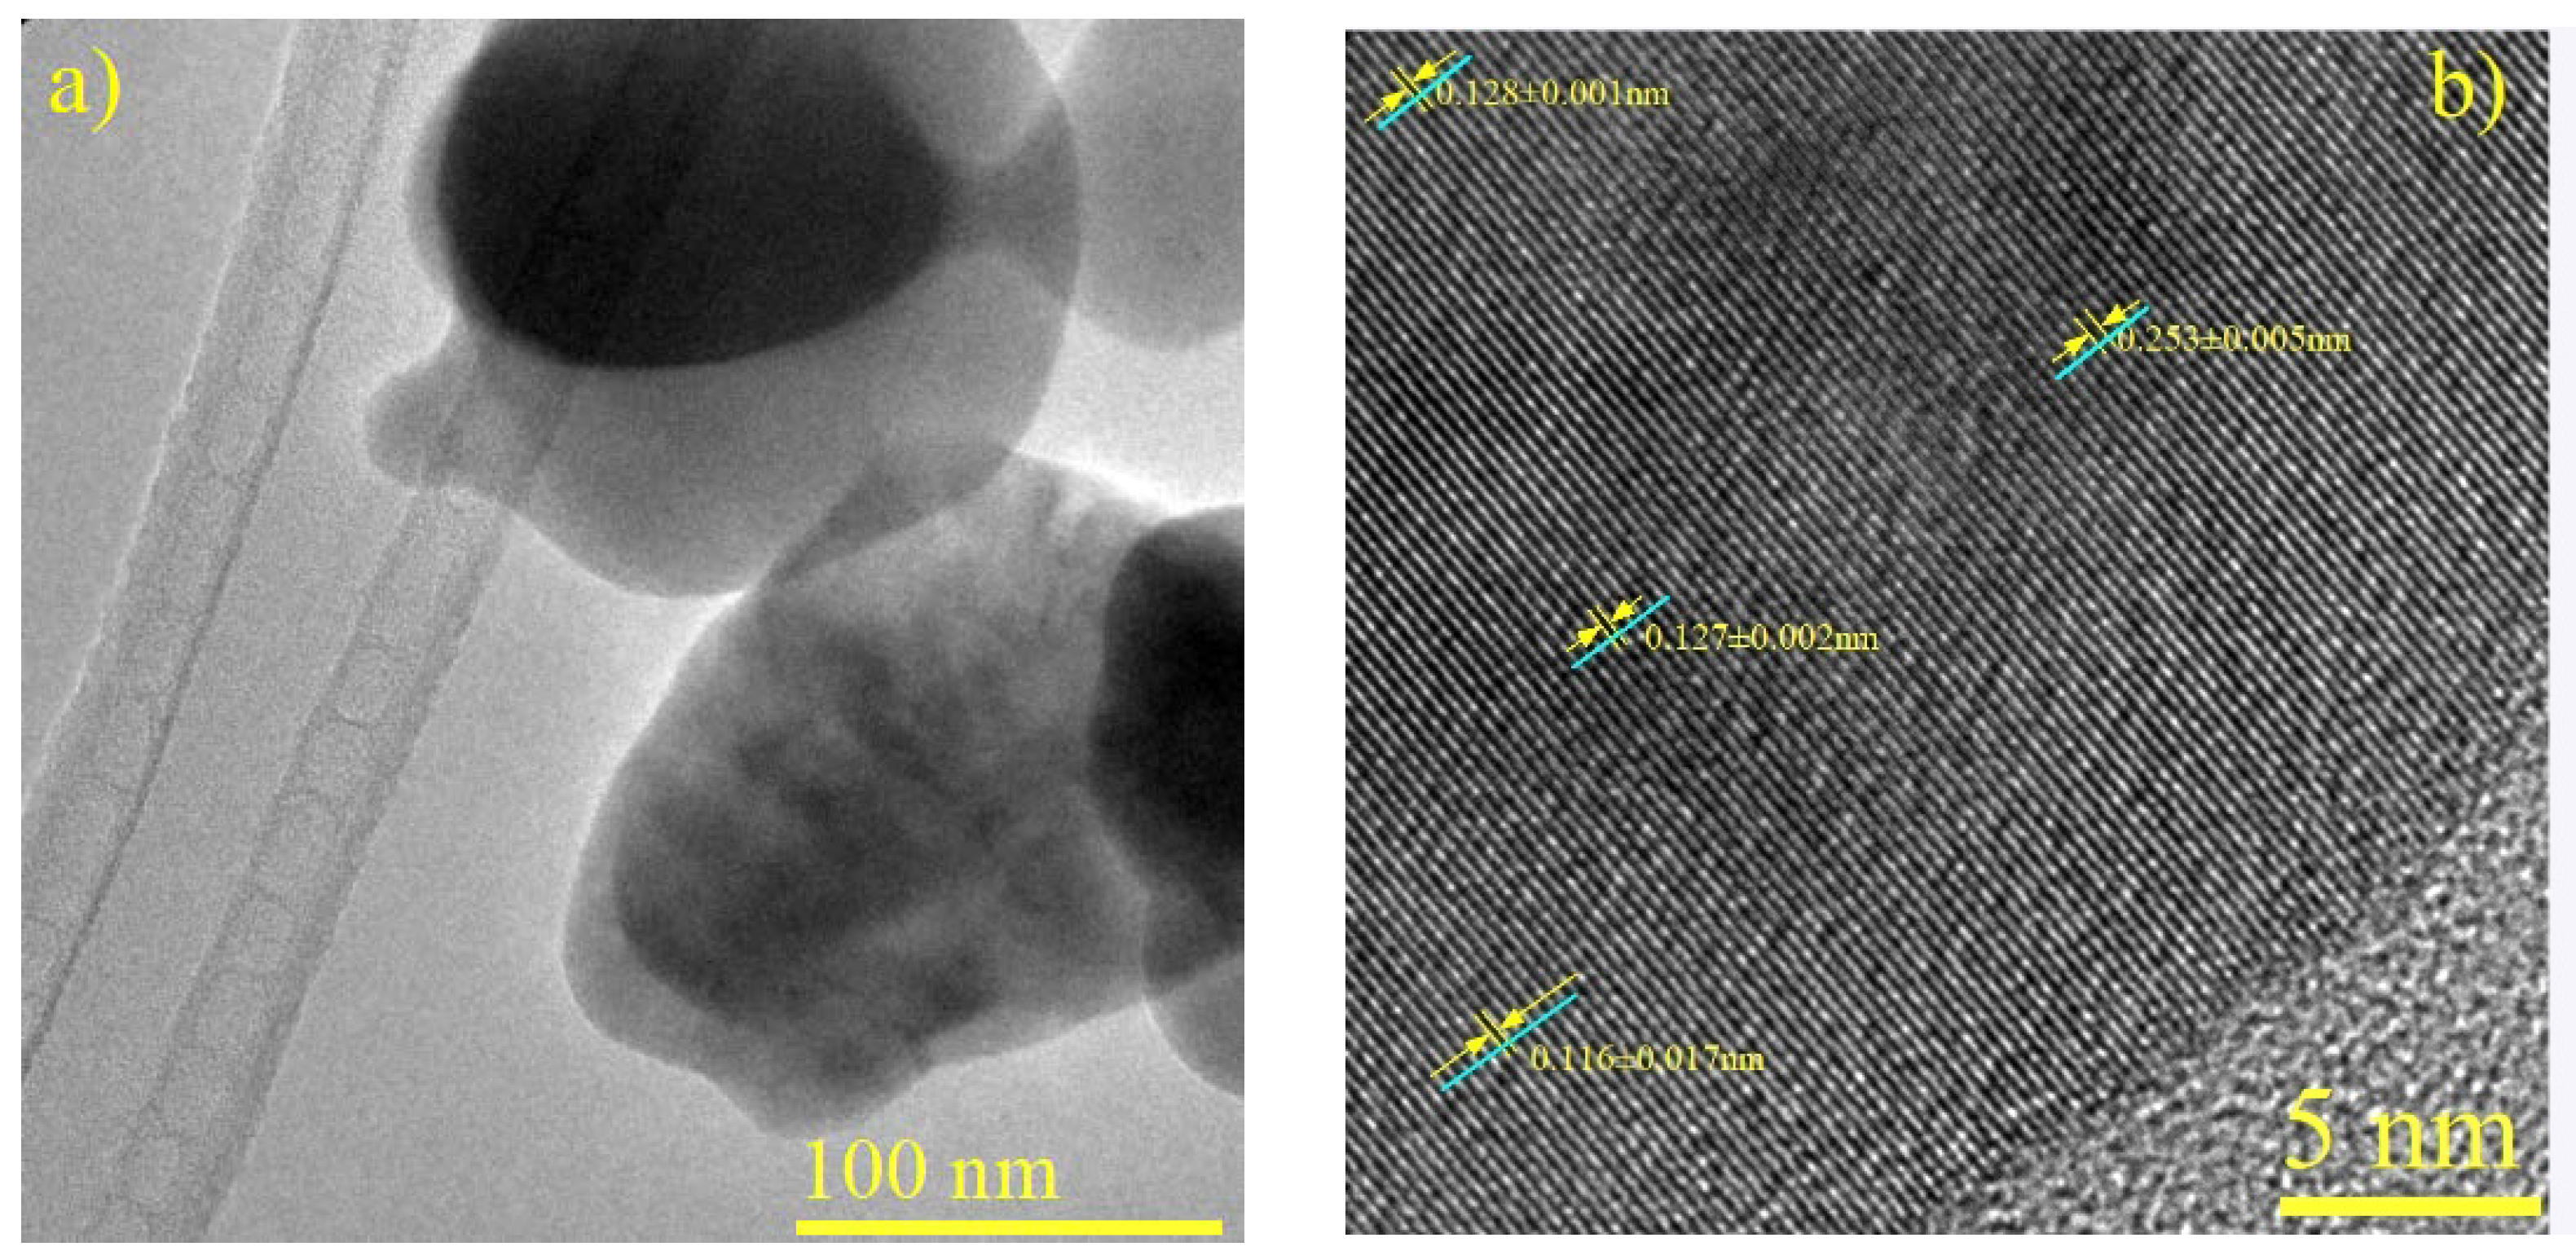
3.6. Crystallographic Analysis of CuFe Catalysts and CuFe/Al2O3 Supported Catalysts

HRTEM images show the nanoscale morphology of CuFe-bulk and CuFe/Al2O3 catalyst powders, providing insights into their structural characteristics. The examination involves determining interplanar distances (ID) values, denoted in angstroms (Å), and their corresponding Miller indices, which indicate the orientation and configuration of the crystallographic planes within the catalyst microstructure.
Significant measurements emerge among the discerned ID values. In Figure 6b (a micrograph of CuFe-r600) an ID of 0.253 nm is observed, corresponding to the (131) plane of CuFe2O4 (JCPDS N° 96-901-2439) This indicates the presence of oxide bimetallic species. In another region, an ID of 0.128 nm aligns with the (202) plane of Cu4Fe (JCPDS N° 03-065-7002), while the detection of (022) planes belonging to Cu4 exhibits an ID of 0.127 nm (JCPDS N° 96-431-3208). Additionally, an ID of 0.116 nm corresponds to the (211) plane of metallic iron (JCPDS N° 01-087-0722).
Figure 7a, a micrograph of CuFe/Al2O3-r600, shows brightness variations across the sample analyzed, as revealed by XRD and HRTEM for the CuFe bulk samples and their different oxide, metallic, and bimetallic phases. In Figure 7b, we determined that ID 0.252 nm corresponds to the (111) plane of Fe2O3 (JCPDS N° 01-089-8104), ID 0.213 nm corresponds to the (200) plane of the catalytic support (g-alumina) (JCPDS N° 01-1303), and ID 0.208 nm corresponds to the (111) plane of the bimetallic species Cu4Fe (JCPDS N° 03-065-7002). This was further confirmed by analyzing the SAED in Figure 7c, which also showed the (111) and (220) planes, as well as the (002) plane corresponding to the metallic phase of copper (JCPDS N° 96-431-3208).
The analysis of Figure 6 and Figure 7 allowed for the determination of crystallographic parameters, which were then correlated with XRD analyses to reveal the structural complexities and phase composition of bimetallic catalysts such as CuFe. The bulk and supported catalysts contain metallic phases, metal oxides, and bimetallic structures, providing them with a wide range of potential applications [33].

3.7. Comprehensive Analysis and Reaction Dynamics in CuFe Bulk Formation

The formation process of the bimetallic catalyst has been investigated by considering TGA and XRD results corresponding to the bulk sample, treated at different temperatures and different systems (oxidative or reduction). In order to provide a more precise description of the evolution of the system over time and under different atmospheric conditions, we propose the term “dynamics” to more accurately reflect the objectives of our research. This approach allowed the evolution of chemical species to be followed at different temperatures within the solid system, leading to the identification of a total of 11 species that interact over the entire temperature range studied, and during the calcination and reduction processes. Detailed results for these species, labeled sequentially as “Si”, and their molecular compound weights, which is calculated by summing the atomic weights of all constituent atoms, with the standard atomic weights (H = 1.008 u, O = 16.00 u, N = 14.01 u, Cl = 35.45 u, Fe = 55.85 u, Cu = 63.55 u) are valuable. These values were necessary for the conversion of weights utilized in TGA tests to moles and were presented in Table 1.
This analysis is fundamental for understanding the intricate chemical dynamics during the synthesis of bimetallic CuFe catalysts. It provides valuable information on the different stages and chemical reactions involved in the formation of these materials. In addition, it will improve our understanding of reproducible catalyst preparation and will establish critical correlations with key factors such as calcination and reduction temperatures, which is crucial for the design and optimization of catalyst synthesis [3,34].
Subsequently, the chemical species involved in the calcination and reduction processes were identified through XRD (Figure 2a and Figure 4a), after which the chemical reactions occurring in each temperature range were proposed, from the precursor to the final CuFe bulk samples reduced at 600 °C (CuFe-r600), as presented in Table 2. In order to streamline the reaction system and facilitate a comprehensive and intelligible analysis, it was resolved to conduct the balance of the reactions without incorporating the anionic and cationic species. This resolution, founded upon the fundamental tenets of general chemistry, aspires to enhance the intelligibility and accessibility of the results, while maintaining the integrity and precision of the analysis.
After obtaining the system, the reactions involved in the oxidation stage are analyzed. The different species involved, from the precursor salts to the different oxides and bimetallic oxides, decrease and increase as a function of temperature, using experimental data from TGA. A mathematical model has been developed to analyze experimental data using a kinetic model that considers all reactions occurring in series and in parallel during catalyst preparation. To solve the mathematical model and determine the kinetic parameters by fitting the experimental data, we used the MATLAB® software (R2017b) optimization function fminsearch. Nevertheless, this function does not provide an explicit indication of the errors or uncertainties associated with the fitted parameters. Consequently, this study employs the objective function (Equation (12)), which serves as a key metric to assess the quality and accuracy of the model fit. Furthermore, the overall errors calculated using this function for the proposed model are also reported.
o b j e c t i v e   f u n c t i o n = i = 1 n m a s s i e x p m a s s i s i m 2 n × 100
where “n” is the number of experimental data, massi is the mass of each species, the superscript “exp” is the experimental data obtained from the TGA, and the superscript “sim” is the data obtained from the mathematical model. The goal is to minimize the difference between the actual experimental mass values (TG) and the simulated mass values in order to optimize the method. Reactions (4)–(11) were considered elementary and sequential by calculating the net reaction rates ((rSi)NET) and rate constant (ki) for each species.
Net reaction rates of calcination stage:
r S 1 N E T = k 1 S 1
r S 2 N E T = k 1 S 1 2 k 3 S 2 2 S 3 S 4 4 k 4 S 2 4 S 3 S 4
r S 3 N E T = k 2 S 3 k 3 S 2 2 S 3 S 4 k 4 S 2 4 S 3 S 4
r S 4 N E T = k 2 S 3 k 3 S 2 2 S 3 S 4 k 4 S 2 4 S 3 S 4
r S 5 N E T = k 3 S 2 2 S 3 S 4 k 5 S 5 S 7 4
r S 6 N E T = k 4 S 2 4 S 3 S 4 + k 5 S 5 S 7 4
r S 7 N E T = 2 k 3 S 2 2 S 3 S 4 4 k 5 S 5 S 7 4
r S 8 N E T = r S 6 N E T = r S 9 N E T = k 4 S 2 4 S 3 S 4 + k 5 S 5 S 7 4
r S 9 N E T = r S 8 N E T = r S 6 N E T = k 4 S 2 4 S 3 S 4 + k 5 S 5 S 7 4
Net reaction rates of reduction stage:
r S 6 N E T = k 6 S 6 S 8 k 7 S 6
r S 8 N E T = k 6 S 6 S 8
r S 9 N E T = k 6 S 6 S 8 k 8 S 9 S 11 3
r S 10 N E T = k 8 S 9 S 11 3
r S 11 N E T = k 7 [ S 6 ] 3 k 8 S 9 S 11 3
r S 12 N E T = r S 10 = k 8 S 9 S 11 3
The Arrhenius Equation (28) has demonstrated success in analyzing kinetic data across various scientific domains, including chemical reactions, nucleation kinetics, kinetics of linear advancement at reactive interfaces, and reaction geometry, among others [35].
k i = A i e E a i R T
Conventional kinetic analyses of various chemical processes, both in homogeneous and heterogeneous systems, usually follow a two-step procedure. These methods evaluate fundamental parameters, such as the activation energy (Eai) and the pre-exponential factor (Ai), based on a previously estimated reaction mechanism. This approach allows for the interpretation of rate control concerning the rate at which reactants disperse from each other. When dispersion affects the reaction rate, it suggests that the reaction is under diffusion control. Therefore, the activation energy must be low (less than 12 kcal/mol). If the activation energy is high (reflected in an Eai/RT ratio greater than 1), the reaction rate is influenced more by the number of molecules that have enough energy to overcome the activation barrier than by the diffusion rate itself. In situations where the activation energy is very high, the reaction is under activation control [36,37].
Figure 8 displays the TGA modeling results for (a) CuFe-prec and (b) CuFe-c600 using Equations (13)–(27), and the kinetic parameters presented in Table 3. The models fit the experimental data of the concentration profiles with an overall error of less than 3%, more specifically with 2.13% for the calcination stage and 0.95% for the reduction stage, indicating a good fit of the parameters. However, when analyzing Figure 8, within the range of 50 to 60 min (500 to 600 °C reduction state), there is a poor fit between the experimental data to the calculated data due to an abrupt slowing down, showing a shift from a chemisorption mechanism to a diffusion mechanism [38,39]. Starting with the description of the first stages (Equations (4)–(7)), where dehydration reactions occur, as well as the decomposition of the precursor salts to their corresponding oxides, the focus is mainly on the transport mechanism [40] (less than 12 kcal/mol). This is followed by a description of the chemical reactions (chemisorption) for the subsequent reactions. This behavior has been observed during the formation of the spinel CuFe2O4. However, it is important to maintain objectivity and avoid subjective evaluations. During the system analysis, it was observed that as the temperature increased after spinel formation (Equation (9)), CuO continued to decompose to form Cu without passing through Cu2O. This may be due to chemical adsorption processes [22,41]. However, in the last reaction, which is dominated by transport mechanisms, the increase in temperature causes the depletion of the CuFe2O4 spinel to form Cu4Fe, Cu, and Fe. This results in increased resistance to the passage of H2 through the dense matrix of spinel and metals [42,43,44].

3.8. Catalytic Hydrogenation of Furfural: Conversion and Yield

Once the catalysts and bulk materials had been synthesized and characterized, they were subjected to testing in a one-pot reaction for the hydrogenation of furfural, Figure 9 illustrates the conversion and yield outcomes of the reaction.
The catalysts were tested in the hydrogenation of furfural under 4 MPa of pressure and 170 °C. In order to evaluate the influence of the thermal treatment, a preliminary test without a catalyst was carried out under the same catalytic conditions. The catalytic data reported that the furfural conversion was only 12%, obtaining FA as a product.
The catalytic results for the CuFe-Al2O3 catalysts reveal that the conversion of furfural improves as the reduction temperature increases, remaining in the following order: CuFe-Al2O3-c600 < CuFe-Al2O3-r300 < CuFe-Al2O3-r600. For the CuFe-bulk catalysts, it has been demonstrated that CuFe-r300 exhibits a slightly higher conversion of furfural in comparison to CuFe-r600. This can be attributed to the fact that, when reduced at a higher temperature, the grain size will differ, and the distribution of the metallic and bimetallic species will be different [45]. It is expected that Cu-species can be partially reduced at room temperature and totally reduced at 300 °C. However, both Cu and Fe-species must be reduced to 600 °C. In all cases, the CuFe-Al2O3 catalysts outperform CuFe-bulk and achieved significantly higher conversion values, this is due to the effective reduction in furfural in the hydrogenation process, which is believed to be due to the effective reduction in Cu and Fe species, as well as the formation of Cu4Fe active sites. It is more probable that FUR will be adsorbed and hydrogenated on the (111) planes of Cu4Fe than on other planes [9,46]. As demonstrated by the studies conducted by Sitthisa and Resasco in 2011, the (111) plane of Cu exhibits a pronounced repulsion of the furan ring, selectively attracting the carbonyl group and enhancing the efficacy of the catalyst [9]. On the other hand, those catalysts, where Cu and Fe-species are reduced, display higher furfural conversion values, reaching a full conversion after 6 h of reaction at 170 °C and 4 MPa. Regarding the obtained products, FA is the main product, reaching a maximum yield of 76.7% when the CuFe-Al2O3 catalyst is reduced to 600 °C. This compound is considered valuable since it is widely used in the polymer field due to its high thermostability [47]. The formation of this product agrees with the data reported in the literature since Cu-based catalysts can only attack the carbonyl group while the interaction of the Cu-sites promoting its reduction to furfuryl alcohol with the furanic ring is considered negligible [48].
The catalytic results also reveal the formation of a small proportion of MF. This compound is obtained from the hydrogenolysis of FA, forming a molecule of H2O as a by-product. This reaction is promoted by the presence of Lewis acid sites as well as by the presence of Cu-species with low particle size [49]. However, the yield is below 3% in all cases.
In the same way, FA can also be etherified with the alcohol used as a solvent by the presence of Lewis or Brönsted acid sites forming iPFE. The catalytic results show how this compound is mainly obtained when the catalyst is not reduced, or the reduction takes place at 300 °C. These data suggest that the partial presence of Cu2+ and Fe2+ or Fe3+-species must promote the presence of Lewis acid sites, which can be involved in the etherification reaction [50]. In the same way, the presence of acid sites can promote the opening of the aromatic ring, forming isopropyl levulinate (iPL) as a product [51].
Despite the primary focus of the present work on the study of heterogeneous catalysts, it should be noted that others are exploring homogeneous catalysts combined with Brønsted acids for the hydrogenation of furfural, achieving higher selectivity towards products such as γ-valerolactone [52,53,54]. However, these processes present significant challenges, including more complex separation, lower recyclability of the catalyst, and greater environmental implications, which renders them less favorable compared to the advantages offered by heterogeneous catalytic systems such as the one presented in this work.

4. Conclusions

In this study, a solid-state kinetic model was fitted and validated with experimental results of a comprehensive set of analytical techniques, including XRD, TGA, DTA, and TPR characterization techniques of CuFe catalysts under various thermal and reductive conditions.
Our findings indicate that the CuFe-bulk bimetallic system undergoes significant structural changes during both oxidation and reduction processes, forming oxide, metallic and bimetallic phases, such as CuFe2O4 and Cu4Fe. These transformations were further correlated with the catalytic performance in the hydrogenation of furfural.
The kinetic analysis, supported by a detailed reaction mechanism and mathematical modeling, provided a deeper understanding of these catalysts’ thermal behavior and reaction dynamics. The model demonstrated a high degree of accuracy in predicting the mass changes during calcination and reduction. However, some discrepancies indicated transitions between chemical and diffusion control mechanisms at higher temperatures.
Catalytic tests revealed that the CuFe/Al2O3 catalysts exhibited superior performance in furfural hydrogenation compared to their bulk counterparts. This was attributed to the effective reduction in Cu and Fe species and the presence of active Cu4Fe sites. Furthermore, the formation of minor by-products such as MF and iPFE was influenced by the presence of Lewis and Brönsted acid sites, demonstrating the intricate interplay between catalyst structure and catalytic activity.
Future work will concentrate on optimizing these catalysts and exploring their applications in other catalytic processes to further enhance their utility and effectiveness.

Author Contributions

B.J.L.G.: investigation, methodology, data curation, writing—original draft. J.R.D.l.R.: conceptualization, formal analysis, funding acquisition, project administration, supervision, data curation, validation, visualization, writing—original draft. E.M.S.C.: methodology, supervision. C.J.L.-O.: methodology, supervision. M.A.G.-N.: methodology, supervision. C.S.M.: methodology, supervision, formal analysis. R.M.-T.: funding acquisition, methodology, supervision. J.A.C.-B.: supervision, writing—review and editing. A.I.M.: funding acquisition, methodology, supervision, writing—review and editing. All authors have read and agreed to the published version of the manuscript.

Funding

Spanish Ministry of Science and Innovation, projects PID2021-126235OB-C32 and, funded by MCIN/AEI/https://doi.org/10.13039/501100011033 (accessed on 1 Febraruary 2025) and FEDER funds and by Facultad de Ciencias Químicas, UANL 02-84347-PST-21/300, Mexico.

Data Availability Statement

The data presented in this study are available on request from the corresponding author.

Acknowledgments

The scholarship to Doctoral Degree student (Bárbara Jazmín Lino Galarza) was sponsored by the National Council of Humanities, Sciences and Technologies (CONAHCYT) of Mexico.

Conflicts of Interest

The authors declare no conflict of interest.

References

  1. Kalong, M.; Srifa, A.; Hongmanorom, P.; Cholsuk, C.; Klysubun, W.; Ratchahat, S.; Koo-amornpattana, W.; Khemthong, P.; Assabumrungrat, S.; Kawi, S. Catalytic Transfer Hydrogenation of Furfural to Furfuryl Alcohol and 2-Methylfuran over CuFe Catalysts: Ex Situ Observation of Simultaneous Structural Phase Transformation. Fuel Process. Technol. 2022, 231, 107256. [Google Scholar] [CrossRef]
  2. Shen, X.; Wu, D.; Fu, X.-Z.; Luo, J.-L. Highly Selective Conversion of Methane to Ethanol over CuFe2O4-Carbon Nanotube Catalysts at Low Temperature. Chin. Chem. Lett. 2022, 33, 390–393. [Google Scholar] [CrossRef]
  3. Schöllhorn, R. Solid-State Chemistry: Restoring the Balance. Angew. Chem. (Int. Ed. Engl.) 1996, 35, 2338. [Google Scholar] [CrossRef]
  4. Morales-Leal, F.J.; Rivera De la Rosa, J.; Lucio-Ortiz, C.J.; Bustos Martínez, D.; De Haro Del Rio, D.A.; Garza-Navarro, M.A.; Martínez-Vargas, D.X.; Garcia, C.D. Comparison between the Catalytic and Photocatalytic Activities of Cu/Al2O3 and TiO2 in the Liquid–Phase Oxidation of Methanol–Ethanol Mixtures: Development of a Kinetic Model for the Preparation of Catalyst. Appl. Catal. A Gen 2018, 562, 184–197. [Google Scholar] [CrossRef]
  5. Kohlmann, H. Looking into the Black Box of Solid-State Synthesis. Eur. J. Inorg. Chem. 2019, 2019, 4174–4180. [Google Scholar] [CrossRef]
  6. Gao, M.; Zhang, X.; Dai, S.; Wang, K.W. Tin as a Co-Catalyst for Electrocatalytic Oxidation and Reduction Reactions. Inorg. Chem. Front. 2023, 11, 1019–1047. [Google Scholar] [CrossRef]
  7. Arias, K.S.; Liu, L.; Garcia-Ortiz, A.; Climent, M.J.; Concepcion, P.; Iborra, S.; Corma, A. Bimetallic CuFe Nanoparticles as Active and Stable Catalysts for Chemoselective Hydrogenation of Biomass-Derived Platform Molecules. Catal. Sci. Technol. 2021, 11, 3353–3363. [Google Scholar] [CrossRef]
  8. Resasco, D.E.; Sitthisa, S.; Faria, J.; Prasomsri, T.; Ruiz, M.P. Furfurals as Chemical Platform for Biofuels Production. In Solid Waste as a Renewable Resource: Methodologies; Taylor & Francis: London, UK, 2015; pp. 103–144. ISBN 9781771882392. [Google Scholar]
  9. Sitthisa, S.; Resasco, D.E. Hydrodeoxygenation of Furfural Over Supported Metal Catalysts: A Comparative Study of Cu, Pd and Ni. Catal. Lett. 2011, 141, 784–791. [Google Scholar] [CrossRef]
  10. Sitthisa, S.; Sooknoi, T.; Ma, Y.; Balbuena, P.B.; Resasco, D.E. Kinetics and Mechanism of Hydrogenation of Furfural on Cu/SiO2 Catalysts. J. Catal. 2011, 277, 1–13. [Google Scholar] [CrossRef]
  11. Scholz, D.; Aellig, C.; Hermans, I. Catalytic Transfer Hydrogenation/Hydrogenolysis for Reductive Upgrading of Furfural and 5-(Hydroxymethyl)Furfural. ChemSusChem 2014, 7, 268–275. [Google Scholar] [CrossRef] [PubMed]
  12. Dimas-Rivera, G.L.; de la Rosa, J.R.; Lucio-Ortiz, C.J.; de los Reyes Heredia, J.A.; González, V.G.; Hernández, T. Desorption of Furfural from Bimetallic Pt-Fe Oxides/Alumina Catalysts. Materials 2014, 7, 527–541. [Google Scholar] [CrossRef]
  13. Maderuelo-Solera, R.; Jiménez-Gómez, C.P.; Cecilia, J.A.; García-Sancho, C.; Moreno-Tost, R.; Jesús Maireles-Torres, P. Catalysts Based on Ni and Mg Oxides for the One-Pot Production of High Added-Value Products from Furfural. Adv. Sustain. Syst. 2024, 8, 2300638. [Google Scholar] [CrossRef]
  14. Wang, Z.; Marin, G.; Naterer, G.F.; Gabriel, K.S. Thermodynamics and Kinetics of the Thermal Decomposition of Cupric Chloride in Its Hydrolysis Reaction. J. Therm. Anal. Calorim. 2015, 119, 815–823. [Google Scholar] [CrossRef]
  15. Wieczorek-Ciurowa, K.; Kozak, A.J. Thermal Decomposition of Fe(NO3)3·9H2O. J. Therm. Anal. Calorim. 1999, 58, 647–651. [Google Scholar] [CrossRef]
  16. Sun, Z.; Liu, L.; zeng Jia, D.; Pan, W. Simple Synthesis of CuFe2O4 Nanoparticles as Gas-Sensing Materials. Sens. Actuators B Chem. 2007, 125, 144–148. [Google Scholar] [CrossRef]
  17. Jeong, D.W.; Jha, A.; Jang, W.J.; Han, W.B.; Roh, H.S. Performance of Spinel Ferrite Catalysts Integrated with Mesoporous Al2O3 in the High Temperature Water-Gas Shift Reaction. Chem. Eng. J. 2015, 265, 100–109. [Google Scholar] [CrossRef]
  18. Melnikov, P.; Nascimento, V.A.; Arkhangelsky, I.V.; Zanoni Consolo, L.Z.; de Oliveira, L.C.S. Thermal Decomposition Mechanism of Iron(III) Nitrate and Characterization of Intermediate Products by the Technique of Computerized Modeling. J. Therm. Anal. Calorim. 2014, 115, 145–151. [Google Scholar] [CrossRef]
  19. Małecka, B.; Łącz, A.; Drozdz, E.; Małecki, A. Thermal Decomposition of D-Metal Nitrates Supported on Alumina. J. Therm. Anal. Calorim. 2015, 119, 1053–1061. [Google Scholar] [CrossRef]
  20. Dissanayake, D.M.S.N.; Mantilaka, M.M.M.G.P.G.; Pitawala, H.M.T.G.A. Synthesis of Low-Cost Magnetite Nano-Architectures from Sri Lankan Laterites. J. Geol. Soc. Sri Lanka 2020, 21, 91. [Google Scholar] [CrossRef]
  21. Singh, R.V.; Pai, M.R.; Banerjee, A.M.; Thomas, D.; Patkare, G.S.; Phapale, S.; Nayak, C.; Bhasin, V.; Tripathi, A.K. Studies on Reaction Products, Byproducts, and Intermediates in Thermal Steps of the Cu-Cl Thermochemical Cycle for Hydrogen Generation. Energy Fuels 2023, 37, 15206–15221. [Google Scholar] [CrossRef]
  22. Kim, J.Y.; Rodriguez, J.A.; Hanson, J.C.; Frenkel, A.I.; Lee, P.L. Reduction of CuO and Cu2O with H2: H Embedding and Kinetic Effects in the Formation of Suboxides. J. Am. Chem. Soc. 2003, 125, 10684–10692. [Google Scholar] [CrossRef] [PubMed]
  23. Mdletshe, L.S.; Makgwane, P.R.; Ray, S.S. Fabrication of Bimetal CuFe2O4 Oxide Redox-Active Nanocatalyst for Oxidation of Pinene to Renewable Aroma Oxygenates. Nanomaterials 2019, 9, 1140. [Google Scholar] [CrossRef] [PubMed]
  24. Yeste, M.P.; Vidal, H.; García-Cabeza, A.L.; Hernández-Garrido, J.C.; Guerra, F.M.; Cifredo, G.A.; González-Leal, J.M.; Gatica, J.M. Low Temperature Prepared Copper-Iron Mixed Oxides for the Selective CO Oxidation in the Presence of Hydrogen. Appl. Catal. A Gen. 2018, 552, 58–69. [Google Scholar] [CrossRef]
  25. Kumar, A.; Malvi, B. Iron Oxide Based Catalysts: A Temperature Programmed Reduction Study. Res. J. Chem. Sci. 2021, 11, 39–45. [Google Scholar]
  26. Zhu, X.; Zhang, J.; Yan, J.; Shen, L. Characteristic Evaluation and Process Simulation of CuFe2O4as Oxygen Carriers in Coal Chemical Looping Gasification. ACS Omega 2021, 6, 4783–4792. [Google Scholar] [CrossRef] [PubMed]
  27. Wu, X.; Zhou, K.; Wu, W.; Cui, X.; Li, Y. Magnetic Properties of Nanocrystalline CuFe2O4 and Kinetics of Thermal Decomposition of Precursor. J. Therm. Anal. Calorim. 2013, 111, 9–16. [Google Scholar] [CrossRef]
  28. Chawla, A.K.; Chandra, R. Synthesis and Structural Characterization of Nanostructured Copper. J. Nanopart. Res. 2009, 11, 297–302. [Google Scholar] [CrossRef]
  29. Holzwarth, U.; Gibson, N. The Scherrer Equation versus the “Debye-Scherrer Equation”. Nat. Nanotechnol. 2011, 6, 534. [Google Scholar] [CrossRef] [PubMed]
  30. Xu, H.; Bao, H.; Li, Y.; Bai, H.; Ma, F. Atomic Scale Insights into the Rapid Crystallization and Precipitation Behaviors in FeCu Binary Alloys. J. Alloys Compd. 2021, 882, 160725. [Google Scholar] [CrossRef]
  31. Ou, X. Molecular Dynamics Simulations of Fcc-to-Bcc Transformation in Pure Iron: A Review. Mater. Sci. Technol. 2017, 33, 822–835. [Google Scholar] [CrossRef]
  32. Pugachev, V.M.; Zaharov, Y.A.; Datiy, K.A.; Popova, A.N.; Bogomyakov, A.S. The Temperature Effect on Properties of Fe-Co-Ni Nanostructured System. Eurasian Chem.-Technol. J. 2015, 17, 193–200. [Google Scholar] [CrossRef]
  33. Ndolomingo, M.J.; Bingwa, N.; Meijboom, R. Review of Supported Metal Nanoparticles: Synthesis Methodologies, Advantages and Application as Catalysts. J. Mater. Sci. 2020, 55, 6195–6241. [Google Scholar] [CrossRef]
  34. Frade, J.R.; Cable, M. Reexamination of the Basic Theoretical Model for the Kinetics of Solid–State Reactions. J. Am. Ceram. Soc. 1992, 75, 1949–1957. [Google Scholar] [CrossRef]
  35. Khawam, A.; Flanagan, D.R. Solid-State Kinetic Models: Basics and Mathematical Fundamentals. J. Phys. Chem. B 2006, 110, 17315–17328. [Google Scholar] [CrossRef] [PubMed]
  36. Ašperger, S. Chemical Kinetics and Reaction Mechanisms. Mcgraw-Hill: New York, NY, USA, 2003; ISBN 9781461348719. [Google Scholar]
  37. House, J.E. Principles of Chemical Kinetics. Academic Press: Cambridge, MA, USA, 2007; ISBN 9780123567871. [Google Scholar]
  38. Galwey, A.K. Eradicating Erroneous Arrhenius Arithmetic. Thermochim Acta 2003, 399, 1–29. [Google Scholar] [CrossRef]
  39. Sorokova, N.; Variny, M.; Pysmennyy, Y.; Kol’chik, Y. Mathematical Model and Numerical Method of Calculating the Dynamics of High-Temperature Drying of Milled Peat for the Production of Fuel Briquettes. Computation 2023, 11, 53. [Google Scholar] [CrossRef]
  40. Strydom, C.A.; Hudson-Lamb’, D.L.; Potgieter, J.H.; Dagg, E. Thermochimica Acta The Thermal Dehydration of Synthetic Gypsum*. Thermochim Acta 1995, 269, 631–638. [Google Scholar] [CrossRef]
  41. Lupan, O.; Postica, V.; Ababii, N.; Hoppe, M.; Cretu, V.; Tiginyanu, I.; Sontea, V.; Pauporté, T.; Viana, B.; Adelung, R. Influence of CuO Nanostructures Morphology on Hydrogen Gas Sensing Performances. Microelectron. Eng. 2016, 164, 63–70. [Google Scholar] [CrossRef]
  42. Szekely, J.; Evans, J.W. Studies in Gas-Solid Reactions: Part I. A Structural Model for the Reaction of Porous Oxides with a Reducing Gas. Metall. Trans. 1971, 2, 1691–1698. [Google Scholar] [CrossRef]
  43. Halim, K.S.A.; Khedr, M.H.; Zaki, A.H. Kinetics and Mechanisms of the Reduction of Cu0.5Zn0.5Fe2O4 with Hydrogen at 400-600 °C for the Production of Metallic Nanoparticles. J. Anal. Appl. Pyrolysis 2007, 80, 346–352. [Google Scholar] [CrossRef]
  44. Khedr, M.H.; Farghali, A.A.; Abdel-Khalek, A.A. Microstructure, Kinetics and Mechanisms of Nano-Crystalline CuFe2O4 Reduction in Flowing Hydrogen at 300-600 °C for the Production of Metallic Nano-Wires. J. Anal. Appl. Pyrolysis 2007, 78, 1–6. [Google Scholar] [CrossRef]
  45. Wang, Y.; Zhao, D.; Rodríguez-Padrón, D.; Len, C. Recent Advances in Catalytic Hydrogenation of Furfural. Catalysts 2019, 9, 796. [Google Scholar] [CrossRef]
  46. Chen, H.-Z.; Liu, J.; Mi, T.-G.; Wu, Y.-W.; Hu, B.; Zhou, X.-Y.; Zhang, B.; Lu, Q. Theoretical Study on the Hydrogenation of Furfural for Furfuryl Alcohol Production over Low Ni Modified Cu Catalysts. Appl. Surf. Sci. 2023, 613, 156106. [Google Scholar] [CrossRef]
  47. Yan, K.; Wu, G.; Lafleur, T.; Jarvis, C. Production, Properties and Catalytic Hydrogenation of Furfural to Fuel Additives and Value-Added Chemicals. Renew. Sustain. Energy Rev. 2014, 38, 663–676. [Google Scholar] [CrossRef]
  48. García-Sancho, C.; Mérida-Robles, J.M.; Cecilia-Buenestado, J.A.; Moreno-Tost, R.; Maireles-Torres, P.J. The Role of Copper in the Hydrogenation of Furfural and Levulinic Acid. Int. J. Mol. Sci. 2023, 24, 2443. [Google Scholar] [CrossRef] [PubMed]
  49. Jiménez-Gómez, C.P.; Cecilia, J.A.; Moreno-Tost, R.; Maireles-Torres, P. Selective Production of 2-Methylfuran by Gas-Phase Hydrogenation of Furfural on Copper Incorporated by Complexation in Mesoporous Silica Catalysts. ChemSusChem 2017, 10, 1448–1459. [Google Scholar] [CrossRef]
  50. Antunes, M.M.; Lima, S.; Neves, P.; Magalhães, A.L.; Fazio, E.; Fernandes, A.; Neri, F.; Silva, C.M.; Rocha, S.M.; Ribeiro, M.F.; et al. One-Pot Conversion of Furfural to Useful Bio-Products in the Presence of a Sn,Al-Containing Zeolite Beta Catalyst Prepared via Post-Synthesis Routes. J. Catal. 2015, 329, 522–537. [Google Scholar] [CrossRef]
  51. Bui, L.; Luo, H.; Gunther, W.R.; Román-Leshkov, Y. Domino Reaction Catalyzed by Zeolites with Brønsted and Lewis Acid Sites for the Production of Γ-Valerolactone from Furfural. Angew. Chem. Int. Ed. 2013, 52, 8022–8025. [Google Scholar] [CrossRef] [PubMed]
  52. Luo, J.; Cheng, Y.; Niu, H.; Wang, T.; Liang, C. Efficient Cu/FeOx Catalyst with Developed Structure for Catalytic Transfer Hydrogenation of Furfural. J. Catal. 2022, 413, 575–587. [Google Scholar] [CrossRef]
  53. Li, F.; Yang, R.; Tian, Z.; Du, Z.; Dai, J.; Wang, X.; Li, N.; Zhang, J. Microwave-Assisted One Pot Cascade Conversion of Furfural to γ-Valerolactone over Sc(OTf)3. Chem.—Eur. J. 2023, 29, e202300950. [Google Scholar] [CrossRef] [PubMed]
  54. Koranchalil, S.; Lobo Justo Pinheiro, D.; Padilla, R.; Nielsen, M. Homogeneous Catalyzed Direct Conversion of Furfural to Gamma-Valerolactone. ChemSusChem 2024, 17, e202301608. [Google Scholar] [CrossRef] [PubMed]
Figure 1. Thermogravimetric (black line) and differential thermal analysis (blue line) of (a) CuFe-prec sample and (b) CuFe/Al2O3-prec sample.
Technologies 13 00063 g001
Figure 2. X-ray Diffraction of (a) CuFe-prec and CuFe-cT samples and (b) CuFe/Al2O3-prec and CuFe/Al2O3-cT samples in oxidizing environment (T = 200 to 600 °C).
Technologies 13 00063 g002
Figure 3. H2-TPR profiles of (a) CuFe-c600 and (b) CuFe/Al2O3-c600, Cu/Al2O3-c600, and Fe/Al2O3-c600 supported samples.
Technologies 13 00063 g003
Figure 4. X-ray Diffraction pattern of (a) CuFe-c600 and CuFe-rT samples and (b) CuFe/Al2O3-c600 and CuFe/Al2O3-rT samples reduced at different temperatures (from T = 200 to 600 °C).
Technologies 13 00063 g004
Figure 5. Crystallite size for the different copper and iron species determined by XRD of CuFe-prec, CuFe-cT, and CuFe-rT. The vertical segmented line is the calcination/reduction transition.
Technologies 13 00063 g005
Figure 6. Characterization of CuFe-r600. (a) HRTEM Micrograph. (b) HRTEM micrograph with labeled interplanar distances.
Technologies 13 00063 g006
Figure 7. Characterization of CuFe/Al2O3-r600. (a,b) HREM micrograph, (c) SAED pattern obtained from the zone shown in (b).
Technologies 13 00063 g007
Figure 8. TGA fitting: (a) CuFe-prec oxidation, (b) CuFe-c600 reduction. Black dots represent experimental data, and a continuous line represents fitting of reaction rate net equation data at temperature rate of 10 °C/min.
Technologies 13 00063 g008
Figure 9. Conversions and yields in the hydrogenation of furfural for CuFe-c600, CuFe-r300, CuFe-r600, CuFe/Al2O3-c600, CuFe/Al2O3-r300, and CuFe/Al2O3-r600 at conditions of reaction: 100 mg of catalyst, 1.0 mmol for furfural 170 °C, 4 MPa of H2 and 6 h.
Technologies 13 00063 g009
Table 1. Chemical species during oxidation and reduction involved in CuFe bulk sample formation.
Chemical SpeciesLabelMolecular Weight (g/mol)
Fe(NO3)3·9H2OS1337.86
Fe(NO3)3·6H2OS2289.83
CuCl2·2H2OS3170.45
CuCl2S4134.40
Cu2Cl2OS5214.00
CuOS679.55
FeOS771.85
Fe2O3S8159.39
CuFe2O4S9239.24
FeS1055.85
CuS1163.55
Cu4FeS12310.05
Table 2. Proposed reaction system for CuFe bulk during the oxidation and reduction stage.
StageProposed Reaction Concerning XRDLabel
Dry Bulk → Prec F e N O 3 3 · 9 H 2 O s F e N O 3 3 · 6 H 2 O ( s ) + 3 H 2 O ( g ) (4)
Prec → c200 C u C l 2 · 2 H 2 O s C u C l 2 s + 2 H 2 O ( g ) (5)
c200 → c300 C u C l 2 · 2 H 2 O s + 2 F e N O 3 3 · 6 H 2 O s + C u C l 2 s 2 F e O s + C u 2 C l 2 O s + 3 N 2 O ( g ) + 14 H 2 O ( g ) + C l 2 ( g ) + 6 O 2 ( g ) (6)
c300 → c400 C u C l 2 · 2 H 2 O s + 4 F e N O 3 3 · 6 H 2 O s + C u C l 2 s C u O s + F e 2 O 3 s + C u F e 2 O 4 s + 6 N 2 O ( g ) + 26 H 2 O ( g ) + 2 C l 2 ( g ) + 14 O 2 ( g ) (7)
c400 → c500 4 F e O s + C u 2 C l 2 O s C u O s + F e 2 O 3 s + C u F e 2 O 4 s + C l 2 ( g ) (8)
r200 → r300 C u O s + F e 2 O 3 s C u F e 2 O 4 s (9)
r300 → r400 C u O s C u s + 1 2 O 2 ( g ) (10)
r400 → r500 C u F e 2 O 4 s + 3 C u s F e s + C u 4 F e s + 2 O 2 ( g ) (11)
c: calcination stage; r: reduction stage.
Table 3. Kinetics parameters of estimated TGA modeling of CuFe bulk.
Oxidation StageReduction Stage
ParameterValueParameterValue
A1 (min−1)9.72 × 10⁴A6 (min−1)1.05 × 10⁴
Ea1 (kcal/mol)10.11Ea6 (kcal/mol)13.02
A2 (min−1)9.57 × 10⁴A7 (min−1)1.03 × 10⁴
Ea2 (kcal/mol)9.84Ea7 (kcal/mol)14.88
A3 (min−1)1.41 × 10⁵A8 (min−1)1.94 × 10⁶
Ea3 (kcal/mol)11.29Ea8 (kcal/mol)8.17
A4 (min−1)3.25 × 10⁴
Ea4 (kcal/mol)17.06
A5 (min−1)4.54 × 10⁴
Ea5 (kcal/mol)13.85
Disclaimer/Publisher’s Note: The statements, opinions and data contained in all publications are solely those of the individual author(s) and contributor(s) and not of MDPI and/or the editor(s). MDPI and/or the editor(s) disclaim responsibility for any injury to people or property resulting from any ideas, methods, instructions or products referred to in the content.

