Abstract
In the field of histological analysis, one of the typical issues is the analysis of single cells contained in regions of interest (i.e., ROIs). Today, several commercial, freely available, and open-source software options are accessible for this task. However, the literature lacks recent extensive reviews that summarise the functionalities of the opportunities currently available and provide guidance on selecting the most suitable option for analysing specific cases, for instance, irregular freehand-defined ROIs on brightfield images. In this work, we reviewed and compared 14 software tools tailored for single-cell analysis within a 2D histological freehand-defined image ROI. Precisely, six open-source tools (i.e., CellProfiler, Cytomine, Digital Slide Archive, Icy, ImageJ/Fiji, QuPath), four freely available tools (i.e., Aperio ImageScope, NIS Elements Viewer, Sedeen, SlideViewer), and four commercial tools (i.e., Amira, Arivis, HALO, Imaris) were considered. We focused on three key aspects: (a) the capacity to handle large file formats such as SVS, DICOM, and TIFF, ensuring compatibility with diverse datasets; (b) the flexibility in defining irregular ROIs, whether through automated extraction or manual delineation, encompassing square, circular, polygonal, and freehand shapes to accommodate varied research needs; and (c) the capability to classify single cells within selected ROIs on brightfield images, ranging from fully automated to semi-automated or manual approaches, requiring different levels of user involvement. Thanks to this work, a deeper understanding of the strengths and limitations of different software platforms emerges, facilitating informed decision making for researchers looking for a tool to analyse histological brightfield images.
1. Introduction
Recent advancements in histopathology have been driven by innovations in digital imaging and computational analysis [1]. A critical area of focus is evaluating single-cell data within specific regions of interest (ROIs) from high-resolution histological images, particularly for cancer research, immunohistochemistry (IHC), and tissue microenvironment studies. The ability to accurately identify and quantify individual cells within a defined ROI even in a simple brightfield image has significant implications for diagnosis, prognosis, and therapeutic decisions [2]. In fact, it is worth noting that brightfield images are currently used for several pre-clinical and clinical analyses. For instance, multiplexed bright-field methodologies and platforms are, today, the reference for the analysis of predictive markers for immunotherapy [3].
The rise of two-dimensional (2D) whole slide imaging (WSI) and the need for efficient, scalable tools to manage, analyse, and interpret these large datasets has led to the development of various software platforms [4]. These platforms range from commercial to open-source solutions [5], from generalist [6] to specific tools [7], and offer distinct features to accommodate the increasing complexity of modern histological analysis [8]. Despite the availability of such tools, there is a critical need for a comprehensive comparison to guide researchers in selecting the most appropriate software for specific tasks, particularly those involving single-cell analysis within freehand-selected histological ROIs on brightfield images. For example, the authors in [5] recently discussed the growing role of artificial intelligence (AI) in the field of digital pathology, introducing some open-source segmentation tools and analysing their usage and customisation in histological imaging. Similarly, the authors in [9] examined the latest AI and deep learning (DL) techniques for cell analysis and data mining in microscopy images. It is important to note that whilst most available tools permit rectangular ROI selection, very few allow for true irregular freehand selection, and many are optimised for fluorescent images rather than classical widefield brightfield microscopy [10].
This study provides a detailed evaluation of 14 popular tools, encompassing commercial, freely available, and open-source solutions. Specifically, six open-source tools (i.e., CellProfiler [11], Cytomine [12], Digital Slide Archive [13], Icy [14], ImageJ/Fiji [15,16], QuPath [17]), four freely available tools (i.e., Aperio ImageScope, NIS Elements Viewer, Sedeen, SlideViewer), and four commercial tools (i.e., Amira, Arivis, HALO, Imaris) have been considered. The evaluation focuses on aspects important to researchers, including the ability to handle large file formats (e.g., scanner vendor-specific format—SVS, digital imaging and communications in medicine—DICOM, tagged image file format—TIFF), flexibility in defining and extracting ROIs, and the functionality for classifying single cells on brightfield images using automated, semi-automated, or manual techniques.
In this work, a benchmark analysis was conducted using a representative irregular freehand-defined ROI from a brightfield WSI red, green, and blue (RGB) case, providing quantitative insights into the performance of currently available software tools. Notably, most of these tools are originally designed for multi-channel images, the most common image type in the fluorescence domain. Although brightfield multi-channel immunohistochemistry images can be generated by sequentially staining the sample [18], or through multispectral imaging in the range of the visible light [19], we focused the present study on the most prevalent case in brightfield microscopy, the RGB image type [20]. The results indicate that several tools now offer highly accurate solutions. For example, the open-source software QuPath stands out for its comprehensive feature set, comparable to those provided by commercial solutions with annual costly license fees ranging from a few thousand to EUR 25,000, depending on the desired configuration and service. However, it is important to note that evaluating the commercial tools was challenging due to the restricted functionality of the testing license. As such, the reported performance values can be considered a lower bound, with potential for improvement under unrestricted conditions. In conclusion, this analysis serves as a valuable guide to the current options available for single-cell histological analysis, helping researchers better understand what to expect for their specific analytical needs.
The remainder of this article is structured as follows: Section 2 provides a detailed overview of the single-cell analysis tools available today. Section 3 presents a qualitative comparison of the different tools, focusing on performance in handling large datasets and the capabilities of defining ROIs and conducting automated analysis. Section 4 introduces the case study used for the quantitative comparison of the tools, with the results and discussion following in Section 5. Finally, Section 6 concludes the paper by summarising the key findings and offering recommendations for researchers seeking to select the most suitable tool for analysing brightfield images.
2. Description of the Tools
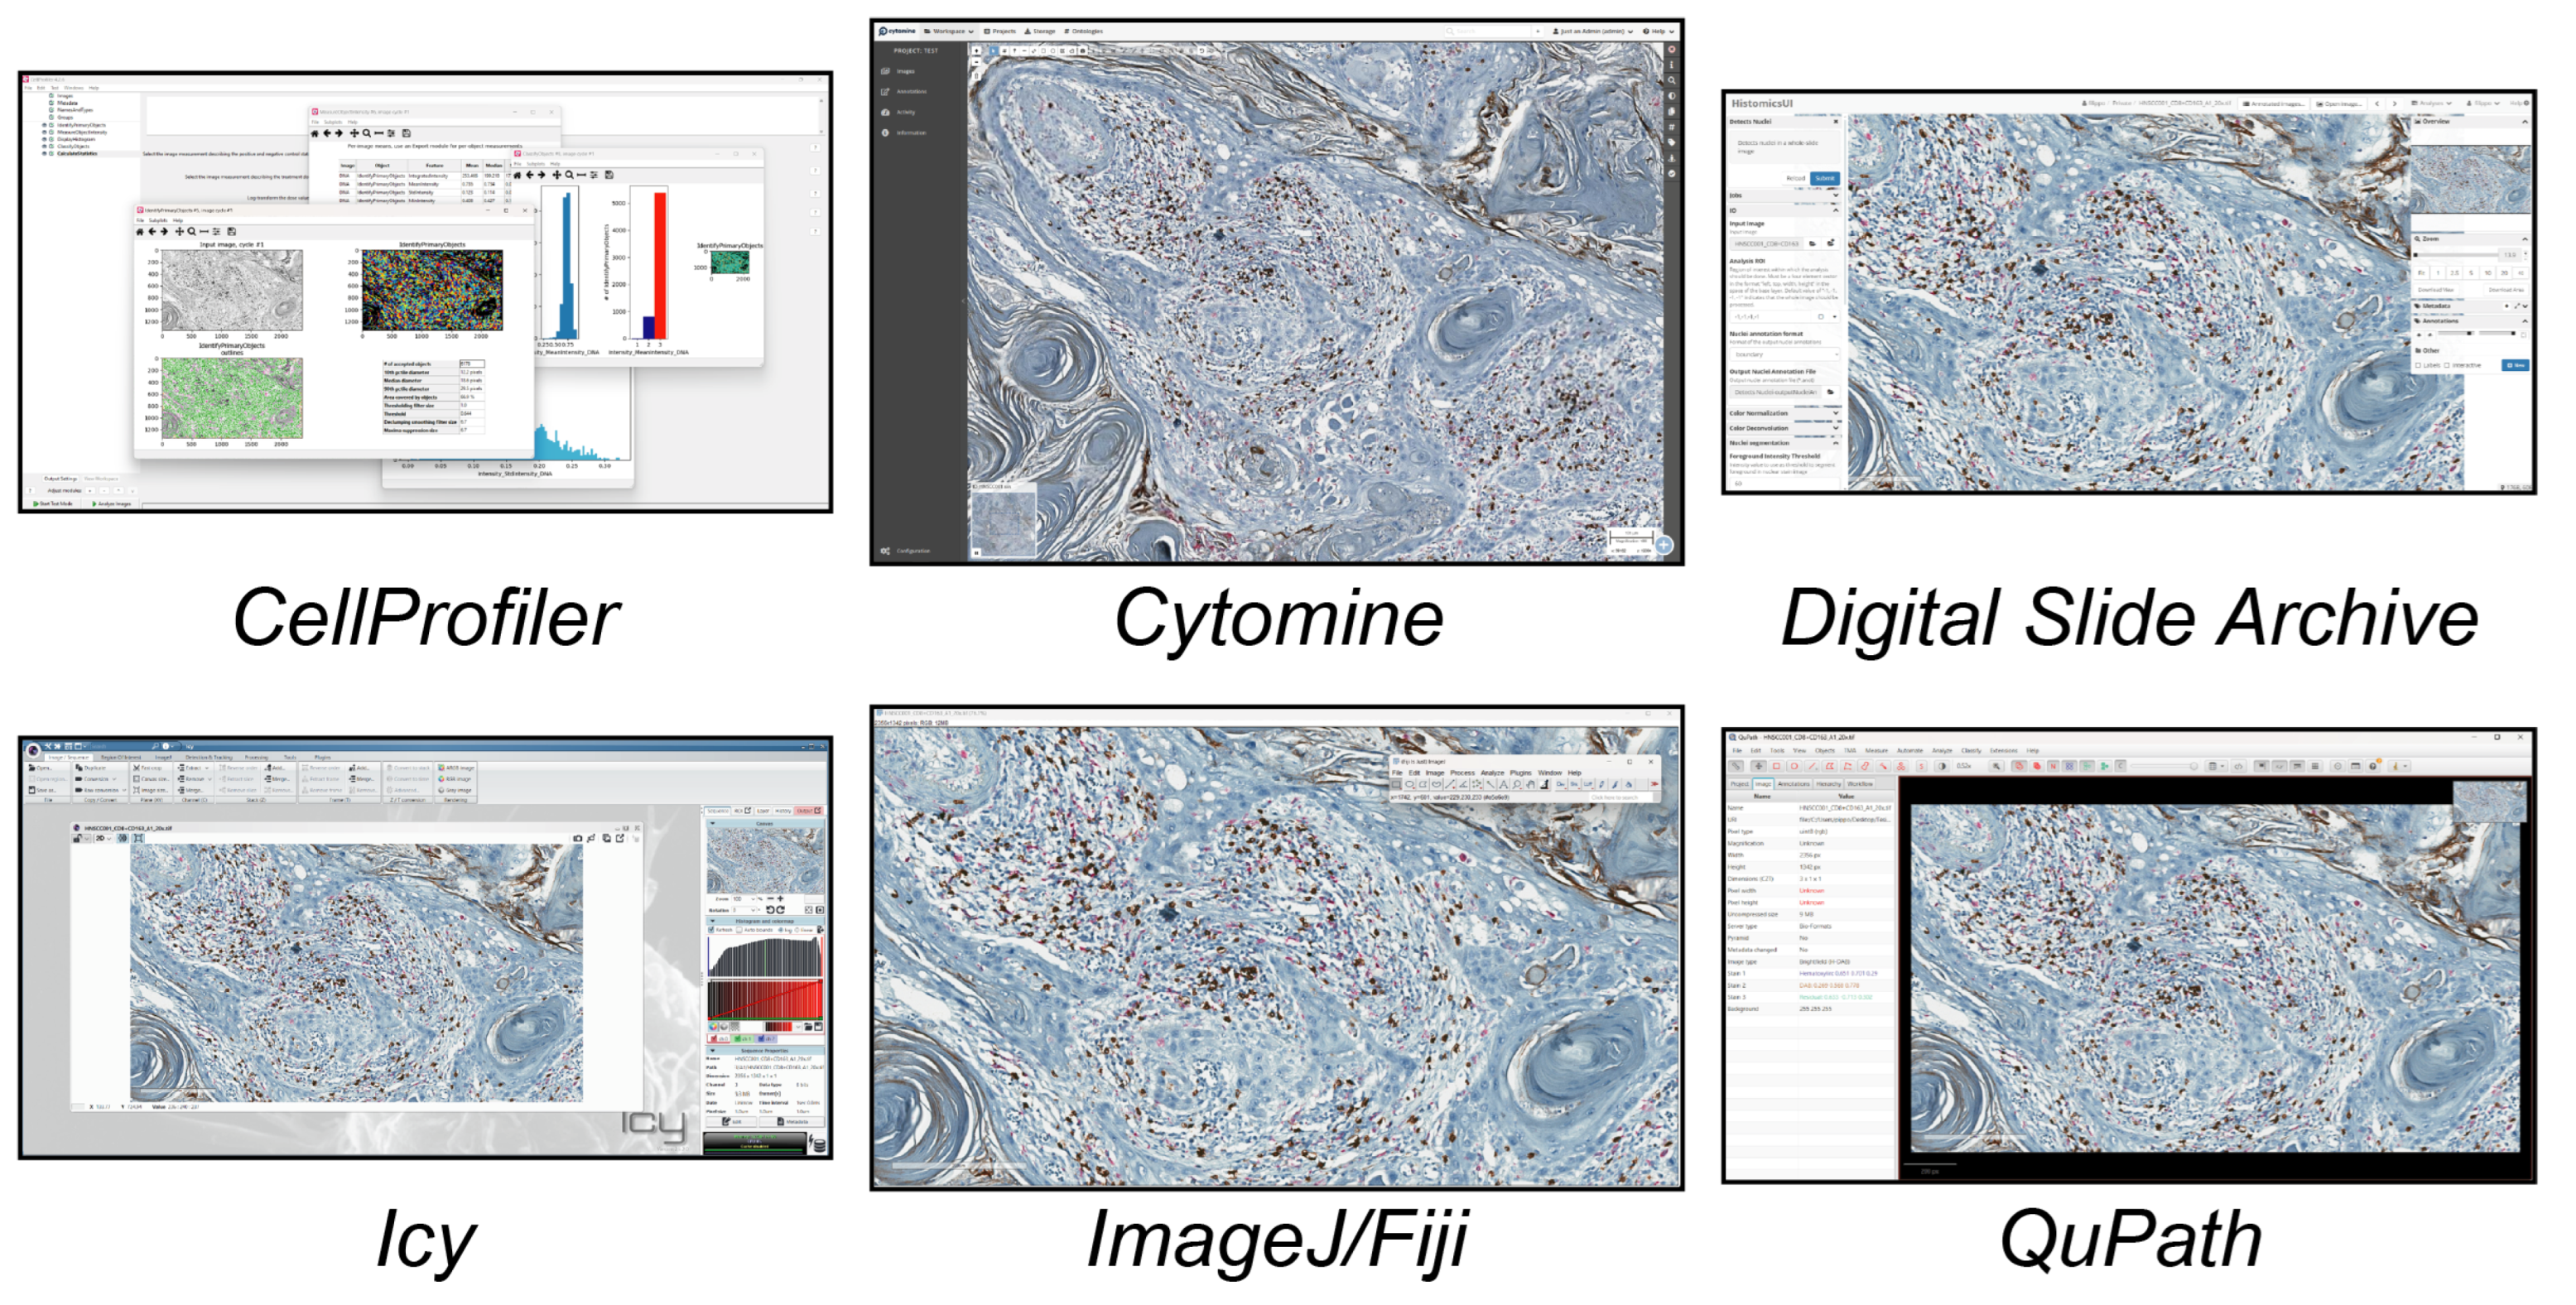
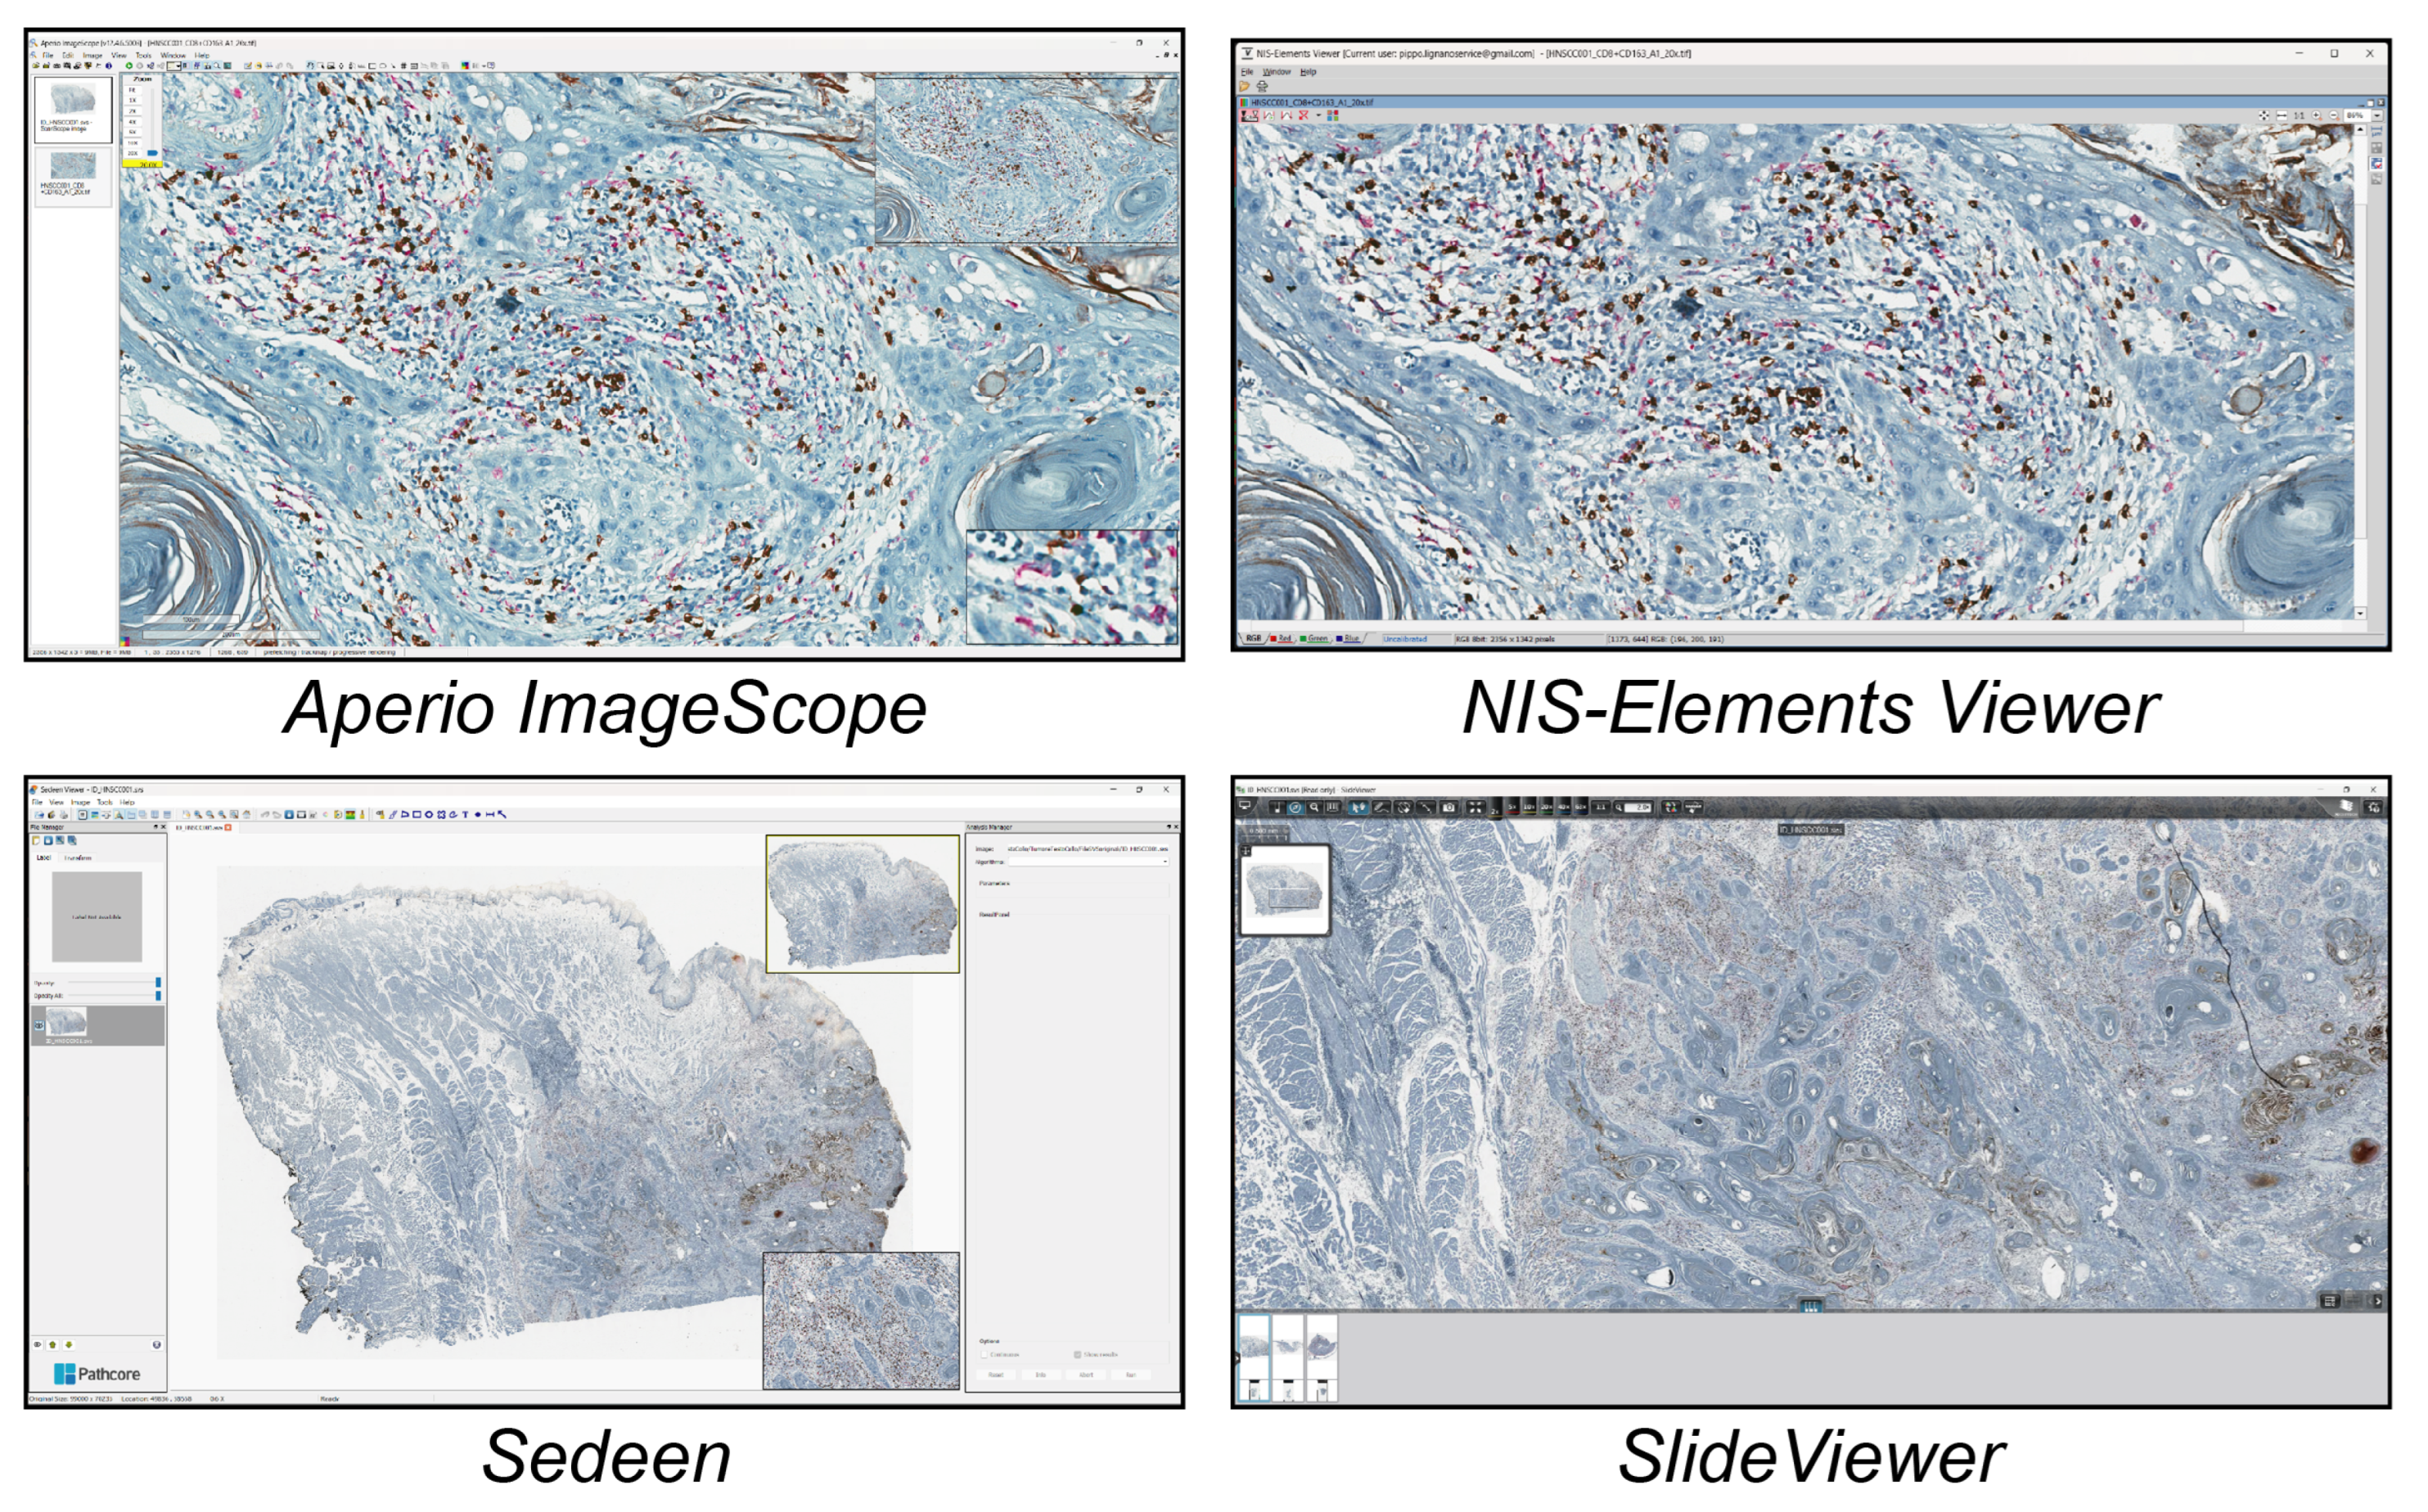
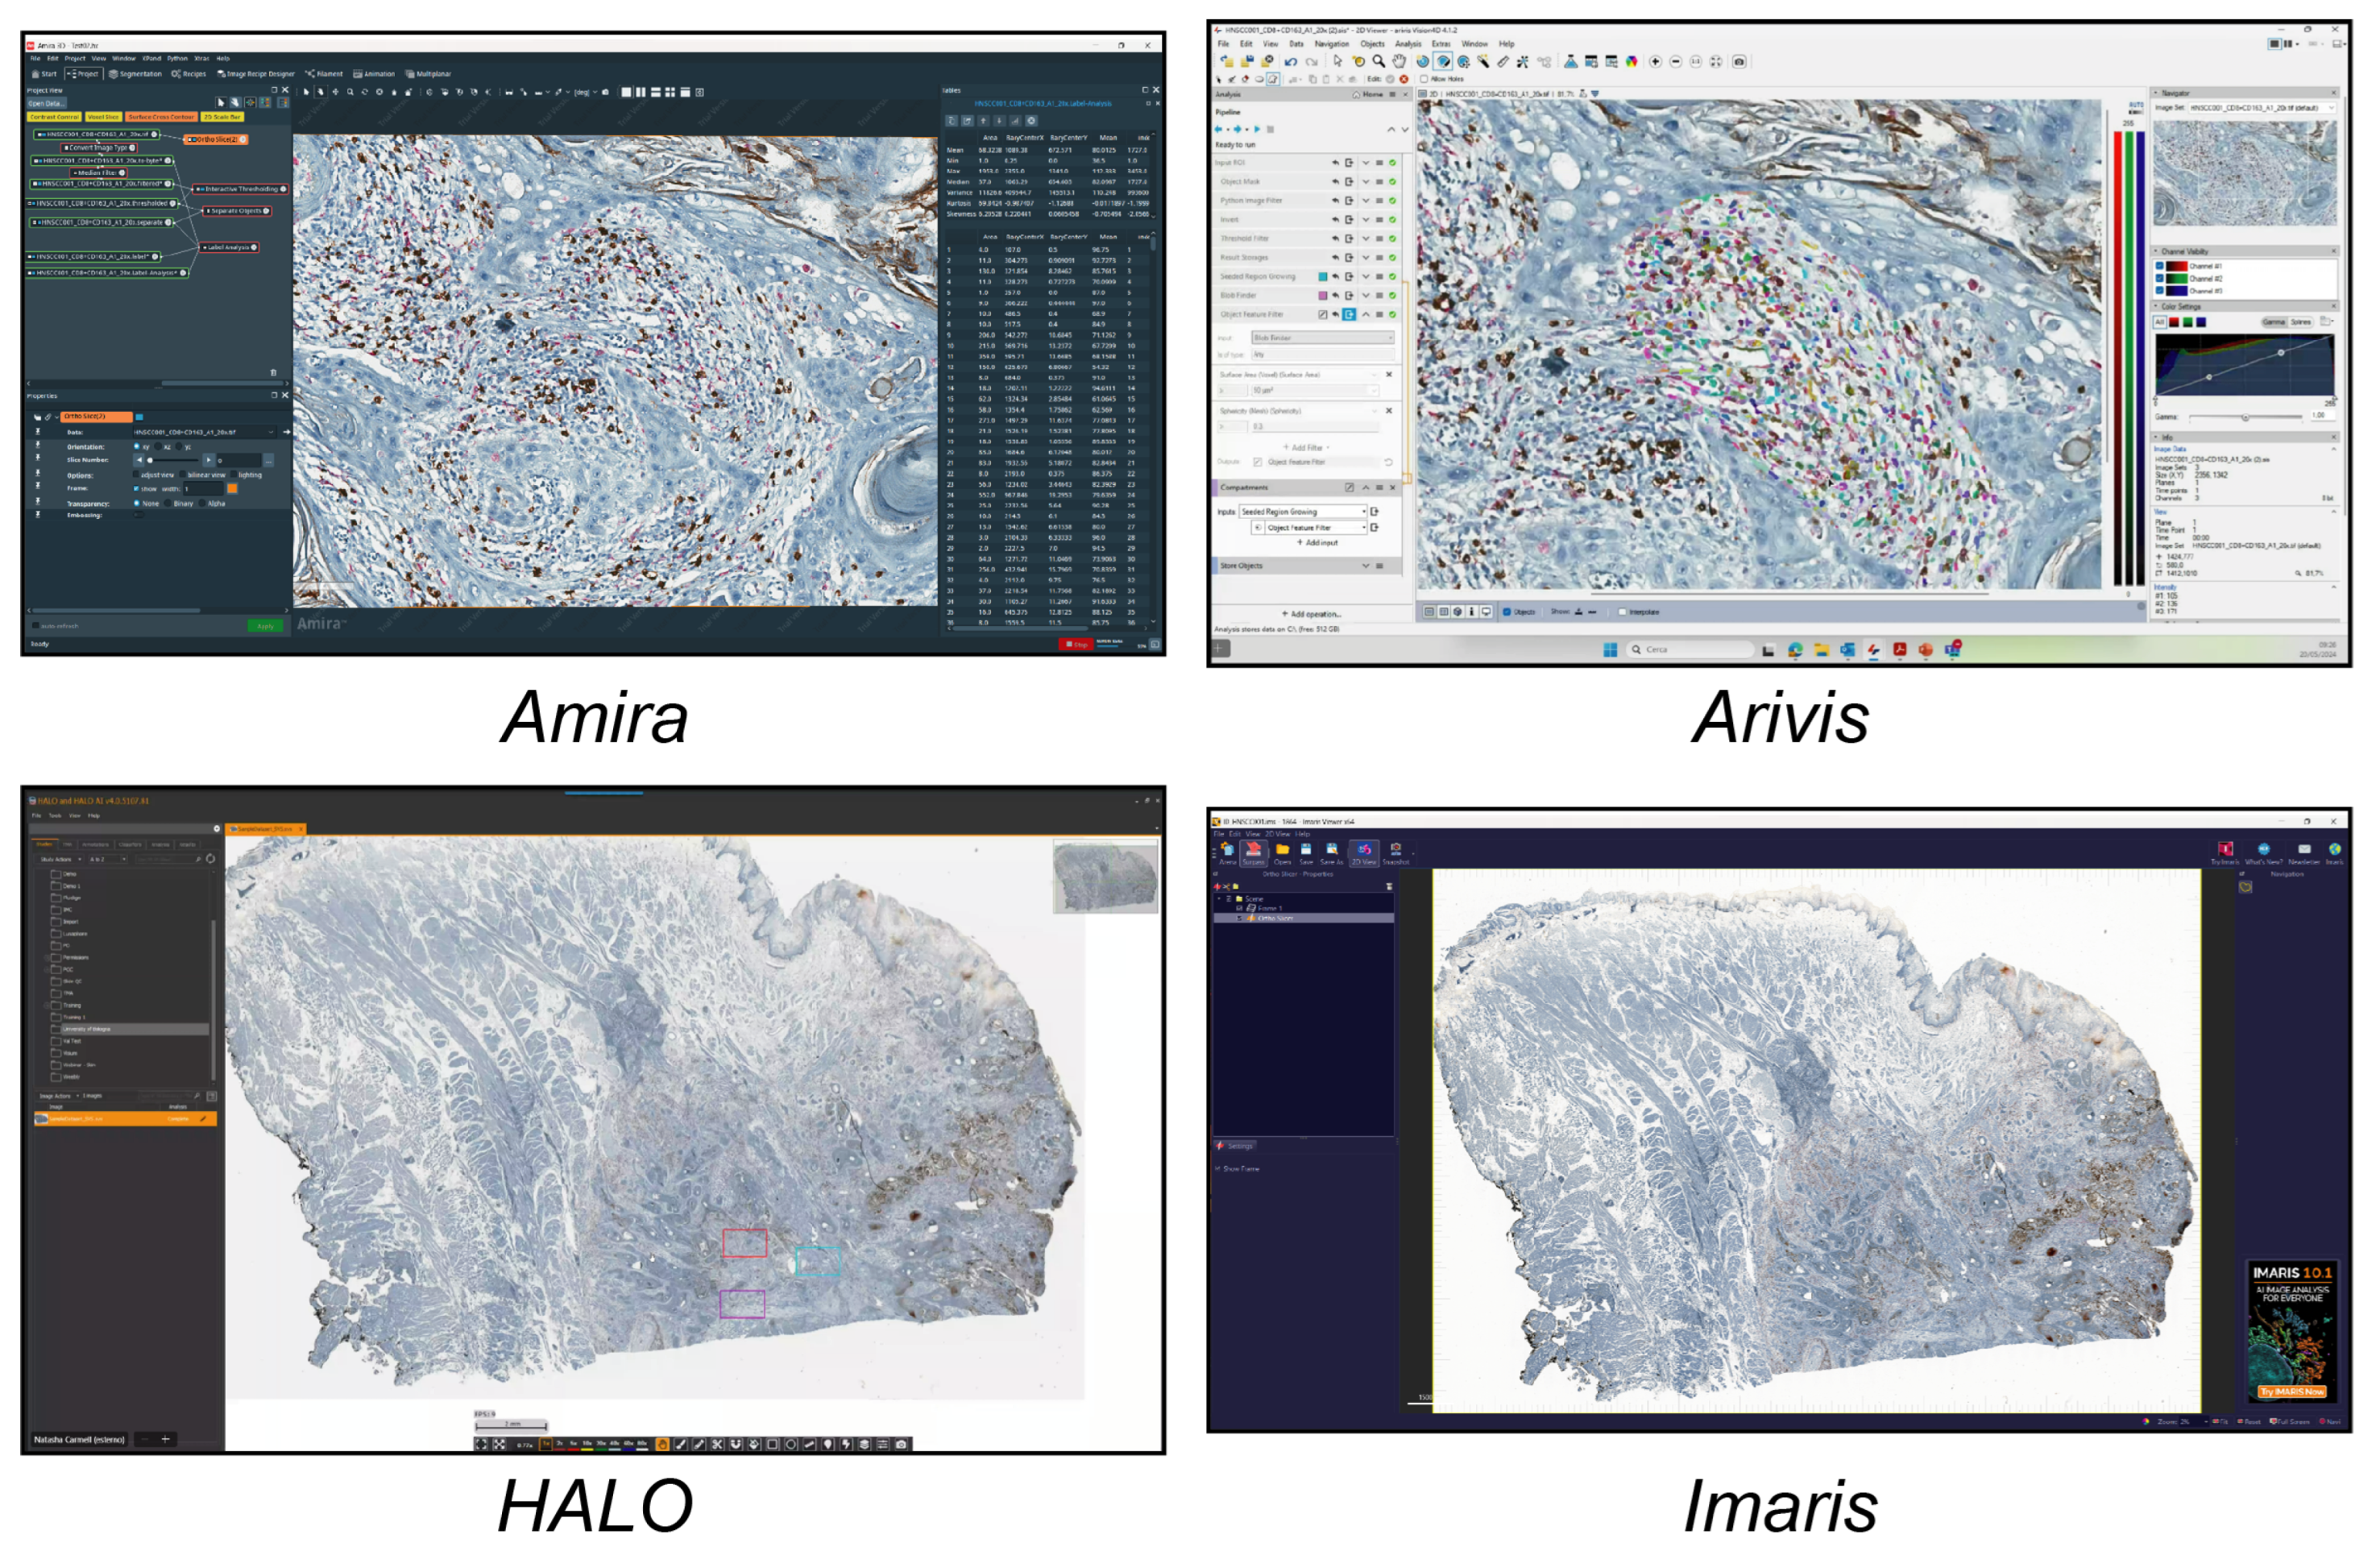
In this study, we analysed the different tools available today for single-cell analysis within a 2D histological WSI ROI. These tools were categorised into three groups. (a) Open-source tools (six tools, Figure 1) included CellProfiler, Cytomine, Digital Slide Archive, Icy, ImageJ/Fiji, and QuPath. (b) Freely available tools (four tools, Figure 2) included Aperio ImageScope, NIS Elements Viewer, Sedeen, and SlideViewer. (c) Commercial tools (four tools, Figure 3) included Amira, Arivis, HALO, and Imaris. What follows is a brief description of the key functionalities and strengths of each tool:
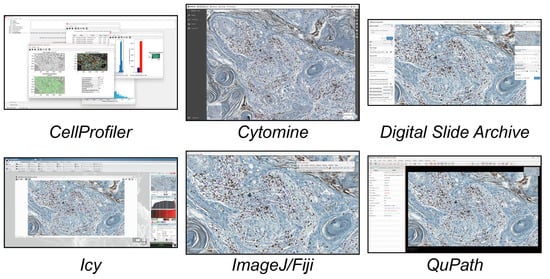
Figure 1.
Main GUI of different open-source single-cell analysis tools. From top to bottom and left to right: CellProfiler, Cytomine, Digital Slide Archive, Icy, ImageJ/Fiji, and QuPath.
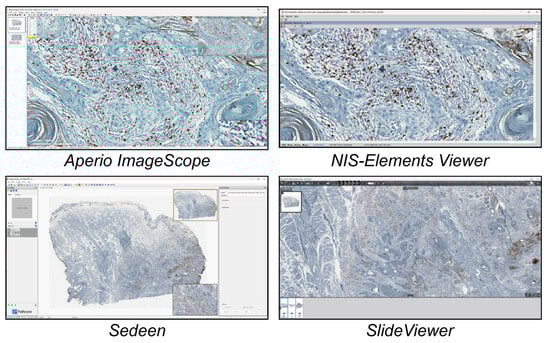
Figure 2.
Main GUI of different freely available single-cell analysis tools. From top to bottom and left to right: Aperio ImageScope, NIS-Elements Viewer, Sedeen, and SlideViewer.
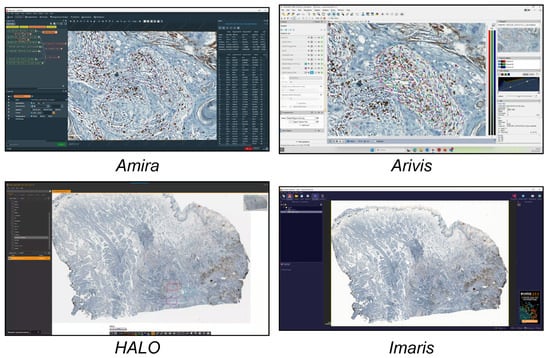
Figure 3.
Main GUI of different commercial single-cell analysis tools. From top to bottom and left to right: Amira, Arivis, HALO, and Imaris.
2.1. Open-Source Tools
CellProfiler (https://cellprofiler.org/) [11]: CellProfiler, originally developed in MATLAB in 2005 [21], is an open-source software with a graphical user interface (GUI) that was improved using Java and Python languages. It supports modular and scalable image processing. Through its GUI, users can construct an image analysis pipeline by assembling a series of functional modules, each responsible for a different task. These modules can be tailored to specific experimental needs by adjusting the parameters. The software is widely used in cellular and molecular biology studies, where the precise quantification of cell morphology, fluorescence intensity, or subcellular structures is required. While CellProfiler provides an intuitive interface for users without coding expertise, more advanced users can further extend its functionalities through integration with external tools such as ImageJ and Python.
Cytomine (https://cytomine.com/) [12]: Cytomine, originally developed at the University of Liège, offers a cloud-based platform for the collaborative and distributed analysis of WSIs. Unlike CellProfiler, it enables multiple users to simultaneously annotate, review, and analyse histological images. In addition, it integrates machine learning opportunities for object detection and cell classification. Its real-time multi-user environment makes it particularly well-suited for projects that involve pathologists, biologists, and data scientists working together, streamlining workflows that require the expert validation of annotations and automated image analysis. Cytomine is particularly suited for large datasets due to its web-based nature, allowing the seamless management of WSI data. Its built-in collaborative features make it unique for team-based projects, although its interface and capabilities require more familiarity with information technology (IT) infrastructure. Its image management system comprises a group of image servers and libraries, such as OpenSlide [22] to read various WSI formats. The user interface enables communication with other modules via hypertext transfer protocol (HTTP) requests. The data mining module includes clients (e.g., Python and Java) that provide foundational functions for accessing resources externally within Cytomine.
Digital Slide Archive (https://digitalslidearchive.github.io/) [13]: Digital Slide Archive (DSA) is a highly scalable platform for WSI management, offering robust tools for storing, viewing, and sharing slides across distributed systems. Initially developed at the University of Atlanta, it is based on the Cancer Digital Slide Archive (CDSA). While the DSA is primarily focused on WSI management, it includes plugins for exporting ROIs and integrating with other analysis tools, such as ImageJ and QuPath, to enable further single-cell analysis. Unlike desktop-based software, DSA is designed for high-performance computing environments, enabling the handling of vast repositories of images without performance degradation. The DSA framework consists of several key components: a Python-based image processing toolkit for quantitative analysis of digital pathology images, a web-based application for visualising, annotating, and processing histology slides to extract both low- and high-level features, a database layer utilising MongoDB, and a web server that offers RESTful APIs for programmatic interaction with the DSA. These APIs enable the efficient management of data, user accounts, annotations, and their associated permissions. The platform also incorporates HistomicsTK (by Kitware Inc., Clifton Park, NY), a Python toolkit that provides a comprehensive set of algorithms for WSI processing and analysis, including pre-processing, segmentation, feature extraction, and other utilities. Additionally, the open-source, web-based Girder plugin, built on OpenSlide, was developed by Kitware to handle ultra-high-resolution images efficiently.
Icy (https://icy.bioimageanalysis.org/) [14]: Icy, created in 2011 by the BioImage Analysis Lab at Institut Pasteur, is an extensible, plugin-based platform for image analysis, offering flexibility for a wide range of biological imaging applications, including single-cell analysis. Its strength lies in the integration of a GUI with programming environments (e.g., scripting via Java or Python), making it accessible to both novice users and developers. The platform provides a visual programming framework, allowing users to design workflows using a drag-and-drop interface, making it easier for non-programmers to build complex analyses. Icy is highly modular, with dedicated plugins for cell segmentation, tracking, and fluorescence quantification. Furthermore, Icy can be connected to MATLAB and provides a native ImageJ integration. Its learning curve can be steep for advanced use, and its community and plugin support are smaller compared to more established platforms like ImageJ.
ImageJ/Fiji (https://imagej.net/) [15,16]: The first version of ImageJ was released in 1997 by the National Institutes of Health (NIH, Bethesda, MD, USA), and since then, it has become one of the most widely used programs in the biological field. A wide range of modules (including plugins and macros) are available, with certain distributions bundling them into single packages. Fiji is the most widely used of these distributions, offering hundreds of plugins. ImageJ allows users to view, annotate, markup, modify, and analyse different types of biomedical images under Linux, macOS, and Windows operating systems. Today, it is one of the most widely adopted image analysis platform due to its flexibility and extensive plugin ecosystem.
QuPath (https://qupath.github.io/) [17]: QuPath, developed by Queen’s University Belfast, runs on Linux, macOS, and Windows with GUI supported by JavaFX. It is created and specifically designed for pathology-driven projects. It has strong support for single-cell quantification and is optimised for large WSI data. QuPath’s ability to integrate deep learning models for cell detection and phenotyping gives it a significant advantage over other tools. Its intuitive user interface and support for scripting (in Groovy or JavaScript) make it both user-friendly and powerful for custom workflows. QuPath allows file exchange with ImageJ and MATLAB. QuPath uses Open Microscopy Environment Remote Objects (OMERO) as data storage technology [23].
2.2. Freely Available Tools
Aperio ImageScope (by Leica, https://www.leicabiosystems.com/): Aperio ImageScope is a Windows-based software application designed for the visualisation, management, and analysis of digital pathology images, particularly WSIs. This tool provides a robust platform for pathologists to interact with high-resolution tissue samples. It offers advanced image rendering capabilities, allowing navigation through large datasets, and annotation tools that facilitate documentation and the communication of diagnostic findings. It supports multiple image formats and integrates with other Leica Biosystems products. Recognized for its speed, it is one of the fastest applications available for viewing and annotating WSI files.
NIS-Elements Viewer (by Nikon, https://www.microscope.healthcare.nikon.com/): NIS-Elements is a comprehensive commercial imaging software platform that facilitates microscope control, image capture, documentation, image analysis, and data management. The platform includes a free viewer (i.e., NIS-Elements Viewer), which supports the display of single images and datasets, offering multiple viewing options such as three-dimensional (3D) Volume View. It is optimised for multi-dimensional and time-lapse imaging for dynamic studies where the spatial and temporal analysis of samples is required. NIS-Elements also supports macro programming using a C-like language.
Sedeen (by Pathcore, https://pathcore.com/sedeen): Sedeen is a freely available pathology image viewer developed with support from the Ontario Cancer Research Institute. Designed as a universal platform for the academic community, it facilitates the sharing of digital pathology visualisation and analysis tools with pathologists and imaging researchers. Building in C++ for high computational performance, Sedeen integrates smoothly with widely used image analysis libraries, including ITK [24], VTK [25], and OpenCV [26]. It provides researchers with built-in analysis tools and supports the development of custom algorithms for detecting cancerous tissues. The viewer features a simple user interface and exports files in extensible markup language (XML) format.
SlideViewer (by 3DHISTECH, https://www.3dhistech.com/): SlideViewer (formerly known as CaseViewer) is an advanced digital pathology software application for visualising, analysing, and managing WSIs with a user-friendly interface tailored for high-resolution tissue sample exploration. The software offers quantitative image analysis features, facilitating automated assessments of histological parameters. Designed to integrate with other platforms, SlideViewer enables workflow management and data sharing, while its compatibility with the 3DHISTECH eSlide Manager further supports collaborative case sharing and remote consultations among pathologists and researchers.
2.3. Commercial Tools
Amira (by Thermo Fisher Scientific, https://www.thermofisher.com/): Amira is an advanced software platform tailored specifically for life science and biomedical research, enabling researchers to work with data from various imaging modalities. It offers advanced data visualisation, image processing, image segmentation, and quantitative analysis tools. Its GUI simplifies complex image-processing tasks by allowing users to visually construct analysis pipelines. This drag-and-drop functionality enhances accessibility for users with limited programming experience while maintaining powerful customisation options for advanced users. The platform supports scripting languages, including Python and MATLAB.
Arivis (by ZEISS, https://www.arivis.com/): Arivis is a modular software for scientific image analysis distributed by ZEISS. It enables work with 2D, 3D, and four-dimensional (4D) multichannel images of virtually unlimited size, as datasets are loaded into RAM dynamically based on the data the user views. The software can leverage high-performance computing environments, enabling the parallel processing of image data across multiple computing nodes. Arivis offers a highly scalable infrastructure, not dependent on local system resources, enabling it to process and quantify any type of multidimensional image data. Complex analysis can be performed and capabilities for image processing and automatic segmentation using machine learning models and deep learning-based tools can be leveraged. There is also the Arivis Cloud platform (formerly known as Apeer), a web-based infrastructure that allows you to leverage image analysis tools via AI using the ZEISS Arivis AI toolkit.
HALO (by Indica Labs, https://indicalab.com/halo/): HALO provides an intuitive and user-friendly interface, even for novice users, enabling analysis without the need to develop algorithms from scratch or configure complex workflows. The application’s modular architecture is tailored to meet diverse sample analysis needs, ensuring flexibility, scalability, and high performance. Users can leverage pre-trained deep learning networks for automatic cell segmentation in both brightfield and fluorescence images or train their models through the HALO AI module, for example, by using transfer learning methods. HALO streamlines the analysis process with a comprehensive set of annotation tools, including freehand drawing and AI-powered functionalities.
Imaris (by Oxford Instruments, https://imaris.oxinst.com/): Imaris by Oxford Instruments offers a sophisticated platform for the visualisation, segmentation, and quantitative analysis of complex 2D, 3D, and 4D fluorescent images. It is designed for the interactive visualisation, analysis, and interpretation of complex microscopic data. Imaris is specifically tailored for managing large, multidimensional datasets derived from widefield fluorescence microscopy, confocal imaging, and other high-resolution techniques such as light-sheet fluorescence microscopy (LSFM [27]). Imaris facilitates time-lapse analysis, allowing researchers to study cellular behaviours and morphological changes over time. Additionally, it offers specialised packages designed to meet the needs of various life sciences disciplines. For example, the Imaris for Cell Biologists package includes tools for cell segmentation and analysis, supports two-way interfacing with programming languages like MATLAB, Java, and Python, and supports the integration of external software. Nevertheless, Imaris is not designed to work with brightfield microscopy images.
3. Qualitative Comparison
Table 1, Table 2 and Table 3 present a comparative overview of the different tools considered in this work, highlighting key features such as single-cell classification capabilities, ROI flexibility, and file format compatibility. Precisely, Table 1 reports the main characteristics of the six open-source tools considered; Table 2, the four freely available ones; and Table 3, the four commercial tools. It is worth noting that all selected tools were tested for their compatibility with large histological file formats, including SVS, DICOM, and TIFF, which are commonly used in high-resolution whole-slide imaging. The evaluation specifically focused on each tool’s ability to open, visualise, and interact with these formats for the single-cell analysis of stained cells, which are frequently encountered in both clinical and research settings.

Table 1.
Open-source tools for single-cell analysis of histological images (X = yes, O = no).
Table 2.
Freely available tools for single-cell analysis of histological images (X = yes, O = no).
Table 3.
Commercial tools for single-cell analysis of histological images (X = yes, O = no).
4. Quantitative Comparison
In order to evaluate the performance of the different tools, (a) the total number of cells and (b) the number of cells positive to some specific markers within a specific irregular freehand-defined ROI of a representative brightfield image (Figure 4a) were counted using the different tools.
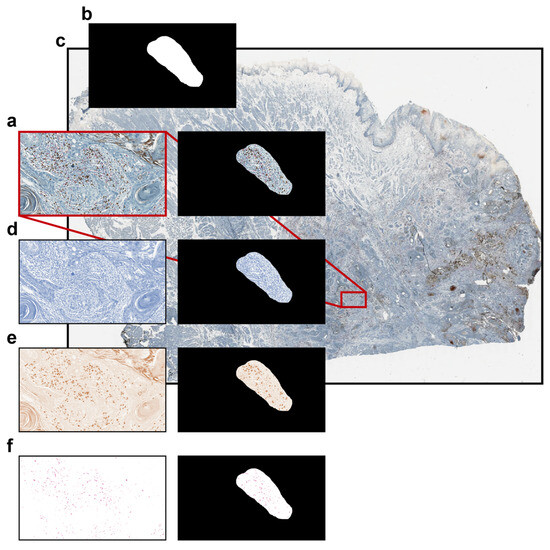
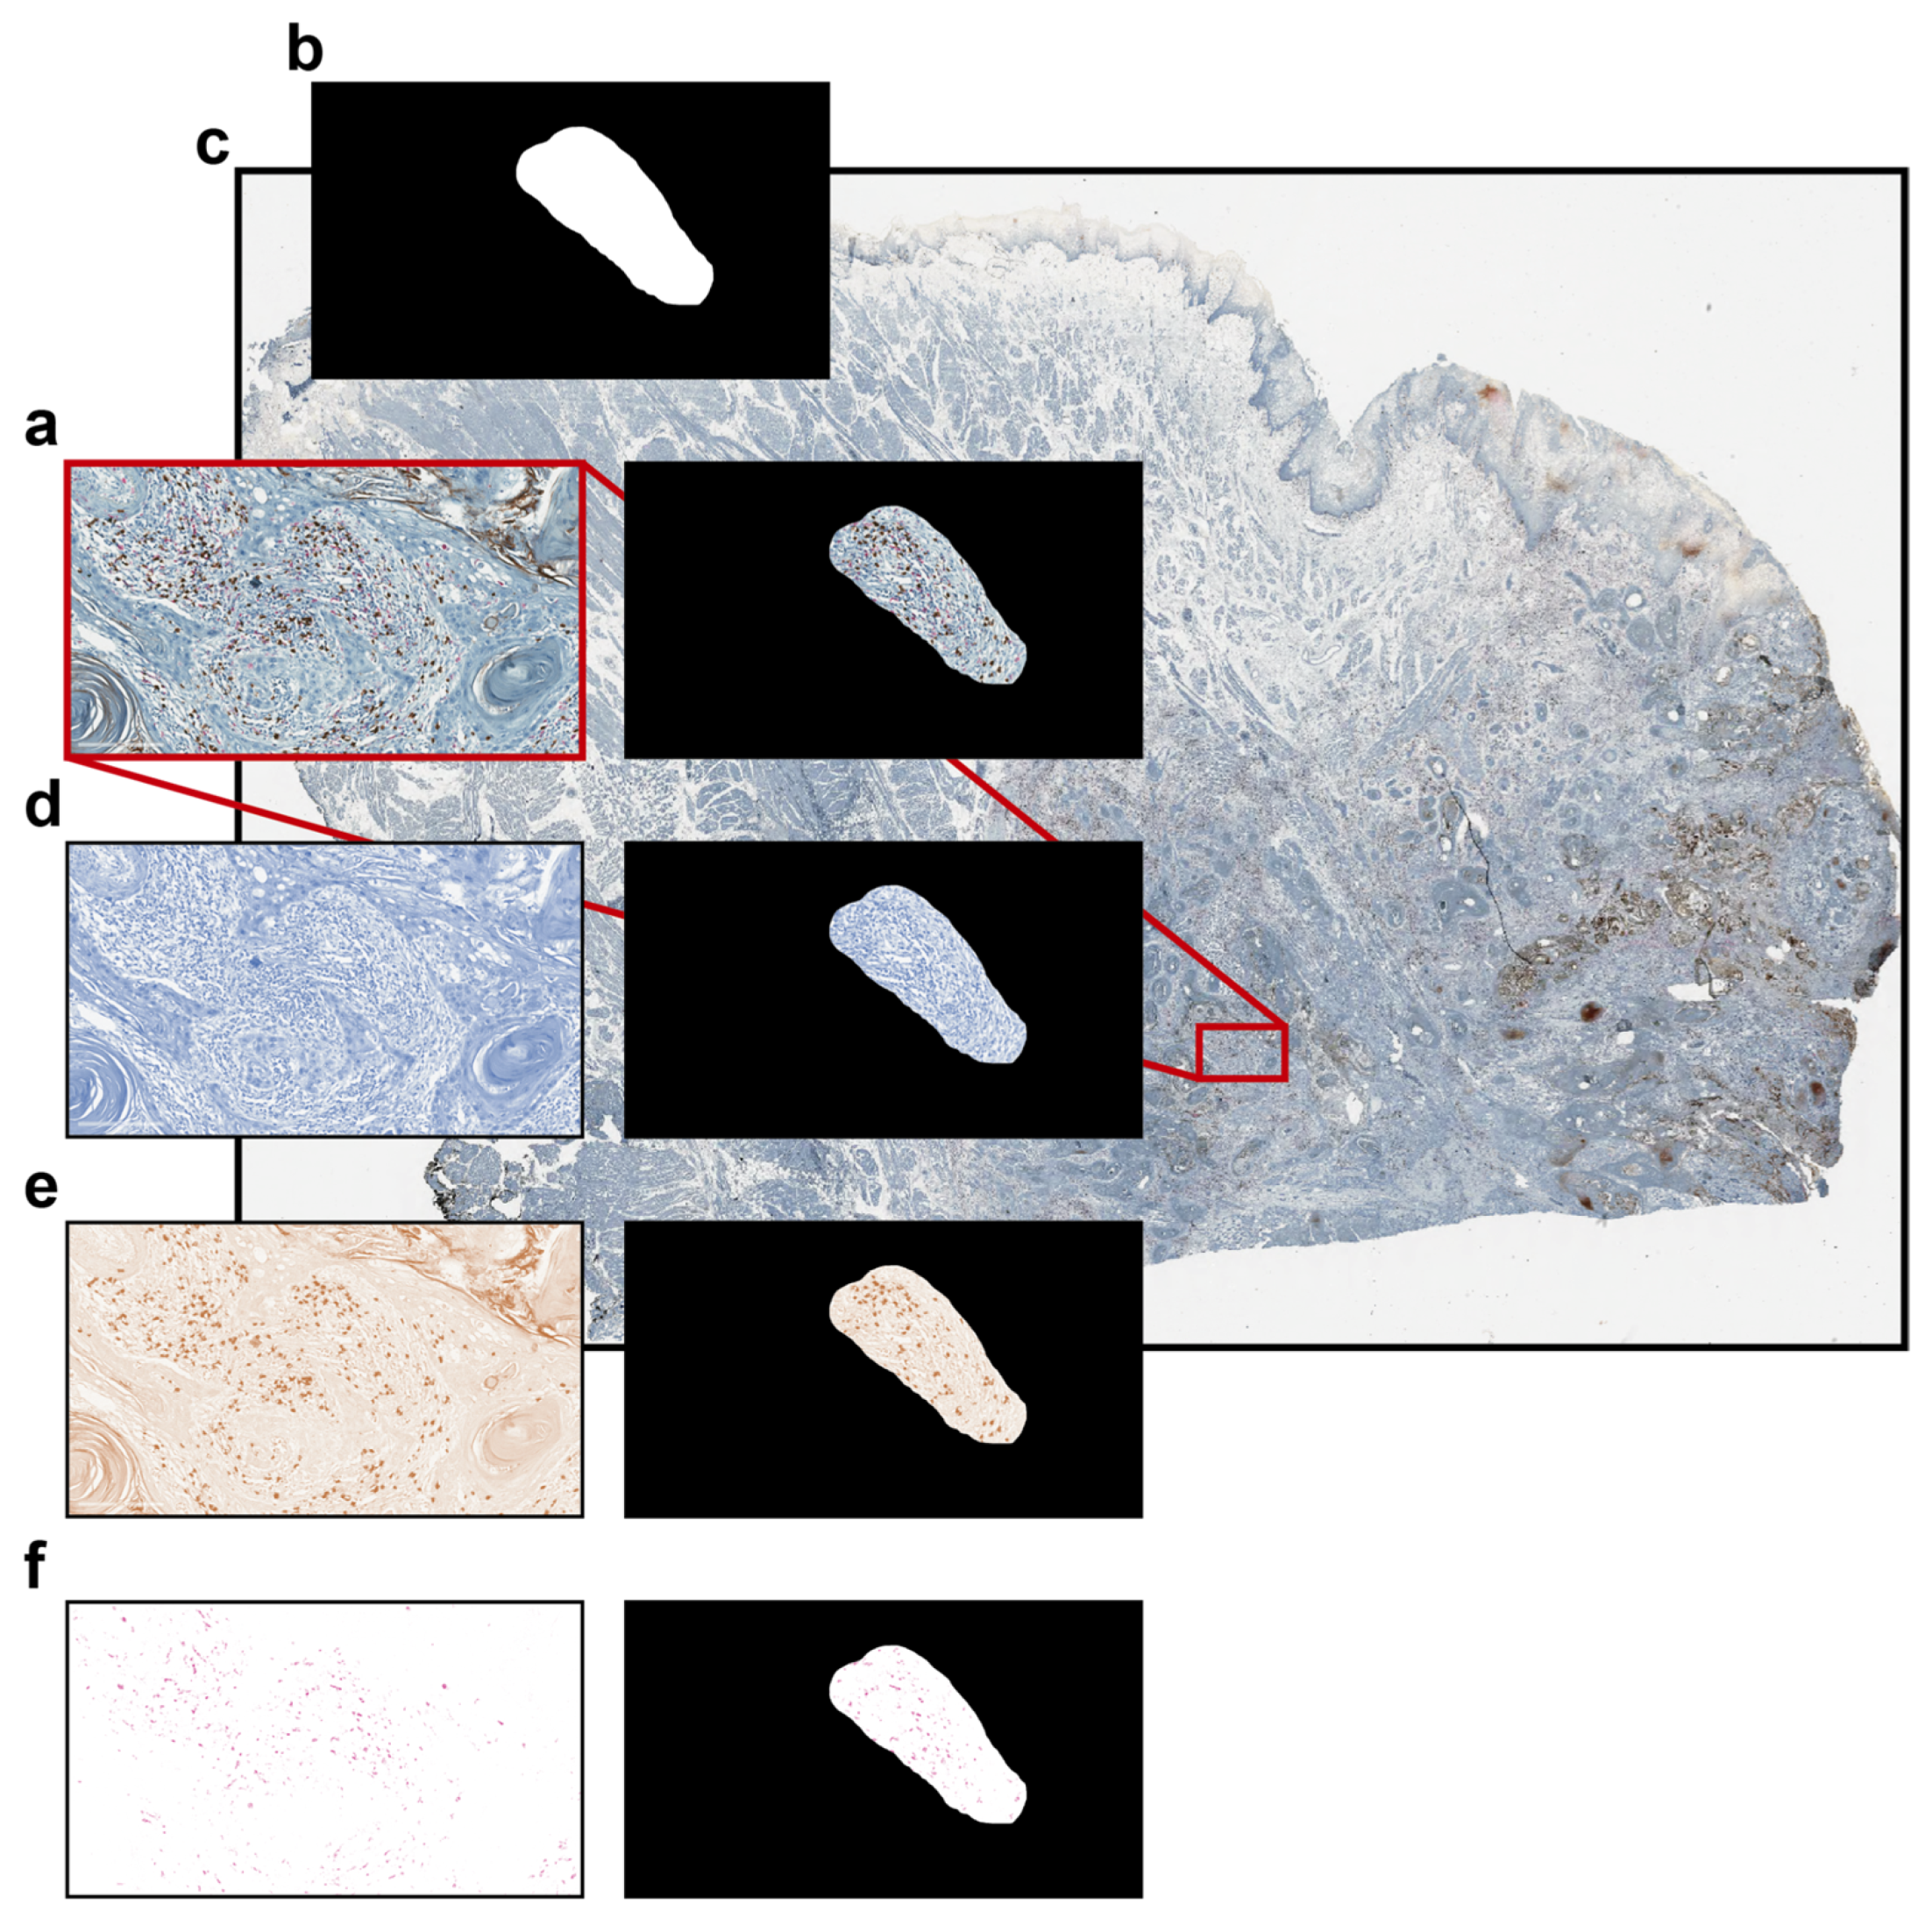
Figure 4.
Brightfield dataset used for comparing the different single-cell analysis tools. (a) Representative brightfield RGB image; (b) binary mask representing an irregular freehand-defined ROI; (c) original high-resolution WSI file with the position of the extracted image highlighted in red; (d) haematoxylin-channel image; (e) DAB-channel image; and (f) AP-red-channel image.
The freehand-defined ROI (Figure 4b) was defined on an extracted 2346 × 1352 full-resolution rectangular image within a large high-resolution WSI of an anonymised IHC-stained tissue section of a head and neck squamous cell carcinoma (HNSCC) tumour biopsy, precisely, a tongue cancer, used as a sample dataset (Figure 4c). The image was acquired using a brightfield Aperio CS2 microscope (Leica Biosystems), equipped with a 40× objective. The section was stained using three different markers: nuclei are stained with haematoxylin (visible in blue), CD8-positive lymphocytes with DAB (3,3′-Diaminobenzidine, visible in brown), and CD163-positive macrophages with AP-red (Alkaline Phosphatase Red, visible in red). Haematoxylin (Figure 4d), DAB (Figure 4e), and AP-red (Figure 4f) channels were extracted and saved as different image files using the Colour Deconvolution tool, an ImageJ/Fiji plugin for stain unmixing in RGB histological images [28].
The representative rectangular image extracted from the WSI file, the binary mask representing the irregular freehand-defined ROI, the haematoxylin image, the DAB image, and the AP-red image are freely available as Supplementary File S1.
The ground truth was established by an expert life scientist who manually counted the total number of cells (i.e., 823), as well as the number of cells positive for DAB (i.e., 135) and AP-red (i.e., 98) within the irregular freehand-defined ROI. Each tool was then tested by the same operator, an expert computer scientist, using the same previously freehand-defined ROI saved and loaded into the different tools. It is worth noting that the computer scientist testing the tools was trained by the life scientist responsible for creating the ground truth, learning to recognise cellular structures and identify various staining signals on ROIs similar to, but different from, the one used in the experiments.
All the tools unable to load the previously defined irregular freehand-defined ROI or unable to detect cells stained with DAB and/or AP-red were discarded, remaining just: (1) Amira, (2) Arivis, (3) HALO, (4) ImageJ/Fiji, (5) NIS-Elements (in this case we did not use NIS-Elements Viewer but its commercial version NIS-Elements with several segmentation and classification functionalities), (6) QuPath. The tested tools were installed on a workstation with the following configuration: an Intel Core i7 processor, 32 gigabyte (GB) random access memory (RAM), and NVIDIA GTX 1080 graphics card. Software packages were obtained from official sources, with open-source and freely-available tools downloaded from their respective websites on May 2024, while commercial tools were tested using trial time-limited licenses provided by vendors. Setups were completed by following the user manuals or installation guides, ensuring that all necessary dependencies and configurations were met for each software.
5. Results and Discussion
Among the 14 tools initially reviewed, only six met the requirements for the experiments: They supported loading the predefined irregular freehand-selected ROI and analysing both nuclear (i.e., haematoxylin) and cellular (i.e., DAB and AP-red) signals. Precisely, the tools considered in the experiments were (hereafter reported in alphabetical order) (1) Amira (commercial), (2) Arivis (commercial), (3) HALO (commercial), (4) ImageJ/Fiji (open source), (5) NIS-Elements (commercial version of the freely available NIS-Elements Viewer, including options for importing image ROIs and performing automatic single-cell segmentation/classification), and (6) QuPath (open source). What follows summarises the parameters applied and strategy used for testing the following single-cell analysis software tools (hereafter reported in alphabetical order):
(1) Amira: Amira is a commercial tool, and the testing was conducted using a license provided by the selling company for a limited evaluation period. Accordingly, the reported values can be considered a lower bound, with potential for improvements. For the segmentation, we analysed the haematoxylin, DAB, and AP-red images separately. A basic global thresholding step was followed by the application of the standard Watershed algorithm to segment and split objects, as well as to remove small debris. The key internal parameters applied during the process were as follows: threshold range, 0–120 grey levels; Watershed option, DARK; global segmentation range, 1.00–6.75; segmentation level, 0.6; and minimum object area, 30 pixels.
(2) Arivis: Arivis is a commercial tool, and the testing was conducted in collaboration with specialists from ZEISS, the selling company, through an online meeting aimed at ensuring proper usage of the software. This collaborative effort allowed us to apply the tool to brightfield images as effectively as possible while acknowledging that the tool was primarily developed for fluorescent images. However, the limited time of interaction with the specialists made the reported values just a lower bound with a high potential for improvements. For instance, pre-training specific networks could obviously provide better accuracy. For the segmentation, we separately considered the haematoxylin, DAB, and AP-red images. Built-in machine learning algorithms originally validated for fluorescent images and not optimised for brightfield applications were used. Following segmentation, the internal Blob Finder algorithm was used to count both nuclei and cells with positive signals. The preliminary results were further refined by applying area and circularity filters to reduce false positives and debris.
(3) HALO: HALO is a commercial tool, and the testing was conducted in collaboration with specialists from Indica Labs, the selling company, through an online meeting to ensure proper usage and application of the software. This collaborative effort enabled us to apply the tool to brightfield images as effectively as possible while acknowledging that the tool was primarily developed for fluorescent image analysis. However, the limited time of interaction with the specialists made the reported values just a lower bound with a high potential for improvements. For segmentation, we analysed the haematoxylin, DAB, and AP-red images separately. An available pre-trained neural network, optimised for images similar to the haematoxylin stain, was used for nuclei segmentation, yielding extremely highly accurate results. However, no available neural networks had been trained on images resembling the DAB and AP-red stains, resulting in very poor accuracy when identifying cells positive for these markers. Obviously, specific pre-trained networks could provide better accuracy.
(4) ImageJ/Fiji: ImageJ/Fiji is an open-source tool providing several image processing options and plugins. For the segmentation, we separately considered the haematoxylin, DAB, and AP-red images. Each image has been converted into a binary mask applying a basic global thresholding step, followed by the application of the standard Watershed algorithm to segment and split objects, as well as to remove small debris. Finally, the Particle Analysis plugin was used for counting the objects. The key internal parameters applied during the process were as follows: threshold range, 0–175 grey levels; circularity, 0.00–1.00; minimum object area, 60 pixels; and removal of the objects touching borders, Yes.
(5) NIS-Elements: NIS-Elements is a commercial tool, and the testing was conducted using a license acquired by the selling company. NIS-Elements provides several image processing options. For the segmentation, we separately considered the haematoxylin, DAB, and AP-red images. Each image has been converted into a binary mask by applying a basic global thresholding step, followed by the application of internal built-in filters for smoothing the images, separating objects, and removing small debris. The key internal parameters applied during the process were as follows: threshold range, 0–225 grey levels; smooth, 2x; separate, 2x; clean, 2x; all filling, No.
(6) QuPath: QuPath is an open-source tool providing several image processing options and macros. It also provides automatic neural networks and options for different microscopy image classes, including specific opportunities for histological brightfield images. For the segmentation, we just considered the original rectangular RGB image. In particular, it was processed using an automatic segmentation option available for brightfield images, providing as output both the single-nucleus and the single-cell segmentations. Those segmentations have been then analysed using a supervised classification neural network available for counting the number of nuclei and the number of DAB- and AP-red-positive cells within the irregular freehand-defined ROI. The key internal parameters applied during the process were as follows: pixel size, 0.5 µm; nuclear background radius, 8 µm; median filter radius, 0 µm; sigma, 1.5 µm; minimum nuclear area, 8 µm2; maximum nuclear area, 400 µm2; threshold value, 0.1; maximum background intensity, 2.0; and cellular expansion, 5 µm.
The other eight tools were excluded for specific reasons. Aperio ImageScope (freely available), Sedeen (freely available), and SlideViewer (freely available) lacked semi- and fully-automatic classification functionalities. CellProfiler (open source), Cytomine (open source), Digital Slide Archive (open source), and Icy (open source) failed to import the irregular freehand-defined ROI or required advanced preprocessing of the input image, unsuitable for a fair comparison of the different tools. Imaris (commercial), full of opportunities for fluorescent imaging, lacks segmentation methods for brightfield images.
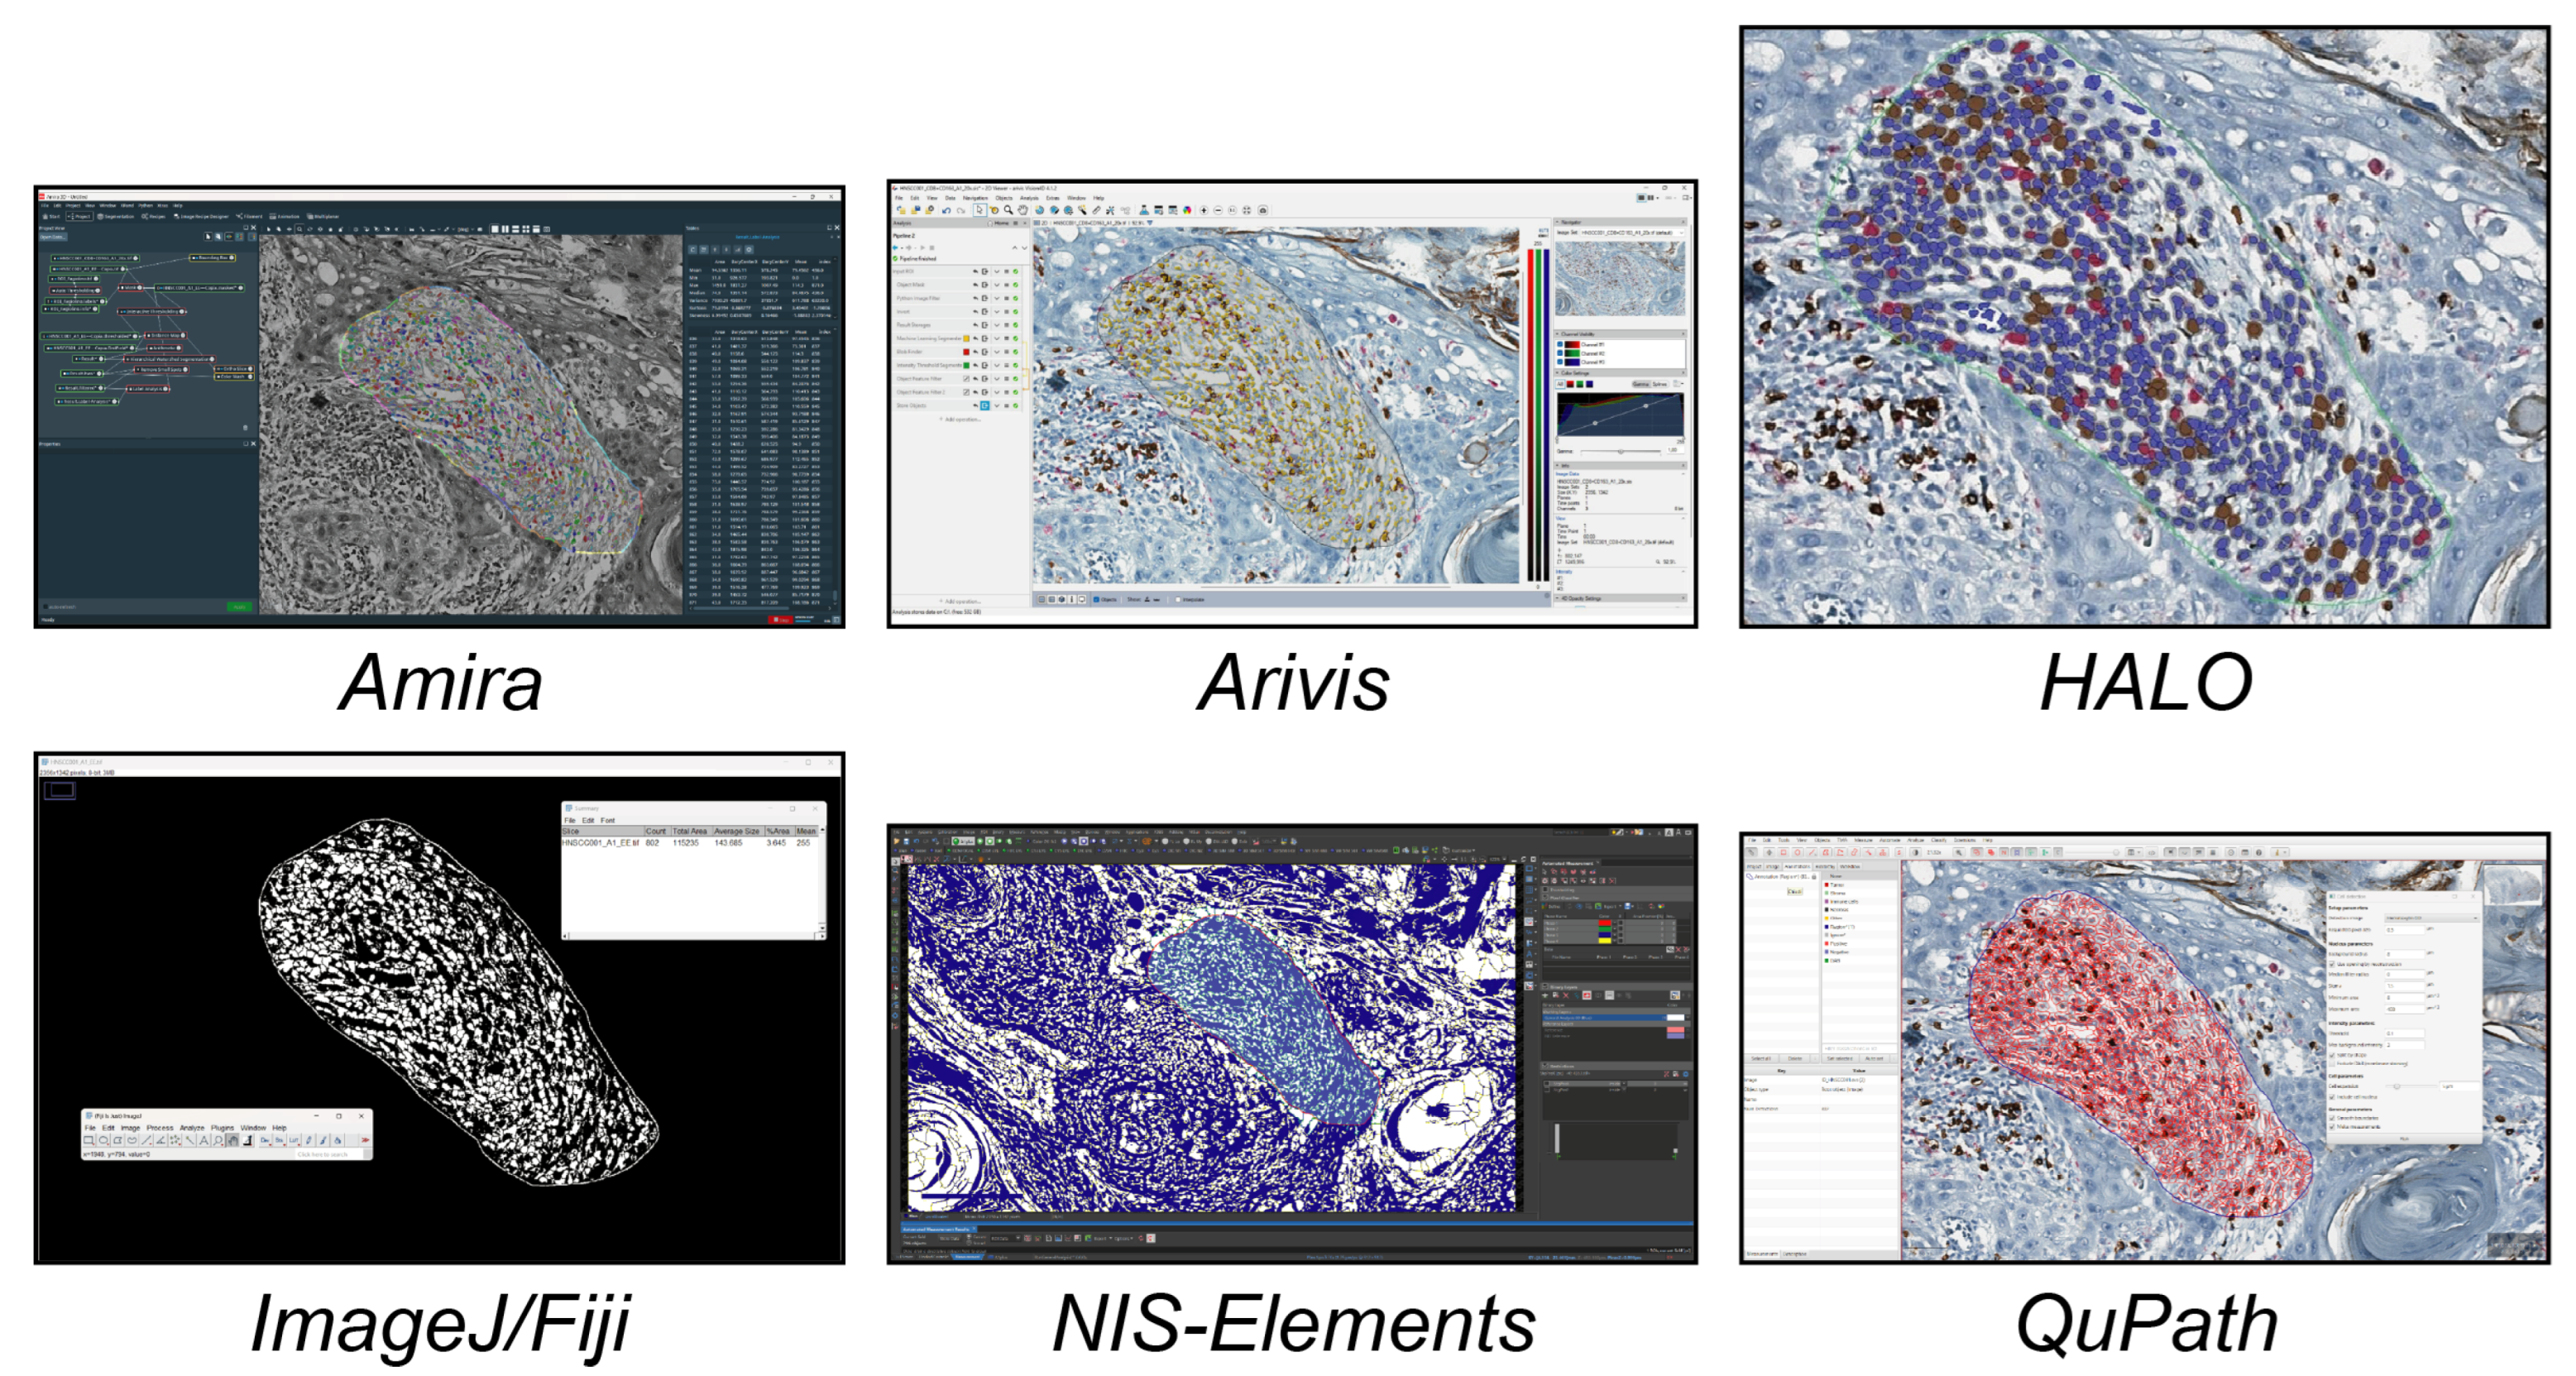
Figure 5 shows the segmentations obtained using the different tools in a real case study.
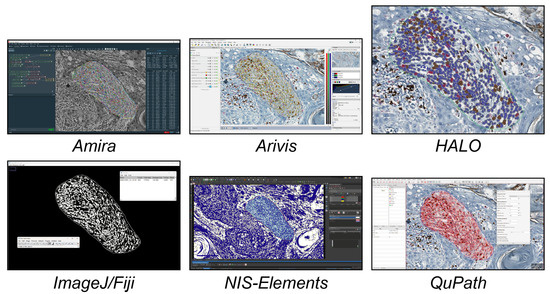
Figure 5.
Overview of the segmentations obtained using the different tools. From top to bottom and left to right: Amira, Arivis, HALO, ImageJ/Fiji, NIS-Elements, and QuPath.
Table 4, Table 5, Table 6 and Table 7 report the counts, the absolute normalized difference percentage (PAND), and the rank position obtained by the different tools when analysing the signals in the preselected irregular freehand-defined ROI. The PAND between value (Vi) recorded by the tool (i) and ground truth (G), was computed to measure the closeness of agreement of the different counts according to Equation (1) [29]:
PAND = 100×|Vi − G|/G
Table 4.
Haematoxylin analysis.
Table 5.
DAB analysis.
Table 6.
AP-red analysis.
Table 7.
Mean PAND and final rank.
Table 4 reports the number of nuclei counted considering the haematoxylin signal, Table 5 reports the number of DAB positive cells, Table 6 reports the number of AP-red positive cells, and Table 7 reports the mean PAND and the final rank obtained by averaging together the single PANDs computed for the three different signals (i.e., haematoxylin, DAB, and AP-red).
The results reported in Table 4 demonstrate that for nuclei counting using the haematoxylin signal, most tools performed exceptionally well, with a PAND below 10%, except for Arivis, which showed a higher error rate. Notably, QuPath and HALO achieved the highest accuracy, with PAND values close to 1%. This strong performance is due to segmentation algorithms specifically optimised for nuclei detection in haematoxylin-stained images, a common benchmark for many tools. In general, the relatively low variability across tools reflects the maturity of algorithms for this task, as haematoxylin staining provides strong contrast and clear boundaries for nuclei segmentation. In contrast, the results in Table 5 and Table 6 highlight the greater challenge of accurately detecting specific cellular markers, such as DAB and AP-red. For these markers, PAND values were generally higher, often exceeding 10%, indicating a notable decrease in accuracy compared to nuclei counting. Among the evaluated tools, QuPath consistently stood out, achieving robust detection capabilities with PAND values around 5% for both markers. This suggests that QuPath’s segmentation and classification algorithms are better adapted to handling the variability and complexity of brightfield image data, which is less uniform and more prone to staining inconsistencies than fluorescence-based imaging. Lastly, the summary in Table 7 underscores the limitations of certain tools, particularly Arivis and HALO, which exhibited average PAND values exceeding 20%. This underperformance is attributed to the segmentation and classification models implemented in these tools, which are pre-trained and optimised for fluorescence imaging applications. These models struggle to generalise effectively to brightfield images, which involve different optical characteristics, such as variations in illumination and colourimetric dependencies. This highlights a broader challenge in adapting tools initially designed for one imaging modality to another, emphasising the importance of algorithm flexibility and data-driven optimization. In addition, it is important to remember that evaluating the commercial tools was challenging due to the restricted functionality of the testing license. For instance, it was not possible to pre-train specific neural networks for the analysed signals as it was possible to do in QuPath. As such, the reported performance values represent a baseline, with potential for improvements.
6. Conclusions and Perspectives
In this work, we reviewed and compared the software currently available for performing single-cell analysis of histological brightfield images. Specifically, we focused on tools capable of analysing stained cells within irregular freehand-defined ROIs. In total, we considered 14 tools (six open-source, four freely available, and four commercial ones) and we practically compared six of them by performing a case study using a representative brightfield dataset.
The results of this comparative analysis revealed that even the open-source tools are today characterised by comprehensive feature sets, which rival those of commercial software solutions. In particular, QuPath demonstrated flexibility in handling large file formats, along with robust options for ROI definition and single-cell classification. In contrast, the commercial solutions offered more advanced automation features but lacked the versatility and cost-effectiveness of some open-source tools. This comparison highlights the trade-offs between accessibility and functionality, with QuPath emerging as a balanced option for single-cell analysis within histological brightfield images.
To promote future benchmarking, the image dataset and the freehand-defined ROI used in the comparison have been shared as Supplementary Materials to be used by the research community to conduct future comparative analyses of new tools for single-cell analysis in histological brightfield images. It is worth remarking that fluorescent images were out of our interest and the analysis has been limited to cell counting within a single brightfield ROI. The accuracy of the segmentation masks for detected cells was not evaluated, nor was the reproducibility of multiple determinations assessed. Consequently, this evaluation does not provide insights into the precision or reliability of the cell segmentation process. Future work will involve a more detailed analysis of the segmentation masks, including an assessment of false positives and false negatives. Additionally, several tools were excluded (e.g., Imaris) or delivered suboptimal results (e.g., Arivis) due to their lack of segmentation methods trained for brightfield images, despite their strong performance with fluorescent ones. In future, the experiments may be extended to WSI acquired with motorised fluorescent confocal microscopes to provide a more comprehensive assessment of the tools also in different specific cases. Eventually, the tests could also be extended to monitor how different tools handle various image types. For instance, we currently consider the most popular format, i.e., RGB, but multi-channel images with more than three channels are becoming increasingly common and could also be included [30]. Finally, the experiments in this study were conducted by an expert in computer science. However, future work could benefit from incorporating usability feedback from less experienced users, such as an early-career life scientist. Nevertheless, this work offers a deeper understanding of the strengths and limitations of various software platforms, facilitating more informed decision making for researchers seeking tools to analyse histological brightfield images and paving the way for further insights.
Supplementary Materials
The following supporting information can be downloaded at https://www.mdpi.com/article/10.3390/technologies13030110/s1. File S1: Brightfield dataset for comparing the different single-analysis tools. Representative image (HNSCC001_CD8_CD163_H.tif) extracted from a high-resolution WSI of an anonymised IHC-stained tissue section of a head and neck squamous cell carcinoma (HNSCC) tumour biopsy, precisely, a tongue cancer. The image was acquired using a brightfield Aperio CS2 microscope (Leica Biosystems), equipped with a 40× objective. The section was stained using 3 different markers: nuclei are stained with haematoxylin (visible in blu), CD8-positive lymphocytes with DAB (3,3′-Diaminobenzidine, visible in brown), and CD163-positive macrophages with AP-red (Alkaline Phosphatase Red, visible in red). The three single-channel images (HNSCC001_H.tif, HNSCC001_CD8.tif, HNSCC001_CD163.tif) obtained using the Colour Deconvolution tool are here provided with the 2D binary mask (BinaryMask.tif) representing a user irregular freehand-defined ROI.
Author Contributions
Conceptualisation: F.P., M.T., and A.C.; Methodology: F.P., M.T., M.M.T., N.N., and A.C.; Software: F.P., G.C., and A.C.; Validation: F.P., M.T., M.M.T., and A.C.; Formal analysis: F.P., M.T., M.M.T., and A.C.; Investigation: F.P., M.T., M.M.T., and A.C.; Resources: F.P., N.N., G.C., and A.C.; Data curation: F.P., M.T., and M.M.T.; Writing—original draft preparation: F.P., M.T., and A.C.; Writing—review and editing: M.M.T., N.N., and G.C.; Visualisation: F.P., M.T., and M.M.T.; Supervision: N.N., G.C., and A.C.; Project administration: F.P. and A.C.; Funding acquisition: F.P., N.N., G.C., and A.C. All authors have read and agreed to the published version of the manuscript.
Funding
M.T. acknowledges support from the “Associazione Italiana per la Ricerca sul Cancro” (grant no. MFAG 2021—ID. 26339). N.N. acknowledges support from the Italian Ministry of Health and the contribution of “Ricerca Corrente” within the research line “Appropriateness, outcomes, drug value and organisational models for the continuity of diagnostic therapeutic pathways in oncology”. F.P. acknowledges support from the European Union—NextGenerationEU through the Italian Ministry of University and Research under PNRR—M4C2-I1.3 Project PE_00000019 “HEAL ITALIA” (CUP: J33C22002920006); G.C. under PNRR—INF-ACT Project PE13 “One Health Basic and Translational Actions Addressing Unmet Needs on Emerging Infectious Diseases” (CUP: J33C22002870005); A.C. under PNRR—PNC Project PNC0000002 “DARE—Digital Lifelong Prevention” (CUP: B53C22006240001). It is worth noting that the views and opinions expressed are those of the authors only and do not necessarily reflect those of the European Union or the European Commission. Neither the European Union nor the European Commission can be held responsible for them.
Institutional Review Board Statement
Not applicable.
Informed Consent Statement
Not applicable.
Data Availability Statement
The image and mask used in this study are available as Supplementary Materials.
Acknowledgments
The authors would like to thank Filippo Pilutti (DISI, University of Bologna, Italy) and Mariachiara Stellato (DIFA, University of Bologna) for their contributions to the tool testing process.
Conflicts of Interest
The authors declare that have no competing interests.
Abbreviations
| 2D | Two-dimensional |
| 3D | Three-dimensional |
| 4D | Four-dimensional |
| AI | Artificial intelligence |
| CDSA | Cancer digital slide archive |
| DICOM | Digital imaging and communications in medicine |
| DL | Deep learning |
| DSA | Digital slide archive |
| GB | Gigabyte |
| GUI | Graphical user interface |
| HNSCC | Head and neck squamous cell carcinoma |
| HTTP | Hypertext transfer protocol |
| IHC | Immunohistochemistry |
| IT | Information technology |
| LSFM | Light-sheet fluorescent microscopy |
| NIH | National Institutes of Health |
| OMERO | Open microscopy environment remote objects |
| PAND | Absolute normalised difference percentage |
| RAM | Random access memory |
| RGB | Red, green, blue |
| ROI | Regions of interest |
| SVS | Scanner vendor-specific format |
| TIFF | Tagged image file format |
| WSI | Whole slide imaging |
| XML | Extensible markup language |
References
- Hosseini, M.S.; Bejnordi, B.E.; Trinh, V.Q.-H.; Chan, L.; Hasan, D.; Li, X.; Yang, S.; Kim, T.; Zhang, H.; Wu, T.; et al. Computational pathology: A survey review and the way forward. J. Pathol. Inform. 2024, 15, 100357. [Google Scholar] [CrossRef] [PubMed]
- Wu, Y.; Cheng, M.; Huang, S.; Pei, Z.; Zuo, Y.; Liu, J.; Yang, K.; Zhu, Q.; Zhang, J.; Hong, H.; et al. Recent advances of deep learning for computational histopathology: Principles and applications. Cancers 2022, 14, 1199. [Google Scholar] [CrossRef]
- Parra, E.R.; Ilié, M.; Wistuba, I.I.; Hofman, P. Quantitative multiplexed imaging technologies for single-cell analysis to assess predictive markers for immunotherapy in thoracic immuno-oncology: Promises and challenges. Br. J. Cancer 2023, 129, 1417–1431. [Google Scholar] [CrossRef]
- Jain, E.; Patel, A.; Parwani, A.V.; Shafi, S.; Brar, Z.; Sharma, S.; Mohanty, S.K. Whole slide imaging technology and its applications: Current and emerging perspectives. Int. J. Surg. Pathol. 2024, 32, 433–448. [Google Scholar] [CrossRef]
- Pavone, A.M.; Giannone, A.G.; Cabibi, D.; D’aprile, S.; Denaro, S.; Salvaggio, G.; Parenti, R.; Yezzi, A.; Comelli, A. Digital Pathology: A Comprehensive Review of Open-Source Histological Segmentation Software. BioMedInformatics 2024, 4, 173–196. [Google Scholar] [CrossRef]
- Xun, D.; Wang, R.; Zhang, X.; Wang, Y. Microsnoop: A generalist tool for microscopy image representation. Innov. 2024, 5, 100541. [Google Scholar] [CrossRef]
- Vanea, C.; Džigurski, J.; Rukins, V.; Dodi, O.; Siigur, S.; Salumäe, L.; Meir, K.; Parks, W.T.; Hochner-Celnikier, D.; Fraser, A.; et al. Mapping cell-to-tissue graphs across human placenta histology whole slide images using deep learning with HAPPY. Nat. Commun. 2024, 15, 2710. [Google Scholar] [CrossRef]
- Guerrero, R.E.D.; Carvalho, L.; Bocklitz, T.; Popp, J.; Oliveira, J.L. Software tools and platforms in Digital Pathology: A review for clinicians and computer scientists. J. Pathol. Inform. 2022, 13, 100103. [Google Scholar] [CrossRef] [PubMed]
- Ali, M.; Benfante, V.; Basirinia, G.; Alongi, P.; Sperandeo, A.; Quattrocchi, A.; Giannone, A.G.; Cabibi, D.; Yezzi, A.; Di Raimondo, D.; et al. Applications of Artificial Intelligence, Deep Learning, and Machine Learning to Support the Analysis of Microscopic Images of Cells and Tissues. J. Imaging 2025, 11, 59. [Google Scholar] [CrossRef]
- Piccinini, F.; Balassa, T.; Szkalisity, A.; Molnar, C.; Paavolainen, L.; Kujala, K.; Buzas, K.; Sarazova, M.; Pietiainen, V.; Kutay, U.; et al. Advanced cell classifier: User-friendly machine-learning-based software for discovering phenotypes in high-content imaging data. Cell Syst. 2017, 4, 651–655.e5. [Google Scholar] [CrossRef]
- Stirling, D.R.; Swain-Bowden, M.J.; Lucas, A.M.; Carpenter, A.E.; Cimini, B.A.; Goodman, A. CellProfiler 4: Improvements in speed, utility and usability. BMC Bioinform. 2021, 22, 433. [Google Scholar] [CrossRef] [PubMed]
- Marée, R.; Rollus, L.; Stévens, B.; Hoyoux, R.; Louppe, G.; Vandaele, R.; Begon, J.-M.; Kainz, P.; Geurts, P.; Wehenkel, L. Collaborative analysis of multi-gigapixel imaging data using Cytomine. Bioinformatics 2016, 32, 1395–1401. [Google Scholar] [CrossRef] [PubMed]
- Gutman, D.A.; Khalilia, M.; Lee, S.; Nalisnik, M.; Mullen, Z.; Beezley, J.; Chittajallu, D.R.; Manthey, D.; Cooper, L.A. The digital slide archive: A software platform for management, integration, and analysis of histology for cancer research. Cancer Res. 2017, 77, e75–e78. [Google Scholar] [CrossRef] [PubMed]
- de Chaumont, F.; Dallongeville, S.; Chenouard, N.; Hervé, N.; Pop, S.; Provoost, T.; Meas-Yedid, V.; Pankajakshan, P.; Lecomte, T.; Le Montagner, Y.; et al. Icy: An open bioimage informatics platform for extended reproducible research. Nat. Methods 2012, 9, 690–696. [Google Scholar] [CrossRef]
- Schindelin, J.; Rueden, C.T.; Hiner, M.C.; Eliceiri, K.W. The ImageJ ecosystem: An open platform for biomedical image analysis. Mol. Reprod. Dev. 2015, 82, 518–529. [Google Scholar] [CrossRef]
- Schindelin, J.; Arganda-Carreras, I.; Frise, E.; Kaynig, V.; Longair, M.; Pietzsch, T.; Preibisch, S.; Rueden, C.; Saalfeld, S.; Schmid, B.; et al. Fiji: An open-source platform for biological-image analysis. Nat. Methods 2012, 9, 676–682. [Google Scholar] [CrossRef]
- Bankhead, P.; Loughrey, M.B.; Fernández, J.A.; Dombrowski, Y.; McArt, D.G.; Dunne, P.D.; McQuaid, S.; Gray, R.T.; Murray, L.J.; Coleman, H.G.; et al. QuPath: Open source software for digital pathology image analysis. Sci. Rep. 2017, 7, 16878. [Google Scholar] [CrossRef]
- Fassler, D.J.; Abousamra, S.; Gupta, R.; Chen, C.; Zhao, M.; Paredes, D.; Batool, S.A.; Knudsen, B.S.; Escobar-Hoyos, L.; Shroyer, K.R.; et al. Deep learning-based image analysis methods for brightfield-acquired multiplex immunohistochemistry images. Diagn. Pathol. 2020, 15, 100. [Google Scholar] [CrossRef]
- Morrison, L.E.; Lefever, M.R.; Behman, L.J.; Leibold, T.; Roberts, E.A.; Horchner, U.B.; Bauer, D.R. Brightfield multiplex immunohistochemistry with multispectral imaging. Laboratory Investigation. 2020, 100, 1124–1136. [Google Scholar] [CrossRef]
- Rehák, R.; Bodrogi, P.; Schanda, J. On the use of the sRGB colour space. Displays 1999, 20, 165–170. [Google Scholar] [CrossRef]
- Carpenter, A.E.; Jones, T.R.; Lamprecht, M.R.; Clarke, C.; Kang, I.H.; Friman, O.; Guertin, D.A.; Chang, J.H.; Lindquist, R.A.; Moffat, J.; et al. CellProfiler: Image analysis software for identifying and quantifying cell phenotypes. Genome Biol. 2016, 7, R100. [Google Scholar] [CrossRef] [PubMed]
- Goode, A.; Gilbert, B.; Harkes, J.; Jukic, D.; Satyanarayanan, M. OpenSlide: A vendor-neutral software foundation for digital pathology. J. Pathol. Inform. 2013, 4, 27. [Google Scholar] [CrossRef] [PubMed]
- Allan, C.; Burel, J.-M.; Moore, J.; Blackburn, C.; Linkert, M.; Loynton, S.; MacDonald, D.; Moore, W.J.; Neves, C.; Patterson, A.; et al. OMERO: Flexible, model-driven data management for experimental biology. Nat. Methods 2012, 9, 245–253. [Google Scholar] [CrossRef]
- Bitter, I.; Van Uitert, R.; Wolf, I.; Ibanez, L.; Kuhnigk, J.-M. Comparison of four freely available frameworks for image processing and visualization that use ITK. IEEE Trans. Vis. Comput. Graph. 2007, 13, 483–493. [Google Scholar] [CrossRef] [PubMed]
- Geveci, B.; Schroeder, W.; Brown, A.; Wilson, G.V. The architecture of open source applications. Researchgate 2012, 1, 387–402. [Google Scholar]
- Culjak, I.; Abram, D.; Pribanic, T.; Dzapo, H.; Cifrek, M. A brief introduction to OpenCV. In Proceedings of the 2012 Proceedings of the 35th International Convention MIPRO, Opatija, Croatia, 21–25 May 2012; IEEE: Piscataway, NJ, USA, 2012; pp. 1725–1730. [Google Scholar]
- Stelzer, E.H.; Strobl, F.; Chang, B.J.; Preusser, F.; Preibisch, S.; McDole, K.; Fiolka, R. Light sheet fluorescence microscopy. Nat. Rev. Methods Primers 2021, 1, 73. [Google Scholar] [CrossRef]
- Landini, G.; Martinelli, G.; Piccinini, F. Colour deconvolution: Stain unmixing in histological imaging. Bioinformatics 2020, 37, 1485–1487. [Google Scholar] [CrossRef]
- Piccinini, F.; Martinelli, G.; Carbonaro, A. Accuracy of mobile applications versus wearable devices in long-term step measurements. Sensors 2020, 20, 6293. [Google Scholar] [CrossRef]
- Piccinini, F.; Tazzari, M.; Tumedei, M.M.; Stellato, M.; Remondini, D.; Giampieri, E.; Martinelli, G.; Castellani, G.; Carbonaro, A. Data Science for Health Image Alignment: A User-Friendly Open-Source ImageJ/Fiji Plugin for Aligning Multimodality/Immunohistochemistry/Immunofluorescence 2D Microscopy Images. Sensors 2024, 24, 451. [Google Scholar] [CrossRef]
Disclaimer/Publisher’s Note: The statements, opinions and data contained in all publications are solely those of the individual author(s) and contributor(s) and not of MDPI and/or the editor(s). MDPI and/or the editor(s) disclaim responsibility for any injury to people or property resulting from any ideas, methods, instructions or products referred to in the content. |
© 2025 by the authors. Licensee MDPI, Basel, Switzerland. This article is an open access article distributed under the terms and conditions of the Creative Commons Attribution (CC BY) license (https://creativecommons.org/licenses/by/4.0/).