Abstract
The use of CH4 as an energy source is increasing every day. To increase the efficiency of CH4 combustion and ensure that the equipment meets ecological requirements, it is necessary to measure the CH4 concentration in the exhaust gases of combustion systems. To this end, sensors are required that can withstand extreme operating conditions, including temperatures of at least 600 °C, as well as high pressure and gas flow rate. ZnGa2O4, being an ultra-wide bandgap semiconductor with high chemical and thermal stability, is a promising material for such sensors. The synthesis and investigation of the structural and CH4 sensing properties of ceramic pellets made from pure and Er-doped ZnGa2O4 were conducted. Doping with Er leads to the formation of a secondary Er3Ga5O12 phase and an increase in the active surface area. This structural change significantly enhanced the CH4 response, demonstrating an 11.1-fold improvement at a concentration of 104 ppm. At the optimal response temperature of 650 °C, the Er-doped ZnGa2O4 exhibited responses of 2.91 a.u. and 20.74 a.u. to 100 ppm and 104 ppm of CH4, respectively. The Er-doped material is notable for its broad dynamic range for CH4 concentrations (from 100 to 20,000 ppm), low sensitivity to humidity variations within the 30–70% relative humidity range, and robust stability under cyclic gas exposure. In addition to CH4, the sensitivity of Er-doped ZnGa2O4 to other gases at a temperature of 650 °C was investigated. The samples showed strong responses to C2H4, C3H8, C4H10, NO2, and H2, which, at gas concentrations of 100 ppm, were higher than the response to CH4 by a factor of 2.41, 2.75, 3.09, 1.16, and 1.64, respectively. The study proposes a plausible mechanism explaining the sensing effect of Er-doped ZnGa2O4 and discusses its potential for developing high-temperature CH4 sensors for applications such as combustion monitoring systems and determining the ideal fuel/air mixture.
1. Introduction
CH4 is a colorless and odorless gas. It is a major component of natural gas and a potent greenhouse gas [1,2]. Given the widespread use of CH4 in industry and households as an energy source, there is a need to increase the efficiency of CH4 combustion and ensure that the equipment meets ecological requirements, it is necessary to measure the CH4 concentration in the exhaust gases of combustion systems. To this end, sensors are required that can withstand extreme operating conditions, including temperatures of at least 600 °C, as well as high pressure and gas flow rates. Most sensor electronics materials, metal oxides, and chalcogenides cannot function reliably at temperatures above 600 °C [3,4,5]. Previously, high-temperature CH4 sensors based on thin Ga2O3 [6,7] and thick LaFe0.95W0.05O3 films [8] were investigated. However, these sensors were not highly sensitive and/or were produced using film deposition methods that are not highly reproducible. There is a need to develop new materials for high-temperature CH4 sensors that can be produced using relatively inexpensive methods.
Zinc gallate (ZnGa2O4), being an ultra-wide bandgap semiconductor with high chemical and thermal stability, is a promising material for high-temperature sensors. It possesses a spinel-type crystal structure [9,10]. The band gap width, Eg, of ZnGa2O4 depends significantly on the synthesis conditions, a presence of impurities and subsequent treatments, and is reported within a relative range of 4.1–5.2 eV [9,10,11,12,13,14]. To date, ZnGa2O4 has been shown to be of interest in several areas of electronics and photonics as a material for transparent-conducting electrodes [15], luminophores films [16,17], solar-blind UV detectors with high speed-performance [18,19], power electronics devices [20,21], and gas sensors [11,22]. The last application field is practically not well-developed due to the absence of cost-effective and high deposition rates methods for ZnGa2O4 synthesis as well as for fabrication of structures on its basis with large active surface. It is particularly difficult to obtain ZnGa2O4 compounds with the appropriate spinel crystal lattice. The literature analysis summarized in Table 1 shows that, despite these obstacles, sensors based on ZnGa2O4 capable of functioning in a wide temperature range and demonstrating high responses to nitrogen oxides and volatile hydrocarbon vapors in the operating temperature range of T = 300–450 °C have been developed. The very limited number of literature sources does not yet allow us to draw some general conclusions about the advantages and disadvantages of ZnGa2O4 as a sensitive material for gas sensors in comparison with the well-developed binary metal-oxide semiconductors (MOSs) SnO2, ZnO, TiO2, WO3, Ga2O3 [23,24,25,26,27,28,29,30,31,32,33,34,35], or transition metal dichalcogenides (TMDs) [5,36].

Table 1.
Comparison of gas-sensitive characteristics of ZnGa2O4-based structures.
The characteristics of ZnGa2O4-based gas sensors, including gas response and speed-performance, can be controlled by forming arrays of nanoscale structures, changing the topology of contacts to the semiconductor layer, forming heterostructures, and depositing metal-catalyst nanoclusters on the semiconductor surface [11,12,22,37,38,39,40,41].
A Taguchi-type sensor based on ZnGa2O4, obtained by solid state reaction assisted by high-energy ball-milling of a mixture of GaOOH and ZnO powders at room temperature (RT) for 7 h and with a periodic addition of ethanol as a lubricant, was presented in Ref. [12]. A paste was formed from the obtained powder and deposited in a thin layer on a ceramic tube, inside of which a heater was formed. The signal from the sensing layer was picked up by means of gold electrodes formed to the semiconductor. The Taguchi-type sensors with a sensitive SnO2 layer have been manufactured since the late 1960s and are reliable and stable devices with a low base resistance [42], but still exhibit some disadvantages as discussed in Ref. [43]. The use of inexpensive and easy-to-implement ceramic technologies for the synthesis of ZnGa2O4, similar to the one described in Ref. [12], is promising. However, there is practically no published report devoted to the study of gas-sensitive properties of such materials.
Actually, Refs. [11,37] report on the development and study of sensors based on ZnGa2O4 with high sensitivity to NO compared to other gases. These sensors can be considered quasi-selective. The authors proposed a mechanism according to which there is a special type of dangling bonds on the surface of ZnGa2O4, which are effective adsorption centers for NO. Their sensors practically did not respond to CO2, CO, and SO2, but showed a much lower response to NO2 than to NO. High responses of ZnGa2O4-based sensors to NO2 exposures were reported in Refs. [22,40,41] as well as by the utilization of the well-known method of increasing the sensitivity and selectivity of MOSs—exposure to ultraviolet radiation [41]. In turn, a few papers have shown a high sensitivity of ZnGa2O4 to LPG. The responses to LPG are comparable to the responses to NOx or much higher, which was obtained for sensors based on thin films of ZnGa2O4 and ZnGa2O4:N at T = 450 °C and 400 °C, respectively [39]. High sensitivity to NOx is typical of many MOSs with a number of advantages and disadvantages [44,45]. Indeed, there is much less work done on the development of sensors for volatile hydrocarbon vapors, including LPG [46]. The reason for the high sensitivity of ZnGa2O4 to LPG is still not clear and is not considered in detail in these papers. The LPG is a mixture of several hydrocarbons like CH4, C3H8, C4H10, etc. [12,46]. Therefore, it is reasonable to investigate the gas-sensitive properties of ZnGa2O4 under exposure to the LPG components separately to gain inside into the sensory mechanisms of ZnGa2O4 and to design highly sensitive and selective sensors. In this research, we focus on the investigation of the gas-sensitive properties of ZnGa2O4 upon exposure to CH4, which is highly relevant to environment quality monitoring and combustion monitoring systems.
More specifically, our research is devoted to the development and investigation of CH4 sensors based on ZnGa2O4 and ZnGa2O4 with Er addition ceramics. It is important to note that the doping of ZnGa2O4 with various impurities is widely used and studied in detail for the development of effective luminescent materials [13,47,48,49,50,51,52,53,54,55]; however, to the best of our knowledge, there is not any publication dealing with gas-sensitive properties of ZnGa2O4 with Er additive. It has been shown that doping with high concentrations of Er-nanostructured SnO2 [56] and BiFeO3 [57] allows for high responses to alcohol and acetone vapors. At the same time, the sensors are characterized by the long-term stability of gas-sensitive characteristics. Moreover, the method employed in our study for the synthesis of ZnGa2O4 is characterized by relative simplicity and low cost.
Various types of sensor [1,58,59,60,61] are being developed and used to detect CH4, including optical, calorimetric, pyroelectric, electrochemical, and chemoresistive sensors. Those based on MOSs and TDMs are of particular interest due to their low production cost, miniaturization potential, and compatibility with microelectronic technologies and materials [1,58,59,60,61]. Many sensors have been developed to date, mainly based on SnO2, ZnO and TiO2, including commercial samples. However, research is ongoing to solve several issues, such as reducing the power consumed by sensors, increasing selectivity, stability, and speed performance, reducing the effect of ambient humidity and detection limits. At the same time, methods of “green manufacturing” for producing sensory materials are being actively considered. In order to address these issues, the investigation of MOSs and methods for modifying their gas-sensitive properties, as well as the study of heterostructures and nanostructures based on MOSs and other semiconductors, is ongoing. Additionally, new materials such as p-type MOSs, TMDs, and various allotropic forms of carbon, along with heterostructures based on these materials, are being employed [1,5,30,31,32,33,34,35,58,59,60,61,62]. Furthermore, improvements to sensor design are being made. It is worth noting that these studies practically do not consider the development of high-temperature CH4 sensors.
2. Materials and Methods
Raw materials of Ga2O3 (99.99%) and ZnO (99.99%) powders in the stoichiometric ratio were used to synthesize the samples. To introduce Er into the samples, 5 wt% of Er2O3 (99.99%) powder was added to the charge. The charge preparation process involved the careful grinding and homogenization in the Tencan XQM-0.4A alundum ball (Changsha Tianchuang Powder Technology Company Limited, Changsha, China) mill for 30 min to ensure the uniform distribution of powder particles. The resulting powder mixtures were compressed at a pressure of 1 MPa into ~1 mm thick pellets. After pressing, the ceramic pellets were subjected to annealing at a temperature of 1500 °C in an air stream for 10 h. The samples were annealed in alundum crucibles, which ensure high-temperature resistance and chemical inertness. The temperature regime was maintained using a high-precision controller. The samples without Er2O3 addition were denoted as ZGO and the samples with Er2O3 addition—ZGO+Er. All samples presented in this work were synthesized by participants from L.N. Gumilyov Eurasian National University.
X-ray diffraction (XRD) analysis was performed to determine the phase composition of the samples using Bruker D6 PHASER(Bruker Corp., Bremen, Germany) with monochromatic CuKα1 radiation (1.5406 Å). Phase identification was performed using the ICDD database (PDF-4+ 2019). The lattice parameters were estimated using the Rietveld method in the Match4 program. The Williamson–Hall method was used to analyze the broadening of XRD peaks to estimate crystallite size Dc and microstrain ε in materials.
The survey and core-level (Ga 2p3/2, Zn 2p3/2, O 1s, Er 4d) photoelectron (PE) spectra, recorded using an ESCAlab 250Xi X-ray photoelectron spectrometer (Thermo Fisher Scientific, Oxford, UK) equipped with a monochromatic Al Kα X-ray source (hν = 1486.6 eV). The chemical states of Ga, Zn, O, and Er were assessed by comparing the Ga 2p3/2, Zn 2p3/2, O 1s and Er 4d spectra of the samples (ZGO, ZGO+Er) with those of Ga2O3 (film, obtained by the method of halide vapor-phase epitaxy (HVPE)), ZnO (pressed powder, purity 99.99%), and Er2O3 (pressed powder, purity 99.99%) in terms of line shapes and binding energies. Survey and core-level spectra were obtained at analyzer pass energies of 100 and 50 eV and energy step sizes of 1 and 0.1 eV, respectively. Additionally, before XPS measurements, all samples were etched with argon ions at an energy of 3 keV for 60 s to remove surface contaminants (atoms and molecules from the atmosphere). The position of the C 1s peak maximum of saturated hydrocarbon contamination at 285.0 eV was used as an internal reference for calibration of each spectrum. The binding energy scale was calibrated using the Au 4f7/2 peak at 84.0 eV and the Fermi level measured on a pure gold foil. Data processing was conducted using the Casa XPS software (version 2.3.16).
To establish the elemental composition of the films, energy dispersive X-ray (EDX) spectroscopy was performed using an Axia ChemiSEM (Thermo Fisher Scientific, Waltham, MA, USA) scanning electron microscope equipped with an appropriate spectrometer at an accelerating voltage of 5 kV.
The surface microrelief of the samples was investigated using the high-resolution field emission scanning electron microscopy (HR FESEM) and atomic-force microscopy (AFM). HR FESEM was performed using an Apreo 2S microscope (Thermo Fisher Scientific, Waltham, MA, USA) at an accelerating voltage of 5 kV. To realize AFM, a Solver HV microscope (NT-MDT, Beijing, China) was used in semi-contact mode with a NSG30_SS (TipsNano, Beijing, China) cantilever at a rounding radius of 2 nm.
The diffuse reflectance spectra of the samples were measured using a Persee T8DCS (Beijing, China) dual-beam spectrophotometer with an integrating sphere.
Pt contacts were deposited on the samples’ surface by means of magnetron sputtering through a shadow mask. The samples with the contacts were divided into separate samples with a size of ~5 mm × 5 mm. The interelectrode distance was 1.2 mm.
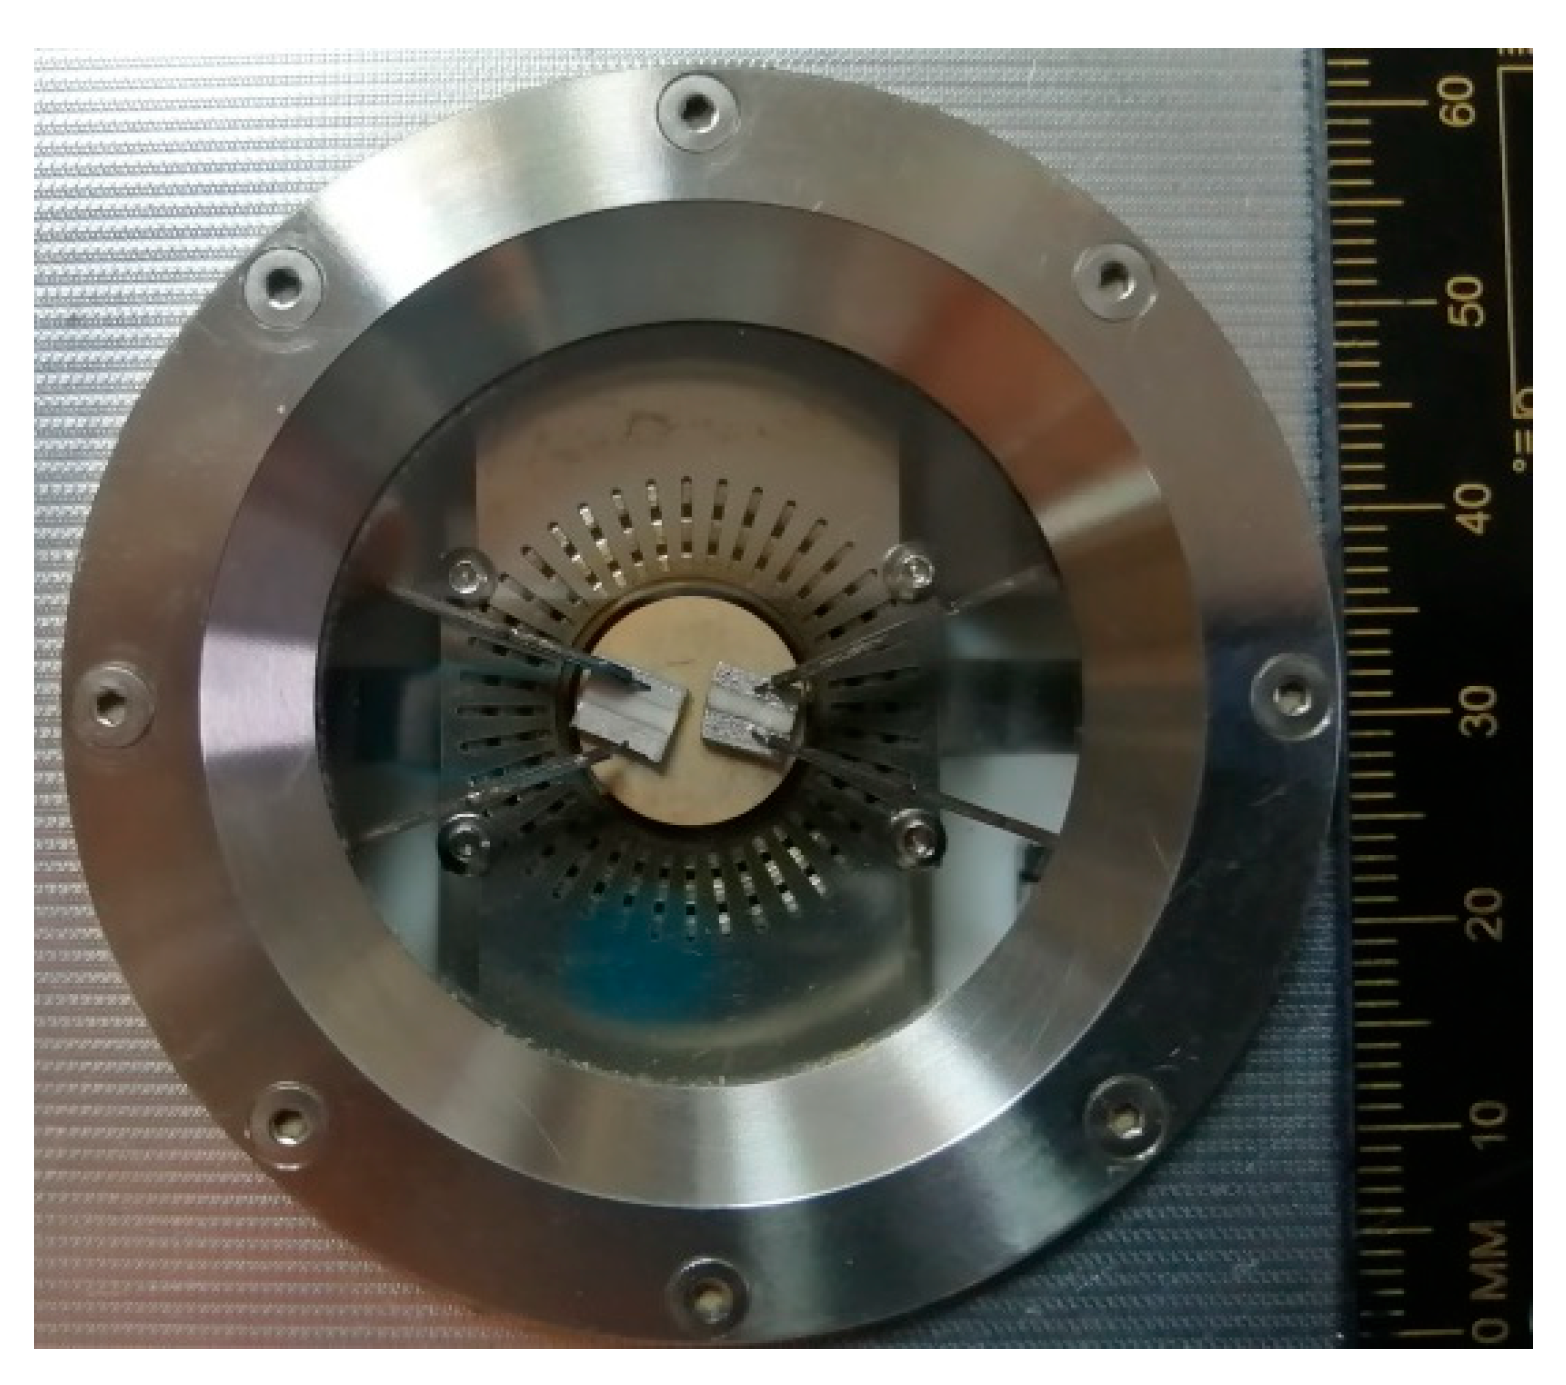
The gas sensing measurements of the samples were performed by means of a sealed chamber with a Nextron MPS-CHH microprobe station. The chamber volume was 100 cm3. A ceramic-type heater, installed in the chamber, was used to heat the samples. The heater allowed T to be set and controlled in the range from RT to 750 °C with a T accuracy control of ±0.1 °C. The gas mixture of pure dry air + CH4 was pumped through the measuring chamber. The pure dry air was generated using a special generator GPA-1,2-3,5 (Himelektronika LLC, Moskow, Russia) that produces air with a residual concentration of moisture and hydrocarbon contaminants of no more than 10 ppm and 0.1 ppm, respectively. The concentration of the CH4 in the gas mixture was controlled by a gas mixing and a delivery system Microgas F-06 (MICROMED S.r.l., Roma, Italy) based on the Bronkhorst gas flow regulators. The total flow rate of the gas mixture through the measuring chamber was 1000 cm3/min. The relative error of the gas mixture flow rate did not exceed 1.5%. Figure 1 shows a photo of the samples with Pt contacts in the measuring chamber.
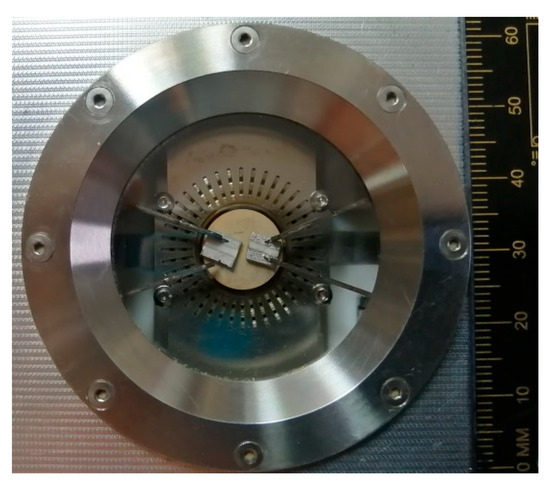
Figure 1.
Photo of the samples in the measuring chamber.
Before starting the gas-sensitive properties studies, the samples were heated in a measuring chamber in a stream of pure dry air at T = 650 °C for 5 min to stabilize the Pt contact properties. The time dependences of the resistance of the samples were measured by means of a Keithley 2636A source-meter (TEKTRONIX, INC., Beaverton, OR, USA). The voltage applied to the sample’s contacts during the measurements of time dependencies of the resistance was kept at 5 V.
The following ratio was chosen as the response S of the samples to CH4:
where Rair is the resistance of samples in pure dry air; Rg is the resistance of samples in a gas mixture of pure dry air + CH4.
S = Rair/Rg,
The time interval between the starting point of the interaction between gas mixture and samples, and the moment when sample resistance R = 1.1 × Rg was chosen as the response time tres under exposure to CH4. The time interval between the starting of pure dry air pumping through the measuring chamber and the moment when R = 0.9 × Rair was chosen as the recovery time trec after exposure to CH4.
To investigate the impact of relative humidity RH on samples responses to CH4 pure dry air was passed through a bubbler containing distilled water before entering a homogenizer where it was mixed with pure dry air and/or pure dry air + target gas mixture streams from other channels. By varying the flow ratios through the channels, the desired RH level in the measuring chamber was achieved. RH was measured using a HIH 4000 Honeywell capacitive sensor (Honeywell, Charlotte, NC, USA) with an absolute error of ±3.5%.
In addition to CH4 and high humidity, the samples were exposed to mixtures of pure dry air with H2, CO, CO2, NH3, NO2, NO, C2H4, C3H8, and C4H10 to evaluate their selectivity to these habitat and industry-relevant gases. When investigating the samples’ sensitivity to O2, a pure N2 atmosphere was chosen as the initial environment.
3. Results
3.1. Structural Properties
The XRD analysis (Figure 2) of the ZnGa2O4 (ZGO) sample revealed that the main crystalline phase is zinc digallium oxide (ZnGa2O4), identified as a cubic spinel structure belonging to the Fd-3m space group and referenced in ICDD 01-086-0415. This primary phase comprises 80.7% of the material, while the secondary phase, β-Ga2O3, accounts for 19.3% and is indexed as ICDD 00-041-1103. The lattice parameters for ZnGa2O4 were determined to be a = b = c = 8.3279 Å with a unit cell volume of 577.568 Å3. Dc of ZnGa2O4 is 64.8 nm, with an associated ε of 0.066%. In contrast, the secondary β-Ga2O3 phase exhibited lattice parameters of a = 12.2373 Å, b = 3.0429 Å, c = 5.8092 Å, and β = 103.83°, with a smaller Dc of 46.4 nm and ε of 0.067%.
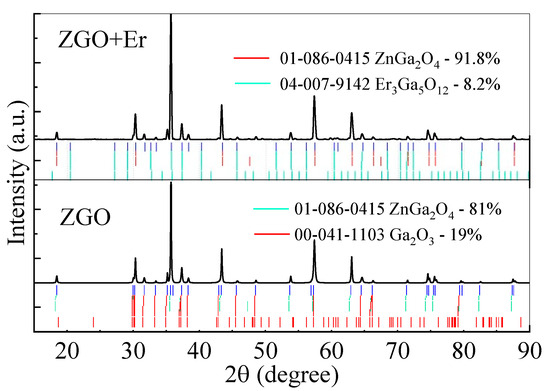
Figure 2.
XRD spectra of ZGO and ZGO+Er samples.
In the Er-doped sample (ZGO+Er), the proportion of the primary ZnGa2O4 phase increased to 91.8%, with lattice parameters slightly expanded to a = 8.3331 Å and a unit cell volume of 578.66 Å3. Dc of the ZnGa2O4 phase in this sample increased to 106.8 nm, while ε was slightly higher at 0.068%. The secondary phase in the ZGO+Er sample, triherbium pentagallium oxide (Er3Ga5O12 or erbium gallium garnet), accounted for 8.2% of the composition and is referenced in ICDD 04-007-9142. This phase exhibited a cubic structure with lattice parameter a = 12.258 Å, a unit cell volume of 1841.8 Å3, Dc of 50.5 nm, and ε of 0.072%.
The high degree of crystallinity in the ZnGa2O4 phase across both samples confirms the successful formation of polycrystalline ZnGa2O4 with a cubic spinel structure. The differences in phase composition and crystallite sizes between the pure and Er-doped samples indicate that the incorporation of erbium influences the structural and microstructural properties. The formation of the Er3Ga5O12 phase suggests a partial interaction between Er2O3 and Ga2O3 during high-temperature annealing, as confirmed by the identification of phases using the ICDD database. These results demonstrate that both the ZGO and ZGO+Er samples possess desirable structural qualities, making them suitable for potential applications in optical and electronic technologies.
The chemical composition of the studied samples ZGO and ZGO+Er was determined based on a detailed analysis of the photoelectron lines of the corresponding elements from the survey PE spectra () taking into account the atomic sensitivity factors based on Scofield cross-sections (Table 2). The data in Table 2 show that both samples contain zinc, gallium, oxygen, and carbon. In the case of ZGO+Er, Er is also additionally present in an amount of 0.2 at.%. In general, it can be noted that the chemical composition of the samples is similar, and the presence of a small amount of carbon (about 3.5–3.8 at.%) is apparently associated with its introduction into the composition of the surface layers of the samples at the stage of their synthesis.
Table 2.
Chemical composition of the surface region of ZGO and ZGO+Er samples by XPS.
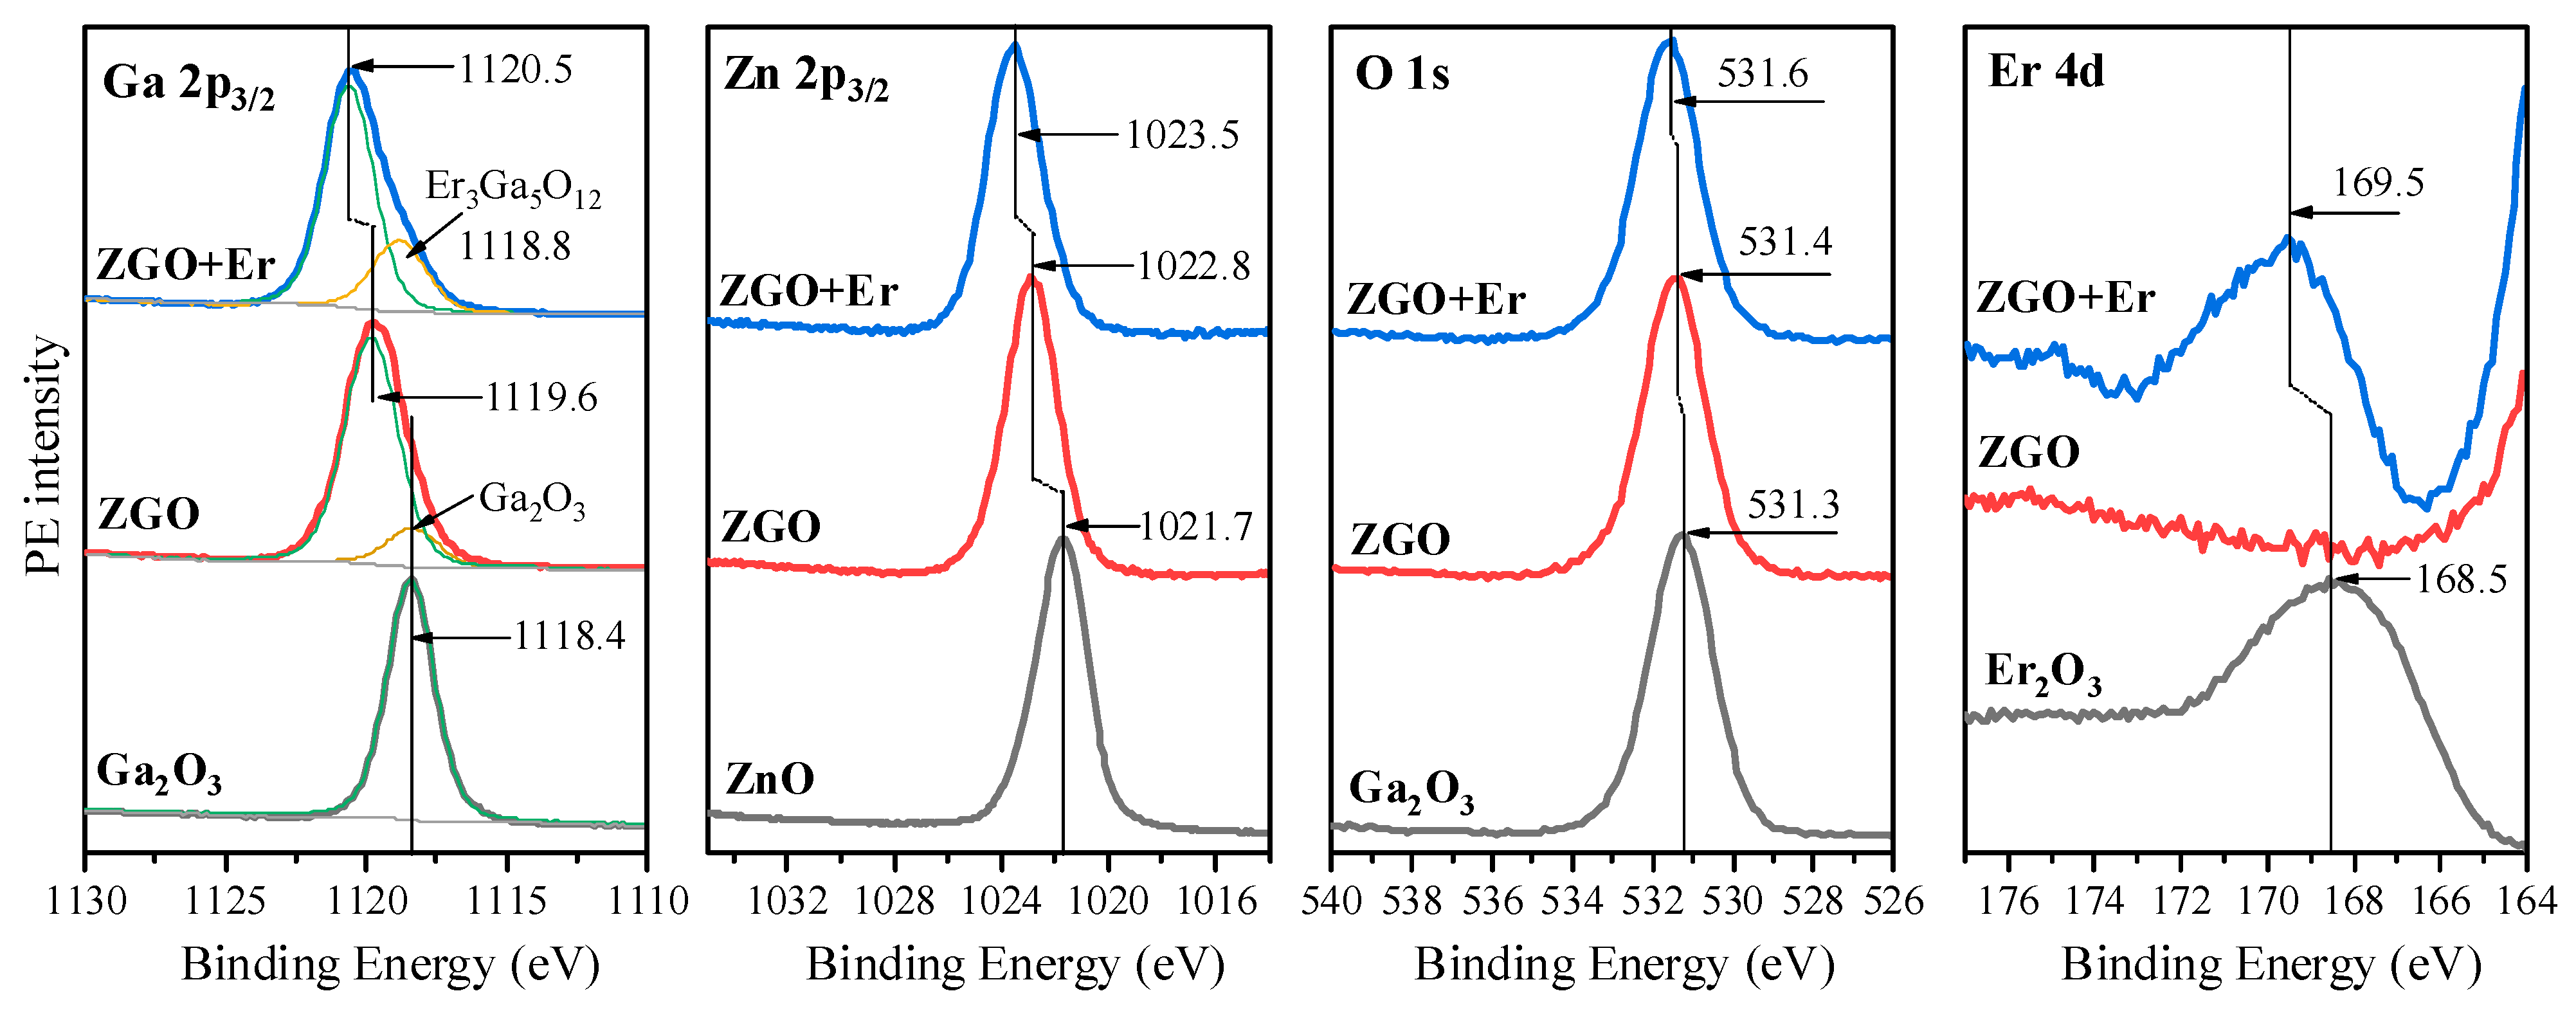
Now, let us proceed to a detailed examination of the core-level (Ga 2p3/2, Zn 2p3/2, O 1s, Er 4d) PE spectra of both samples, starting with the Ga 2p3/2 spectra (Figure 3). It is clearly seen that the maximum of the Ga 2p3/2 spectrum in the ZGO sample is located at 1119.6 eV, which is +1.2 eV higher than for the reference sample Ga2O3. Such a high-energy shift is due to the fact that gallium is surrounded not only by oxygen, but also by zinc in the ZnGa2O4 compound. At the same time, a slight asymmetry of the line is observed on the side of low binding energies, which indicates the presence of a small amount of gallium also in Ga2O3. This result agrees well with the XRD data (Figure 2). When moving from the ZGO sample to the ZGO+Er sample, one can see a subsequent high-energy shift of the 2p3/2 spectrum by +0.9 eV, as well as the appearance of a clear intense shoulder on the side of low binding energies. Both results are due to the incorporation of erbium into the sample structure. Moreover, the largest amount of gallium in ZGO+Er is in the ZnGa2O4 compound, as in the ZGO sample, while some amount is in another compound. Considering that the position of the low-energy component in ZGO+Er is 0.4 eV higher than that of the similar component in the ZGO sample, and the fact that, according to the XRD data, Ga2O3 is absent in ZGO+Er, we can conclude that gallium is in a compound with erbium. Combining the data of XRD, EDX, and the information obtained from the analysis of diffuse reflectance spectra and the results of XPS, it can be assumed that the low-energy component in the spectrum of Ga 2p3/2 is associated with the Er3Ga5O12 compound. It is interesting that similar energy shifts in the Zn 2p3/2 spectra are observed in the series ZnO → ZGO → ZGO+Er (Figure 3). However, two important features should be noted: the magnitudes of these shifts are smaller than in the case of Ga 2p3/2 spectra, and the fact that in both studied samples, the 2p3/2 zinc line is symmetrical. These results indicate, on the one hand, that zinc is in only one chemical state—in ZnGa2O4, and on the other hand, that additionally introduced erbium in ZGO+Er has a slightly smaller effect on the charge state of zinc compared to gallium. When analyzing the O 1s spectra (Figure 3), only small energy shifts can be seen, since the binding energies of the metal oxides used in this work differ insignificantly. Finally, the analysis of the Er 4d spectra allowed us to establish that erbium is present only in the ZGO+Er sample. Moreover, the shape of the spectrum in the studied sample and in the spectrum of the reference compound Er2O3 is close, which indicates the presence of erbium in Er3+. At the same time, taking into account the shift of +1.1 eV of the Er 4d spectrum in the ZGO+Er sample relative to the Er2O3 spectrum and the conclusions made above when analyzing the Ga 2p3/2 spectrum, we can be confident that erbium is bonded with gallium and oxygen in the compound Er3Ga5O12.
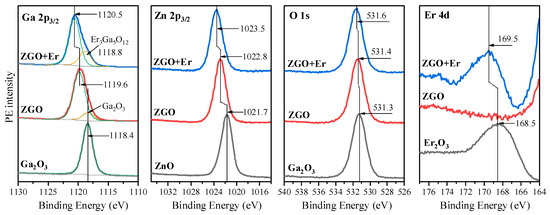
Figure 3.
Ga 2p3/2, Zn 2p3/2, O 1s, Er 4d spectra of ZGO and ZGO+Er samples as well as the reference compounds Ga2O3, ZnO and pure Er2O3.
The surface of ZGO samples is relatively smooth and characterized by the presence of pores extending to the surface (Figure 4a). The pore sizes on the surface of the samples vary from 8 µm to 17 µm. The addition of Er significantly changes the surface morphology of the samples (see Figure 4b). The SEM image of the ZGO+Er surface clearly distinguishes the microcrystals of two types, with different electron densities, and the interfaces between microcrystals of one and different types. Microcrystals of the first type have facets of regular geometric shapes characteristic of the cubic crystal lattice. The size of microcrystals of the first type varies in the range from 1 µm to 7 µm. Microcrystals of the second type, spherical in shape, are predominantly embedded in the structure of the samples and segregate on the surface. The size of microcrystals of the second type varies in the range from 0.5 µm to 4 µm. In addition, for ZGO+Er, the density of pores extending to the surface of the samples increases. The size of pores extending to the surface of ZGO+Er samples varies from 1 µm to 7 µm. According to the analysis of AFM images (Figure 5), the root mean square of the surface roughness of the samples increases from 787.8 nm to 895.5 nm with the addition of Er. ZGO+Er samples are characterized by a significantly larger active surface. The increased pore density and roughness of the ZGO+Er samples must contribute to the higher CH4 response by enhancing gas adsorption. Also, on the surface of samples of both types, there are small clusters of the order of 10–100 nm, probably due to the residues of precursors that did not react during synthesis of the samples.
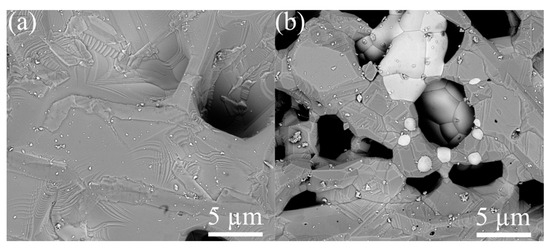
Figure 4.
SEM images of the ZGO (a) and ZGO+Er (b) surfaces.
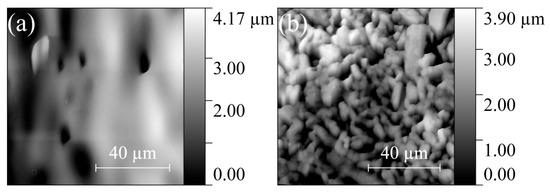
Figure 5.
AFM images of the ZGO (a) and ZGO+Er (b) surfaces.
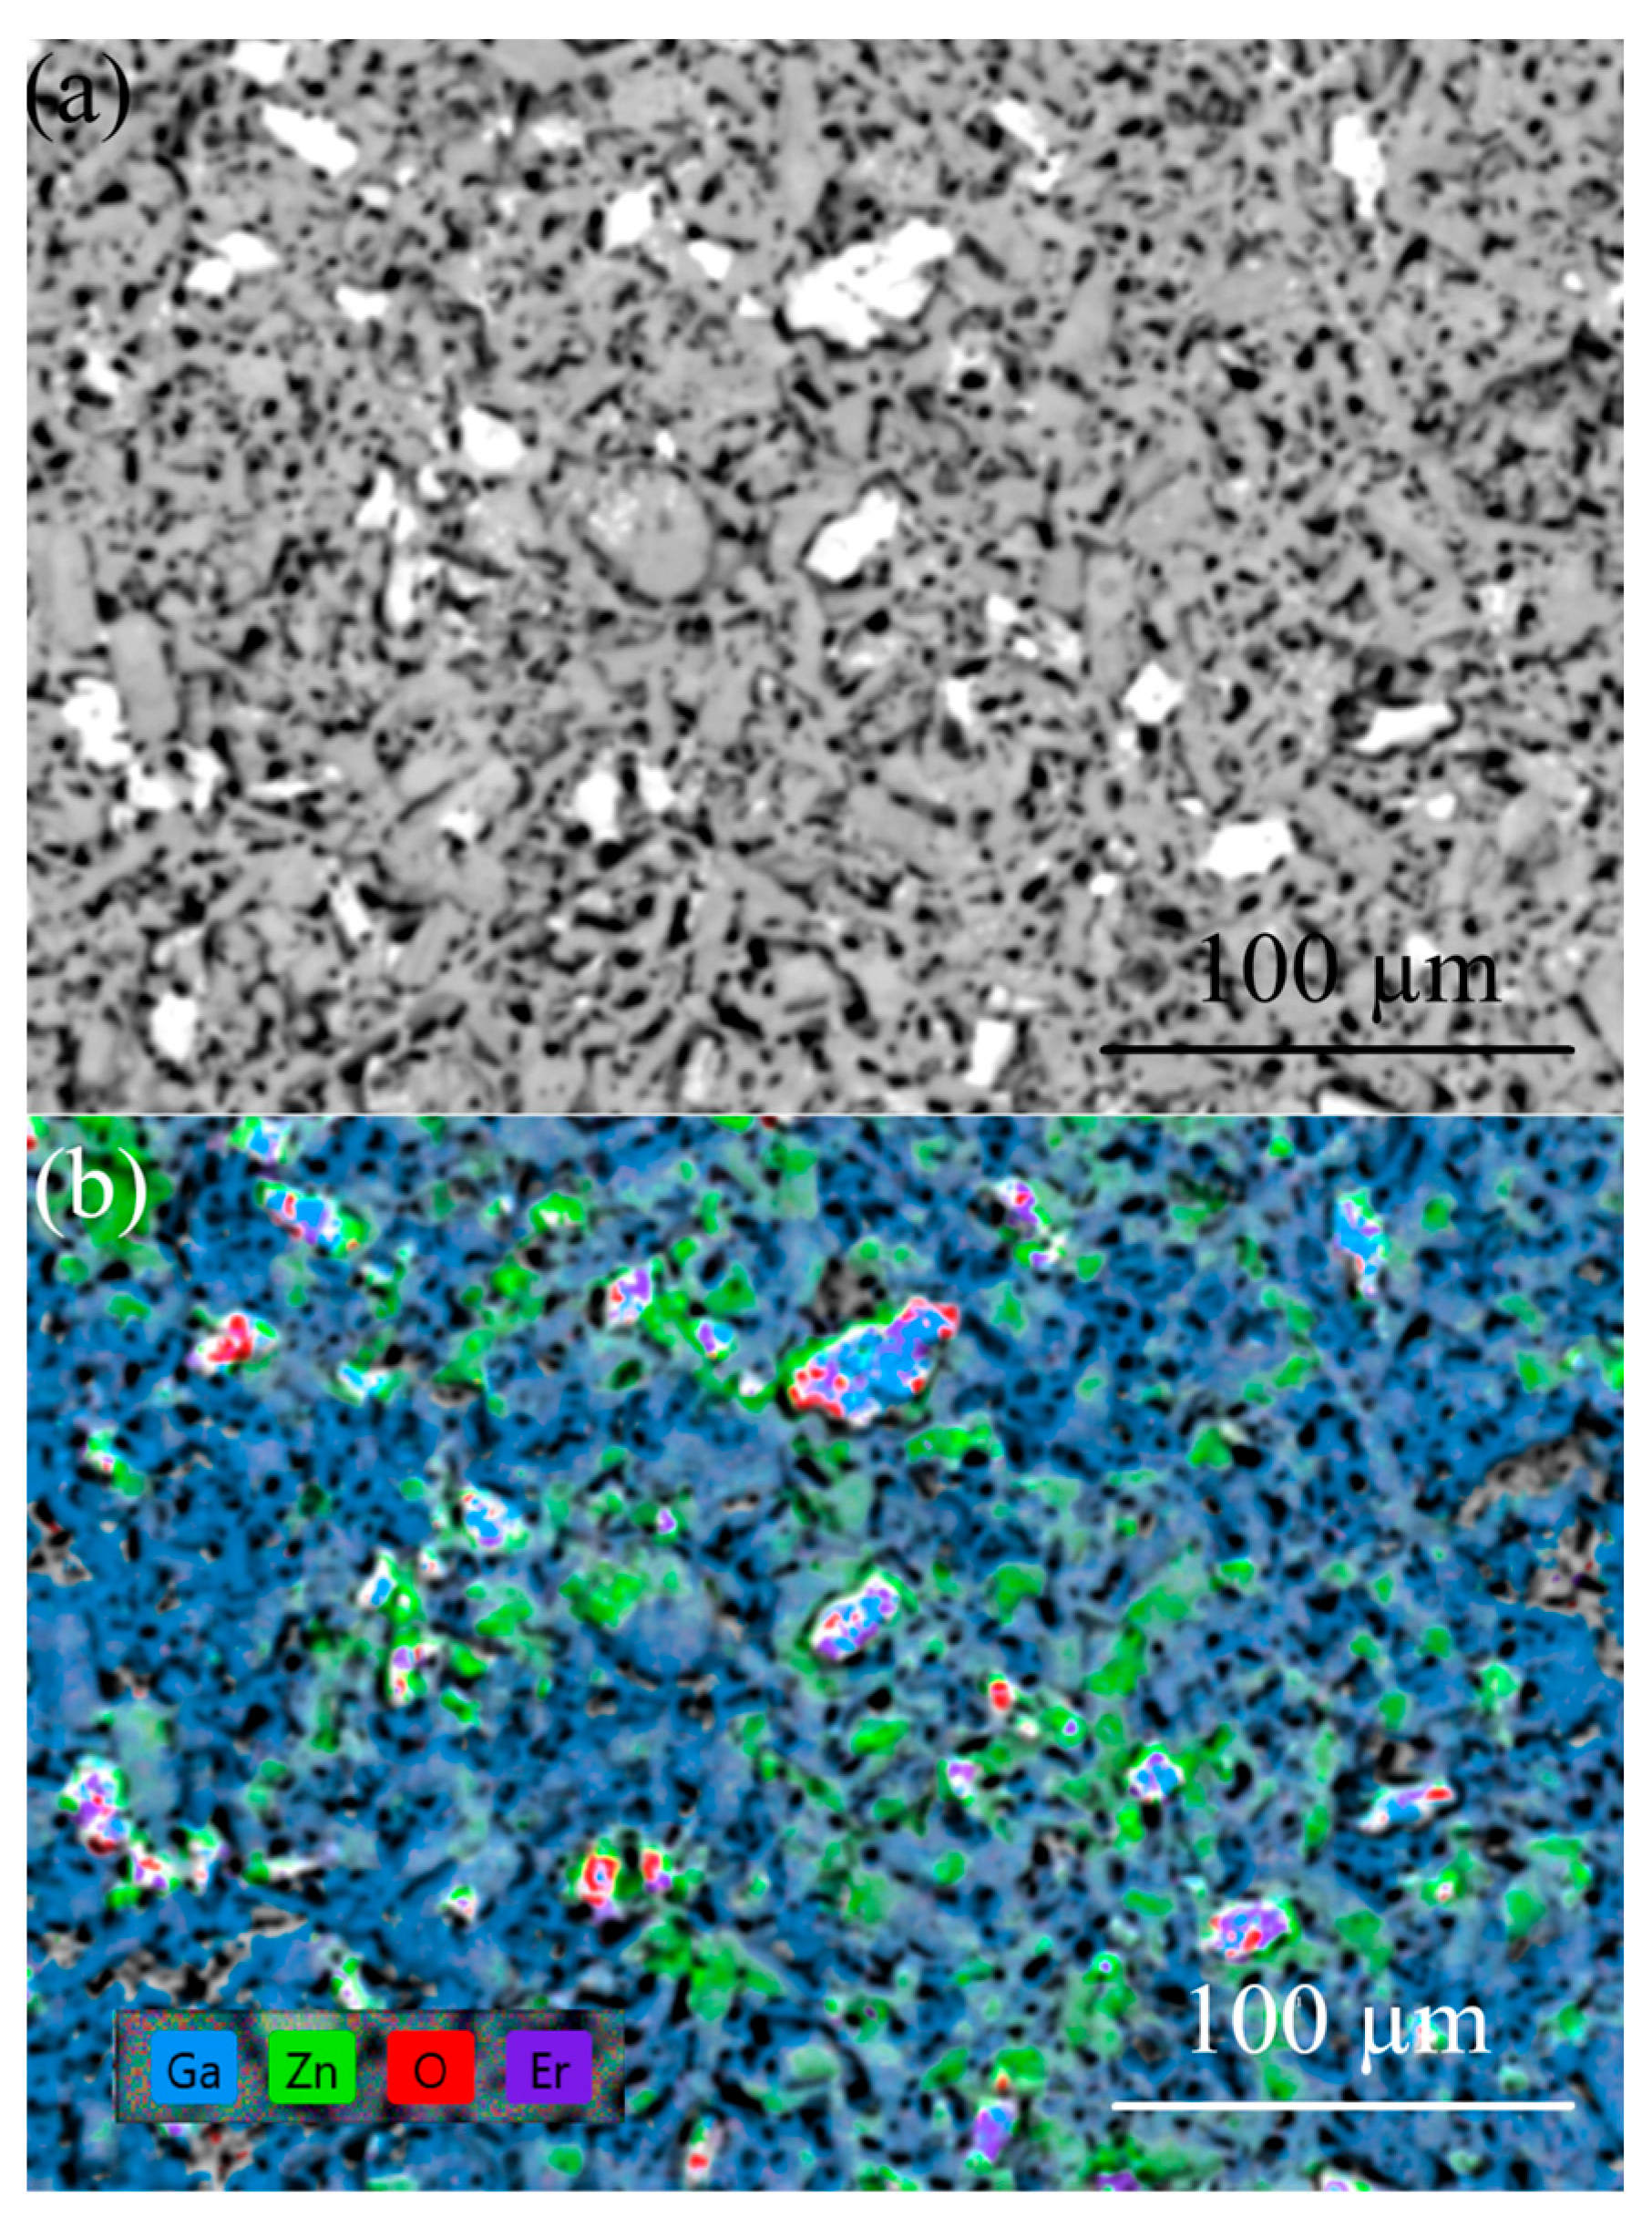
There are difficulties in determining the concentration of constituent elements in the samples due to the overlap of Ga and Zn lines on the one hand, and the insulating properties of the samples at RT on the other hand. The EDX analysis of the ZGO samples did not reveal the presence of extrinsic elements other than Ga, Zn, and O, which are homogeneously distributed over the area. EDX analysis showed that the second-type microcrystals for ZGO+Er samples (Figure 6) are characterized by a high Er content. The concentration of Er in these microcrystals exceeds the concentrations of Ga and Zn. Based on the XRD and EDX results, it can be assumed that microcrystals of the second type correspond to the superstoichiometric Er3Ga5-xO12-y phase.
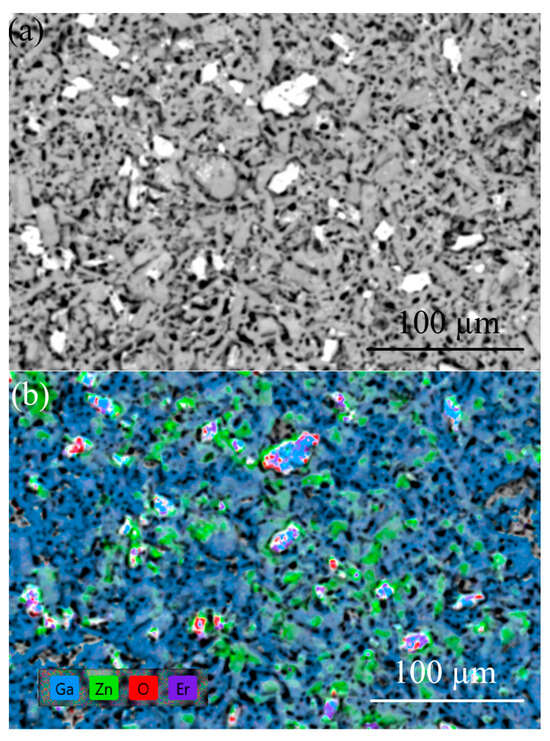
Figure 6.
SEM image (a) and corresponding EDX mapping (b) of the ZGO+Er surface.
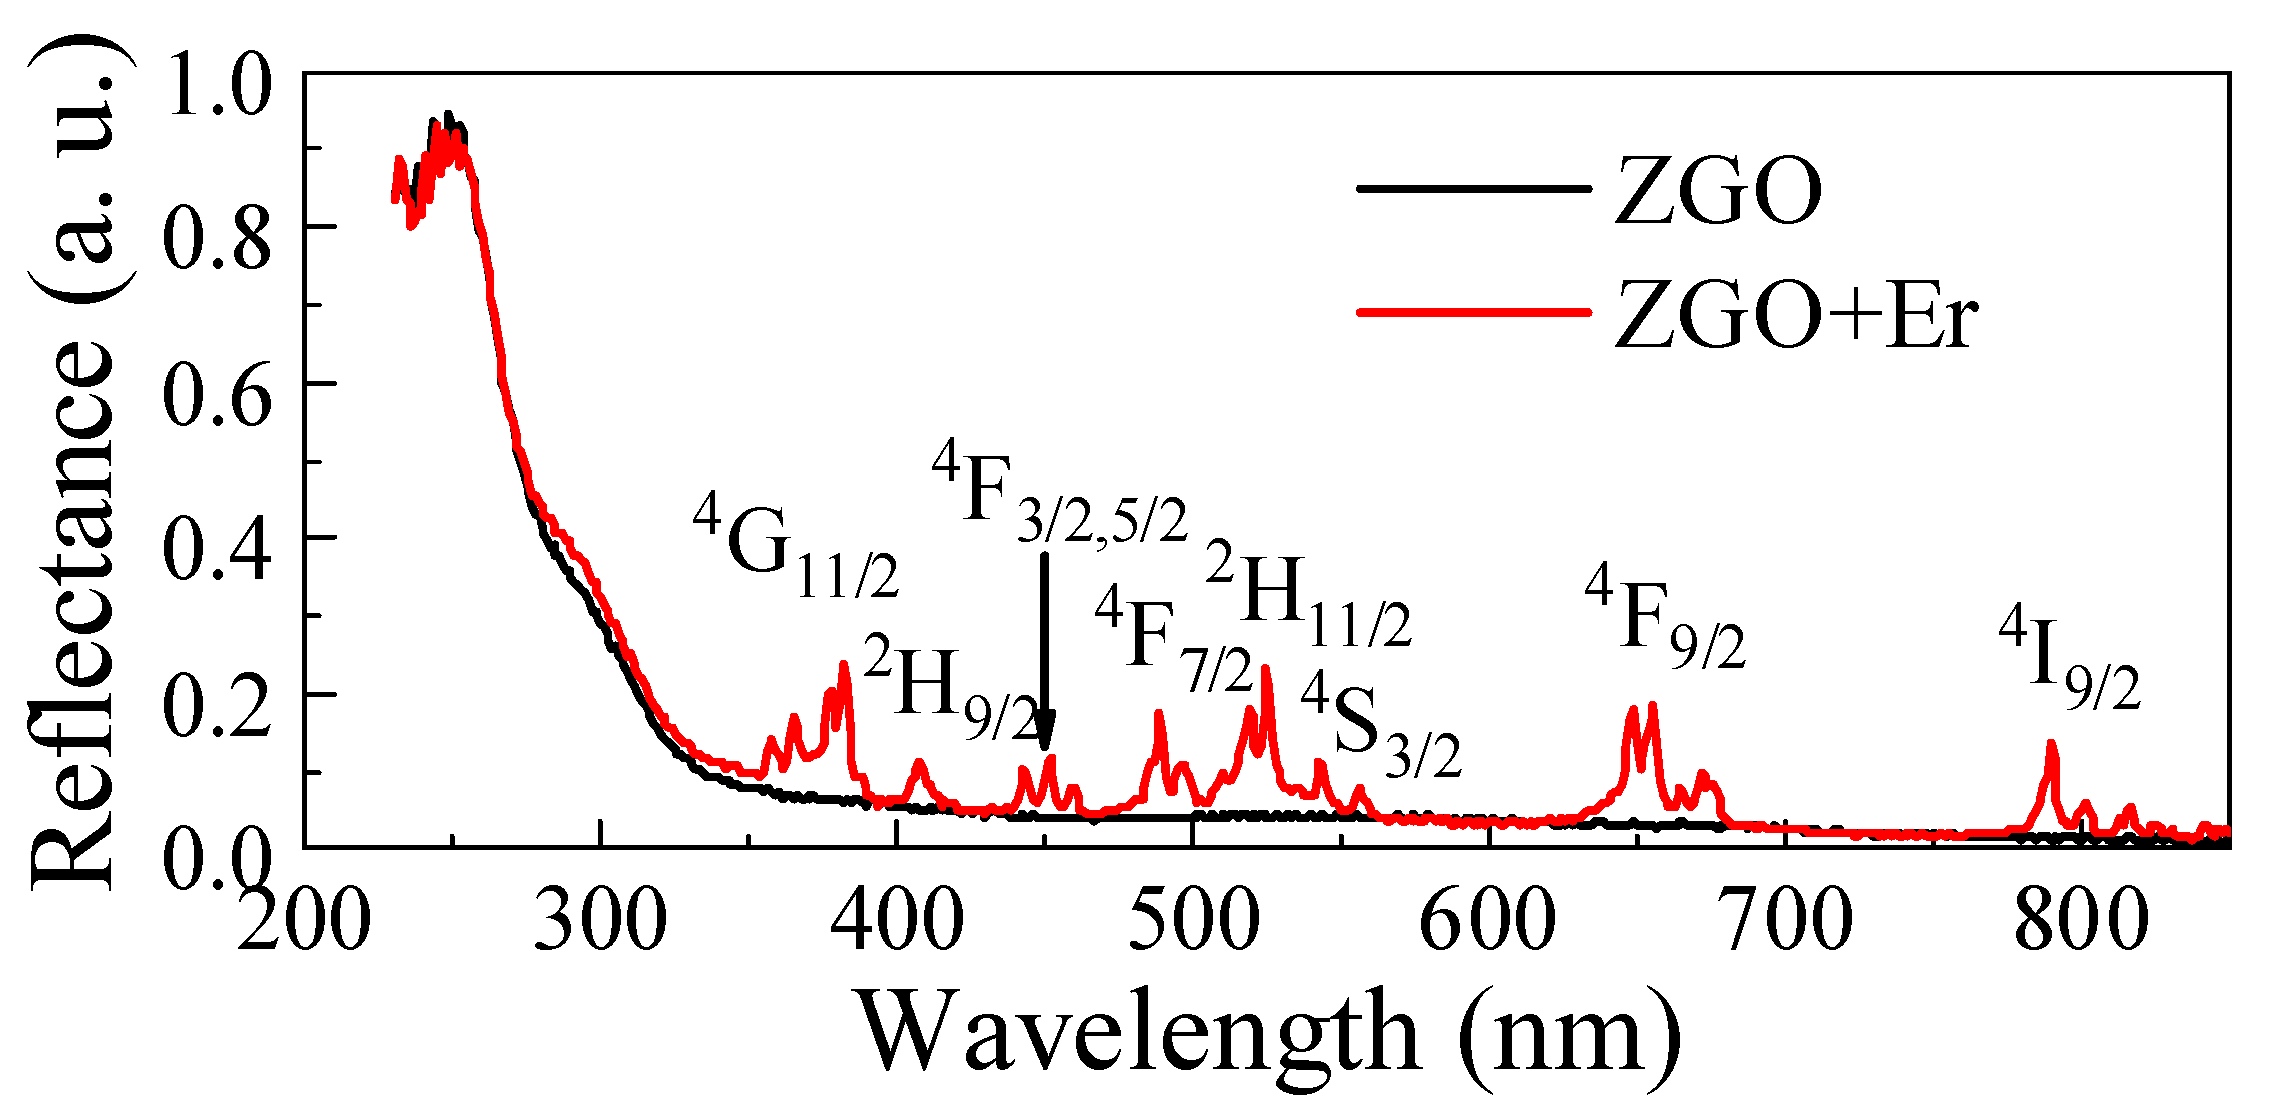
The diffuse reflectance spectrum of the ZGO sample is typical (Figure 7). Regardless of the chemical composition of the samples, a sharp absorption edge in the ultraviolet region is observed, which corresponds to intrinsic absorption in ZnGa2O4. The Kubelka–Munk estimates showed that the Eg of ZGO is 4.29 eV, which is in agreement with the literature data [63]. When Er2O3 is added into the ZGO composition, a slight decrease in the reflectance intensity in the absorption edge region is observed. This may be due to the introduction of defects or the state of levels inside the band gap of ZnGa2O4 due to the presence of Er3+ ions. Additional peaks appear on the reflection spectrum of the ZGO+Er sample in the wavelength range of 400–800 nm due to the appearance of additional energy levels in the band gap of ZnGa2O4, as well as partially coinciding with the absorption of the Er3Ga5O12 phase. The spectrum typical of the ZGO+Er samples contains a set of narrow peaks characteristic of the internal 4f → f transitions of electrons in Er3+ ions, the positions of which are presented in Table 3.

Figure 7.
Reflection spectra of ZGO and ZGO+Er samples.
Table 3.
Spectral lines of electron transitions in the Er3+ ion for ZGO+Er samples.
3.2. Gas-Sensitive Properties
Figure 8 displays the temperature dependencies of the samples’ basic resistance in dry air in Arrhenius coordinates, ln(Rair) vs. 103/TK, where Rair is chosen as the basic resistance; TK is the absolute temperature of the sample. At T = 250 °C, Rair is high and reaches ~1012 Ohm. As the temperature increases, the Rair of the samples decreases according to the exponential law. Heating the samples up to T > 650 °C leads to an irreversible increase in Rair. For this reason, measurements of the gas-sensitive properties of the samples at T > 650 °C were not performed. The Rair of the ZGO samples with addition of Er decreases in 2.0–2.6 times in the whole T interval. Regardless of the chemical composition of the samples, two sections can be distinguished on the Arrhenius curves in the interval of T = 250–650 °C, the first in the interval of T = 250–350 °C, and the second–T = 350–650 °C. The first section is characterized by the activation energy ΔE1, and the second—by ΔE2. For ZGO samples, ΔE1 = 0.68 ± 0.08 eV and ΔE2 = 1.56 ± 0.02 eV. For ZGO+Er samples, ΔE1 = 0.7 ± 0.1 eV and ΔE2 = 1.52 ± 0.04 eV. The addition of Er has no effect on the position of the levels associated with ΔE1 and ΔE2, which are due to the presence of defects in ZGO, including antisite defects [64].
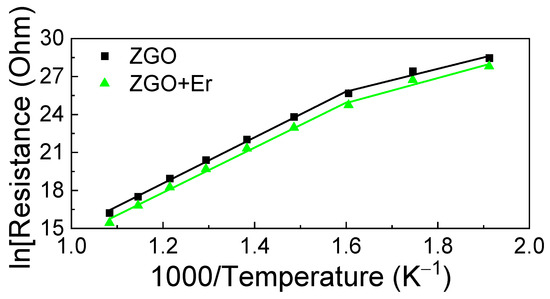
Figure 8.
Dependence of the sample’s basic resistance in ln scale on the inverse absolute temperature.
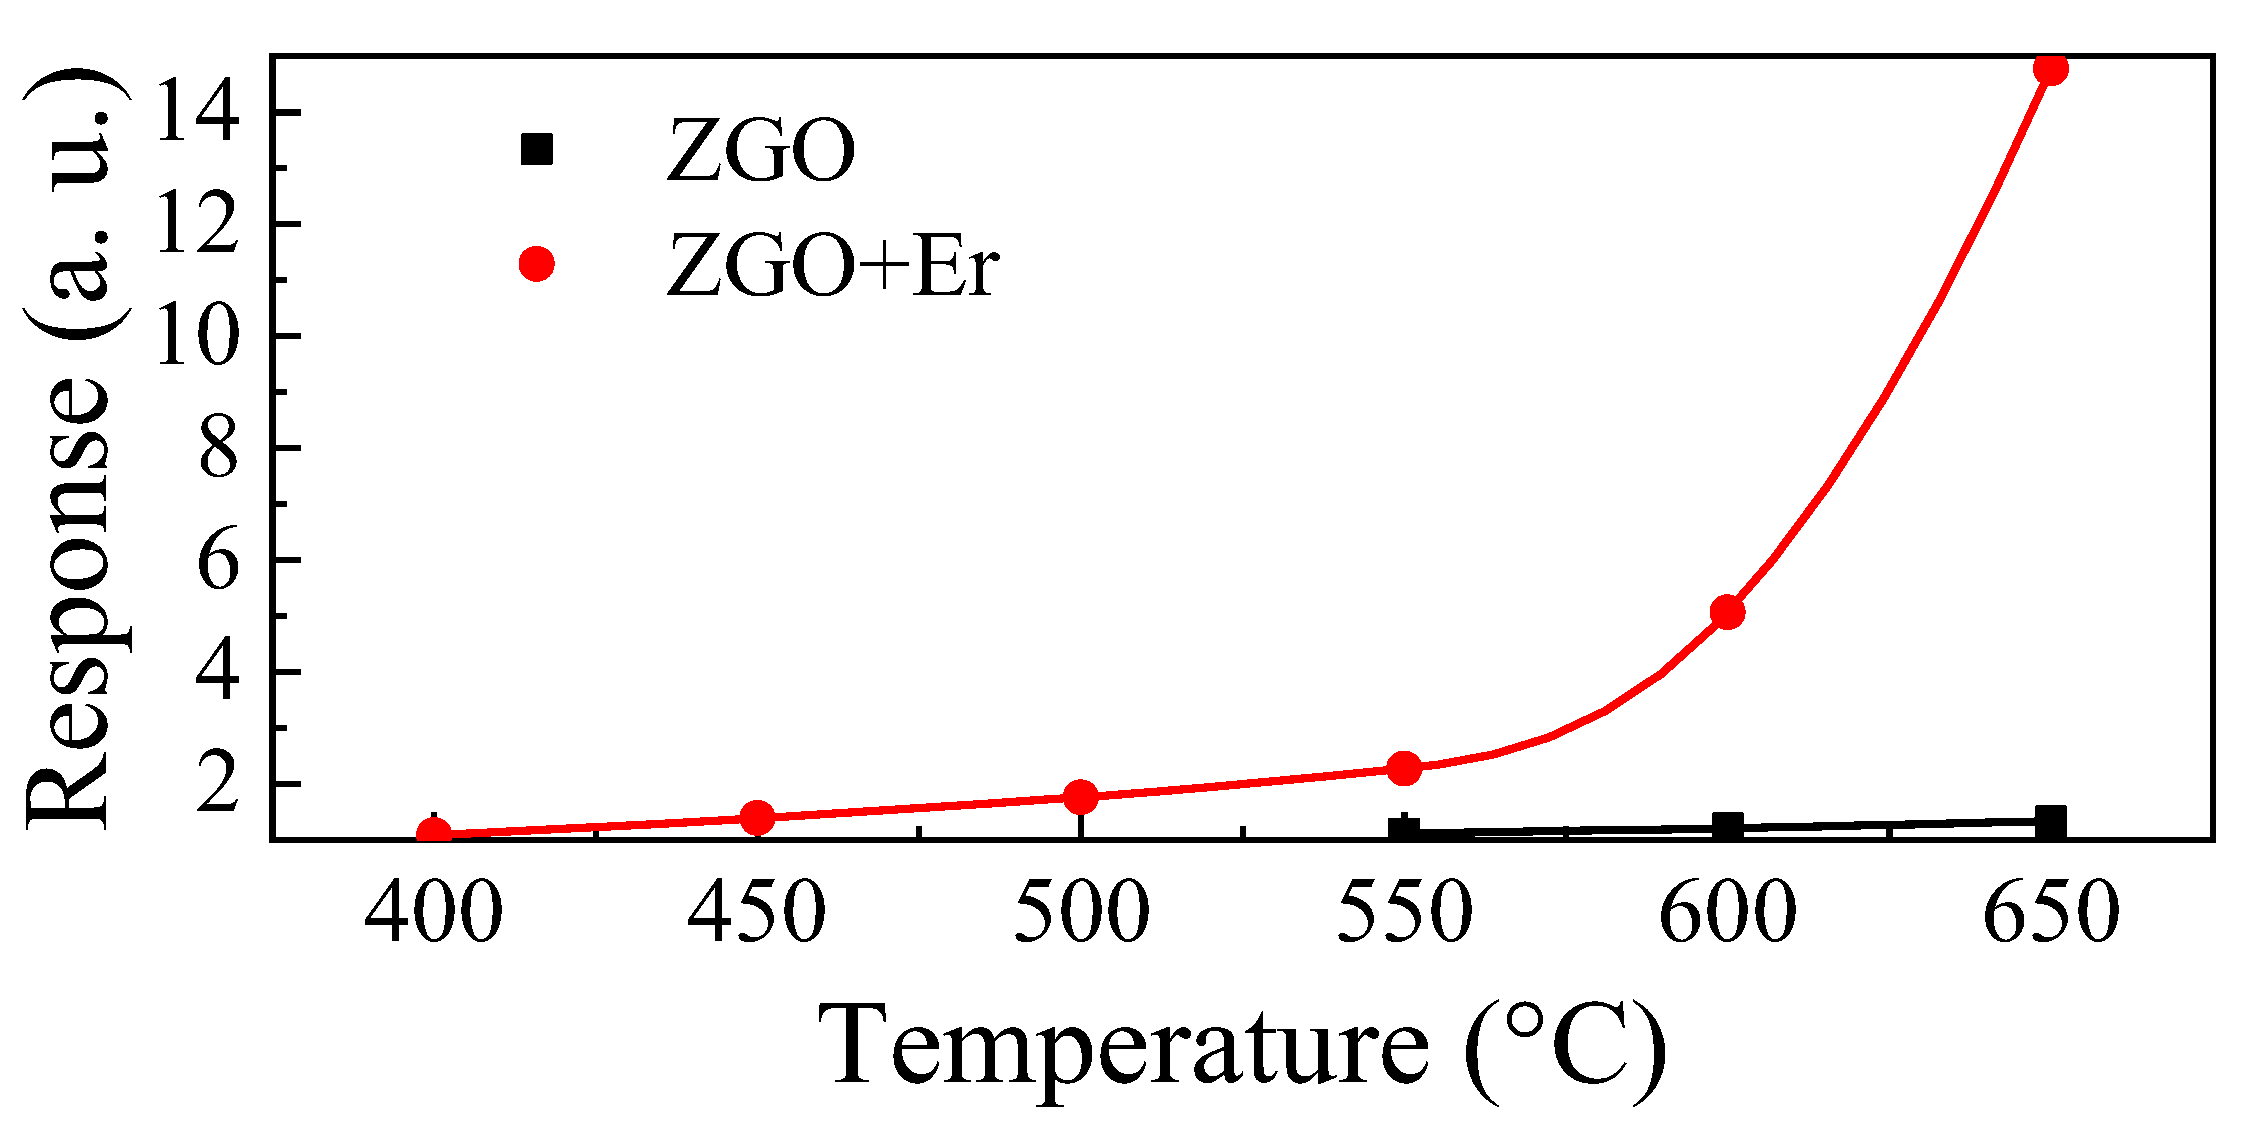
For ZGO, it was possible to register the response to CH4 in the range of T = 550–650 °C (Figure 9). These samples are characterized by weak responses to CH4. The maximum response Smax at T = 650 °C and under exposure to 104 ppm of CH4 is only 1.33 a.u. The addition of Er allows one to significantly increase the response of samples to CH4 and to extend the range of T, at which the samples show sensitivity to gas, to the low temperature region. Smax for ZGO+Er at T = 650 °C and exposure to 104 ppm of CH4 is 14.77 a.u. At the same time, the base resistivity of the samples with addition of Er decreased only by a factor of 2. Due to the high sensitivity of ZGO+Er samples to CH4, we will further focus on their gas-sensitive properties.

Figure 9.
Temperature dependencies of the ZGO and ZGO+Er responses to 104 ppm of CH4.
The dependences of the responses of ZGO+Er to CH4 on concentration ng were measured in the range of Δng = 100–20,000 ppm and at T = 650 °C (Figure 10). The samples exhibited responses at all gas concentrations in Δng. The response increases with ng according to a power law, S ~ngm, where m is the power index. At T = 650 °C for ZGO+Er samples m = 0.48 ± 0.01. It can be seen that the response does not reach saturation at high ng = (1–2) × 104 ppm. Also, the S to 100 ppm of CH4 is 2.91 a. u. The dynamic range Δng of the investigated samples can be extended to both high and low ng regions. Setting ng below 100 ppm is limited by the capabilities of the involved equipment, and above 2 × 10⁴ ppm by safety requirements.
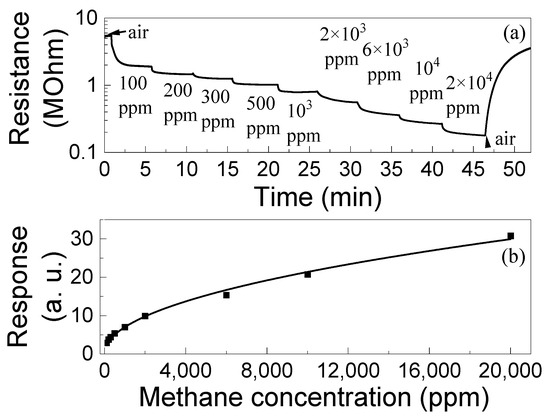
Figure 10.
Time dependence of the ZGO+Er samples resistance at T = 650 °C and exposure to different concentrations of CH4 (a); Dependence of the ZGO+Er samples response at T = 650 °C on CH4 concentration (b).
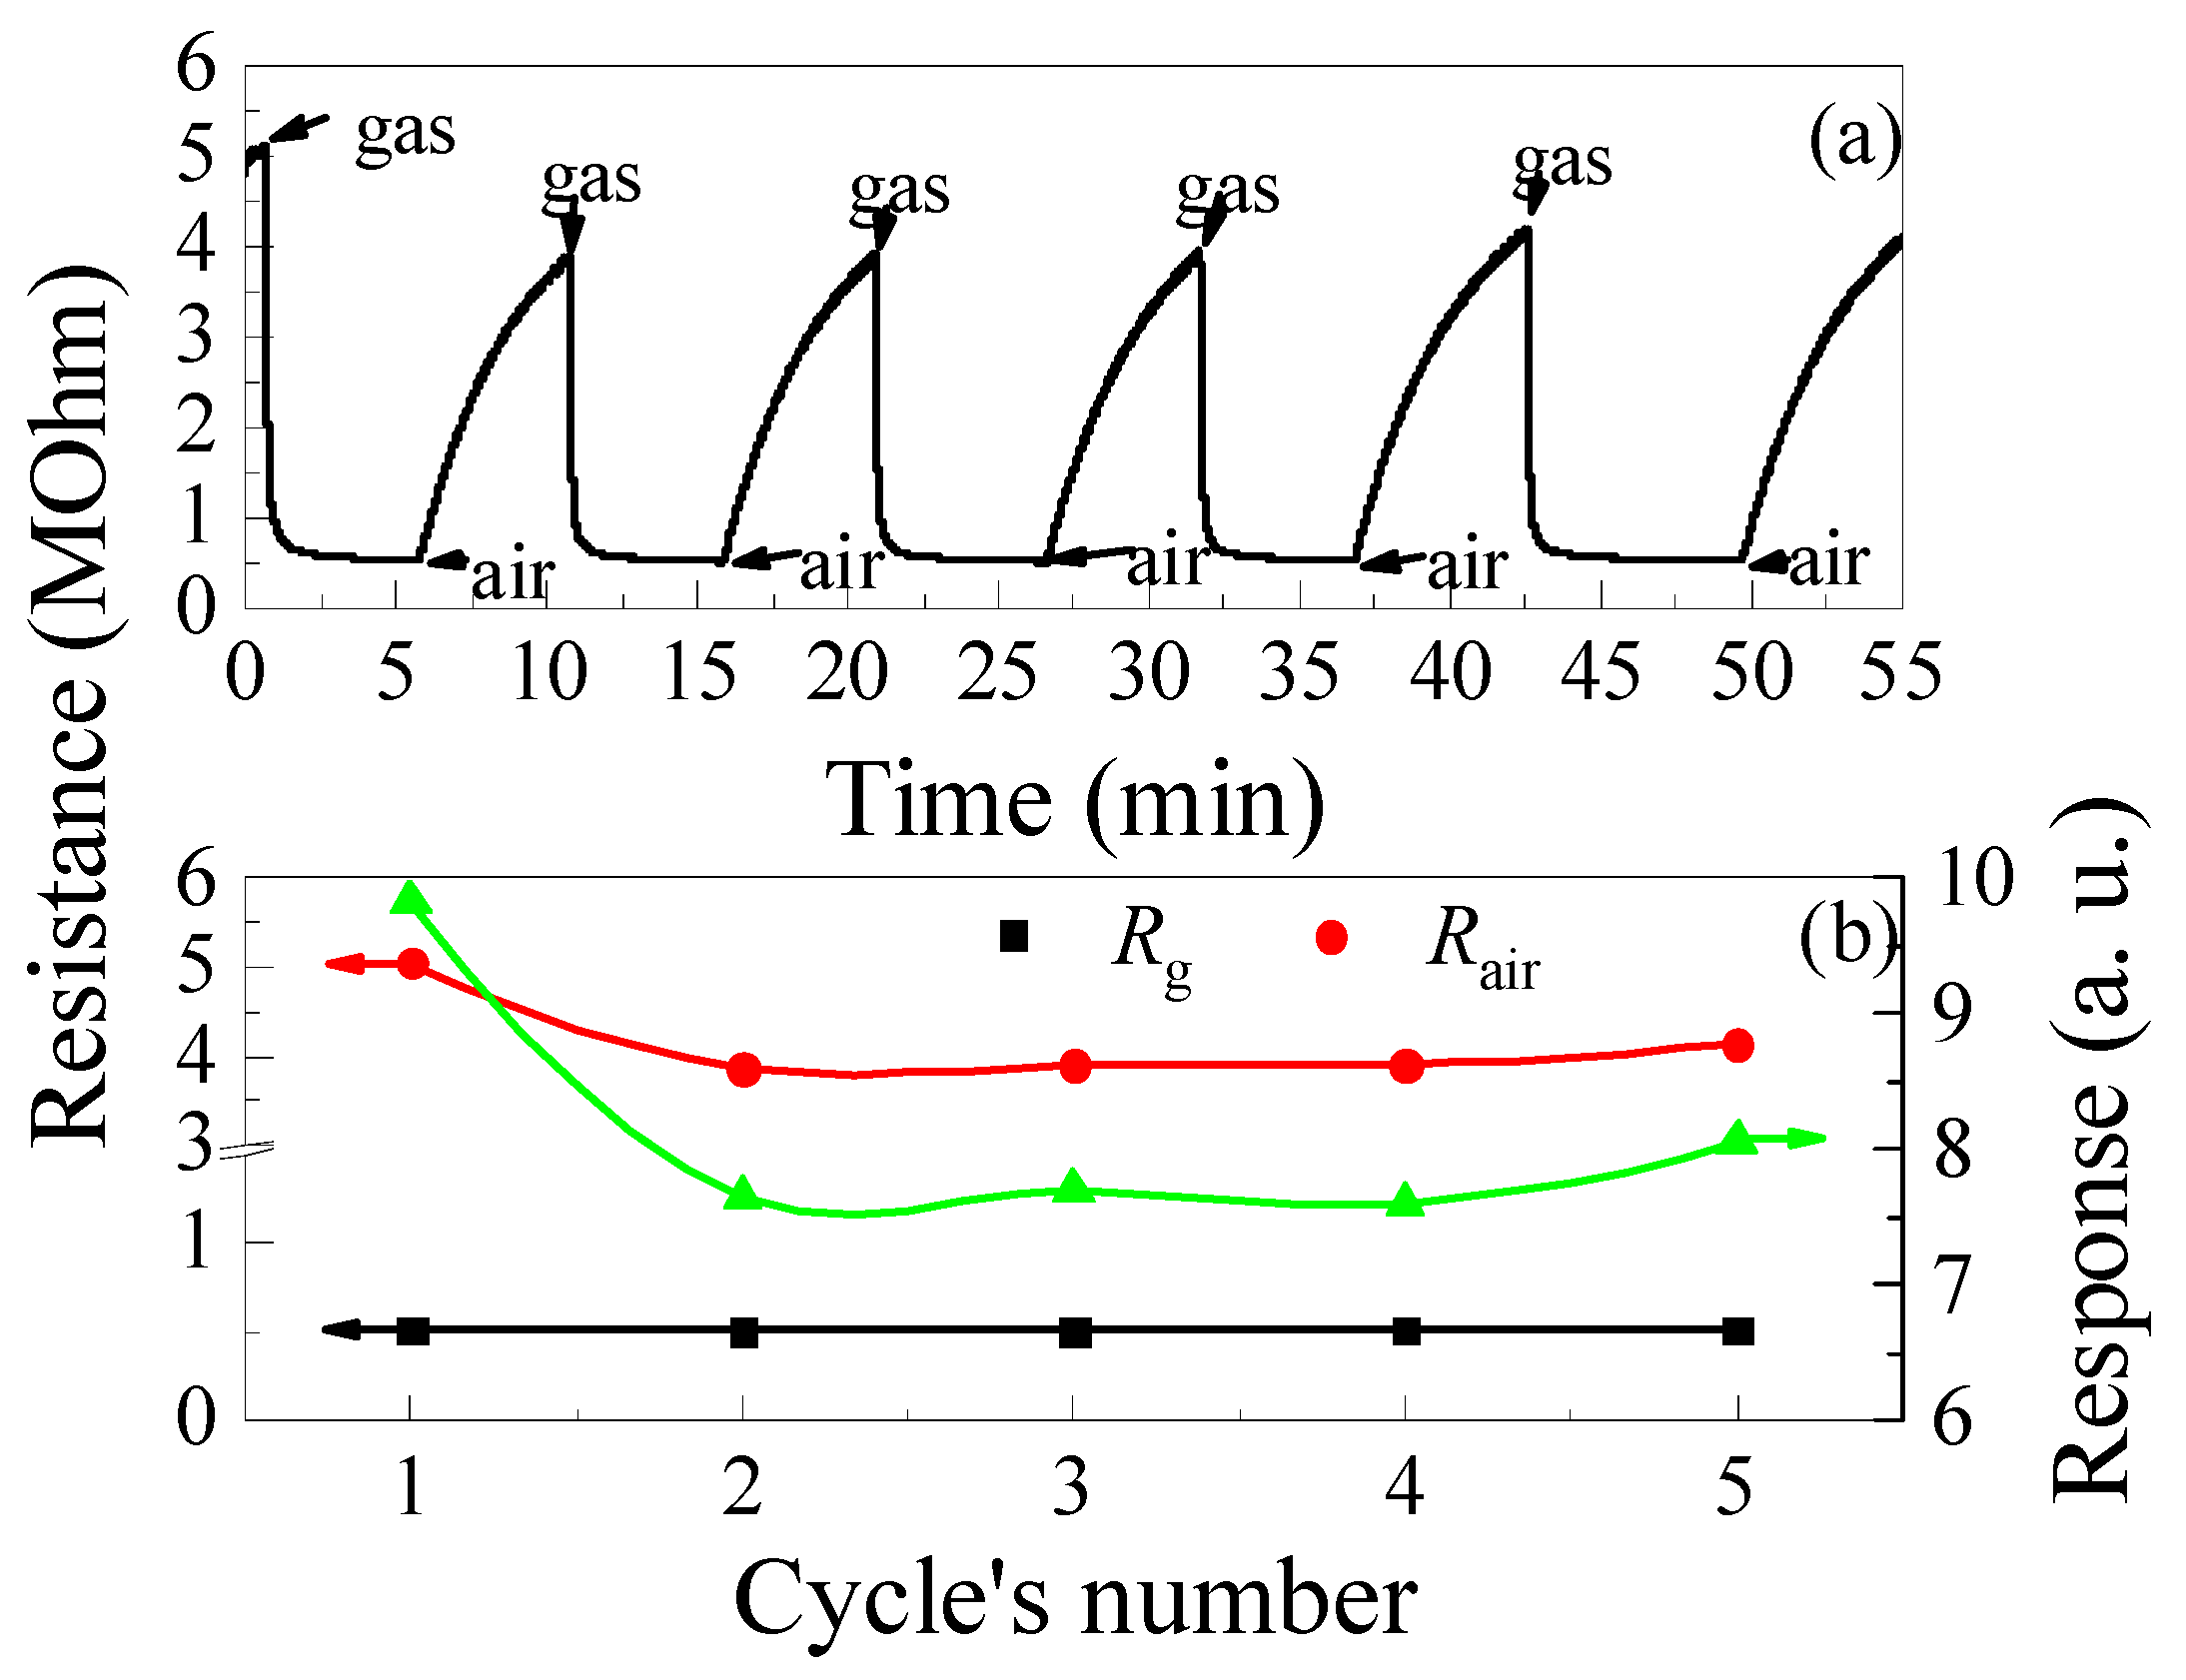
The time dependences of the resistance of the ZGO+Er samples at T = 650 °C and the cyclic exposure to 2000 ppm of CH4, illustrated in Figure 11a, were used to evaluate the speed-performance and stability of gas-sensitive characteristics in short-term tests. The tres of the samples at the first gas exposure was 90 s. For 5 min after gas exposure, the resistance of the specimens did not recover to the Rair level. Probably, such long response and recovery times of the specimens are due to the large active surface (Figure 4 and Figure 5). The sections of the samples’ resistance decrease under CH4 exposure and of resistance growth after CH4 exposure are approximated by the following exponential functions, respectively:
where Rgst is the steady-state value of the sample resistance in the gas mixture of pure dry air + 2000 ppm of CH4; Rairst is the steady-state value of the sample resistance in pure dry air; A and B are constants; τ1 and τ2 are time constants. For the second cycle of gas exposure, τ1 = 9 s and τ2 = 197 s. τ1 << τ2 is satisfied under exposure to CH4 at all operating temperatures and ng.
R(t) = Rgst + A × exp(−t/τ1),
R(t) = Rairst − B × exp(−t/τ2),
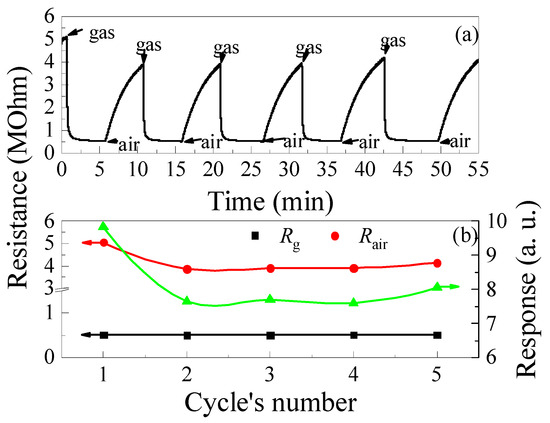
Figure 11.
Time dependence of the ZGO+Er samples resistance at T = 650 °C and cyclic exposure to 2000 ppm of CH4—(a); Variations of the base resistance, resistance in the gas mixture of pure dry air + 2000 ppm of CH4 and response to 2000 ppm of CH4 under cyclic gas exposure—(b).
After the first cycle of CH4 exposure, the response of the samples drops by a factor of 1.28, mainly due to the decrease in Rair caused by the prolonged recovery of the sample’s resistance (see Figure 11b). It is worth noting that Rg under the above conditions is practically unchanged and varies in the range of (5.06–5.14) × 105 Ohm.
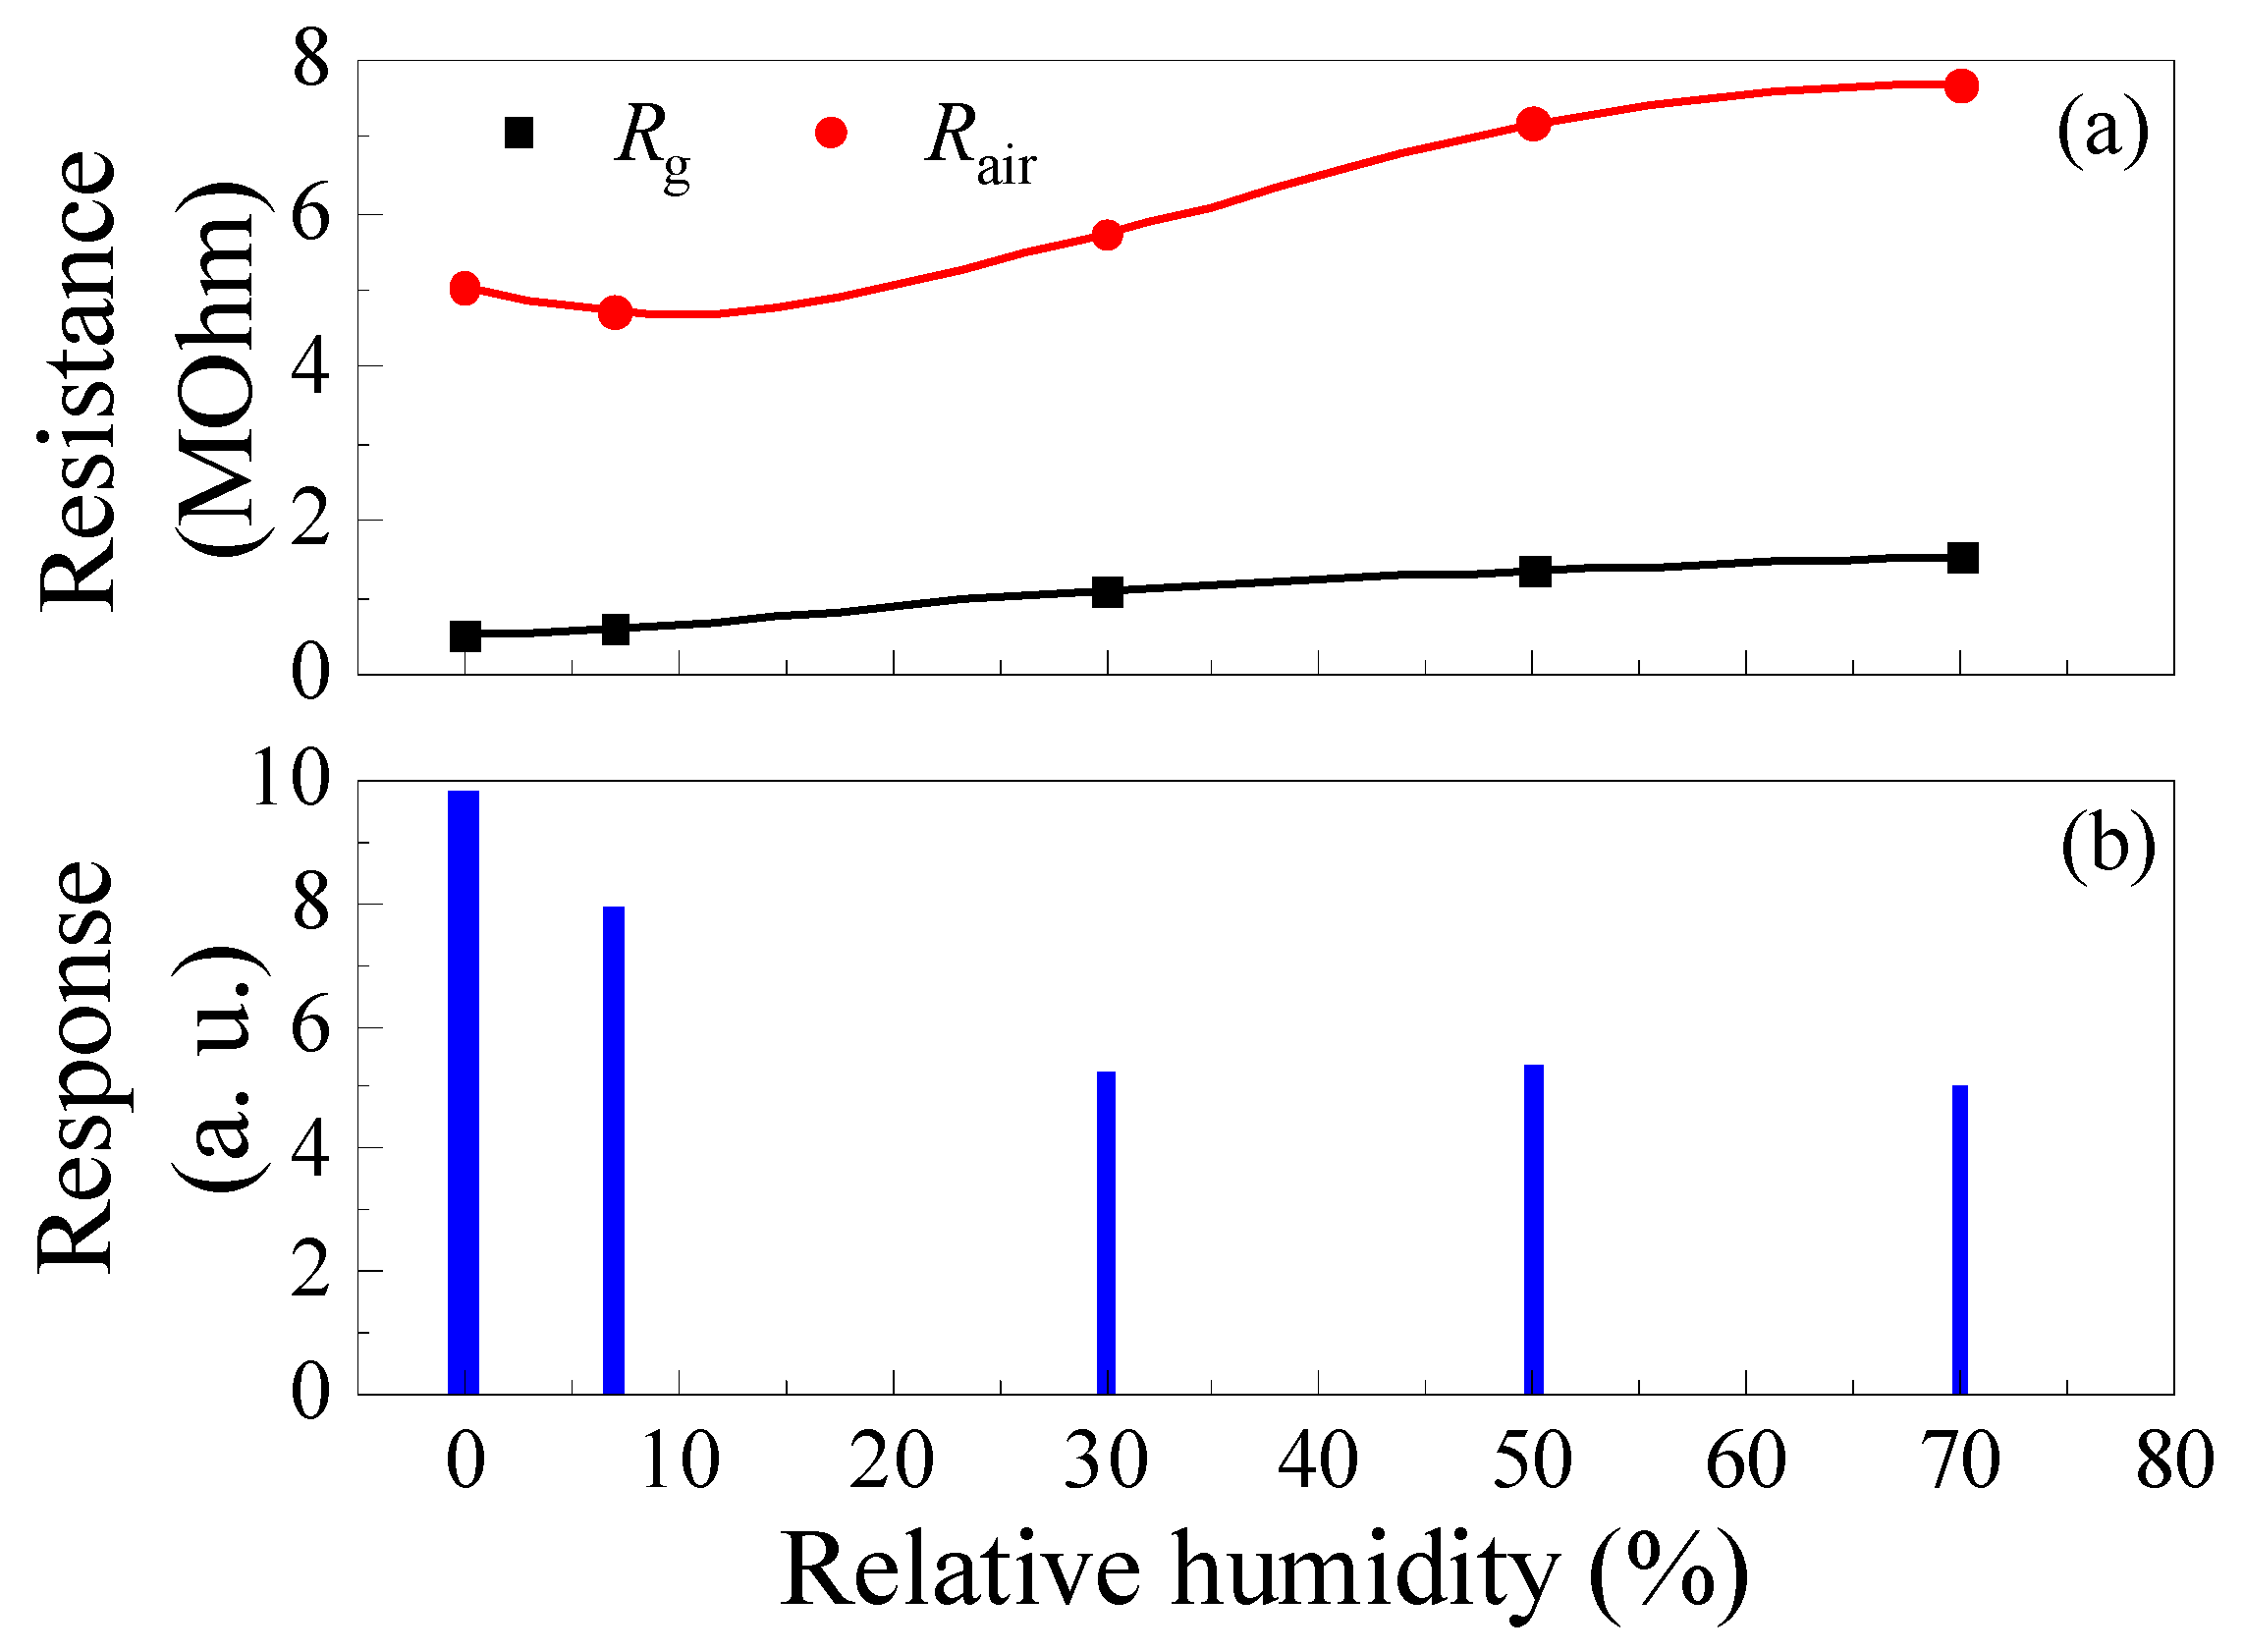
Increasing the humidity of the gas–air mixture leads to a decrease in the sample’s response to CH4, as exhibited in Figure 12. The response of samples decreases significantly by 46% when the RH increases from 0 to 30% (Figure 12b). Increasing the RH from 0 to 30% results in an increase in Rg by a factor of about 2.13, while Rair increases by only a factor of 1.14 (Figure 12a). The decrease in the response to CH4 with increasing RH is due to the large-scale increase in Rg. It is worth noting that, in the range of RH = 30–70%, the response to CH4 is practically independent of humidity.
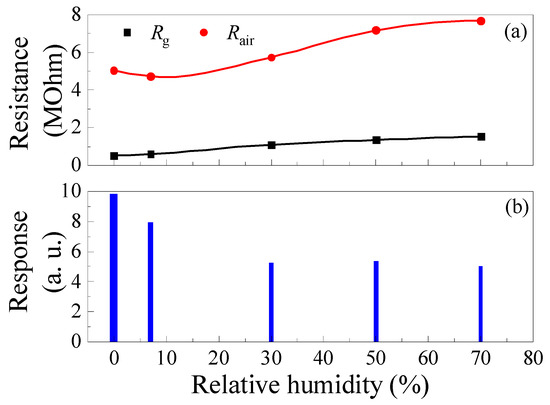
Figure 12.
Effect of humidity on ZGO+Er samples’ base resistance, resistance in the gas mixture of pure dry air + 2000 ppm of CH4 (a) and response to 2000 ppm CH4 (b) at T = 650 °C.
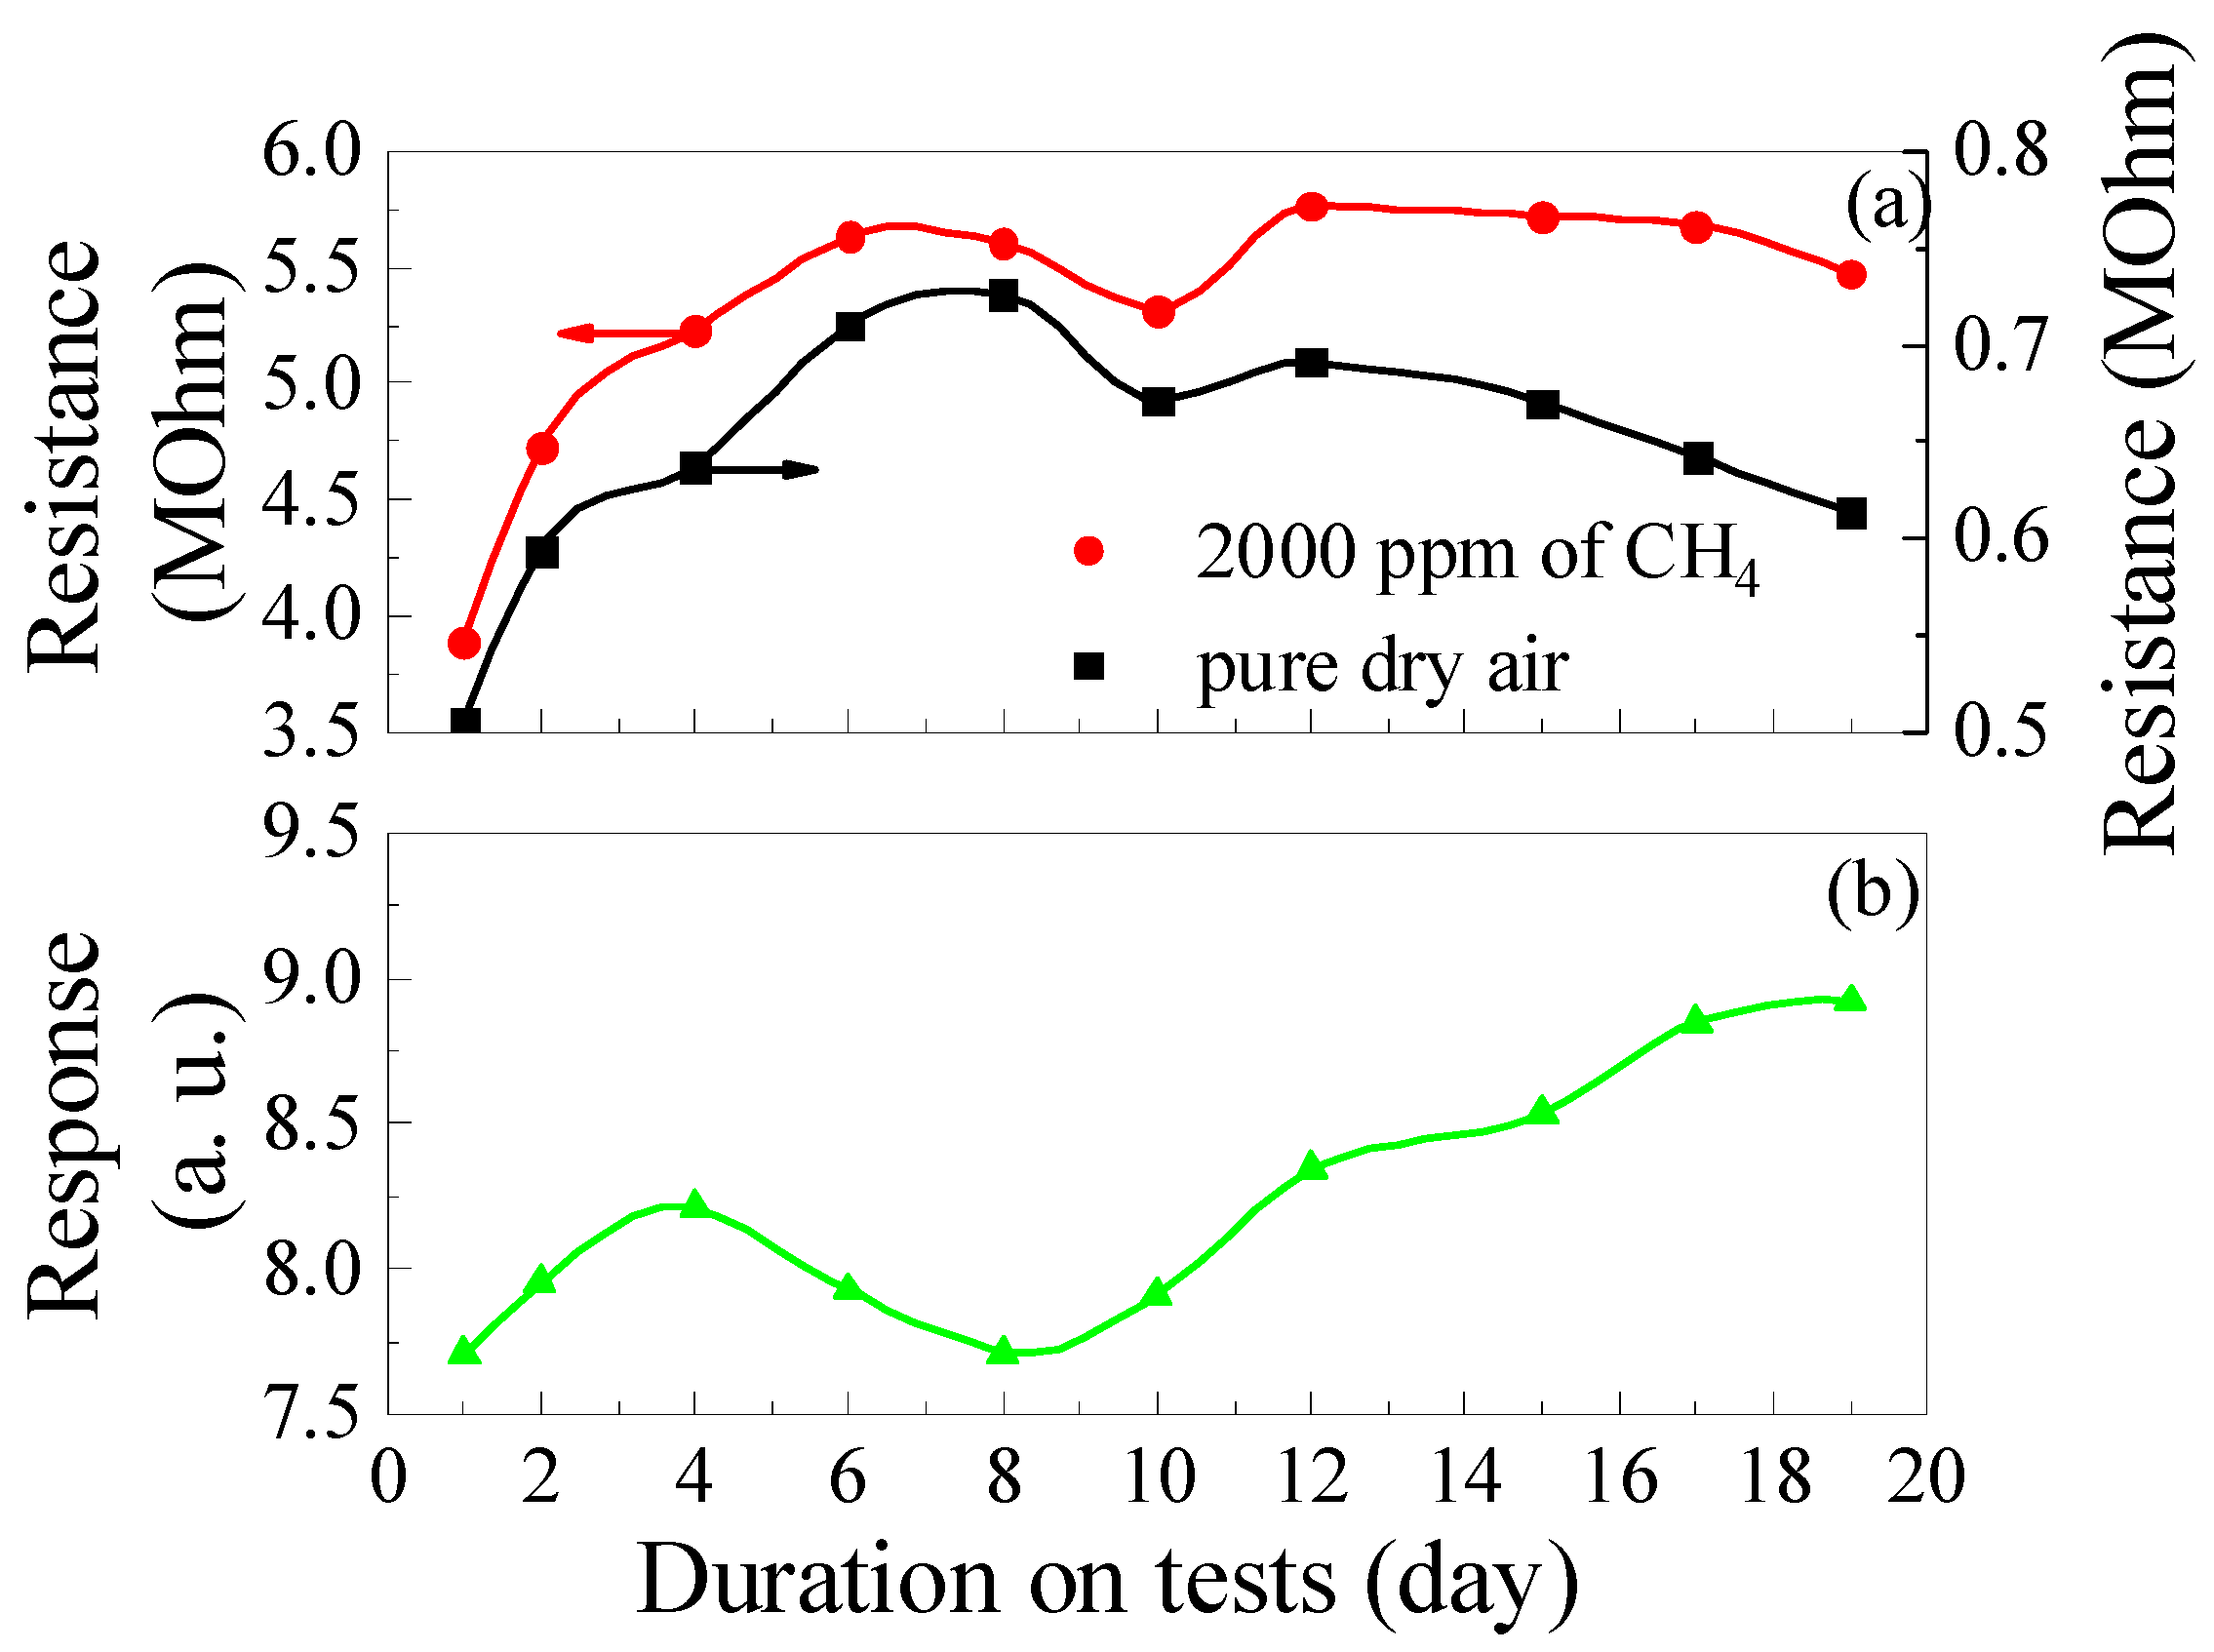
The results of long-term studies of changes in the gas-sensitive characteristics of the samples for 19 days are depicted in Figure 13. Obviously, there is a tendency for Rg, Rair, and S to increase with the duration of the tests. The samples were stored in hermetically sealed packaging at RT between measurements, and for the long-term tests, as-prepared fresh samples were used, which had not been previously heated to high temperatures and exposed to gases. During 19 days of tests, the Rg, Rair, and response to 2000 ppm of CH4 for ZGO+Er samples increased by 1.2, 1.4, and 1.26 times, respectively. At the same time, non-symbatic changes in Rg and Rair were observed from test to test, which was reflected in the non-monotonic variation of response values with test duration. The response value achieved on the 19th day of testing for the as-prepared samples is comparable to the response values for aged samples tested under heating to different temperatures and exposure to different gases (see Figure 8, Figure 9, Figure 10, Figure 11 and Figure 12).

Figure 13.
Long-term test results: Changes in the ZGO+Er samples base resistance and resistance in the gas mixture pure dry air + 2000 ppm of CH4 (a); Changes in the ZGO+Er samples’ response to 2000 ppm of CH4 (b) at T = 650 °C.
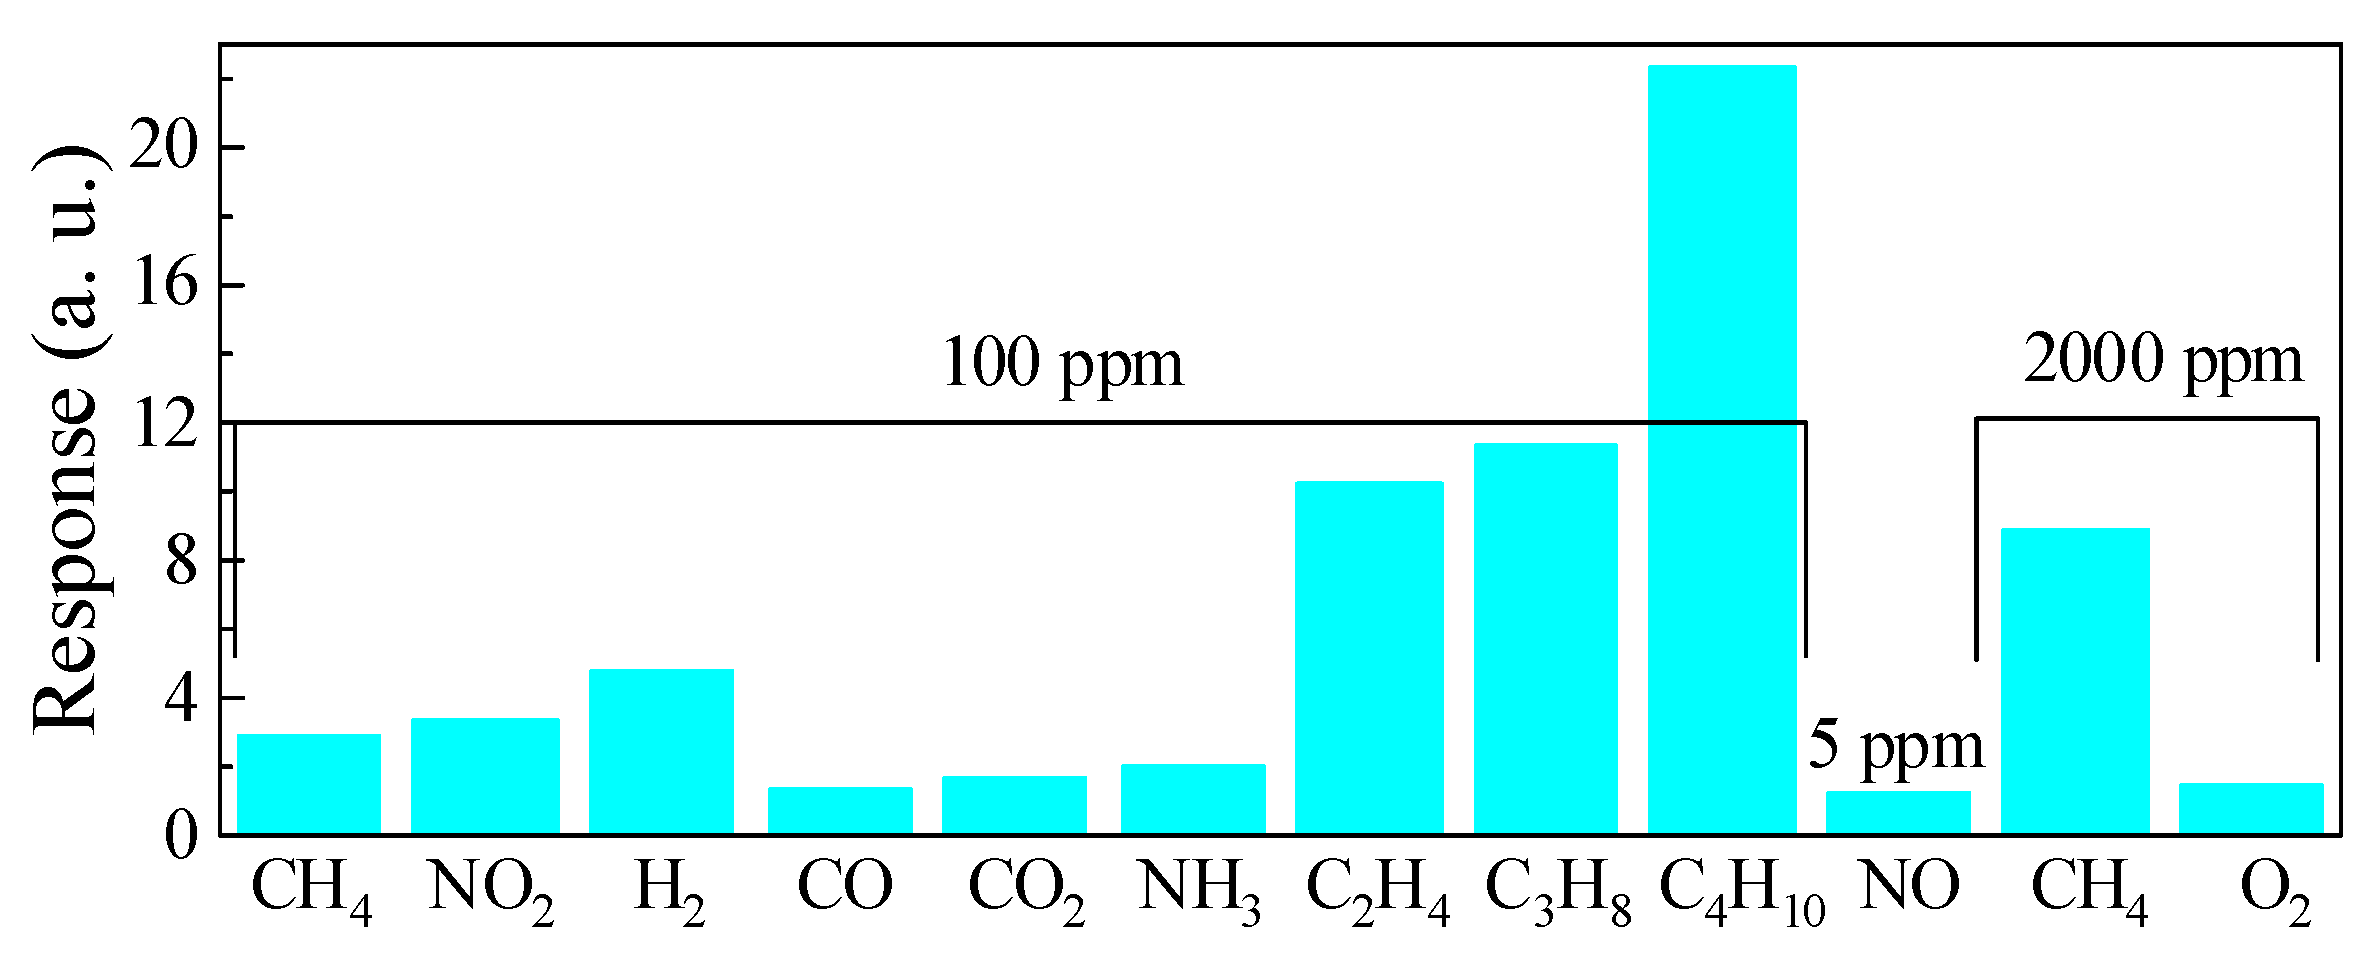
The results of the selectivity evaluation for the ZGO+Er samples at T = 650 °C are shown in Figure 14. The resistance of the samples dropped under exposure to H2, CO, CO2, NH3, and hydrocarbons, while the resistance of the samples increased under exposure to NO2 and O2. The ratios of the ZGO+Er samples’ responses to other gases and CH4 at same gas concentration of 100 ppm are presented in Table 4. As can be seen, the responses to NO2, H2, and hydrocarbons outperform those to CH4. The samples showed a particularly high response when exposed to hydrocarbons (C2H4, C3H8 and C4H10). A noticeable response to NH3 was also obtained. For the remaining gases CO, CO2, and O2, the responses were low. The response to 5 ppm of NO was 1.22 a.u.
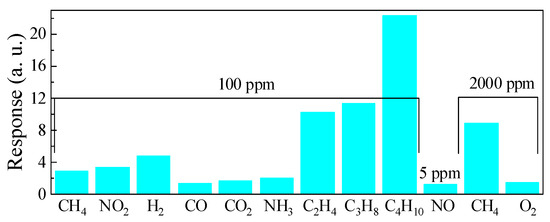
Figure 14.
Comparison of the ZGO+Er samples responses to different gases at T = 650 °C.
Table 4.
Ratios of the ZGO+Er samples responses to 100 ppm CH4 and other gases.
4. Discussion
ZGO+Er samples do not exhibit exceptional selectivity to CH4 in contrast to the ZnGa2O4-based samples presented in Refs. [11,12,22,37,38,39,40,41], where exceptionally high responses to NOx or LPG were obtained. It is worth noting that the samples are more sensitive to NO2 and LPG components (C3H8 and C4H10) (see Figure 14 and Table 4). Exceptional selectivity is not characteristic for MOS gas sensors [65]. Generally, these materials show sensitivity to many gases, but to varying degrees depending on many factors such as temperature, humidity, etc. [65]. This is due to the sensing effect of MOSs. In the air atmosphere, oxygen chemisorbs on the surface of semiconductors capturing electrons. This process for n-type semiconductors leads to the appearance of the layer depleted of electrons at the pre-surface region and the energy bands bending upward. When CH4 appears, there is an interaction between its molecules and oxygen ions chemisorbed on the semiconductor surface, leading to a decrease in the surface density of the latter and the return of electrons to the semiconductor.
For polycrystalline semiconductors with large microcrystals, as in our case, the conditions at the microcrystal boundary influence the charge carrier transport [58]. For such semiconductors, the resistance in the air is described by the following formula [66]:
where R0 is a value determined by the geometric and electrophysical parameters of the sample; eφs is the energy bands bending at the microcrystal boundary; e is the electron charge; φs is the surface potential in air; and k is the Boltzmann constant. R0 weakly depends on changes in the atmospheric composition. eφs~Ni2/Nd and Ni~noxl, where Ni is the surface density of chemisorbed oxygen ions; Nd is the donor concentration; nox is the oxygen concentration; l < 1 [66,67]. nox = const and Ni changes in pure dry air are due to changes in sample temperature and ambient humidity under experimental conditions [66,67]. For binary MOSs, analysis of data [68] obtained by electron paramagnetic resonance spectroscopy and temperature programmed desorption, as well as extensive first-principles analysis [69], indicates that oxygen is chemisorbed in the form of O2− at high temperatures. Based on these findings, we believe that a similar situation exists for the studied samples. The interaction of CH4 and O2− molecules may occur in two stages at T = 650 °C [58,59]:
At the first stage, the dissociative adsorption of CH4 molecules occurs with the appearance of CH3 + H fragments on the semiconductor surface, which interact with O2− ions to form CO2, H2O molecules and free electrons, which are returned to the semiconductor. As a result of reaction (6), Ni is reversibly reduced, leading to a decrease in eφs and the resistance of the semiconductor. The reaction products of CO2 and H2O are desorbed from the semiconductor surface.
Rair = R0 × exp[(eφs/(kTK)],
CH4 → CH3 + H,
CH3 + H + 4O2− → CO2 + 2H2O + 8e−.
Doping ZnGa2O4 with Er leads to lattice expansion, crystallite growth, and the formation of high-electron-density microcrystals. This is primarily due to the substitution of Ga3+ (0.62 Å) and Zn2+ (0.60 Å) with the larger Er3+ ion (0.89 Å), increasing the unit cell parameter from 8.3279 Å to 8.3331 Å and its volume from 577.568 Å3 to 578.66 Å3. The process induces point defects, such as oxygen vacancies, which further expand the lattice and slightly increase strain from 0.066% to 0.068%. Phase composition changes as β-Ga2O3 (19.3%) is replaced by Er3Ga5O12 (8.2%), indicating gallium redistribution. The crystallite size of ZnGa2O4 grows from 64.8 nm to 106.8 nm, facilitated by Er3+ promoting grain growth and reducing structural defects. The newly formed Er3Ga5O12 phase has a large unit cell (12.258 Å, 1841.8 Å3) and contributes to increased electron density. These structural modifications enhance optical and electronic properties, making Er-doped ZnGa2O4 promising for luminescent and optoelectronic applications.
According to the results of SEM and AFM (Figure 4 and Figure 5), the addition of Er leads to the formation of a larger active surface, represented by two types of microcrystals with characteristic sizes of 1–7 µm and 0.5–4 µm, respectively. At the same time, the base resistance of the samples (Figure 8) (resistance in pure air) decreases only by a factor of 2.0–2.6, and the response of the samples to CH4 increases by a factor of 11.1 (Figure 9). The gas-sensing, electrical-conductivity, and other properties of Er3Ga5O12 remain unexplored. Therefore, the proposal of a mechanism for increasing the response to gas based on the formation of a new phase of Er3Ga5O12 is not justified. It has been shown that Er3Ga5O12 demonstrates unique magnetic [70] and phosphor [71] properties, and is also used as a catalyst support for the Ni catalyst for CH4 decomposition at T = 650 °C [72]. It is noted that Er3Ga5O12 provides the most intense CH4 decomposition. The temperature of use of the Ni/Er3Ga5O12 catalyst coincides with the temperature of the maximum response of ZGO+Er to CH4. However, the results of our research only allow us to conclude that the increase in the ZnGa2O4 response with Er addition is due to an increase in the material’s active surface area (Figure 4 and Figure 5). This, in turn, contributes to an increase in the surface density of adsorption centers for O2−, which leads to an increase in the response to reducing gases [66]. A similar case was observed when Er was added to SnO2 [56,73].
The temperature dependence of the response of MOS sensors (Figure 9) is determined by the processes that take place on the surface of the semiconductor and in the near-surface region of the semiconductor [74]. These processes are usually of an activation nature. Such processes are the physical adsorption and chemisorption of oxygen molecules, dissociative chemisorption of oxygen molecules, oxygen desorption, dissociative adsorption of methane molecules, desorption of interaction products of chemisorbed oxygen, and fragments of methane molecules, etc. Models have been developed to account for these processes, which are in agreement with experimental results [75]. In our case, the monotonous increase in response with increasing temperature can be explained by an increase in the surface density of O2− and an intensification of the dissociation of CH4 molecules, facilitated by an additive containing Er.
An increase in the base resistance of n-type MOSs is not typical when humidity increases. During chemisorption at high temperatures, water molecules exhibit reducing gas properties and the effect should be reversed [67]. Further research is needed to explain the dependence of Rair on RH. An increase in Rg with an increase in RH can be explained by H2O and CH4 molecules competing for adsorption centers Sa. In an atmosphere of moist pure air, the following reaction takes place [76]:
H2O + O2− + Sa → 2(Sa–OH) + 2e−.
According to reaction (7), the semiconductor surface is poisoned by OH-groups, leading to a decrease in the surface density of Sa and Ni. As RH increases, fewer CH4 molecules are chemisorbed onto the semiconductor surface, while Rg increases and S decreases.
To minimize the impact of humidity on the gas-sensitive properties of the samples, it is sensible to use the ultrathin films of materials that can absorb H2O molecules and are deposited on the surface of the sensitive layer. One such material is SiO2 [76]. It is worth noting that this material can withstand high-temperature operating conditions, which is important for developing appropriate high-temperature gas sensors [77]. To further reduce the effect of humidity, operating modes involving the modulation of the operating temperature and/or exposure to ultraviolet radiation are advisable [78].
According to refs. [66,67], S ~exp(eφs). The mechanisms of the gas-sensitive characteristic drift of MOSs gas sensors are considered in ref. [79]. Operating sensors at high temperatures and under the exposure to CH4 over a long period can cause structural transformations, changes in microcrystal size, and the poisoning of the sample surface. As a result of these processes, Ni can change. Other processes, such as phase transformations, the formation of electrically active defects, and bulk diffusion, primarily result in a change in Nd. According to our results (Figure 13), an increase in base resistance and response to CH4 indicates an increase in the Ni2/Nd over the duration of the tests. We believe that, as the test duration increases further, the characteristics will continue to stabilize, as is typical for MOSs gas sensors [79].
The authors are not aware of any publications devoted to the research and development of CH4 sensors based on ZnGa2O4. To date, CH4 sensors based on binary metal-oxide films and nanostructures (SnO2, ZnO and TiO2, primary) have been researched and developed [58,59,60,61,62]. The achieved response to CH4 for ZGO+Er samples exceed the response for most sensors based on the binary MOSs presented. However, ZGO+Er samples are characterized by a high operating temperature, which, on the one hand, can lead to an increase in the power consumption of sensors, and on the other hand—the ability of sensors to function at elevated temperatures is of interest for a number of practical applications where the majority of the binary MOSs are not able to function reliably. High-temperature CH4 sensors are of interest for the development of systems based on them for the monitoring and control of combustion processes, and for determining the ideal fuel/air mixture [3]. With this in mind, it is reasonable to compare the gas-sensitive characteristics of CH4 sensors based on MOSs capable of functioning in the high-temperature region corresponding to the range of T = 600–1000 °C. In addition, high operating temperatures ensure high sensor speed performance [80], low base resistance, and surface regeneration [79]. Table 5 shows a comparison of the gas-sensitive characteristics of high-temperature CH4 sensors based on MOSs. The responses of ZGO+Er samples to equal CH4 concentrations are significantly higher than those of thin Ga2O3 films with the addition of 0.1 at.% of SnO2 and thick LaFe0.95W0.05O3 films. In Ref. [6], sensors based on polycrystalline Ga2O3 thin films with responses exceeding those of ZGO+Er were presented. However, such high responses were obtained at a higher T, at which we did not measure the characteristics of ZGO+Er samples due to the manifestation of characteristic drift. In addition, the authors explain the high responses for CH4 by the partial combustion of the gas with the formation of ionized oxygen defects [6].
Table 5.
Gas-sensitive characteristics of high-temperature CH4 sensors based on MOSs.
5. Conclusions
Pure ZnGa2O4 and ZnGa2O4 with Er addition ceramic pellets were synthesized. For the first time, the gas sensitivity of ZnGa2O4 with Er addition ceramic pellets has been studied. The addition of Er leads to the formation of the Er3Ga5O12 phase in the ZnGa2O4 host, more importantly to the formation of a larger active surface and allows an 11.1-fold increase in the response of ZnGa2O4 to CH4. The samples were characterized by a wide dynamic range of CH4 concentrations, 100–20,000 ppm, the weak dependence of gas-sensitive characteristics on relative humidity in the range of 30–70%, the weak changes of gas-sensitive characteristics under cyclic gas exposure, and the stabilization of characteristics for long-term tests. They also exhibited high responses to C2H4, C3H8, C4H10, NO2, and H2. A possible mechanism of the sensing effect of ZnGa2O4 with Er addition was proposed. It was suggested that the increase in gas responses with Er addition is due to the formation of a larger active surface. Therefore, ZnGa2O4 with Er addition is very prospective for the development of high-temperature hydrocarbon sensors for systems monitoring and controlling combustion processes and for determination of the ideal fuel/air mixture. Our future work will focus on optimizing the gas-sensitive properties of high-temperature hydrocarbons sensors based on ZnGa2O4 with Er addition ceramic pellets with the aim of increasing their gas sensitivity, decreasing the effect of on relative humidity in the range of 0–30%, and improving their selectivity under extreme operating conditions.
Author Contributions
Conceptualization, A.V.A., Z.T.K., G.A.A.-A. and A.M.Z.; Data curation, A.B.K., N.N.Y., O.I.K. and G.A.A.-A.; Formal analysis, A.V.A., Z.T.K., A.B.K., N.N.Y., O.I.K., G.A.A.-A., K.K.K., L.A.M. and A.I.P.; Funding acquisition, A.V.A.; Investigation, Z.T.K., N.N.Y., O.I.K., A.O.K., G.A.A.-A., K.K.K., A.M.Z., E.A.S., P.M.K., A.V.K. and A.I.P.; Methodology, A.V.A., A.M.Z., L.A.M. and A.I.P.; Project administration, A.V.A., Z.T.K. and E.V.Z.; Resources, Z.T.K., A.O.K., E.V.Z. and E.A.S.; Software, K.K.K., L.A.M. and E.A.S.; Supervision, Z.T.K., N.N.Y. and G.A.A.-A.; Validation, A.B.K. and K.K.K.; Visualization, A.O.K. and A.I.P.; Writing—Original Draft Preparation, A.V.A., Z.T.K. and P.M.K.; Writing—Review and Editing, A.V.A. and A.B.K. All authors have read and agreed to the published version of the manuscript.
Funding
A.V. Almaev, N.N. Yakovlev, and A.O. Korchemagin acknowledge the support of the Russian Science Foundation, grant number 20-79-10043 P.G.A. Akmetova-Abdik and Z.T. Karipbayev acknowledge that this research was funded by the Science Committee of the Ministry of Education and Science of the Republic of Kazakhstan (Grant No. AP22686149). In addition, Anatoli Popov was supported by Latvian research project lzp-2023/1–0453 “Prediction of long-term stability of functional materials under extreme radiation conditions”. A.V. Koroleva and E.V. Zhizhin acknowledge Saint-Petersburg State University for a research project AAAA-A19-119082790069-6.
Institutional Review Board Statement
Not applicable.
Informed Consent Statement
Not applicable.
Data Availability Statement
The raw data supporting the conclusions of this article will be made available by the authors upon request.
Acknowledgments
We thank Evgeny Moskvichev for the FESEM investigation.
Conflicts of Interest
Author Aleksei V. Almaev was employed by the company Fokon LLC. The remaining authors declare that the research was conducted in the absence of any commercial or financial relationships that could be construed as a potential conflict of interest.
References
- Aldhafeeri, T.; Tran, M.K.; Vrolyk, R.; Pope, M.; Fowler, M. A Review of Methane Gas Detection Sensors: Recent Developments and Future Perspectives. Inventions 2020, 5, 28. [Google Scholar] [CrossRef]
- Gautam, Y.K.; Sharma, K.; Tyagi, S.; Ambedkar, A.K.; Chaudhary, M.; Pal Singh, B. Nanostructured metal oxide semiconductor-based sensors for greenhouse gas detection: Progress and challenges. R. Soc. Open Sci. 2021, 8, 201324. [Google Scholar] [CrossRef] [PubMed]
- Liu, Y.; Parisi, J.; Sun, X.; Lei, Y. Solid-state gas sensors for high temperature applications—A review. J. Mater. Chem. A 2014, 2, 9919–9943. [Google Scholar] [CrossRef]
- Ghosh, A.; Zhang, C.; Shi, S.Q.; Zhang, H. High-Temperature Gas Sensors for Harsh Environment Applications: A Review. Clean—Soil Air Water 2019, 47, 1800491. [Google Scholar] [CrossRef]
- Wu, H.; Zhong, S.; Bin, Y.; Jiang, X.; Cui, H. Ni-decorated WS2-WSe2 heterostructure as a novel sensing candidate upon C2H2 and C2H4 in oil-filled transformers: A first-principles investigation. Mol. Phys. 2025, e2492391. [Google Scholar] [CrossRef]
- Fleischer, M.; Meixner, H. A Selective CH4 Sensor Using Semiconducting Ga2O3 Thin Films Based on Temperature Switching of Multigas Reactions. Sens. Actuators B Chem. 1995, 25, 544–547. [Google Scholar] [CrossRef]
- Frank, J.; Fleischer, M.; Meixner, H.; Feltz, A. Enhancement of Sensitivity and Conductivity of Semiconducting Ga2O3 Gas Sensors by Doping with SnO2. Sens. Actuators B Chem. 1998, 49, 110–114. [Google Scholar] [CrossRef]
- Moseley, P.T.; Oprea, A.; Merdrignac-Conanec, O.; Kerlau, M.; Bârsan, N.; Weimar, U. Limitations on the Use of Perovskite-Structure Oxides in Gas Sensing as a Result of the Concurrent Operation of Separate Mechanisms. Sens. Actuators B Chem. 2008, 133, 543–546. [Google Scholar] [CrossRef]
- Chikoidze, E.; Sartel, C.; Madaci, I.; Mohamed, H.; Vilar, C.; Ballesteros, B.; Belarre, F.; Corro, E.; Vales-Castro, P.; Sauthier, G.; et al. p-Type Ultrawide-Band-Gap Spinel ZnGa2O4: New Perspectives for Energy Electronics. Cryst. Growth Des. 2020, 20, 2535–2546. [Google Scholar] [CrossRef]
- Byun, H.J.; Kim, J.U.; Yang, H. Blue, Green, and Red Emission from Undoped and Doped ZnGa2O4 Colloidal Nanocrystals. Nanotechnology 2009, 20, 495602. [Google Scholar] [CrossRef]
- Wu, M.R.; Li, W.Z.; Tung, C.Y.; Huang, C.Y.; Chiang, Y.H.; Liu, P.L.; Horng, R.H. NO Gas Sensor Based on ZnGa2O4 Epilayer Grown by Metalorganic Chemical Vapor Deposition. Sci. Rep. 2019, 9, 7459. [Google Scholar] [CrossRef] [PubMed]
- Chen, C.; Li, G.; Liu, Y. Synthesis of ZnGa2O4 Assisted by High-Energy Ball Milling and Its Gas-Sensing Characteristics. Powder Technol. 2015, 281, 7–11. [Google Scholar] [CrossRef]
- Mushtaq, U.; Ayoub, I.; Yagoub, M.Y.A.; Shivaramu, N.J.; Coetsee, E.; Swart, H.C.; Kumar, V. Effect of Li+ monovalent ion on the structural and optical properties of Dy3+ doped ZnGa2O4 phosphor. Appl. Phys. A 2024, 130, 494. [Google Scholar] [CrossRef]
- Wang, B.; Wang, H.; Tu, B.; Zheng, K.; Gu, H.; Wang, W.; Fu, Z. Optical transmission, dispersion, and transition behavior of ZnGa2O4 transparent ceramic. J. Am. Ceram. Soc. 2023, 106, 1230–1239. [Google Scholar] [CrossRef]
- Kawazoe, H.; Ueda, K. Transparent Conducting Oxides Based on the Spinel Structure. J. Am. Ceram. Soc. 1999, 82, 3330–3336. [Google Scholar] [CrossRef]
- Safeera, T.A.; Khanal, R.; Medvedeva, J.E.; Martinez, A.I.; Vinitha, G.; Anila, E.I. Low Temperature Synthesis and Characterization of Zinc Gallate Quantum Dots for Optoelectronic Applications. J. Alloys Compd. 2018, 740, 567–573. [Google Scholar] [CrossRef]
- Reshmi, R.; Krishna, K.M.; Manoj, R.; Jayaraj, M.K. Pulsed Laser Deposition of ZnGa2O4 Phosphor Films. Surf. Coat. Technol. 2005, 198, 345–349. [Google Scholar] [CrossRef]
- Han, D.; Liu, K.; Hou, Q.; Chen, X.; Yang, J.; Li, B.; Zhang, Z.; Liu, L.; Shen, D. Self-Powered Solar-Blind ZnGa2O4 UV Photodetector with Ultra-Fast Response Speed. Sens. Actuators A Phys. 2020, 315, 112354. [Google Scholar] [CrossRef]
- Lin, W.; Zhang, D.; Liu, S.; Li, Y.; Zheng, W.; Huang, F. ZnGa2O4 Deep-Ultraviolet Photodetector Based on Si Substrate. Mater. Lett. 2021, 283, 128805. [Google Scholar] [CrossRef]
- Cheng, L.C.; Huang, C.Y.; Horng, R.H. Thickness Effect on Operational Modes of ZnGa2O4 MOSFETs. IEEE J. Electron Devices Soc. 2018, 6, 432–437. [Google Scholar] [CrossRef]
- Shen, Y.S.; Wang, W.K.; Horng, R.H. Characterizations of Metal-Oxide-Semiconductor Field-Effect Transistors of ZnGaO Grown on Sapphire Substrate. IEEE J. Electron Devices Soc. 2017, 5, 112–116. [Google Scholar] [CrossRef]
- An, S.; Park, S.; Ko, H.; Jin, C.; Lee, C. NO₂ Gas Sensing Properties of Multiple Networked ZnGa2O4 Nanorods Coated with TiO2. J. Nanosci. Nanotechnol. 2015, 15, 433–438. [Google Scholar] [CrossRef] [PubMed]
- Pathania, A.; Dhanda, N.; Verma, R.; Sun, A.C.A.; Thakur, P.; Thakur, A. Review—Metal Oxide Chemoresistive Gas Sensing Mechanism, Parameters, and Applications. ECS Sens. Plus 2024, 3, 013401. [Google Scholar] [CrossRef]
- Bulowski, W.; Knura, R.; Socha, R.P.; Basiura, M.; Skibińska, K.; Wojnicki, M. Thin Film Semiconductor Metal Oxide Oxygen Sensors: Limitations, Challenges, and Future Progress. Electronics 2024, 13, 3409. [Google Scholar] [CrossRef]
- Zhai, H.; Wu, Z.; Fang, Z. Recent Progress of Ga2O3-Based Gas Sensors. Ceram. Int. 2022, 48, 24213–24233. [Google Scholar] [CrossRef]
- Almaev, A.V.; Yakovlev, N.N.; Erzakova, N.N.; Mochalov, L.A.; Kudryashov, M.A.; Kudryashova, Y.P.; Nesov, S.N. Gas Sensitivity of PECVD β-Ga2O3 Films with Large Active Surface. Mater. Chem. Phys. 2024, 320, 129430. [Google Scholar] [CrossRef]
- Almaev, A.V.; Yakovlev, N.N.; Verkholetov, M.G.; Rudakov, G.A.; Litvinova, K.I. High Oxygen Sensitivity of TiO2 Thin Films Deposited by ALD. Micromachines 2023, 14, 1875. [Google Scholar] [CrossRef]
- Almaev, A.; Yakovlev, N.; Kopyev, V.; Nikolaev, V.; Butenko, P.; Deng, J.; Pechnikov, A.; Korusenko, P.; Koroleva, A.; Zhizhin, E. High Sensitivity Low-Temperature Hydrogen Sensors Based on SnO2/κ(ε)-Ga2O3:Sn Heterostructure. Chemosensors 2023, 11, 325. [Google Scholar] [CrossRef]
- Dimitrova, Z.; Gogova, D. On the Structure, Stress and Optical Properties of CVD Tungsten Oxide Films. Mater. Res. Bull. 2005, 40, 333–340. [Google Scholar] [CrossRef]
- Yurchenko, O.; Diehle, P.; Altmann, F.; Schmitt, K.; Wöllenstein, J. Co3O4-Based Materials as Potential Catalysts for Methane Detection in Catalytic Gas Sensors. Sensors 2024, 24, 2599. [Google Scholar] [CrossRef]
- Zhan, H.; Li, H.; Yang, X.; Zhao, R.; Liu, Q.; Duan, Y.; Shen, Z. Pt-functionalized ZnO nanosheets gas sensor for highly sensitive detecting of methane. J. Mater. Sci. Mater. Electron. 2024, 35, 1871. [Google Scholar] [CrossRef]
- Furuta, D.; Sayahi, T.; Li, J.; Wilson, B.; Presto, A.A.; Li, J. Characterization of inexpensive metal oxide sensor performance for trace methane detection. Atmos. Meas. Tech. 2022, 15, 5117–5128. [Google Scholar] [CrossRef]
- Shaposhnik, A.V.; Moskalev, P.V.; Arefieva, O.A.; Zvyagin, A.A.; Kul, O.V.; Vasiliev, A.A. Selective determination of hydrogen in a mixture with methane using a single metal oxide sensor. Int. J. Hydrogen Energy 2024, 82, 523–530. [Google Scholar] [CrossRef]
- Yablokov, M.Y.; Vasiliev, A.A.; Gainutdinov, R.V.; Sokolov, A.V. Determination of Methane Dissolved in Water Using Metal-Oxide Sensors. J. Anal. Chem. 2023, 78, 385–389. [Google Scholar] [CrossRef]
- Santos, J.P.; Sanchez-Vicente, C.; Sayago, I. Rare Earth Doped Metal Oxide Sensors for the Detection of Methane at Room Temperature. Chem. Eng. Trans. 2024, 112, 109–114. [Google Scholar] [CrossRef]
- Mirzaei, A.; Alizadeh, M.; Ansari, H.R.; Moayedi, M.; Kordrostami, Z.; Safaeian, H.; Lee, M.L.; Kim, T.-U.; Kim, J.-Y.; Kim, H.W.; et al. Resistive gas sensors for the detection of NH3 gas based on 2D WS2, WSe2, MoS2, and MoSe2: A review. Nanotechnology 2024, 35, 332002. [Google Scholar] [CrossRef] [PubMed]
- Horng, R.H.; Lin, S.H.; Hung, D.R.; Chao, P.H.; Fu, P.K.; Chen, C.H.; Chen, Y.C.; Shao, J.H.; Huang, C.Y.; Tarntair, F.G.; et al. Structure Effect on the Response of ZnGa2O4 Gas Sensor for Nitric Oxide Applications. Nanomaterials 2022, 12, 3759. [Google Scholar] [CrossRef]
- Munusami, V.; Arutselvan, K.; Vadivel, S. Development of High Sensitivity LPG and NO2 Gas Sensor Based ZnGa2O4/Graphene Nanoplates Hybrid Structure—A Novel Approach. Diam. Relat. Mater. 2021, 111, 108167. [Google Scholar] [CrossRef]
- Sousa Filho, I.A.; Dagnone Figueiredo, J.F.; Bouquet, V.; Oliveira, A.L.M.; Lebullenger, R.; Garcia Santos, I.M.; Guilloux-Viry, M.; Merdrignac-Conanec, O.; Weber, I.T. ZnGa2O4 and ZnGa2O4:N Thin Films Applied as Sensors for Detection of Acetaldehyde in Ethanol. Phys. B Condens. Matter 2023, 658, 414834. [Google Scholar] [CrossRef]
- Chen, I.C.; Lin, S.S.; Lin, T.J.; Hsu, C.L.; Hsueh, T.J.; Shieh, T.Y. The Assessment for Sensitivity of a NO2 Gas Sensor with ZnGa2O4/ZnO Core-Shell Nanowires—A Novel Approach. Sensors 2010, 10, 3057–3072. [Google Scholar] [CrossRef]
- Park, S.; An, S.; Mun, Y.; Lee, C. UV-Enhanced Room-Temperature Gas Sensing of ZnGa2O4 Nanowires Functionalized with Au Catalyst Nanoparticles. Appl. Phys. A 2014, 114, 903–910. [Google Scholar] [CrossRef]
- Figaro Engineering Inc. Available online: https://www.figaro.co.jp/en/company/history.html (accessed on 19 February 2025).
- Tomchenko, A.A. Thick-Film Semiconductor Chemical Sensors. In Encyclopedia of Sensors; Grimes, C.A., Dickey, E.C., Pishko, M.V., Eds.; American Scientific Publishers: Stevenson Ranch, CA, USA, 2006; Volume 10, pp. 279–290. [Google Scholar]
- Ménil, F.; Coillard, P.; Lucat, C. Critical Review of Nitrogen Monoxide Sensors for Exhaust Gases of Lean Burn Engines. Sens. Actuators B Chem. 2000, 67, 1–23. [Google Scholar] [CrossRef]
- Li, Q.; Zeng, W.; Li, Y. Metal Oxide Gas Sensors for Detecting NO2 in Industrial Exhaust Gas: Recent Developments. Sens. Actuators B Chem. 2022, 359, 131579. [Google Scholar] [CrossRef]
- Aishwarya, K.; Nirmala, R.; Navamathavan, R. Recent Advancements in Liquefied Petroleum Gas Sensors: A Topical Review. Sens. Int. 2021, 2, 100091. [Google Scholar] [CrossRef]
- Luchechko, A.; Zhydachevskyy, Y.; Ubizskii, S.; Kravets, O.; Popov, A.; Rogulis, U.; Elsts, E.; Bulur, E.; Suchocki, A. Afterglow, TL and OSL Properties of Mn2+-Doped ZnGa2O4 Phosphor. Sci. Rep. 2019, 9, 9544. [Google Scholar] [CrossRef] [PubMed]
- Allix, M.; Chenu, S.; Véron, E.; Poumeyrol, T.; Kouadri-Boudjelthia, E.; Alahrache, S. Considerable Improvement of Long-Persistent Luminescence in Germanium and Tin Substituted ZnGa2O4. Chem. Mater. 2013, 25, 1600–1606. [Google Scholar] [CrossRef]
- Ueda, J.; Back, M.; Brik, M.G.; Zhuang, Y.; Grinberg, M.; Tanabe, S. Ratiometric Optical Thermometry Using Deep Red Luminescence from 4T2 and 2E States of Cr3+ in ZnGa2O4 Host. Opt. Mater. 2018, 85, 510–516. [Google Scholar] [CrossRef]
- Chen, Q.L.; Shang, L.B.; Xu, H.M.; Ma, C.G.; Duan, C.K. Multi-Valence and Visible to Near-Infrared Photoluminescence of Manganese in ZnGa2O4: A First-Principles Study. J. Phys. Chem. C 2021, 125, 21780–21790. [Google Scholar] [CrossRef]
- Shiu, W.T.; Li, X.; Chang, L.Y.; Chen, J.L.; Lin, Y.Y.; Lin, B.H.; Sterbinsky, G.E.; Wu, T.; McLeod, J.A.; Li, L. The Influence of Hydro-Thermal Synthesis Temperature on the Electronic Structure and Luminescence Property of Cr-Doped ZnGa2O4 Nanoparticles. J. Lumin. 2023, 263, 120113. [Google Scholar] [CrossRef]
- Brik, M.G.; Ma, C.G.; Yamamoto, T.; Piasecki, M.; Popov, A.I. First-Principles Methods as a Powerful Tool for Fundamental and Applied Research in the Field of Optical Materials. In Phosphor Handbook: Experimental Methods for Phosphor Evaluation and Characterization; CRC Press: Boca Raton, FL, USA, 2022; pp. 1–26. [Google Scholar]
- Mushtaq, U.; Kumar, V. Host-Sensitized Colour-Tunable Emission and Judd-Ofelt Analysis for Dy3+-Doped ZnGa2O4 Phosphor through Exciton-Mediated Energy Transfer. Opt. Mater. 2023, 146, 114554. [Google Scholar] [CrossRef]
- Suchikova, Y.; Nazarovets, S.; Popov, A.I. Ga2O3 Solar-Blind Photodetectors: From Civilian Applications to Missile Detection and Research Agenda. Opt. Mater. 2024, 157, 116397. [Google Scholar] [CrossRef]
- Fritzen, D.L.; Nardy, G.; Portes, M.C.; Giordano, L.; Bonturim, E.; Teixeira, V.C.; Rodrigues, L.C.V. From Synthesis to Fabrication: Engineering Thin Translucent Films with Green Persistent Luminescence Nanoparticles. Opt. Mater. X 2023, 20, 100271. [Google Scholar] [CrossRef]
- Singh, G.; Virpal; Singh, R.C. Highly Sensitive Gas Sensor Based on Er-Doped SnO2 Nanostructures and Its Temperature Dependent Selectivity towards Hydrogen and Ethanol. Sens. Actuators B Chem. 2019, 282, 373–383. [Google Scholar] [CrossRef]
- Liu, X.; Li, J.; Guo, L.; Wang, G. Highly Sensitive Acetone Gas Sensors Based on Erbium-Doped Bismuth Ferrite Nanoparticles. Nanomaterials 2022, 12, 3679. [Google Scholar] [CrossRef] [PubMed]
- Jiao, M.Z.; Chen, X.Y.; Hu, K.X.; Qian, D.Y.; Zhao, X.H.; Ding, E.J. Recent Developments of Nanomaterials-Based Conductive Type Methane Sensors. Rare Met. 2021, 40, 1515–1527. [Google Scholar] [CrossRef]
- Basu, S.; Basu, P.K. Nanocrystalline Metal Oxides for Methane Sensors: Role of Noble Metals. J. Sens. 2009, 2009, 861968. [Google Scholar] [CrossRef]
- Fu, L.; You, S.; Li, G.; Li, X.; Fan, Z. Application of Semiconductor Metal Oxide in Chemiresistive Methane Gas Sensor: Recent Developments and Future Perspectives. Molecules 2023, 28, 6710. [Google Scholar] [CrossRef]
- Chen, L.; Yu, Q.; Pan, C.; Song, Y.; Dong, H.; Xie, X.; Li, Y.; Liu, J.; Wang, D.; Chen, X. Chemiresistive gas sensors based on electrospun semiconductor metal oxides: A review. Talanta 2022, 246, 12352. [Google Scholar] [CrossRef]
- Kekana, M.T.M.; Mosuang, T.E.; Ntsendwana, B.; Sikhwivhilu, L.M.; Mahladisa, M.A. Notable synthesis, properties and chemical gas sensing trends on molybdenum disulphides and diselenides two-dimensional nanostructures: A critical review. Chemosphere 2024, 366, 143497. [Google Scholar] [CrossRef]
- Chen, M.I.; Singh, A.K.; Chiang, J.L.; Horng, R.H.; Wuu, D.S. Zinc Gallium Oxide—A Review from Synthesis to Applications. Nanomaterials 2020, 10, 2208. [Google Scholar] [CrossRef]
- Wang, Y.P.; Zhang, H.S.; Lin, L.T.; Zhou, S.F.; Yao, Y.; Yang, X.B.; Zhao, Y.J. Role of Intrinsic Defects on the Persistent Luminescence of Pristine and Mn Doped ZnGa2O4. J. Appl. Phys. 2019, 125, 095701. [Google Scholar] [CrossRef]
- Ponzoni, A.; Baratto, C.; Cattabiani, N.; Falasconi, M.; Galstyan, V.; Nunez-Carmona, E.; Rigoni, F.; Sberveglieri, V.; Zambotti, G.; Zappa, D. Metal Oxide Gas Sensors, a Survey of Selectivity Issues Addressed at the SENSOR Lab, Brescia, Italy. Sensors 2017, 17, 714. [Google Scholar] [CrossRef]
- Almaev, A.V.; Chernikov, E.V.; Davletkildeev, N.A.; Sokolov, D.V. Oxygen Sensors Based on Gallium Oxide Thin Films with Addition of Chromium. Superlattices Microstruct. 2020, 139, 106392. [Google Scholar] [CrossRef]
- Gaman, V.I.; Almaev, A.V. Dependences of Characteristics of Sensors Based on Tin Dioxide on the Hydrogen Concentration and Humidity of Gas Mixture. Russ. Phys. J. 2017, 60, 90–100. [Google Scholar] [CrossRef]
- Gurlo, A. Interplay between O2 and SnO2: Oxygen Ionosorption and Spectroscopic Evidence for Adsorbed Oxygen. ChemPhysChem 2006, 7, 2041–2052. [Google Scholar] [CrossRef] [PubMed]
- Sopiha, K.V.; Malyi, O.I.; Persson, C.; Wu, P. Chemistry of Oxygen Ionosorption on SnO2 Surfaces. ACS Appl. Mater. Interfaces 2021, 13, 33664–33676. [Google Scholar] [CrossRef] [PubMed]
- Cai, Y.; Wilson, M.N.; Beare, J.; Lygouras, C.; Thomas, G.; Yahne, D.R.; Ross, K.M.; Taddei, K.M.; Sala, G.; Dabkowska, H.A.; et al. Crystal Fields and Magnetic Structure of the Ising Antiferromagnet Er3Ga5O12. Phys. Rev. B 2019, 100, 184415. [Google Scholar] [CrossRef]
- Nogales, E.; García, J.A.; Mendez, B.; Piqueras, J.; Lorenz, K.; Alves, E. Visible and Infrared Luminescence Study of Er Doped β-Ga2O3 and Er3Ga5O12. J. Phys. D Appl. Phys. 2008, 41, 065406. [Google Scholar] [CrossRef]
- Nakayama, A.; Asai, K.; Nagayasu, Y.; Iwamoto, S.; Yagasaki, E.; Inoue, M. Effect of Support Particle Morphology of Ni Catalysts on Growth of Carbon Nanotubes by Methane Decomposition. J. Jpn. Pet. Inst. 2006, 49, 308–314. [Google Scholar] [CrossRef]
- Weber, I.T.; Valentini, A.; Probst, L.F.D.; Longo, E.; Leite, E.R. Catalytic Activity of Nanometric Pure and Rare Earth-Doped SnO2 Samples. Mater. Lett. 2008, 62, 1677–1680. [Google Scholar] [CrossRef]
- Wolkenstein, T. Electronic Processes on Semiconductor Surfaces During Chemisorption; Springer: New York, NY, USA, 1991. [Google Scholar] [CrossRef]
- Kozhushner, M.A.; Trakhtenberg, L.I.; Landerville, A.C.; Oleynik, I.I. Theory of Sensing Response of Nanostructured Tin-Dioxide Thin Films to Reducing Hydrogen Gas. J. Phys. Chem. C 2013, 117, 11562–11568. [Google Scholar] [CrossRef]
- Postica, V.; Lupan, O.; Gapeeva, A.; Hansen, L.; Khaledialidusti, R.; Mishra, A.K.; Drewes, J.; Kersten, H.; Faupel, F.; Adelung, R.; et al. Improved Long-Term Stability and Reduced Humidity Effect in Gas Sensing: SiO2 Ultra-Thin Layered ZnO Columnar Films. Adv. Mater. Technol. 2021, 6, 2001137. [Google Scholar] [CrossRef]
- Fleischer, M.; Seth, M.; Kohl, C.-D.; Meixner, H. A selective H2 sensor implemented using Ga2O3 thin-films which are covered with a gas-filtering SiO2 layer. Sens. Actuators B Chem. 1996, 36, 297–302. [Google Scholar] [CrossRef]
- Wang, Y.; Zhou, Y. Recent Progress on Anti-Humidity Strategies of Chemiresistive Gas Sensors. Materials 2022, 15, 8728. [Google Scholar] [CrossRef]
- Korotcenkov, G.; Cho, B.K. Instability of Metal Oxide-Based Conductometric Gas Sensors and Approaches to Stability Improvement (Short Survey). Sens. Actuators B Chem. 2011, 156, 527–538. [Google Scholar] [CrossRef]
- Yakovlev, N.N.; Almaev, A.V.; Nikolaev, V.I.; Kushnarev, B.O.; Pechnikov, A.I.; Stepanov, S.I.; Chikiryaka, A.V.; Timashov, R.B.; Scheglov, M.P.; Butenko, P.N.; et al. Low-Resistivity Gas Sensors Based on the In2O3-Ga2O3 Mixed Compounds Films. Mater. Today Commun. 2023, 34, 105241. [Google Scholar] [CrossRef]


Disclaimer/Publisher’s Note: The statements, opinions and data contained in all publications are solely those of the individual author(s) and contributor(s) and not of MDPI and/or the editor(s). MDPI and/or the editor(s) disclaim responsibility for any injury to people or property resulting from any ideas, methods, instructions or products referred to in the content. |
© 2025 by the authors. Licensee MDPI, Basel, Switzerland. This article is an open access article distributed under the terms and conditions of the Creative Commons Attribution (CC BY) license (https://creativecommons.org/licenses/by/4.0/).