3. Results and Discussion
The crystalline quality of all the BT and NZF ceramics sintered using MW and CV processes in the 850–1000 °C are analyzed. For the sake of simplification and close comparison purposes, the results are presented for the samples sintered at the 900 and 1000 °C temperature for 2 h using CV and 0.5 h using MW process, as these two recipes produced most reasonable results. Results for the specimens sintered at other temperatures are presented where applicable.
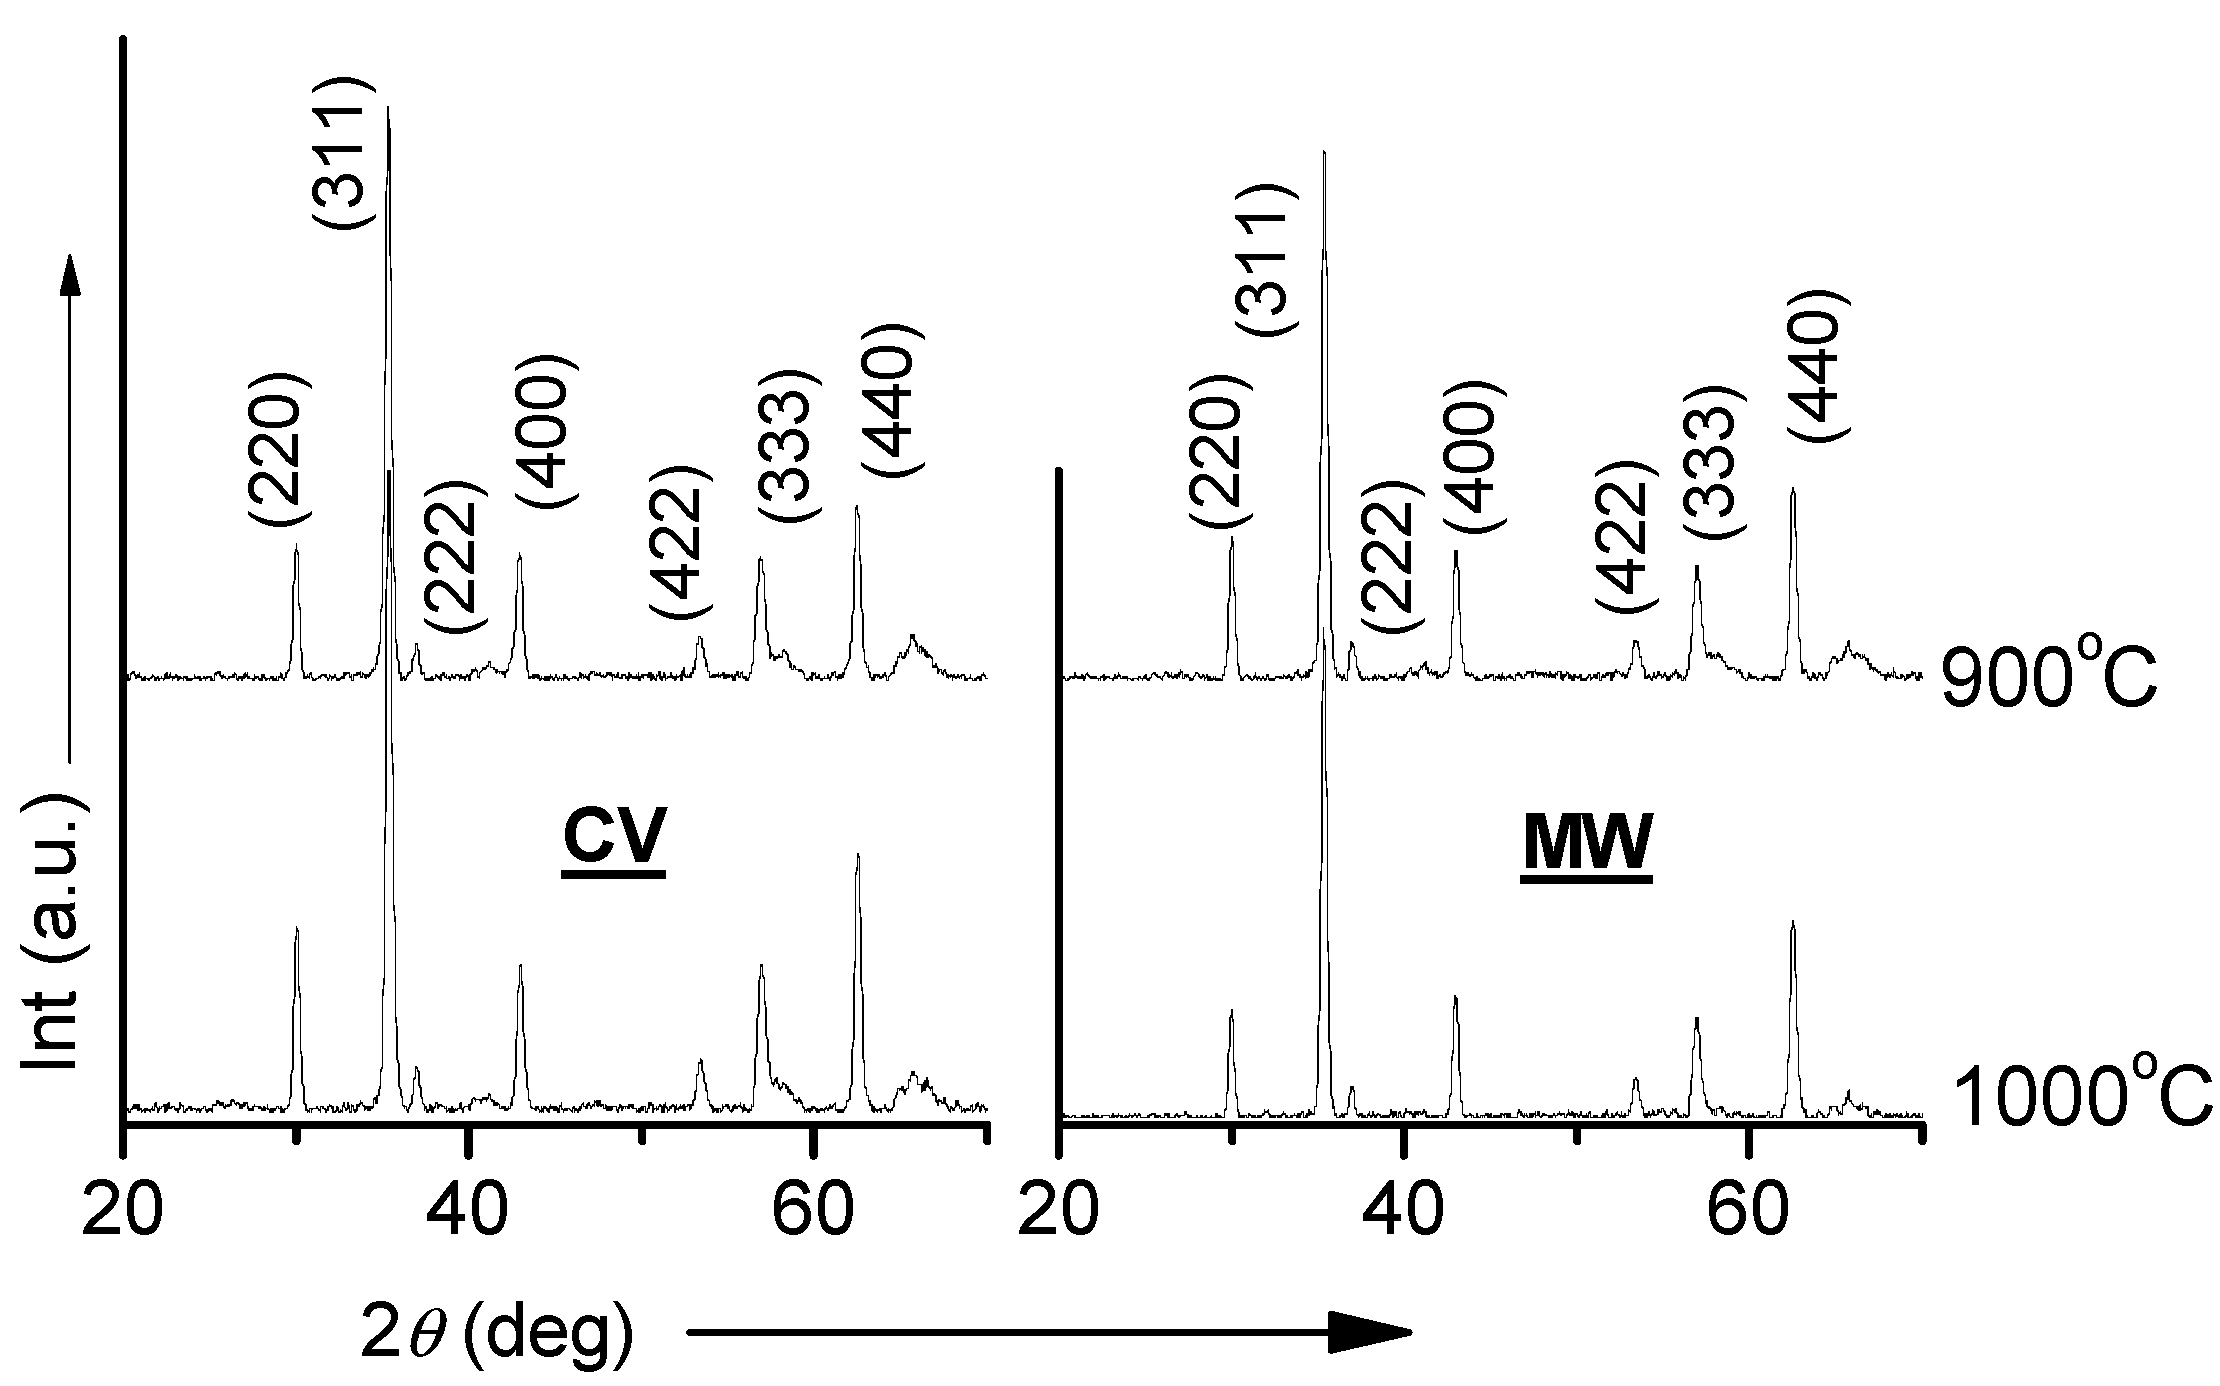
Figure 2 and
Figure 3 depict the XRD spectra of the BT and NZF sintered specimens. No evidence of unwanted phase formation has been found, which indicates that there is no loss of stoichiometry in these ceramics;
i.e. they remain phase pure single phase [
4,
6]. However, sharper peaks observed for the MW sintered samples indicate bigger grain sizes compared to CV sintered BT samples. All of the characterized peaks are marked with the standard JCPDS card no. 05-0626 and 019-0629 respectively for BT and NZF ceramics specimens.
Figure 2.
XRD patterns of conventional (CV) and microwave (MW) sintered BaTiO3 (BT) ceramics.
Figure 2.
XRD patterns of conventional (CV) and microwave (MW) sintered BaTiO3 (BT) ceramics.
Figure 3.
XRD patterns of CV and MW sintered Ni0.5Zn0.5Fe2O4 (NZF) ceramics.
Figure 3.
XRD patterns of CV and MW sintered Ni0.5Zn0.5Fe2O4 (NZF) ceramics.
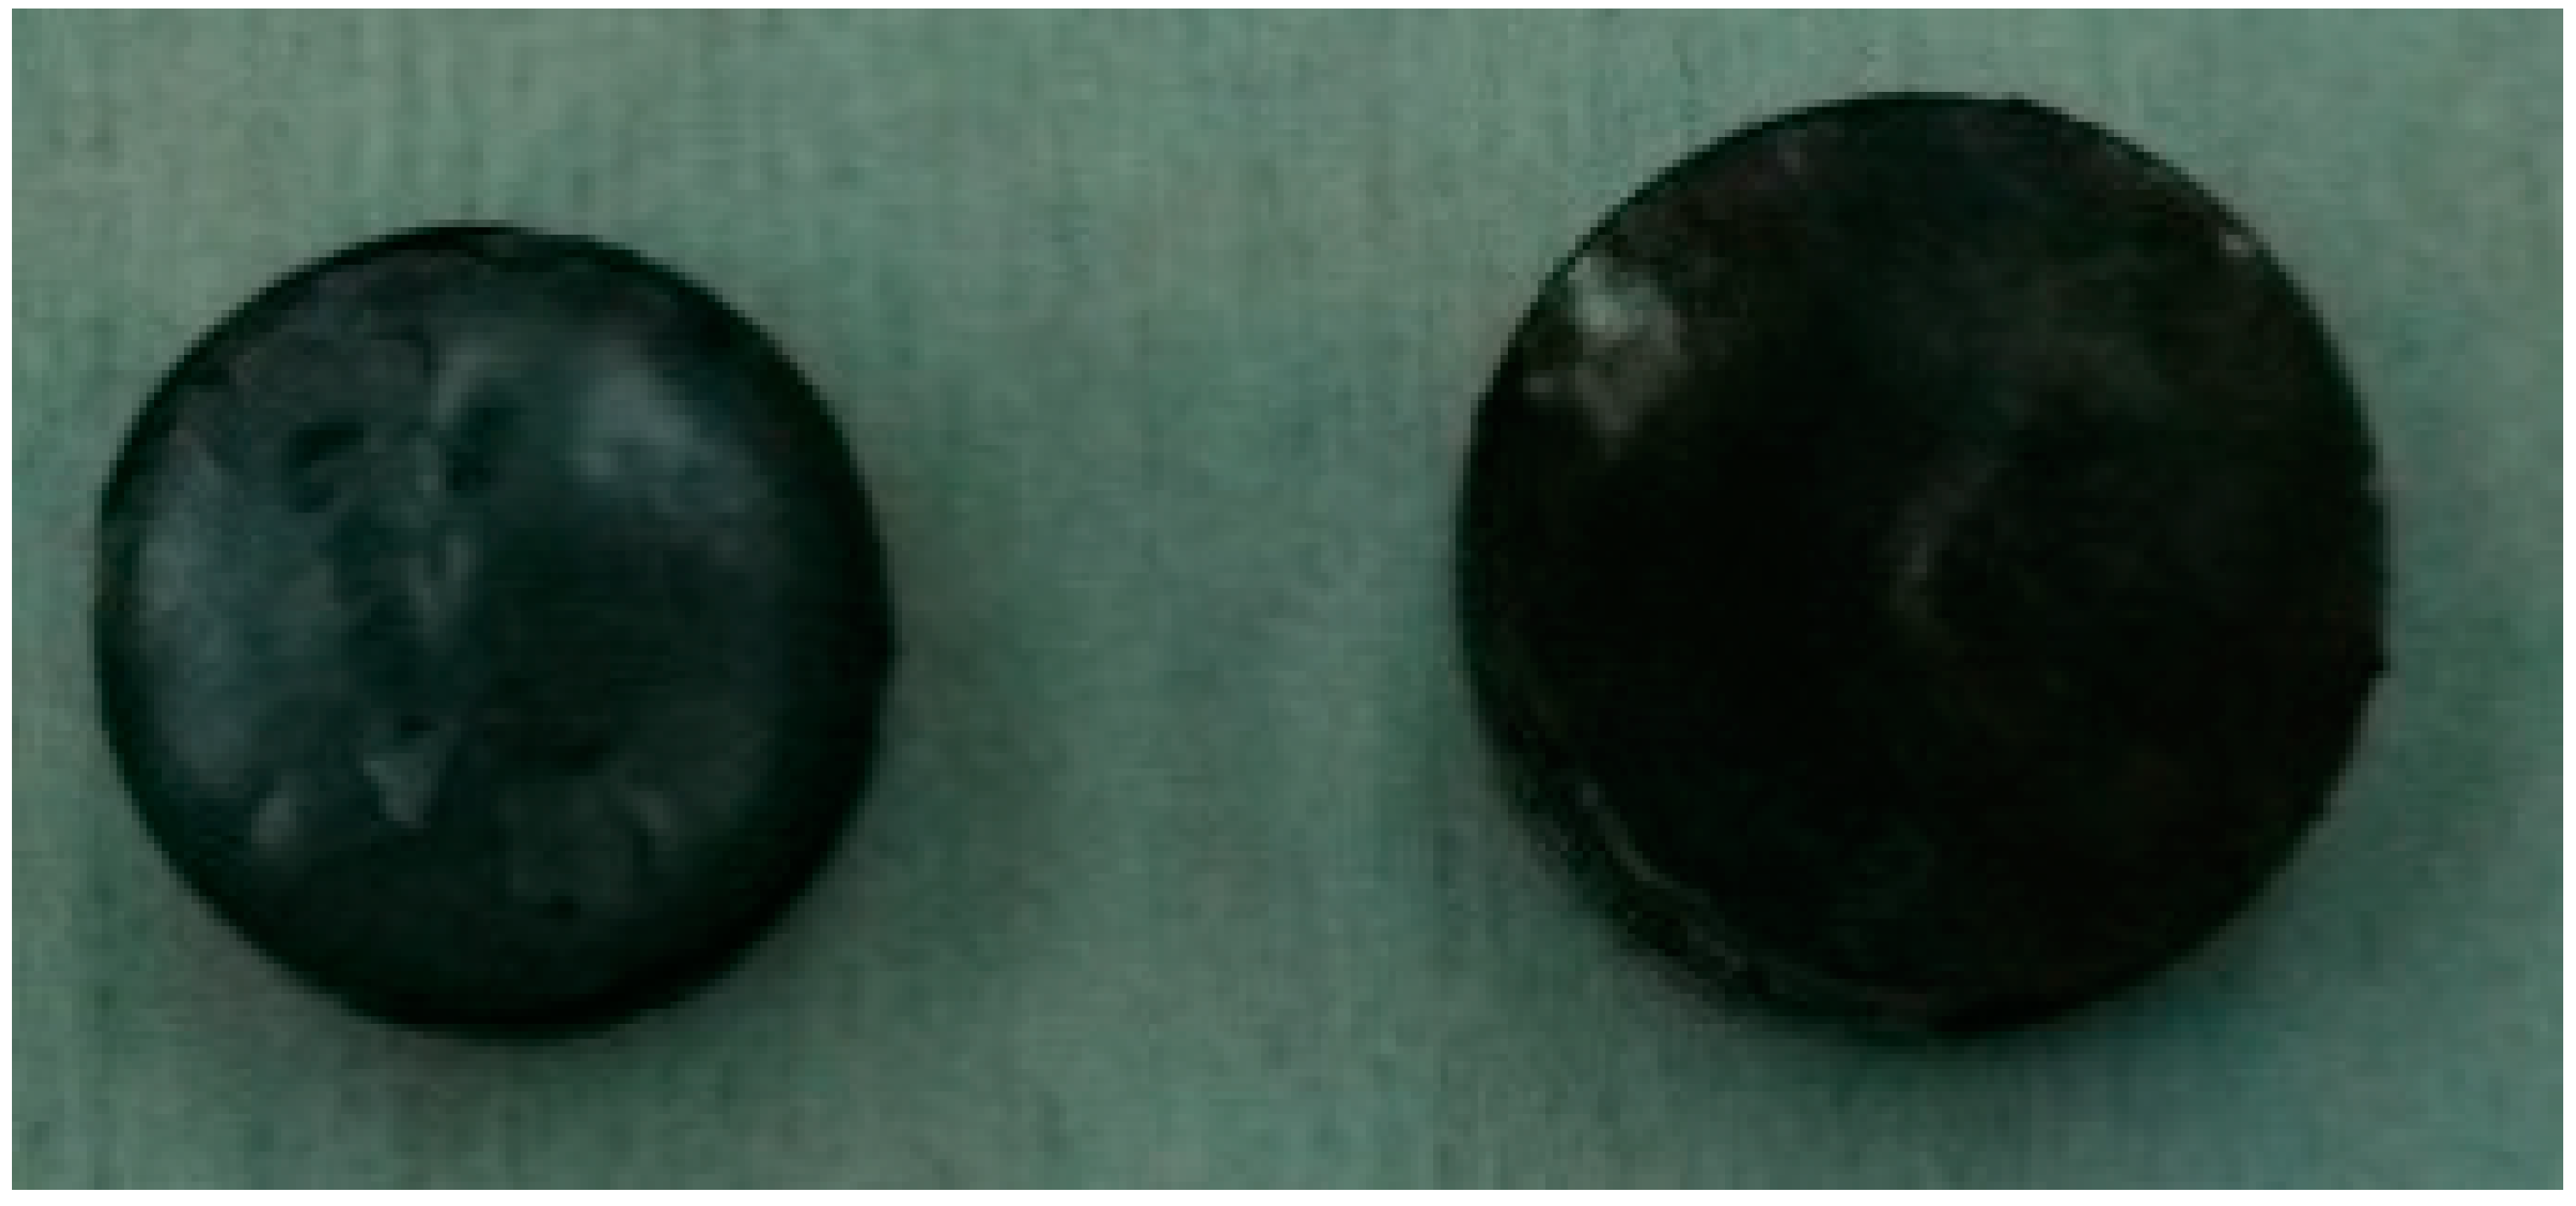
We measured the shrinkage of the sintered samples.
Figure 4 shows the pictures of the NZF ceramics before and after sintering. The average shrinkage for BT ceramics sintered using CV and MW method is in the range of 5%–7% [
12]. Noticeable shrinkage was observed for NZF ceramics, 9%–11% using CV processing and 12%–15% that for MW sintered samples. The maximum shrinkage of 15.45% was observed for NZF ceramics sintered at 950 °C using MW.
Figure 4.
Sintered (left) and pre-sintered samples (right).
Figure 4.
Sintered (left) and pre-sintered samples (right).
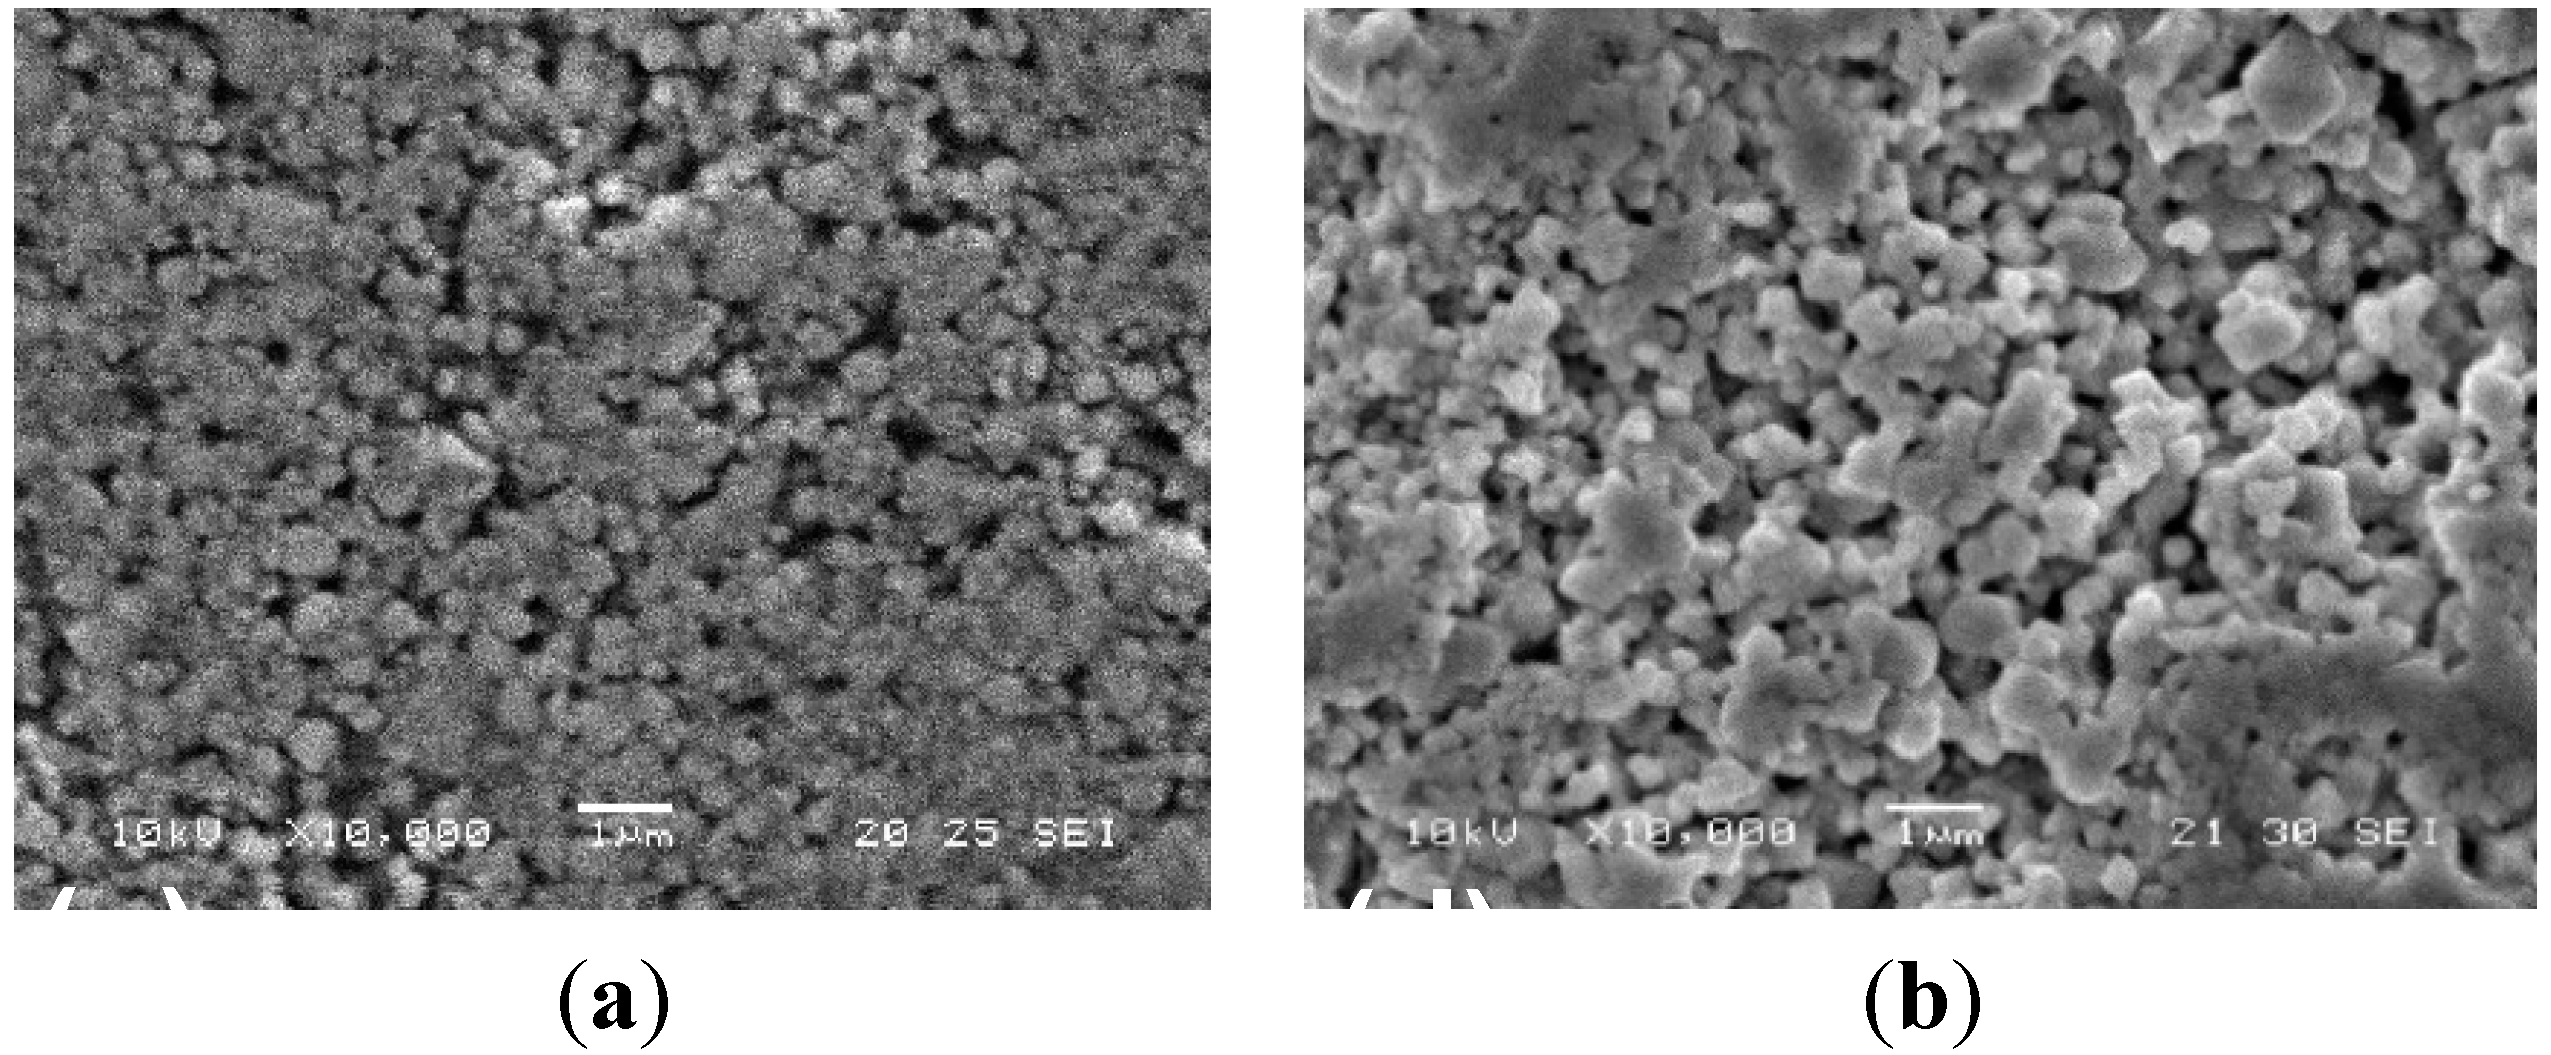
Microstructures of sintered BT and BT + LiF are shown in
Figure 5 and
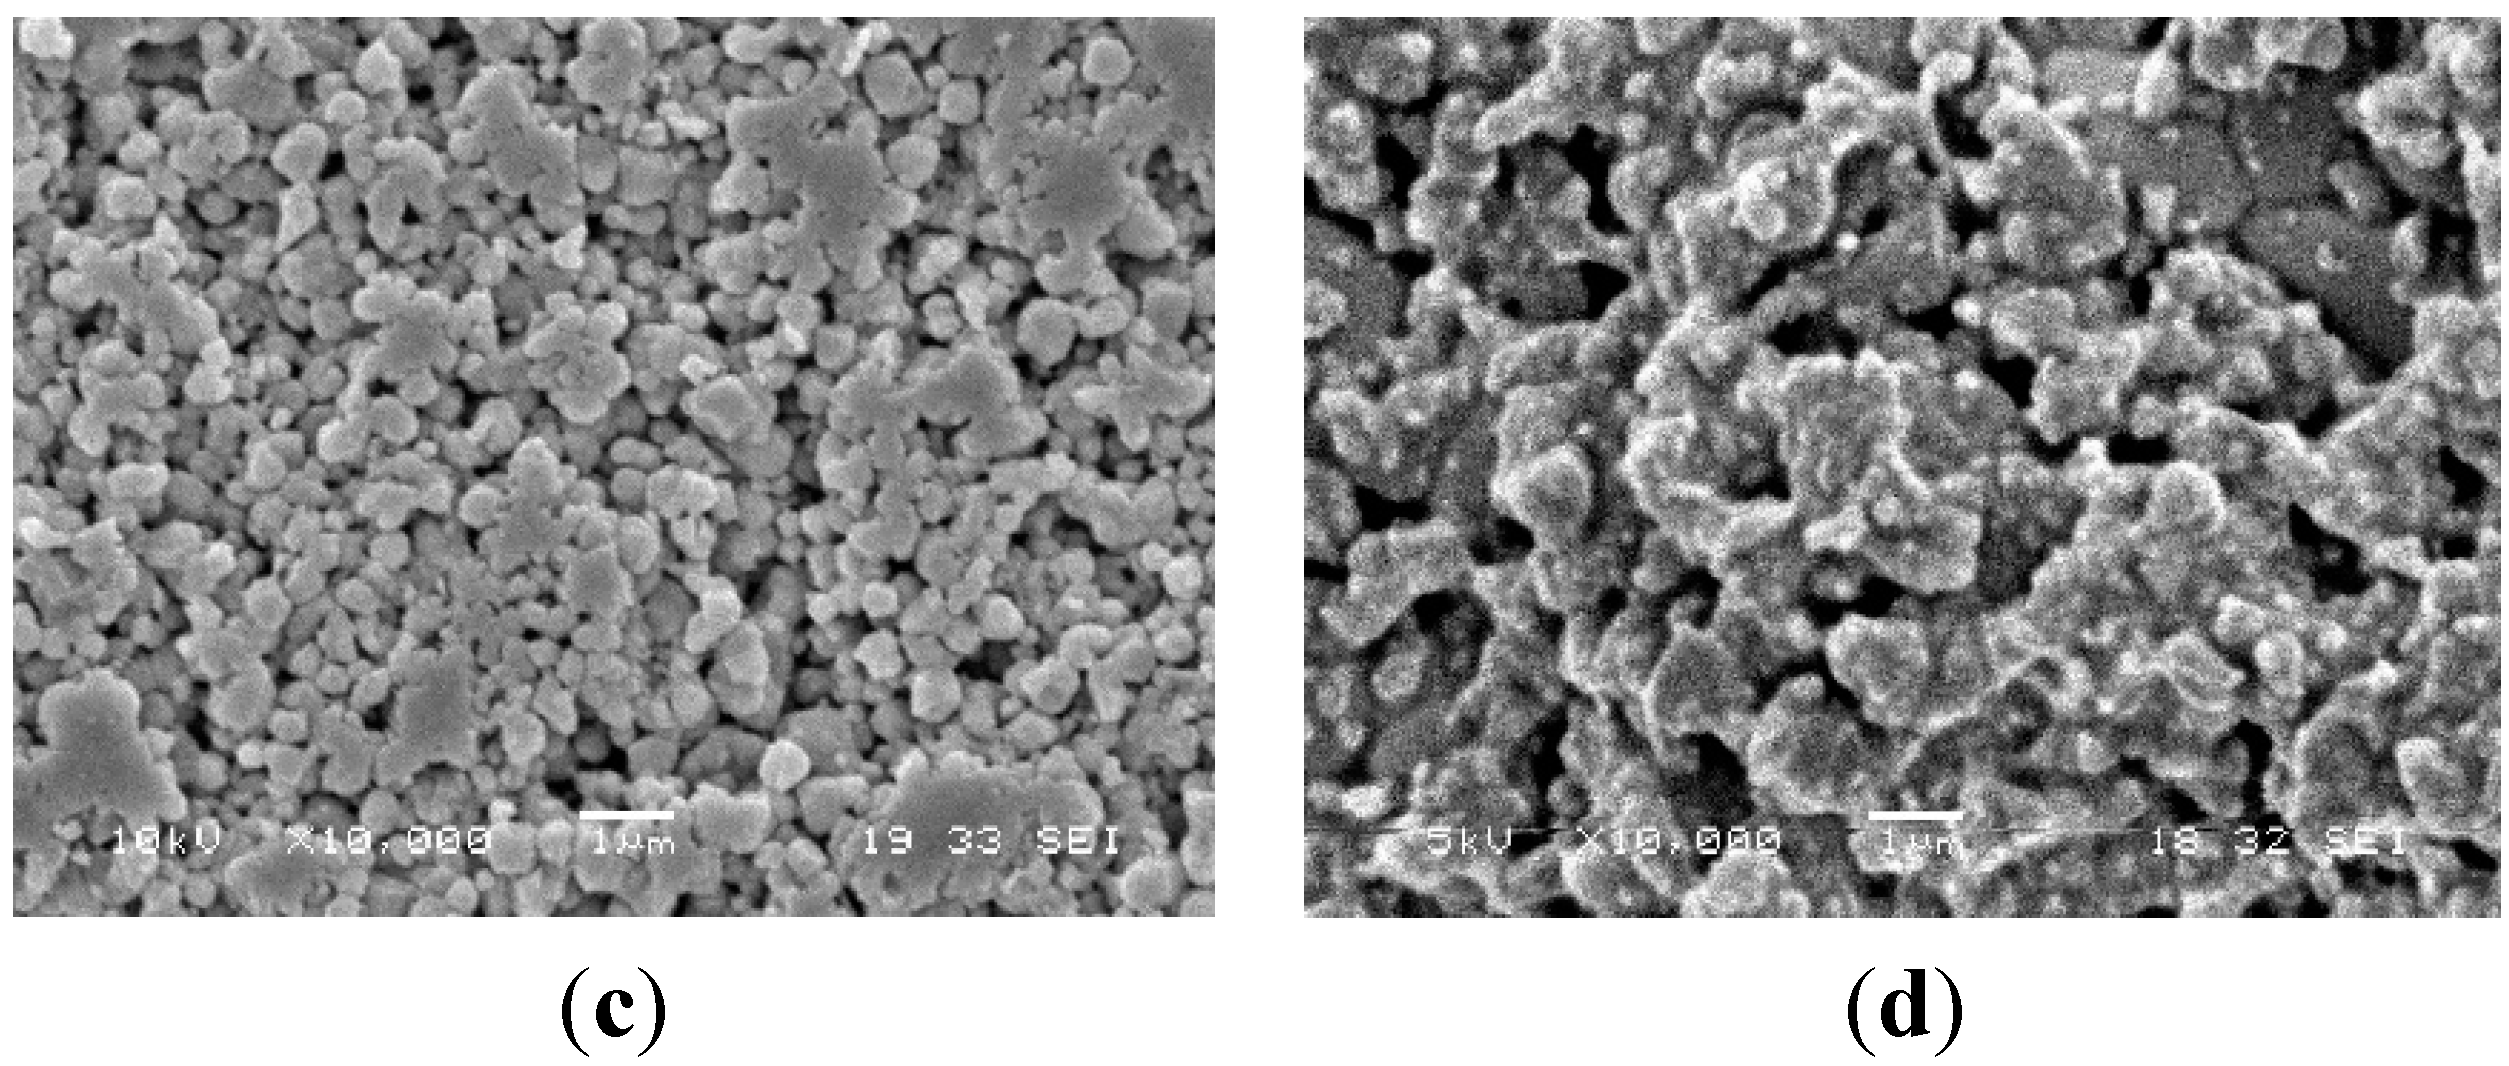
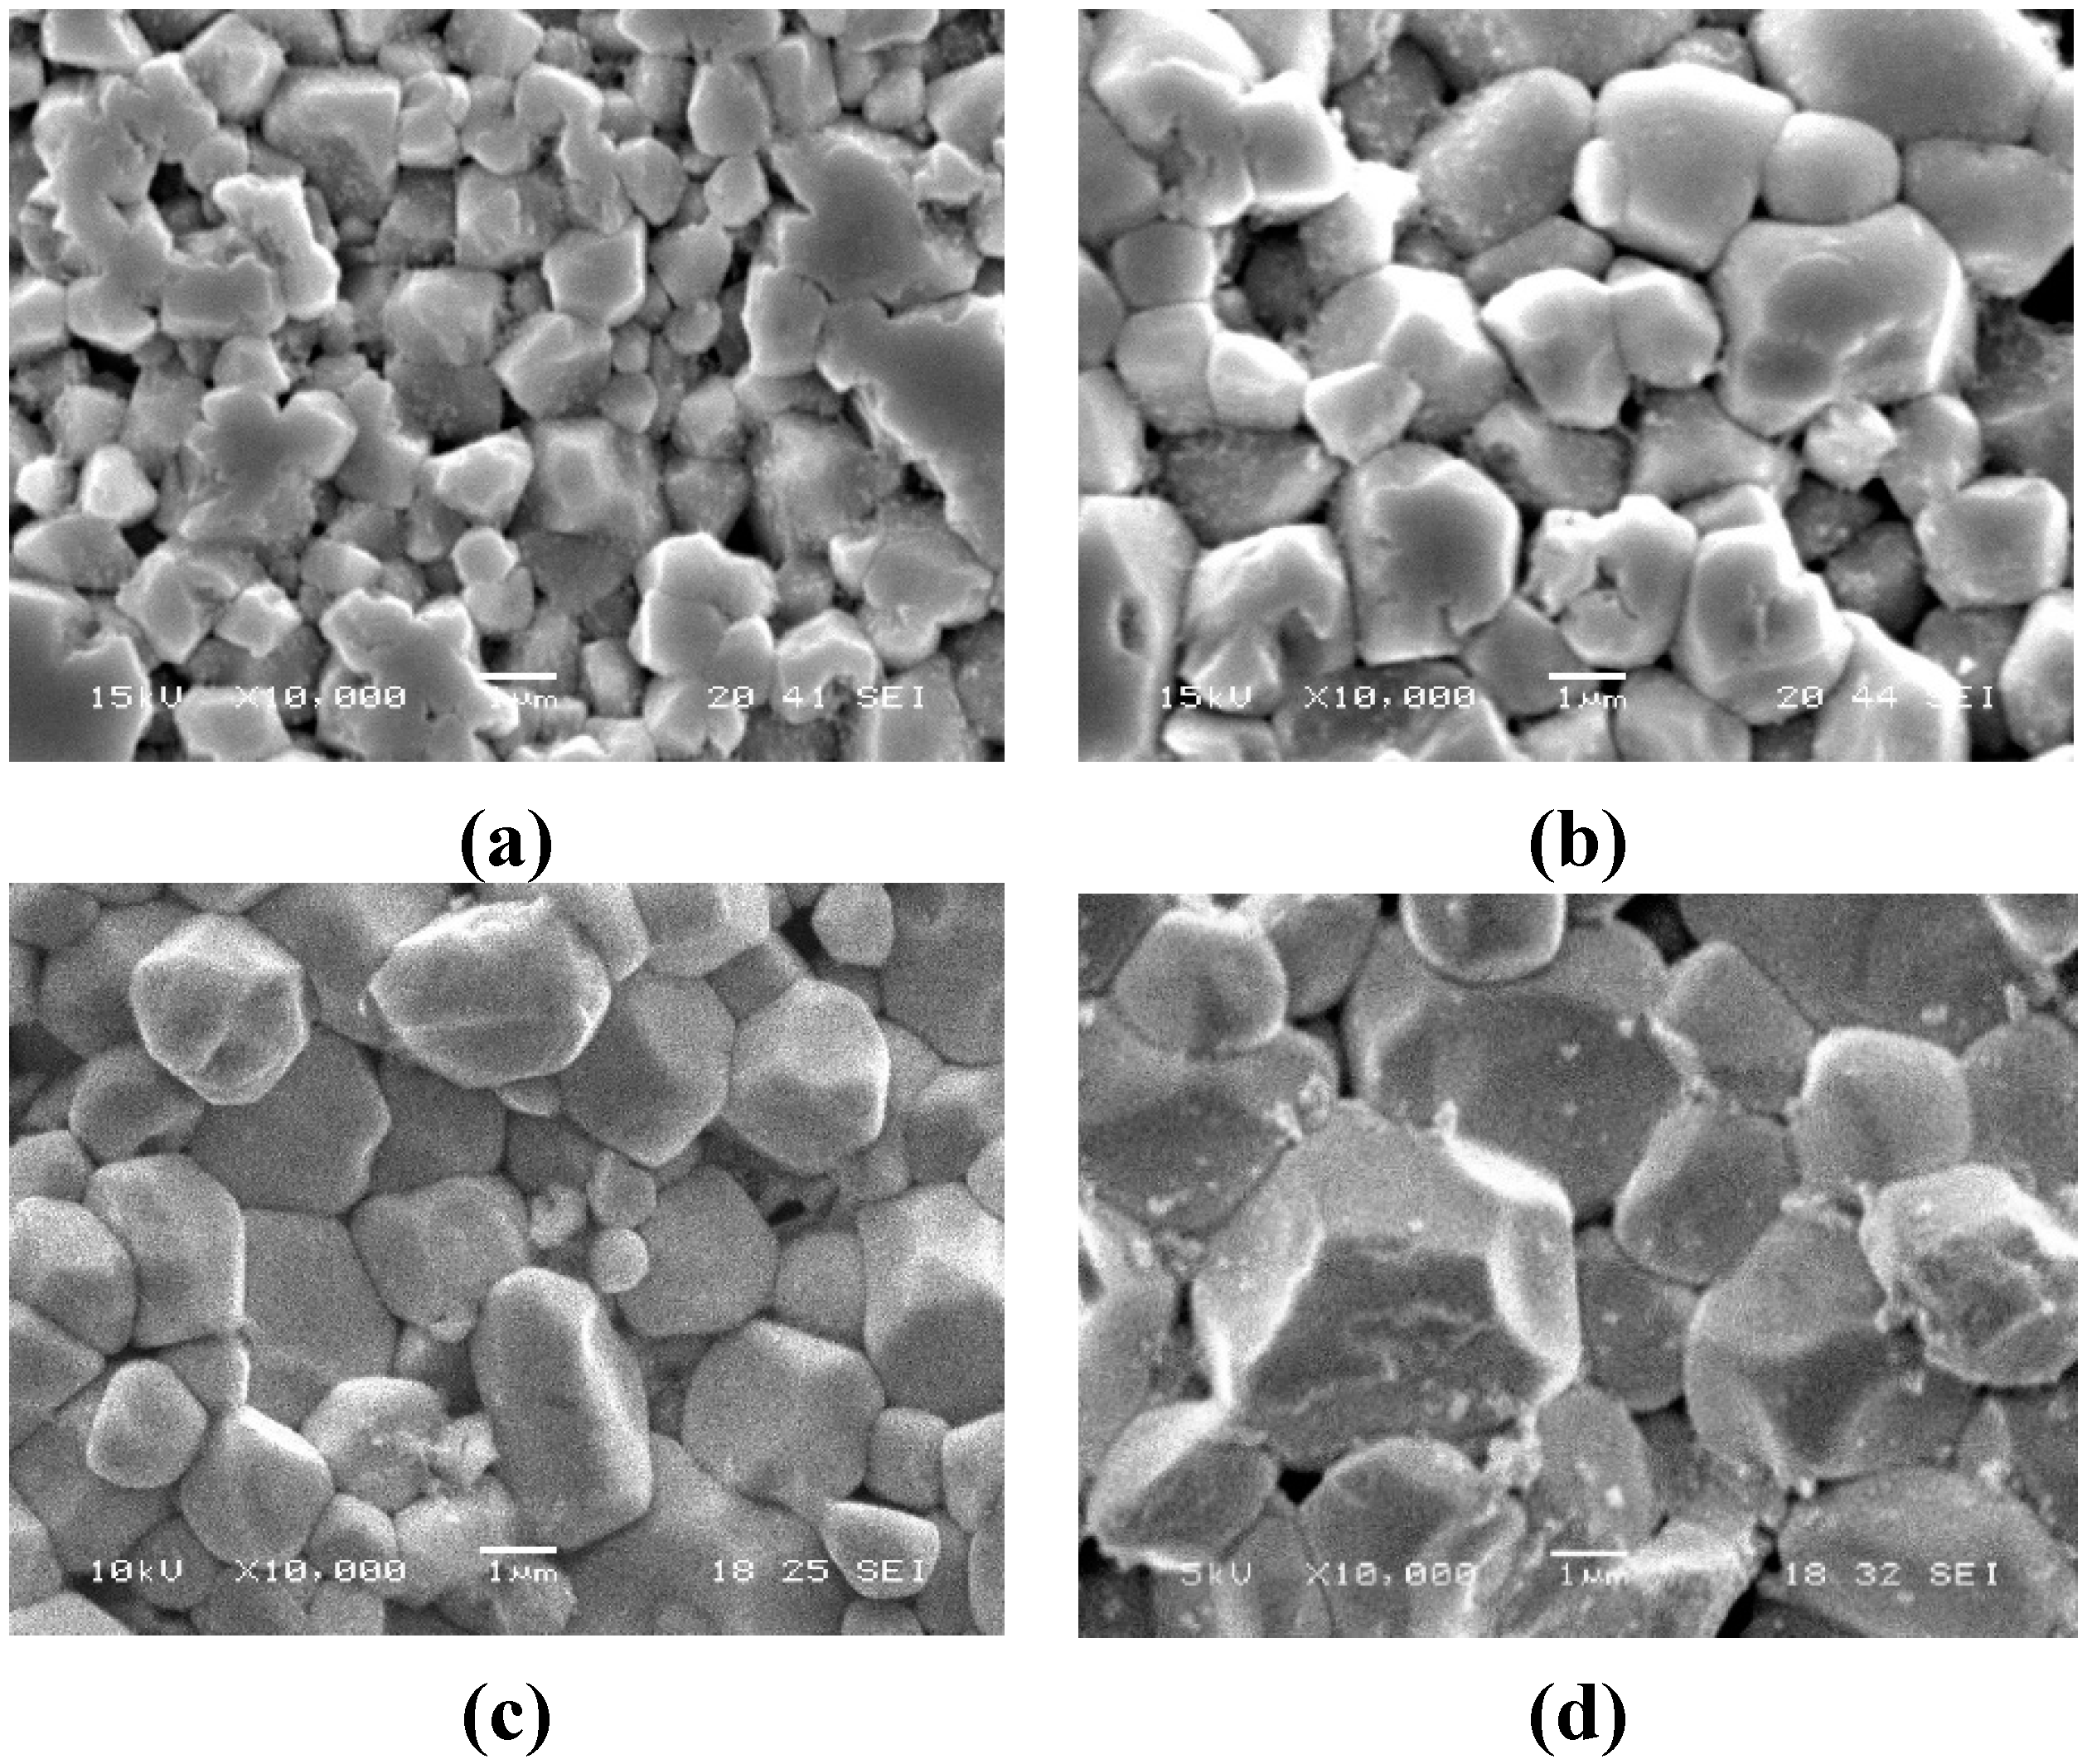
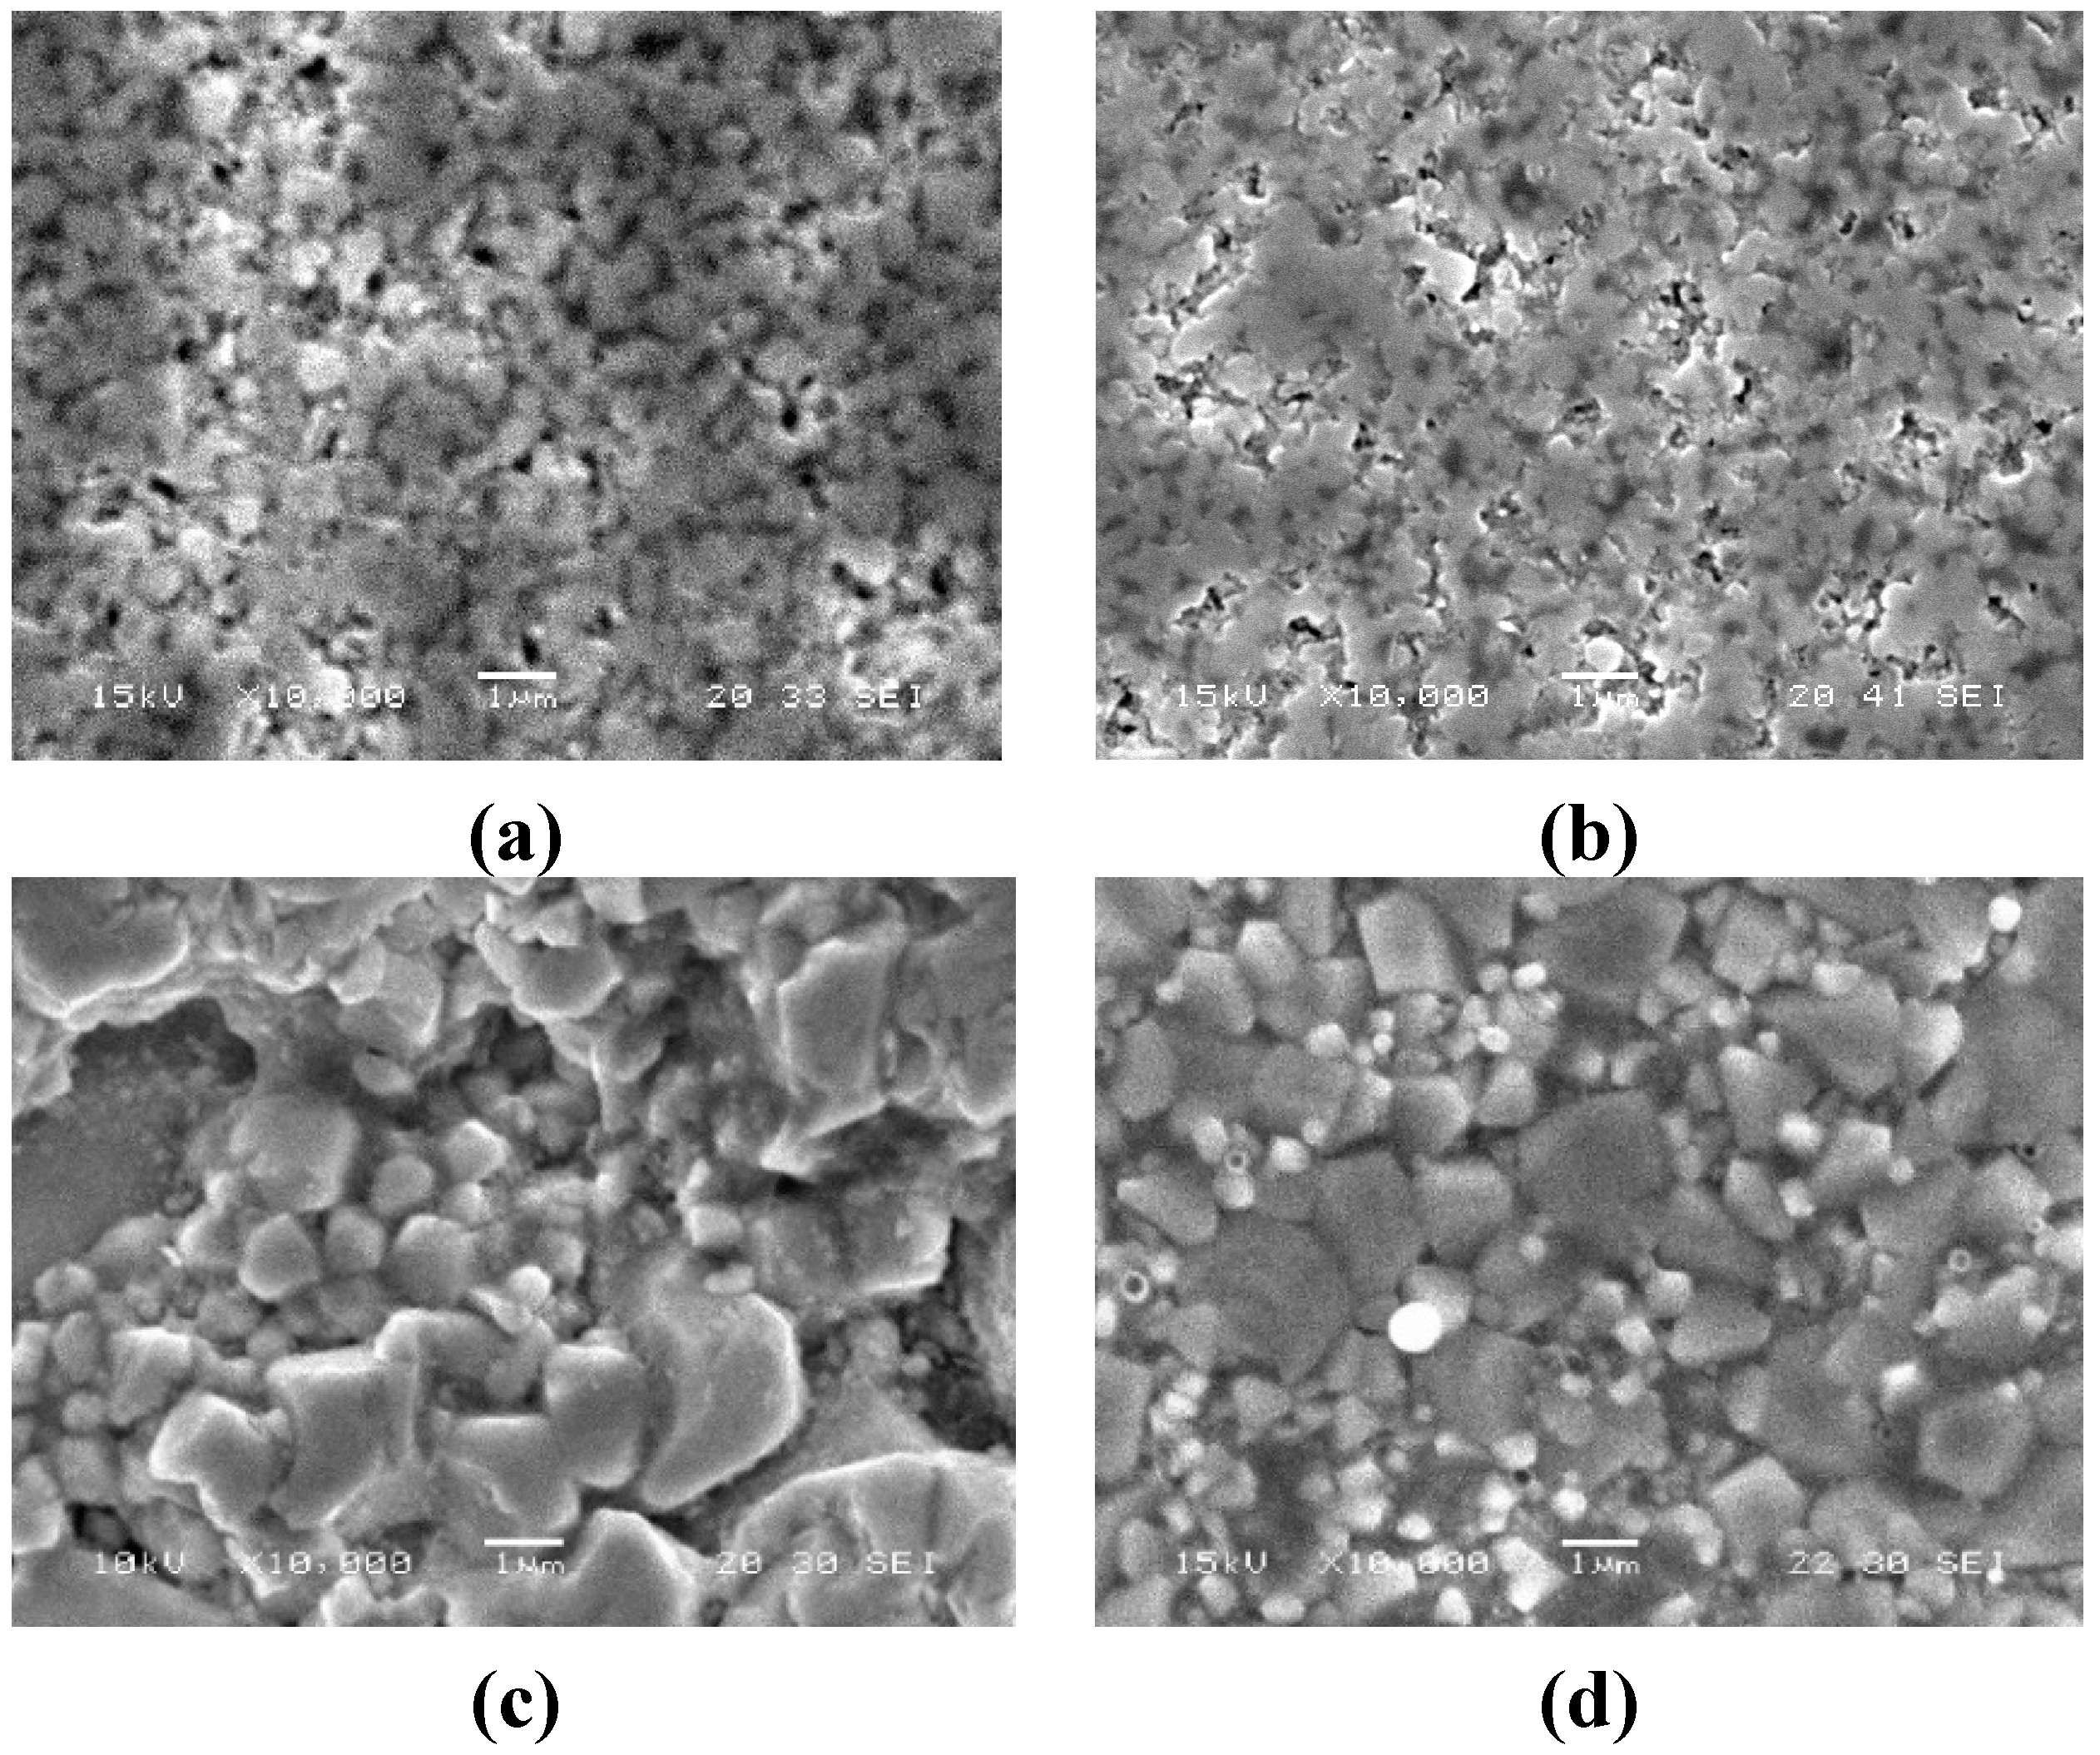
Figure 6. No considerable grain growth is observed up to a sintering temperature of 1000 °C for pure BT. The pure BT ceramics could be still in the initial sintering stage, henceforth the grain sizes are still small. However, the average grain size that of the BT + LiF sample sintered using MW at 900 °C for 0.5 h is ~3.1 µm, which is approximately 2 times larger than the BT + LiF samples sintered using CV at 900 °C for 2 h with average grain size ~1.7 µm. It can be observed that there is a trend of increased grain growth size as the MW sintering temperature increases from 850 °C to 1000 °C. The average grain size values of MW sintered samples are also approximately two times larger than CV sintered samples at the same temperature. Grain sizes for MW sintered NZF at 900 °C are nearly twice that of CV sintered samples (
Figure 7). As seen from the results, the microwave sintered samples reach the intermediate or final stage of the sintering process much earlier under the impact of the MW field as compared to CV sintered samples. The highest average grain size of ~1.2 µm is measured for MW sinter samples at 1000 °C and the lowest grain size of 1 µm is measured for CV sinter samples at 900 °C. These results can be backed up from the XRD scans as stated earlier.
Figure 5.
SEM morphologies of (a) BT-CV-900 °C for 2 h, (b) BT-CV-1000 °C for 2 h, (c) BT-MW-900 °C for 0.5 h, (d) BT-MW-1000 °C for 0.5 h.
Figure 5.
SEM morphologies of (a) BT-CV-900 °C for 2 h, (b) BT-CV-1000 °C for 2 h, (c) BT-MW-900 °C for 0.5 h, (d) BT-MW-1000 °C for 0.5 h.
Figure 6.
Surface morphologies of (a) BT+LiF-CV-900 °C for 2 h, (b) BT+LiF-CV-1000 °C for 2 h, (c) BT+LiF-MW-900 °C for 0.5 h, (d) BT-LiF-MW-1000 °C for 0.5 h.
Figure 6.
Surface morphologies of (a) BT+LiF-CV-900 °C for 2 h, (b) BT+LiF-CV-1000 °C for 2 h, (c) BT+LiF-MW-900 °C for 0.5 h, (d) BT-LiF-MW-1000 °C for 0.5 h.
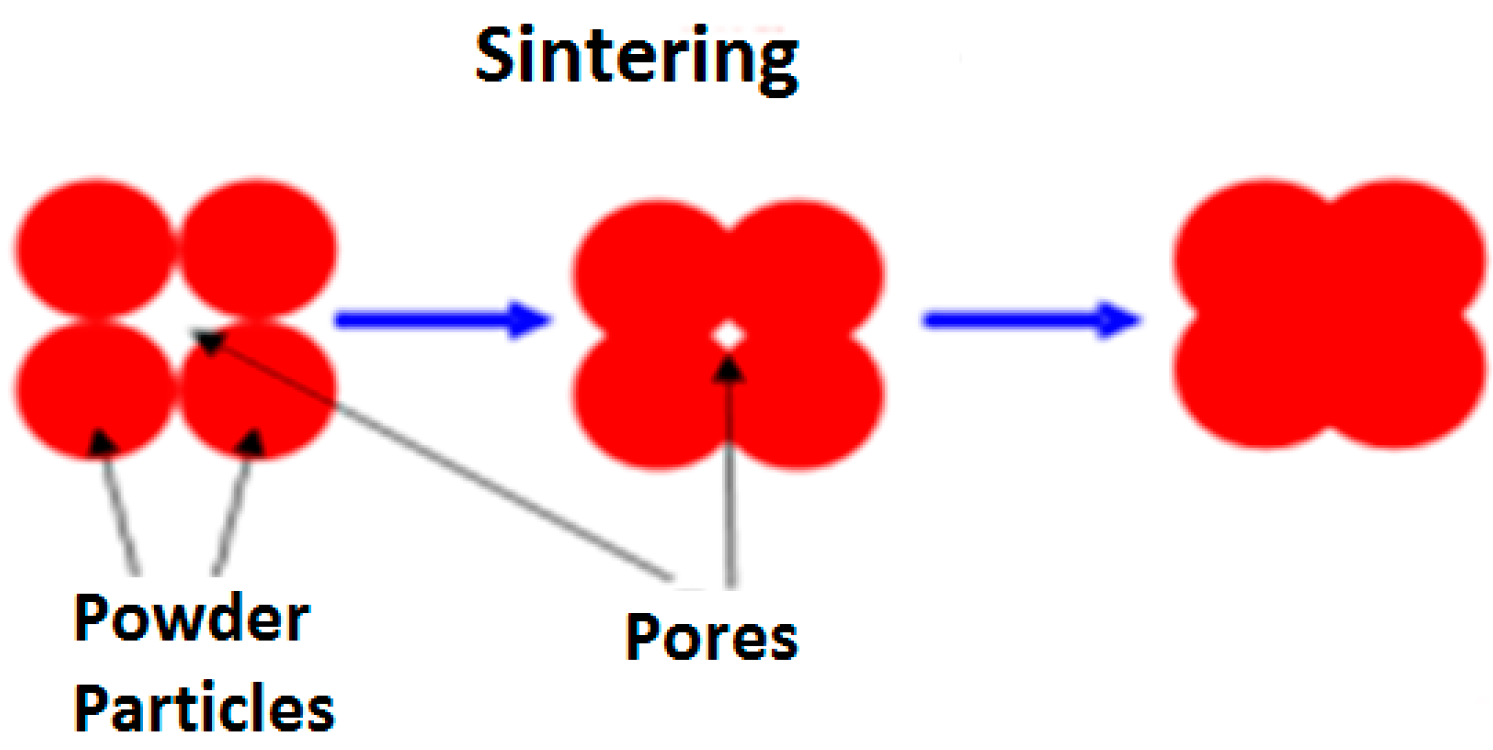
Sintering of crystalline materials occurred by several mechanisms such as atomic transport, vapor transport (evaporation/condensation), surface diffusion, lattice (volume) diffusion, grain boundary diffusion, and dislocation motion.
Figure 8 shows a schematic representation of the matter transport paths for four sintering particles. In conventional heating process, vapor transport, surface diffusion, and lattice diffusion from the particle surfaces to the neck lead to neck growth and coarsening of the particles without densification. The densification mechanism leads through grain boundary diffusion and lattice diffusion from the grain boundary to the neck [
13]. In microwave heating, the specimen gets heated from inside to outside just opposite to conventional heating. Moreover, the microwave absorption mainly depends upon the complex permittivity and permeability of the specimens. As both the specimens already develop dipole, so, they responded well to microwave, and resulted good densification in the samples at a short sintering period.
Figure 7.
Surface morphologies of (a) NZF-CV-900 °C for 2 h, (b) NZF-CV-1000 °C for 2 h, (c) NZF-MW-900 °C for 0.5 h, (d) NZF-MW-1000 °C for 0.5 h.
Figure 7.
Surface morphologies of (a) NZF-CV-900 °C for 2 h, (b) NZF-CV-1000 °C for 2 h, (c) NZF-MW-900 °C for 0.5 h, (d) NZF-MW-1000 °C for 0.5 h.
Figure 8.
Schematic representation of sintering mechanisms for a system of four particles.
Figure 8.
Schematic representation of sintering mechanisms for a system of four particles.
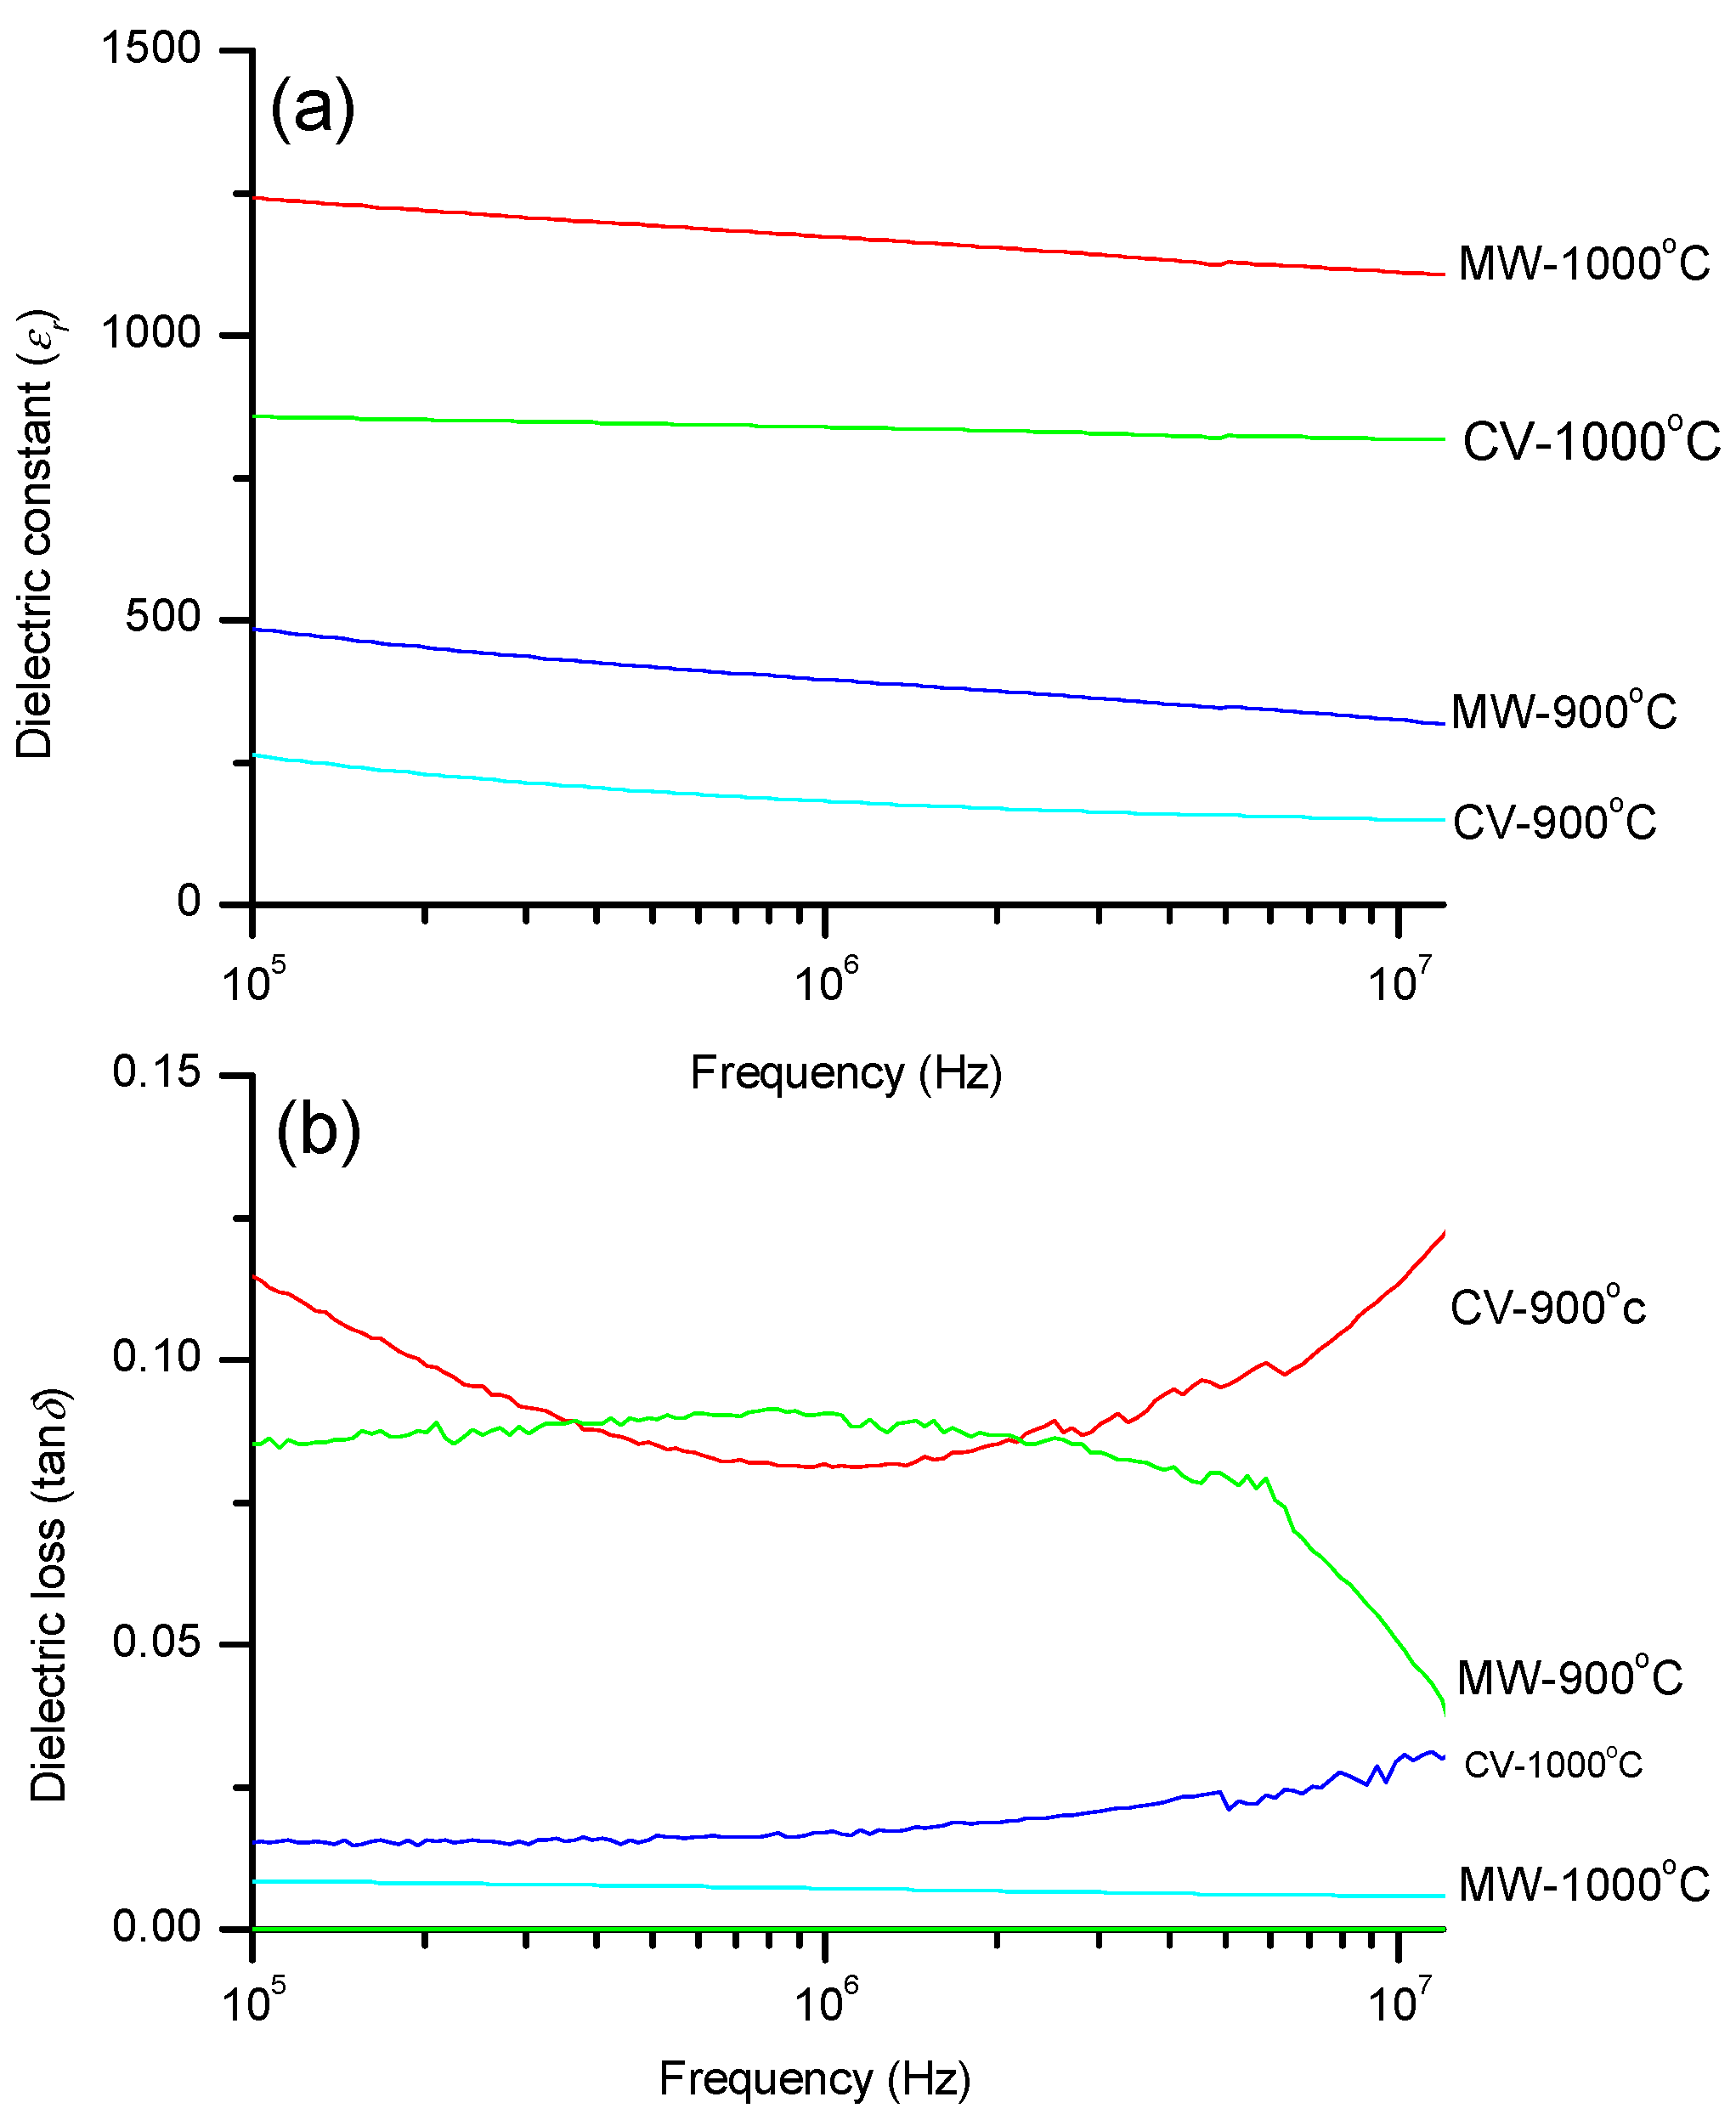
The variation of dielectric constant (
ε) and dielectric loss (tan
δ) for both microwave sintered and conventionally sintered BT and NZF ceramics samples are shown in
Figure 9 and
Figure 10. For BT, it can be seen that the CV sintered pellets show the highest dielectric constant at 100 kHz. For the MW sintered BT + LiF at 1000 °C the value of
ε is 1240, whereas for the same temperature CV sintered sample the dielectric constant value is 800 [
14,
15,
16]. For all MW sintered samples it can be observed that the values of the dielectric constant are higher as compared to conventional sintered samples, this attributes to the higher density in the MW sintered specimens. The value of
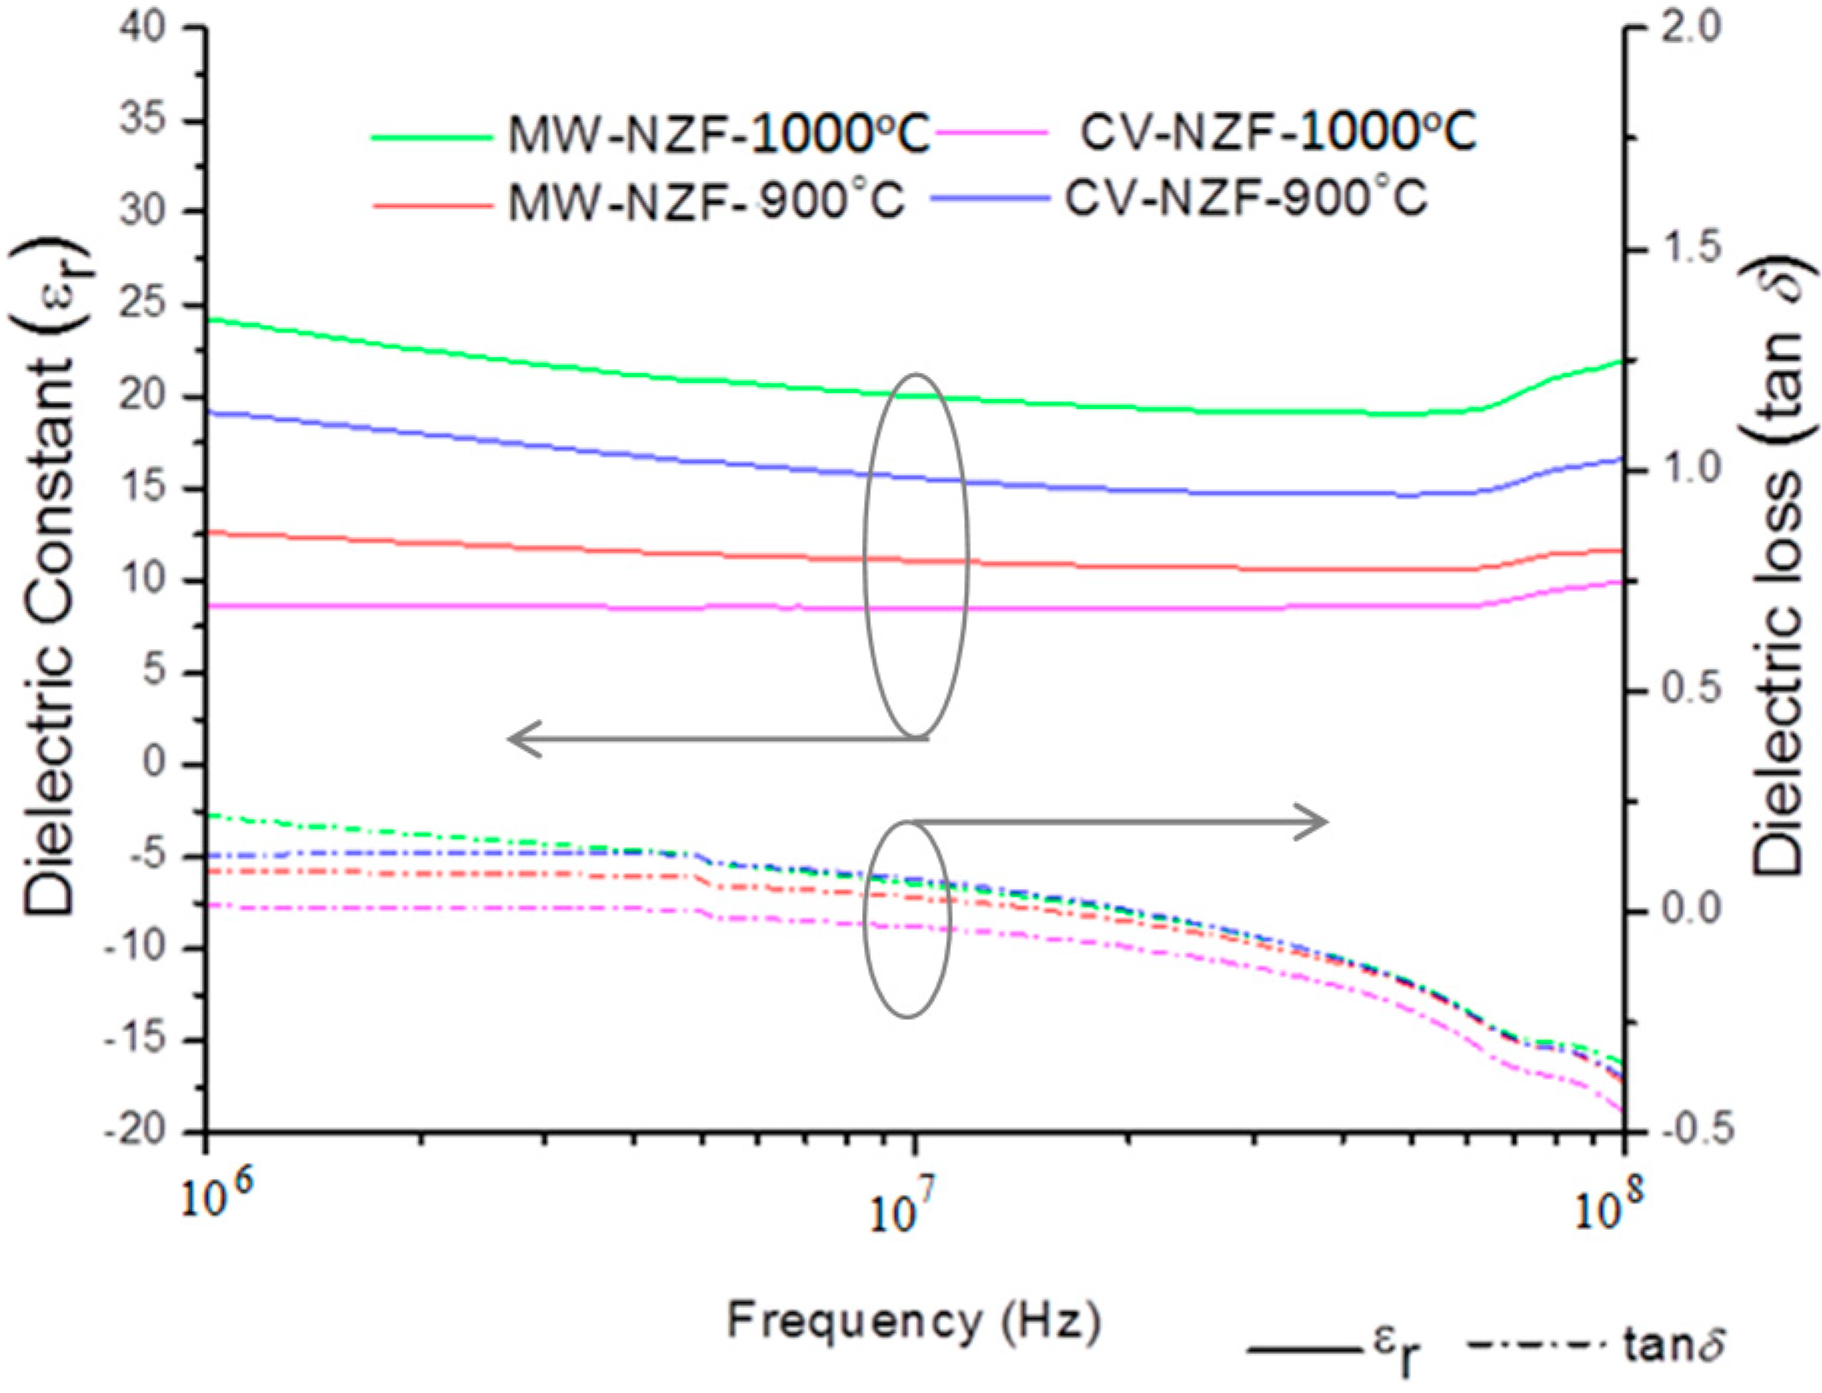
ε for all samples decreases slowly and gradually as the frequency increases from 100 to 10,000 kHz. For NZF, MW sintered pellets show the highest value of
ε at 100 kHz. A value of 25 was obtained for NZF MW-sintered at 950 °C. It is evident that as the sintering temperature for CV methods increases from 900 °C to 1000 °C the dielectric constants decreases. As NZF is a magnetic material, the dielectric properties should be poor as shown in the results.
Figure 9.
Frequency variation of (a) dielectric constant and (b) loss tangent of BT ceramics sintered using CV and MW techniques for 2 h and 0.5 h respectively.
Figure 9.
Frequency variation of (a) dielectric constant and (b) loss tangent of BT ceramics sintered using CV and MW techniques for 2 h and 0.5 h respectively.
Figure 10.
Frequency variation of dielectric constant and loss tangent of NZF ceramics sintered using CV and MW techniques for 2 h and 0.5 h respectively.
Figure 10.
Frequency variation of dielectric constant and loss tangent of NZF ceramics sintered using CV and MW techniques for 2 h and 0.5 h respectively.
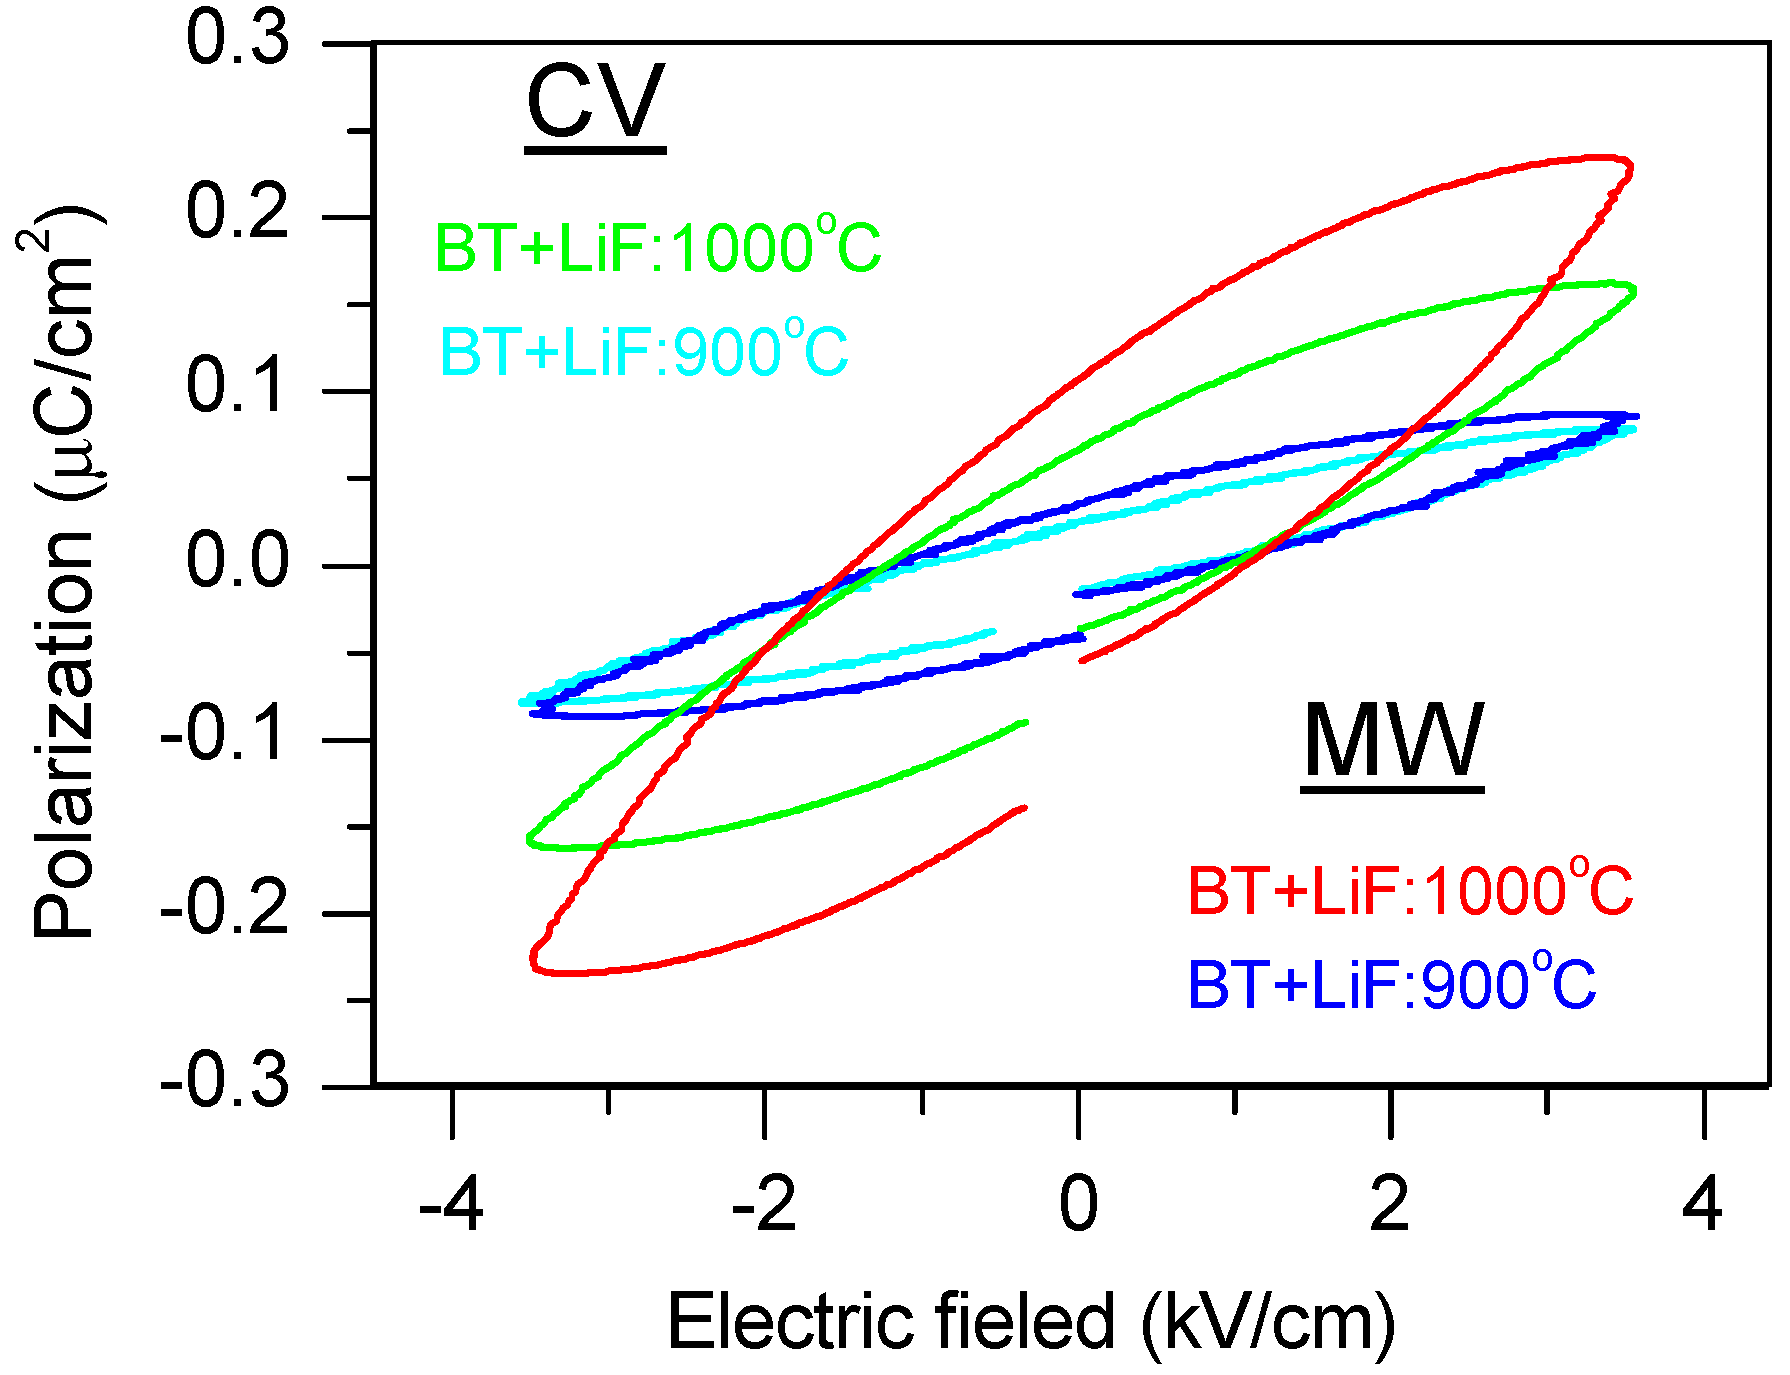
The room temperature P-E hysteresis loops of the BT samples sintered under various conditions are presented in
Figure 11. It can be seen that the polarization of BT samples MW-sintered at 1000 °C is the highest among all the studied specimens as recorded, although all the samples show poor ferroelectric properties. It can be observed that samples sintered at low temperatures end up with a leaky nature. BT + LiF samples also exhibit a leaky nature even when sintered at 900 °C, which is attributed to the leakage from lithium itself and/or porosity.
Figure 11.
Room temperature P-E hysteresis loops of BT ceramics sintered using CV and MW techniques.
Figure 11.
Room temperature P-E hysteresis loops of BT ceramics sintered using CV and MW techniques.
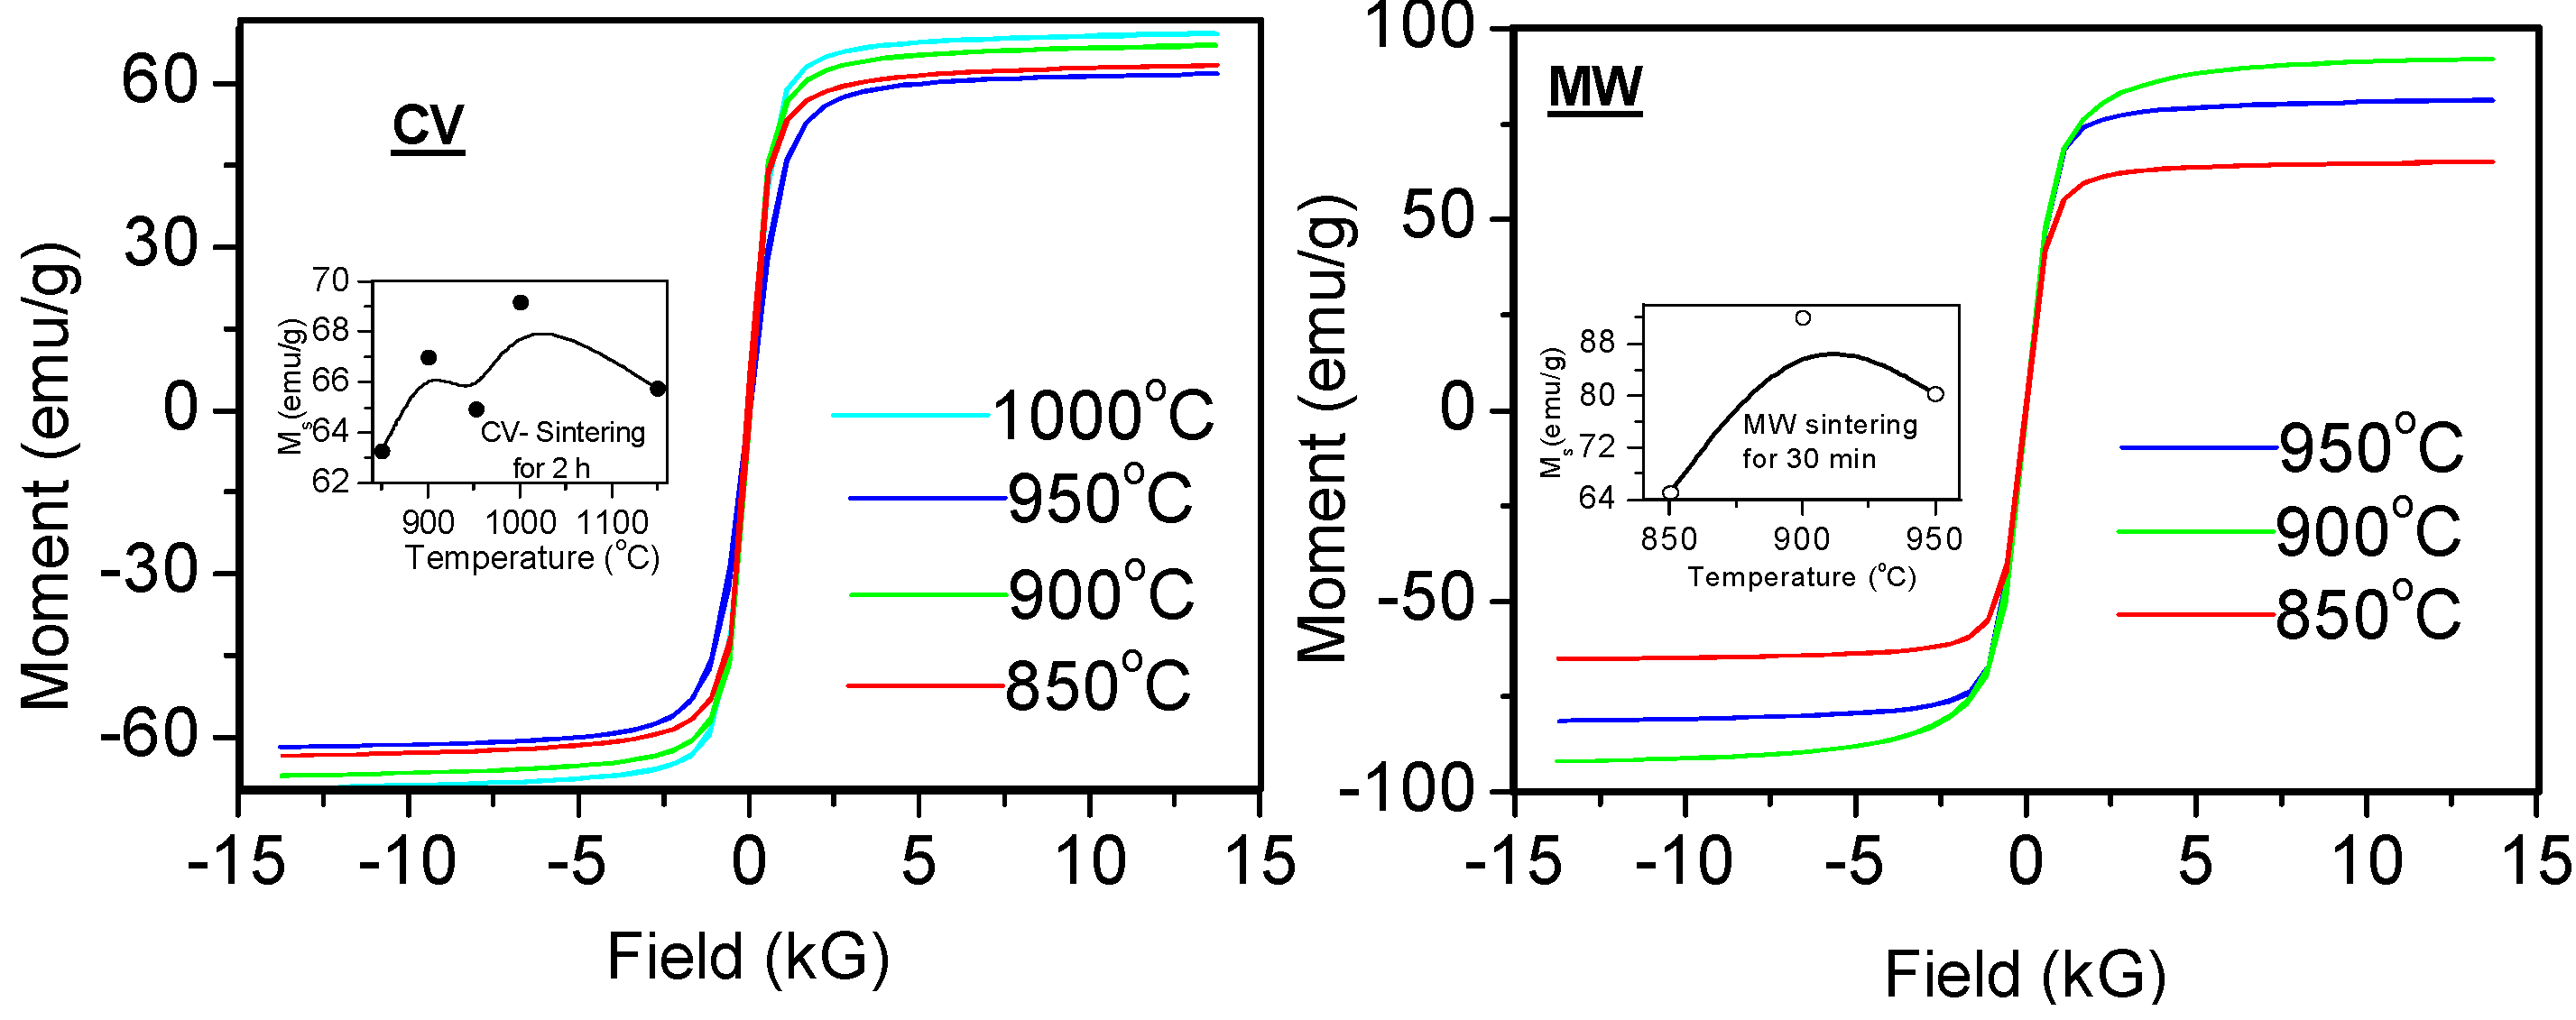
Figure 12.
Room temperature M-H loops of NZF ceramics sintered using CV and MW techniques.
Figure 12.
Room temperature M-H loops of NZF ceramics sintered using CV and MW techniques.
Figure 12 depicts the room temperature M-H loops of NZF ceramics sintered using CV and MW techniques. It can be observed that in CV sintered ceramics, the saturation magnetization (M
s) reaches its highest value of 68 emu/g at a sintering temperature of 1000 °C, whereas for MW sintered ceramics the highest value of M
s observed is 88 emu/g at a sintering temperature of 950 °C. Additionally, the M
s values for the MW sintered samples strongly correlate with the sintering temperature. This higher M
s value can be due to the 2.45 GHz MW field interacting with charged cations thus causing a change of Zn
2+ and Fe
3+ arrangements which are critical in the alteration of dipole moments [
16,
17].
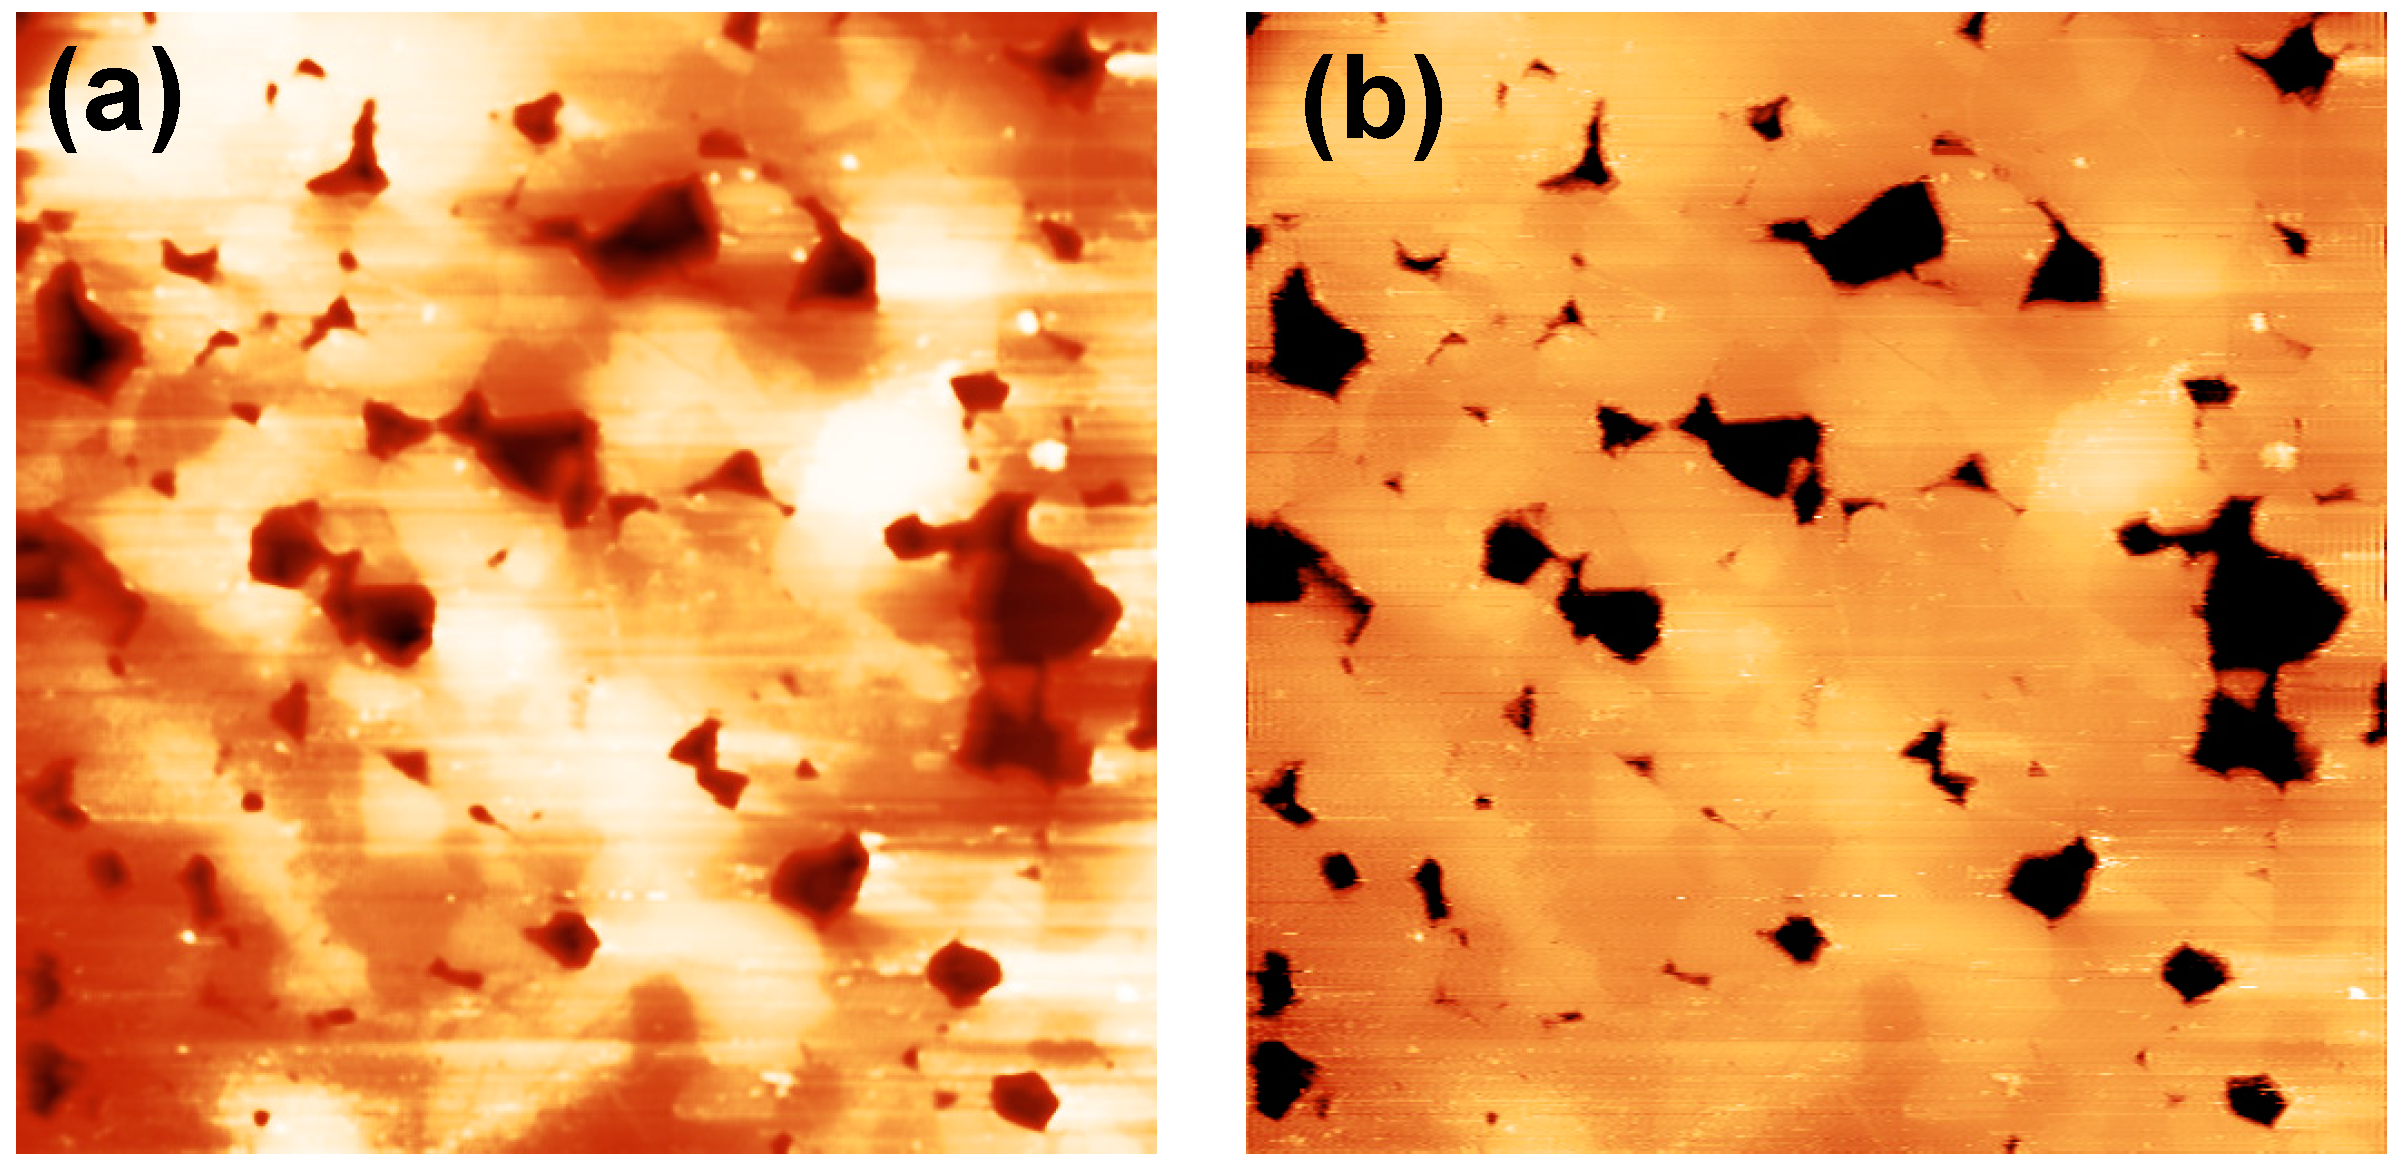
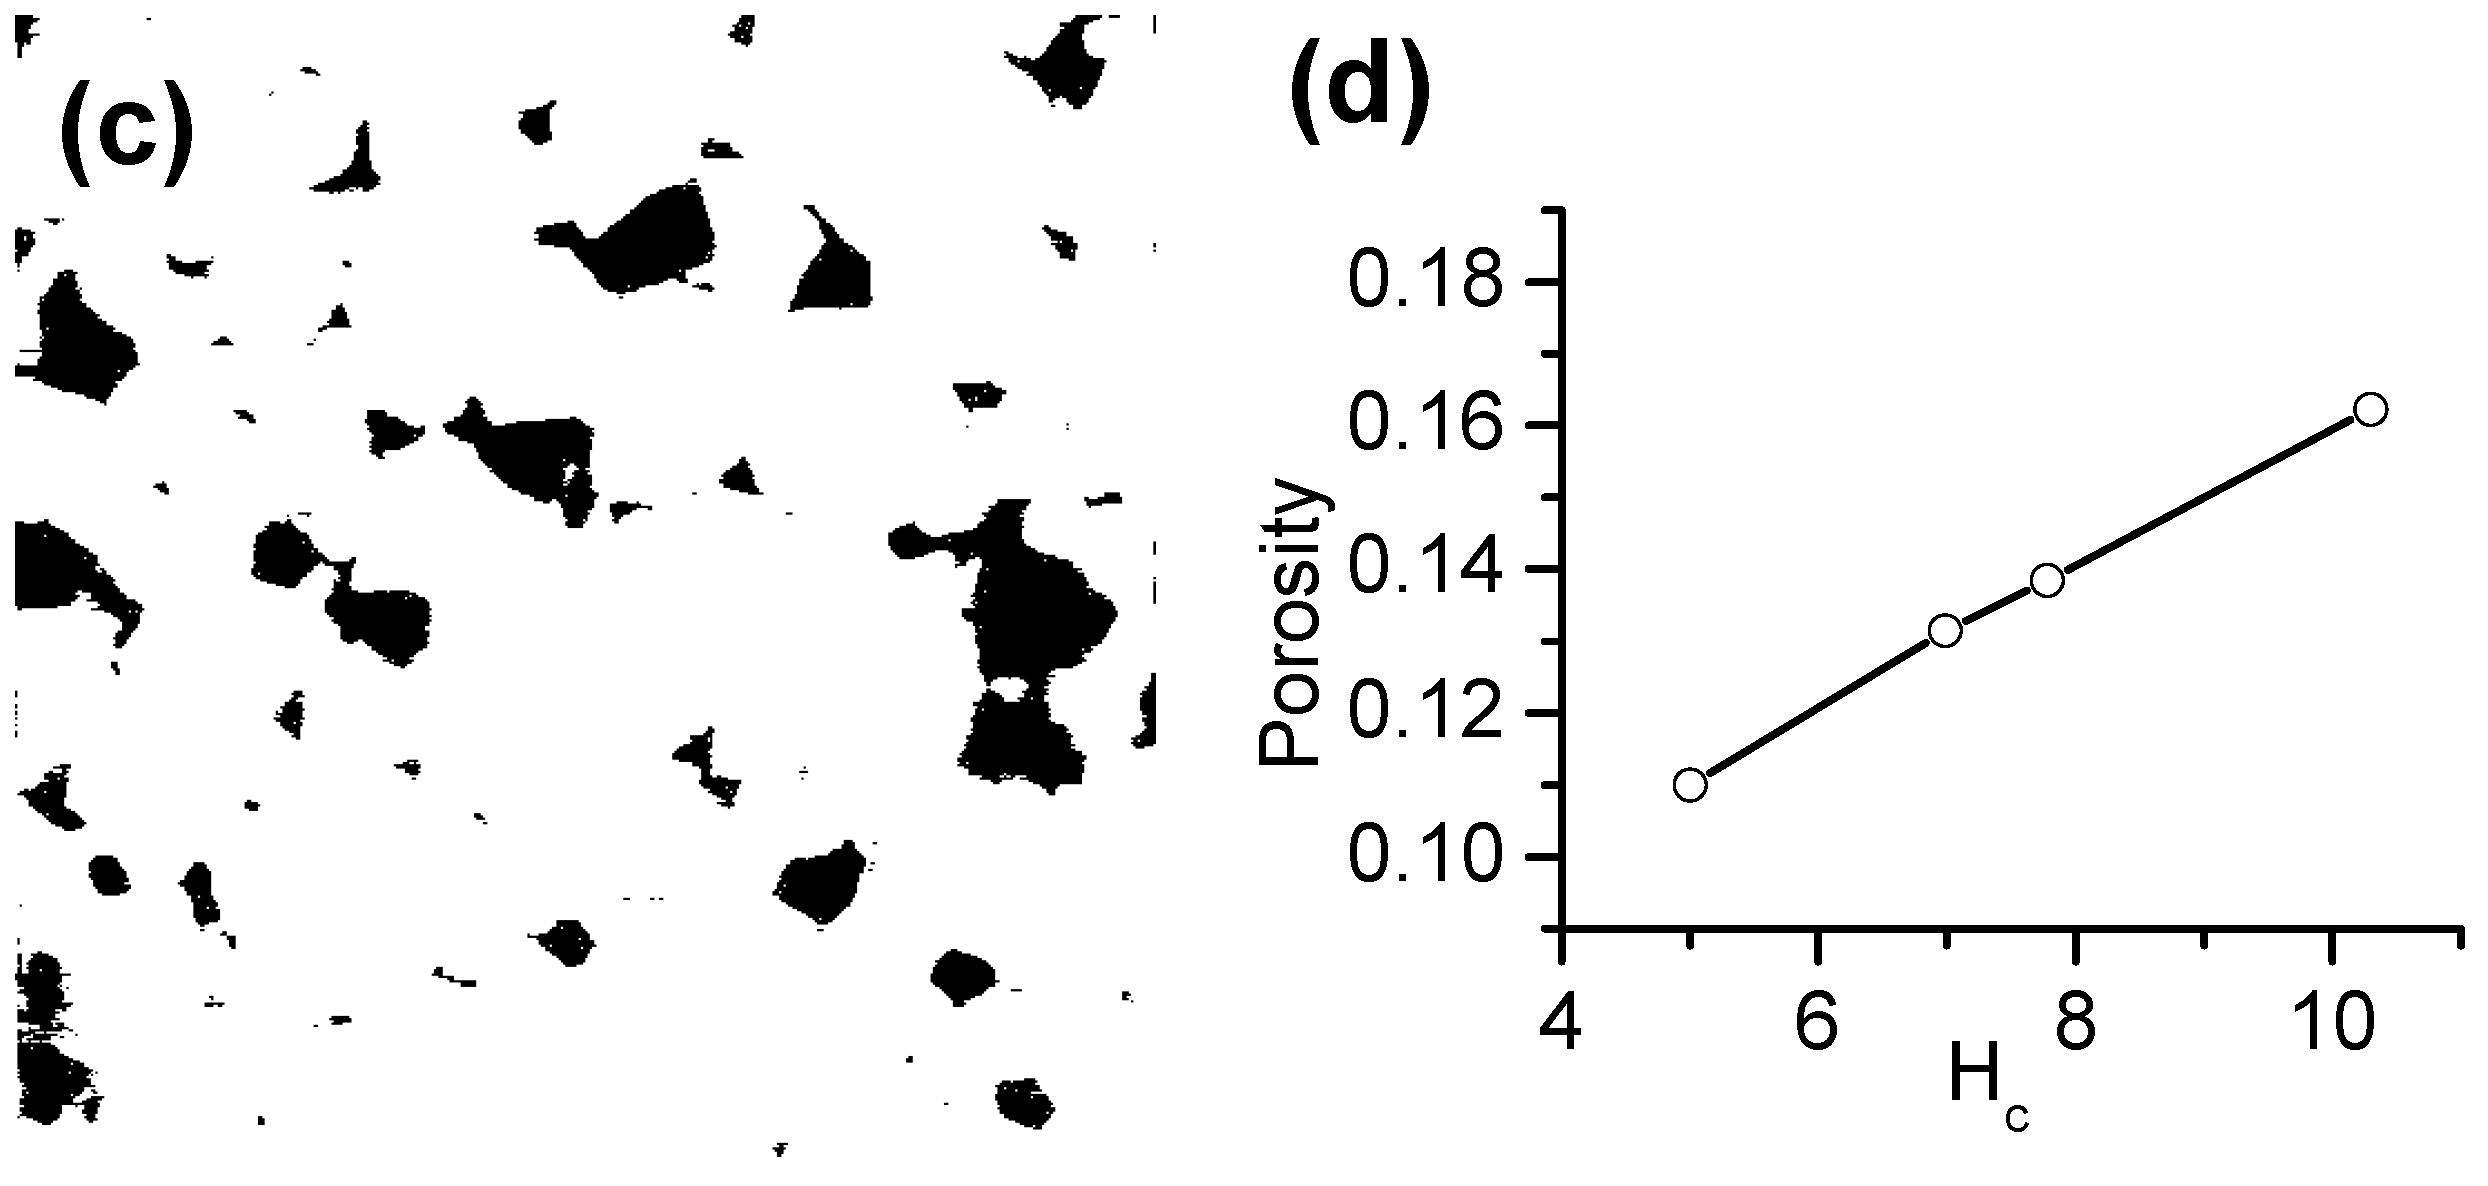
Figure 13.
(a) Raw AFM topography, (b) Flattened topography (undulations removed), (c) Thresholding, (d) Porosity vs. magnetic coercive field.
Figure 13.
(a) Raw AFM topography, (b) Flattened topography (undulations removed), (c) Thresholding, (d) Porosity vs. magnetic coercive field.
Using AFM topography we have estimated the statistical value of porosity in the sintered ceramics. The
Figure 13a–c depicts the AFM technique, which includes AFM raw topography, flattened topography (undulation removed) followed by thresholding. The percentage of voids is reflected as percentage of black pixels. Based on the estimated statistical data for NZF sintered ceramics, we have derived the relationship between the porosity and the magnetic coercive field as shown in
Figure 12d. Coercive force is probably the property most sensitive to porosity and grain size. The increase in coercive force with porosity is linear, as expected. Again, this effect may be caused by the fact that the high-porosity samples contain smaller particles, which have higher coercive force.


