Article

Re-Examining the Effects of Official Development Assistance on Foreign Direct Investment Applying the VAR Model

Graduate School of Advanced Integrated Studies in Human Survivability, Kyoto University, Kyoto 606-8306, Japan
*
Author to whom correspondence should be addressed.
Economies 2022, 10(10), 236; https://doi.org/10.3390/economies10100236
Submission received: 24 June 2022 / Revised: 26 August 2022 / Accepted: 13 September 2022 / Published: 23 September 2022

Abstract

:
This study re-examined the effect of official development assistance (ODA) of five major donor countries (France, Germany, Japan, the United Kingdom, and the United States) on foreign direct investment (FDI) using panel data from 2003 to 2020. In addition to the system Generalized Method of Moments (GMM) with the gravity model, the Granger causality test and impulse response analysis with the panel VAR model was conducted. It was concluded that ODA did not necessarily have an effect on FDI since the 2000s. It is also suggested that the vanguard effect of Japanese ODA, as indicated by some previous studies, appeared mainly in the 1990s and may not be sustainable. The novelty of this study is to verify the effects of the ODA of major donors on FDI using new data from the 2000s onward, especially to reveal that the vanguard effect of Japanese ODA has not been observed since the 2000s. A limitation of this study is to determine only the presence or absence of a general trend at a statistically significant level. Therefore, further research on individual cases is expected to find how ODA has affected the investment decisions of individual companies.

1. Introduction

Official development assistance (ODA) is a type of government assistance that specifically targets and promotes the economic development and welfare of developing countries (Organisation for Economic Co-operation and Development (OECD) 2020) and is an important means for developing countries to overcome bottlenecks in their own economic development. OECD (2002) has also promoted foreign direct investment (FDI) as a major driver of development, as it benefits both the investor and the invested countries and plays an essential role in an open and effective international economic system. Recent studies have also empirically demonstrated the link between FDI and economic growth (Cipollina et al. 2012; Haini and Tan 2022; Iamsiraroj 2016; Irshad and Qayed 2022; Razzaq et al. 2021).
The following four main effects of ODA on FDI have been identified: (1) the “infrastructure effect,” wherein ODA promotes FDI by improving the economic and social infrastructure of recipient countries (Harms and Lutz 2006); (2) the “vanguard effect” wherein ODA promotes FDI only from the same donor country by exclusively communicating information on the business environment of the recipient countries to the donor country’s private sector, by reducing investment risks in the recipient country that are subjectively perceived by the donor country’s companies, and by creating a more favorable business environment for the donor country’s companies (Kimura and Todo 2010); (3) the “rent-seeking effect” wherein ODA encourages unproductive rent-seeking activities, thereby suppressing FDI (Harms and Lutz 2006); and (4) the “crowding-out effect,” which means that if foreign capital is used only in the exportable sector and the import-competing sector is more capital-intensive than the public goods sector, an increase in ODA used to finance public goods would discourage FDI. Assuming full substitutability between foreign and domestic capital, if the import-competing sector is more capital-intensive than the exportable sector and the exportable sector is more capital intensive than the public sector, then ODA would substitute domestic capital for foreign capital and reduce the use of foreign capital (Beladi and Oladi 2006).
Empirical analyses of previous studies have generally found a rejection of the effect of ODA in promoting FDI (Harms and Lutz 2006; Kang et al. 2011; Kimura and Todo 2010; Liao et al. 2020). In contrast, some previous studies have shown the Japanese ODA’s effect on promoting FDI (Kang et al. 2011; Kimura and Todo 2010). Although studies have been conducted on the effect of ODA on FDI, there has not been sufficient analysis using new data since the 2000s. Is the vanguard effect that was observed only for Japanese ODA among major donor countries in the 1980s and 1990s still present in recent years? Moreover, what about infrastructure effects, rent-seeking effects, and crowding-out effects? To answer these questions, this study used panel data to analyze 32 countries in which five major donor countries (France, Germany, Japan, the United Kingdom, and the United States) provided both ODA and FDI between 2003 and 2020. The effect of ODA on FDI was estimated using the system generalized method of moments (GMM) with a gravity model similar to Kimura and Todo (2010). The Granger causality test with a panel VAR model was conducted to identify causality between ODA and FDI in the time series, and an impulse response analysis was also conducted to identify the dynamic impact of ODA on FDI. The rest of this paper is organized as follows: Section 2 is a literature review, Section 3 is an empirical analysis of the impact of ODA on FDI, Section 4 is a discussion of the impact of ODA on FDI, and Section 5 is a conclusion.

2. Literature Review

The nexus between FDI and economic growth has been empirically demonstrated. Cipollina et al. (2012) conducted an analysis using panel data for 14 manufacturing sectors in 22 developed and developing countries from 1992 to 2004. This analysis provided statistically significant and robust evidence on the effect of FDI on the economic growth of invested countries, finding that this effect is stronger in capital-intensive and technologically advanced sectors. Iamsiraroj (2016) used a simultaneous system of equations approach to investigate the relationship between FDI and economic growth using 124 cross-country data from 1971 to 2010. The estimation results showed that the overall effect of FDI is positively correlated with economic growth.
In recent studies, Haini and Tan (2022) examined the relationship between sectoral and industry-specific FDI inflows and economic growth, controlling for endogeneity using GMM, for a sample of 36 OECD countries from 2000 to 2019. The validation revealed that both manufacturing and services FDI contribute to economic growth and that the effect of manufacturing FDI is larger. Irshad and Qayed (2022) analyzed panel data for BRICS and ASEAN countries from 1993 to 2019. They revealed that FDI has a positive impact on economic growth in high-income countries, although the overall impact of FDI on economic growth is not clear.
However, empirical studies have generally found no FDI-promoting effect of ODA (Harms and Lutz 2006; Kimura and Todo 2010; Kang et al. 2011; Liao et al. 2020). Harms and Lutz (2006) estimated the effects of ODA on FDI by the method of least squares (OLS), two-stage least squares (2SLS), and GMM using panel data for 92 developing and emerging countries for the period 1988–1999. The estimation results revealed that ODA generally has no effect on FDI when the country’s institutional environment is controlled. By contrast, it was concluded that ODA has a positive effect on FDI in countries where private enterprise faces a large regulatory burden.
Kimura and Todo (2010) estimated whether ODA promotes FDI inflows by OLS and GMM with a gravity model using panel data for 227 country pairs, including major donor countries (France, Germany, Japan, the United Kingdom, and the United States) and 98 countries from 1990 to 2002. The analysis revealed that, in general, ODA does not have a significant impact on FDI. Meanwhile, they found that only Japan’s ODA has a “vanguard effect” that promotes its FDI. They considered that Japanese ODA attracts its FDI because the Japanese government provides information on the recipient countries to its private sector, and Japanese private enterprises could easily request assistance from the Japanese government to develop their activities in the recipient country.
Kang et al. (2011) examined the FDI-promoting effects of ODA by GMM using panel data of seven donor countries (France, Germany, Japan, Korea, the Netherlands, the United Kingdom, and the United States) paired with 24 recipient countries from 1980 to 2003. They revealed that ODA from donor countries other than Japan and Korea is a substitute for FDI rather than a complement to it. Particularly, they found that ODA from the Netherlands, which is considered to be humanitarian, has a very strong substitution effect on FDI. In contrast, they also showed that Japan and Korea’s ODA promote their own FDI in recipient countries. They discussed the possibility of a host country for Korea’s FDI as a key factor in Korea’s decision on where to provide its ODA, and therefore Korea’s ODA promotes its FDI in recipient countries.
Liao et al. (2020) conducted a time series and panel regression analysis on the effect of international development aid (IDA) received by Belt and Road (B&R) countries on FDI using a sample of B&R countries from 1970 to 2017. In the time series analysis, the vector error correction model (VECM) and impulse response functions were used to examine the effects of different types of IDA on FDI. By the panel regression analysis, the impact of total IDA received by B&R countries on FDI was comprehensively examined, including the direct impact of IDA on FDI and the moderating effect of the institutional environment.
The FDI-promoting effect of ODA has been observed in special circumstances such as post-conflict. Garriga and Phillips (2014) estimated whether ODA attracts FDI in post-conflict countries by OLS using data from 1973 to 2008. They found a signal effect of ODA from non-US countries which attracts FDI in post-conflict countries. They also argued that the effect of ODA is found to decrease with time after conflict, suggesting that the signal effect of ODA is specific to low-information environments. In contrast, they showed that only US ODA, motivated by geopolitics, has a warning effect that negatively affects FDI.
Regarding Chinese aid, Wang et al. (2022) examined the impact of Chinese aid on FDI and risk mitigation mechanisms using a sample of 124 countries assisted by China between 2000 and 2019. The analysis revealed that Chinese aid significantly reduces country risk in the recipient countries, especially political and financial risk, and contributes to promoting FDI. At the same time, they found that aid from countries other than China has a negative impact on China’s FDI in recipient countries. They also demonstrated that commercial aid promotes FDI more than development-oriented aid.
As mentioned above, although studies have been conducted on the effect of ODA on FDI, there has not been enough analysis using recent data. Therefore, this study re-examined the effect of ODA on FDI for five major donor country pairs and 32 recipient country pairs from 2003 to 2020.

3. Materials and Methods

3.1. The Generalized Method of Moments (GMM) Estimation with Gravity Model

This study first used an estimation equation that applied a gravity model to estimate the effect of ODA on FDI. The gravity model has been widely used since its application to FDI by Eaton and Tamura (1994) until recently (Cheng and Qi 2021; Mishra and Jena 2019). As an estimation method, the GMM estimation used in Kimura and Todo (2010), which pointed out the vanguard effect of Japanese ODA, and in recent studies (Ly-My and Lee 2019; Ouyang and Li 2018; Razzaq et al. 2021) is employed. Blonigen and Piger (2014) have systematically investigated the determinants of FDI and found that the variables used in the gravity model are the main determinants of FDI.
Traditionally, FDI is classified into vertical FDI as proposed by Elhanan Helpman (1984) and horizontal FDI as proposed by Markusen (1984). Vertical FDI is an investment in which parts of the production and marketing processes are transferred to countries with lower costs. On the contrary, horizontal FDI is an investment in which the production and marketing process is replicated outside the country, mainly when exporting is difficult owing to transportation costs and trade barriers. Blonigen and Piger (2014) pointed out that the traditional gravity model does not capture the motivation for vertical FDI, which is to find low-cost locations for labor-intensive production. Therefore, the gravity model in this paper incorporates GNI per capita of recipient countries as a variable to capture the motive for vertical FDI.
In addition, Karakaplan et al. (2005) demonstrated that one condition for aid to induce FDI is good governance in the recipient country, and in this estimation, an indicator of good governance in the recipient countries was added to the gravity model as a variable.

3.1.1. Estimation Equation

The following model was used in this study:
l n   F D I i j t = ρ   l n   F D I i j t 1 + β 1   l n   A I D i j t 1 + β 2   l n   G D P i t 1 + β 3   l n   G D P j t 1 + β 4   l n   G O V j t 1 + β 5   l n   G N I p j t 1 + β 6   l n   D I S T i j + α i j + μ t + ε i j t
In Equation (1), subscripts i, j, and t denote the donor country, recipient country, and period (year), respectively. ρ and β are coefficients. To account for the time lag in the impact of the explanatory variables on FDI, three-year moving average data were used for the variables, and each explanatory variable was lagged by one. The dependent variable, l n   F D I i j , is the natural logarithm of FDI inflows from a donor country i to a recipient country j, and the main explanatory variable, l n   A I D i j , is the log of the real disbursement of ODA from country i to j. l n   G D P i and l n   G D P j is the log of real GDP in country i and j, l n   G O V j is the log of the sum of six indicators derived from Kaufmann et al. (2010) expressing the good governance of country j, and l n   G N I p j is the log of real GNI per capita in country j. l n   D I S T i j is the log of the distance between the capitals of country i and j.   α i j ,   μ t ,   ε i j t are country pair fixed effects, year effects, and the error term, respectively. Kimura and Todo (2010) used the log difference in GDP per capita between the donor and recipient countries instead of the log of real GNI per capita in recipient countries to capture the motive for vertical FDI. However, when the log difference in GDP per capita between the donor and recipient countries was used in this estimation instead of the log of real GNI per capita, the log difference was not significant; therefore, the log of real GNI per capita was used in this estimation.
When converting to natural logarithms, the data must be greater than or equal to 1 before conversion. However, as the minimum value of the FDI data covered by this study was less than 0, the value at which the minimum value of the FDI data was equal to 1 was added uniformly to all FDI data before converting to the natural logarithm. The same conversion was performed for other variables.
To estimate the effects of different types of ODA, the aid variables were divided into several patterns. First, to estimate the overall ODA effectiveness, the total ODA ( A I D _ A l l j ) from all members of the Development Assistance Committee (DAC) of the OECD to country j was used. Second, to estimate infrastructure effects, ODA for the infrastructure sector from all DAC member countries to country j ( I N F _ A l l j ) and ODA for non-infrastructure sectors ( N I N F _ A l l j ) were distinguished. Third, to estimate the different effects of ODA from five major donor countries (France, Germany, Japan, the United Kingdom, and the United States) to country j , the aid variables were divided into the same patterns ( A I D i j ,   I N F i j ,   N I N F i j ). Finally, each major donor country’s ODA was divided in the same way to estimate whether ODA from each donor country promotes its FDI.

3.1.2. The GMM Estimation

This study estimated the effect of ODA on FDI using GMM proposed by Arellano and Bover (1995) and Blundell and Bond (1998). It is a general estimation method that encompasses a variety of estimation methods. OLS, 2SLS, and the method of instrumental variables (IV), which are frequently used in econometric analysis, are special forms of GMM. There are several estimation methods for GMM, such as first difference GMM and level GMM. This study used the system GMM developed by Blundell and Bond (1998) to solve the weak correlation problem of instrumental variables, which has been pointed out as a problem of GMM, and the initial value problem, which has been an issue in dynamic analysis using panel data.
All explanatory variables except the bilateral distance and pair fixed effects and year effects were considered endogenous variables and lagged endogenous variables were used as instrumental variables. Panel data analysis introduces bias in estimation because the variance of errors is not uniform. Therefore, this study followed Windmeijer (2005) to obtain robust standard errors. Accordingly, the estimator is consistent in the presence of heteroskedasticity and corrects for the finite sample bias found in two-stage estimation. In addition, we employed a two-step estimation method, which is more efficient than one-step estimation.
Furthermore, the GMM assumes that the instrumental variables satisfy the orthogonality condition with the error term and that the error term is not autocorrelated. Therefore, the Hansen J tests on the validity of the instrumental variables and the Arellano–Bond tests on the autocorrelation of the error term were performed to confirm that the estimation assumptions were met. The variance inflation factor (VIF) was also checked to confirm the multicollinearity of the model. To conduct the GMM, Stata 16 was used.

3.2. Estimations with Panel VAR Model

For the aid variables that yielded significant results in the GMM estimation, using the panel VAR model, this study verified the causality from ODA to FDI by the Granger causality test and investigated the dynamic impact of ODA on FDI by the impulse response analysis. Granger causality tests with the panel VAR model have been used in many studies in recent years to reveal causal relationships (Ali et al. 2021; Aslan et al. 2022; Kim et al. 2018; Morshed and Hossain 2022). The gravity model has the disadvantage of being highly arbitrary because it specifies regularities based on theory. To compensate for this disadvantage, the panel VAR model, an autoregressive approach with relatively low arbitrariness, was chosen. To conduct the estimations with the panel VAR model, EViews 12 was used.

3.2.1. Panel VAR Model

This study estimated the following simultaneous equations:
[ x i j t y i j t ] = [ μ i j x μ i j y ] + Γ 1 [ x i j t 1 y i j t 1 ] + Γ 2 [ x i j t 2 y i j t 2 ] + + Γ p [ x i j t p y i j t p ] + [ ε i j t x ε i j t y ] Γ k = [ Γ k x , x Γ k y , x Γ k x , y Γ k y , y ] ,   k = 1 , ,   p
In Equation (2), x is the aid variable, and y is the FDI variable. In addition, μ is the constant term, Γ is the coefficient, ε is the error term, and p is the lag order. The subscripts i, j, and t denote the donor country, recipient country, and period (year), respectively. The optimal value for p was adopted based on the Akaike Information Criterion (AIC) (Akaike 1998). Wooldridge (2012) recommends that the lag order be 1 or 2 when the data are annual data. Therefore, this study used lags 1 or 2 with the smallest AIC values in the VAR model.

3.2.2. Panel Unit Root Test

When constructing a panel VAR model, a unit root test should be performed. If the variables used in the model are stationary, they are incorporated directly into the panel VAR model; if they have unit roots, they are converted to first difference before being incorporated into the panel VAR model.
In this study, the LLC (Levin et al. 2002) was performed as a unit root test. The LLC examines the null hypothesis that the variable contains a unit root, so a rejection indicates that the variable is stationary. For the lag order, the optimal lag order based on the AIC was automatically determined using the automatic determination function of the statistical software, EViews 12. For each variable, the panel unit root test was first performed on level data. If the test did not reject the null hypothesis at the 5% level, the data were transformed to first difference and tested again.

3.2.3. Panel Granger Causality Test

This study performed a panel Granger causality test, which states that if variable Y is conditioned on the past value of variable X, then variable X causes variable Y because the future cannot predict the past and the cause does not precede the effect. In the Granger causality test, for example, the null hypothesis that “there is no Granger causality from x to y” can be expressed as in Equation (3) (Rossi and Wang 2019):
H 0   :   Γ 1 y , x + Γ 2 y , x + + Γ p y , x = 0
Granger causality tests, traditionally used for time series data, have recently been extended to panel data (Erdil and Yetkiner 2009; Hsiao and Hsiao 2006; Juodis et al. 2021; Kim et al. 2018; Pradhan et al. 2014; Rezitis 2015; Stock and Watson 2001). In this study, panel data were treated as a single dataset and estimated in a manner that assumes that coefficients are common across all cross-sections. This method provides an overall direction for Granger causality in the target countries (Kim et al. 2018).

3.2.4. Impulse Response Analysis

Impulse response analysis was conducted on the aid variables that were significant as a result of the GMM estimation in order to clarify the dynamic impact of the aid variables on FDI. The impulse response analysis graphically depicts the 10-year variation in how FDI was affected after an impact of one standard deviation on the error term (innovation) of the aid variable. The percentile method of Efron and Tibshirani (1993) was used to obtain 95% confidence intervals.

3.3. Data

This study used panel data for 32 recipient countries (Table A1) of which five major donors (France, Germany, Japan, the United Kingdom, and the United States) provided both ODA and FDI. Panel data analysis is expected to improve estimation accuracy because it greatly increases the number of observation points, as compared to analyses using only cross-sectional or time series data. It also enables estimation that considers differences among countries.
The data were obtained for the years between 2003, the earliest year for which ODA data by sector is available, and 2020, the most recent year. Since the FDI statistics changed from Benchmark Definition 3rd Edition (BMD3) to Benchmark Definition 4th Edition (BMD4) in 2014, for the continuity of data, this study estimated the data separately from 2003 to 2013 and from 2014 to 2020. For countries other than Japan, data for 2013 were not used in this study because they were not available in BMD3. Table 1 shows the description of the variables.
FDI data were obtained in nominal values from BMD3 and BMD4 of OECD.Stat, and aid data were obtained in nominal values from the Creditor Reporting System (CRS) of OECD.Stat. To construct real values, nominal values were divided by the ratio of nominal GDP to real GDP of recipient country j, for which the base year is 2015, taken from the World Development Indicators (WDI). GNI per capita for country j was also obtained from WDI, governance indicators for country j from the Worldwide Governance Indicators (WGI), and geographic distances between country i and j calculated by CASIO calculator (available at https://keisan.casio.com/exec/system/1317262499).
The CRS shows detailed information on ODA, which is coded by type. ODA coded as 900s on CRS are not relevant to this study because they include administrative costs in donor countries and awareness-raising costs for ODA in donor countries, so they were excluded. ODA for infrastructure and non-infrastructure was distinguished as follows. Harms and Lutz (2006) noted that “infrastructure” includes economic and social infrastructure. Therefore, this study included the following as ODA for infrastructure: aid for social infrastructure, which incorporates aid related to education and health (CRS code 100s); aid for economic infrastructure, which comprises transportation, energy, and finance (CRS code 200s); aid for productive activities such as agriculture, manufacturing, and mining (CRS code 300s); and aid for multiple sectors (CRS code 400s). Moreover, ODA for non-infrastructure included general financial assistance and food aid (CRS code 500s); debt-related measures (CRS code 600s); and emergency assistance (CRS code 700s).
During the study period, the five donor countries (France, Germany, Japan, the United Kingdom, and the United States) accounted for about 60% of all ODA from all DAC member countries to the 32 recipient countries included in this study. The data covered by this estimate accounted for 36%, 45%, 54%, 25%, and 24% of all ODA from France, Germany, Japan, the United Kingdom, and the United States to all developing countries, respectively.

4. Results

4.1. Results of GMM Estimation with the Gravity Model

In this section, the impacts of (1) ODA from all donor countries on FDI from major donor countries; (2) ODA from the five major donor countries on their respective FDI; (3) ODA from each major donor country on FDI from major donor countries; and (4) ODA from each major donor country on their own FDI were examined for the period from 2003 to 2013 and from 2014 to 2020, respectively.
In Table 2, Table 3, Table 4, Table 5, Table 6, Table 7, Table 8 and Table 9, the numbers listed for each variable represent coefficients and the numbers in parentheses represent corrected standard errors. If the number of lags used as control variables was too large, it was adjusted by specifying the number of lags. In the table, the lag option (p q) indicates that lags from time t-p to t-q or the collapse option were used. The Arellano–Bond and Sargan–Hansen tests are shown as p-values, respectively. To check for multicollinearity in each model, VIF was examined. If VIF is greater than 10, there is multicollinearity, which may distort the estimation results.
In all GMM estimations presented in Table 2, Table 3, Table 4, Table 5, Table 6, Table 7, Table 8 and Table 9, the Arellano–Bond and Sargan–Hansen tests were not rejected at less than a 5% level, and therefore, each model was judged to meet the assumptions of the GMM estimations.

4.1.1. Impact of ODA from All Donor Countries on FDI

First, the estimates for the impact of total ODA from all donor countries ( A I D _ A l l j ), ODA for infrastructure ( I N F _ A l l j ), and for non-infrastructure ODA ( N I N F _ A l l j ), were conducted. All explained variables are FDI from major donor country i to recipient country j ( F D I i j ). GMM estimation results showed that none of the aid variables were significant at less than a 5% level (Table 2). The results of Table 2 (6) may be distorted because the VIF was more than 10.

4.1.2. Impact of ODA from Major Donor Countries on Their Own FDI

Thereafter, the impacts of total ODA ( A I D i j ), ODA for infrastructure ( I N F i j ), and ODA for non-infrastructure ( N I N F i j ) from major donor country i to recipient country j on FDI were estimated. All explained variables are FDI from major donor country i to recipient country j ( F D I i j ). According to Table 3, VIF was less than 10 in all cases, thus there were no multicollinearity problems. The GMM estimation results showed that none of the aid variables were significant.

4.1.3. Impact of ODA from Each Major Donor Country on FDI

In addition, the effects of ODA by each major donor country were estimated and the results are shown in Table 4. All explained variables are FDI from major donor country i to recipient country j ( F D I i j ). Table 4 shows only the main explanatory variables. In the table, subscripts FR, GM, JP, UK, and the US denote France, Germany, Japan, the UK, and the US, respectively. For example, in the second row in Table 4 (1), A I D F R j indicates the total amount of ODA from France to country j. When the VIF was examined, it was found that the VIF exceeded 10 in Table 4 Column (1)–(3), and the results might be distorted. Therefore, this study focused only on the results of Table 4 Column (4)–(8). Table 4 Column (4) shows that the effect of Japanese ODA for non-infrastructure sectors on FDI was negatively significant.

4.1.4. Impact of ODA from Each Major Donor Country on Their Own FDI

Finally, this paper further examines the impact of each country’s ODA on its respective FDI (Table 5, Table 6, Table 7, Table 8 and Table 9). Table 5, Table 6, Table 7, Table 8 and Table 9 show only the main explanatory variables. The estimation results were not significant for any of the aid variables with p-values less than 0.05, and the VIF for all models was less than 10.

4.2. Results of Granger Causality Test with Panel VAR Model

This study used a panel VAR model to examine the negative impact of Japanese ODA for non-infrastructure sectors on FDI from 2003 to 2013, which was significant in the GMM estimation.

4.2.1. Results of Panel Unit Root Tests

The results of the panel unit root tests are presented in Table 10. For all variables, all tests were rejected with p-values less than 0.05. Therefore, all were judged to be stationary processes.

4.2.2. Results of Lag Length Selection

Table 11 shows the AIC values for the panel VAR model in Equation (2) when y i j = F D I i j and x i j = N I N F J P j . The lag with the lowest AIC value was used in the Granger causality test and the impulse response analysis.

4.2.3. Results of Panel Granger Causality Test

The results of the panel Granger causality tests are presented in Table 12. Table 12 shows that the result of the Granger causality test was not significant with a p-value less than 0.05.

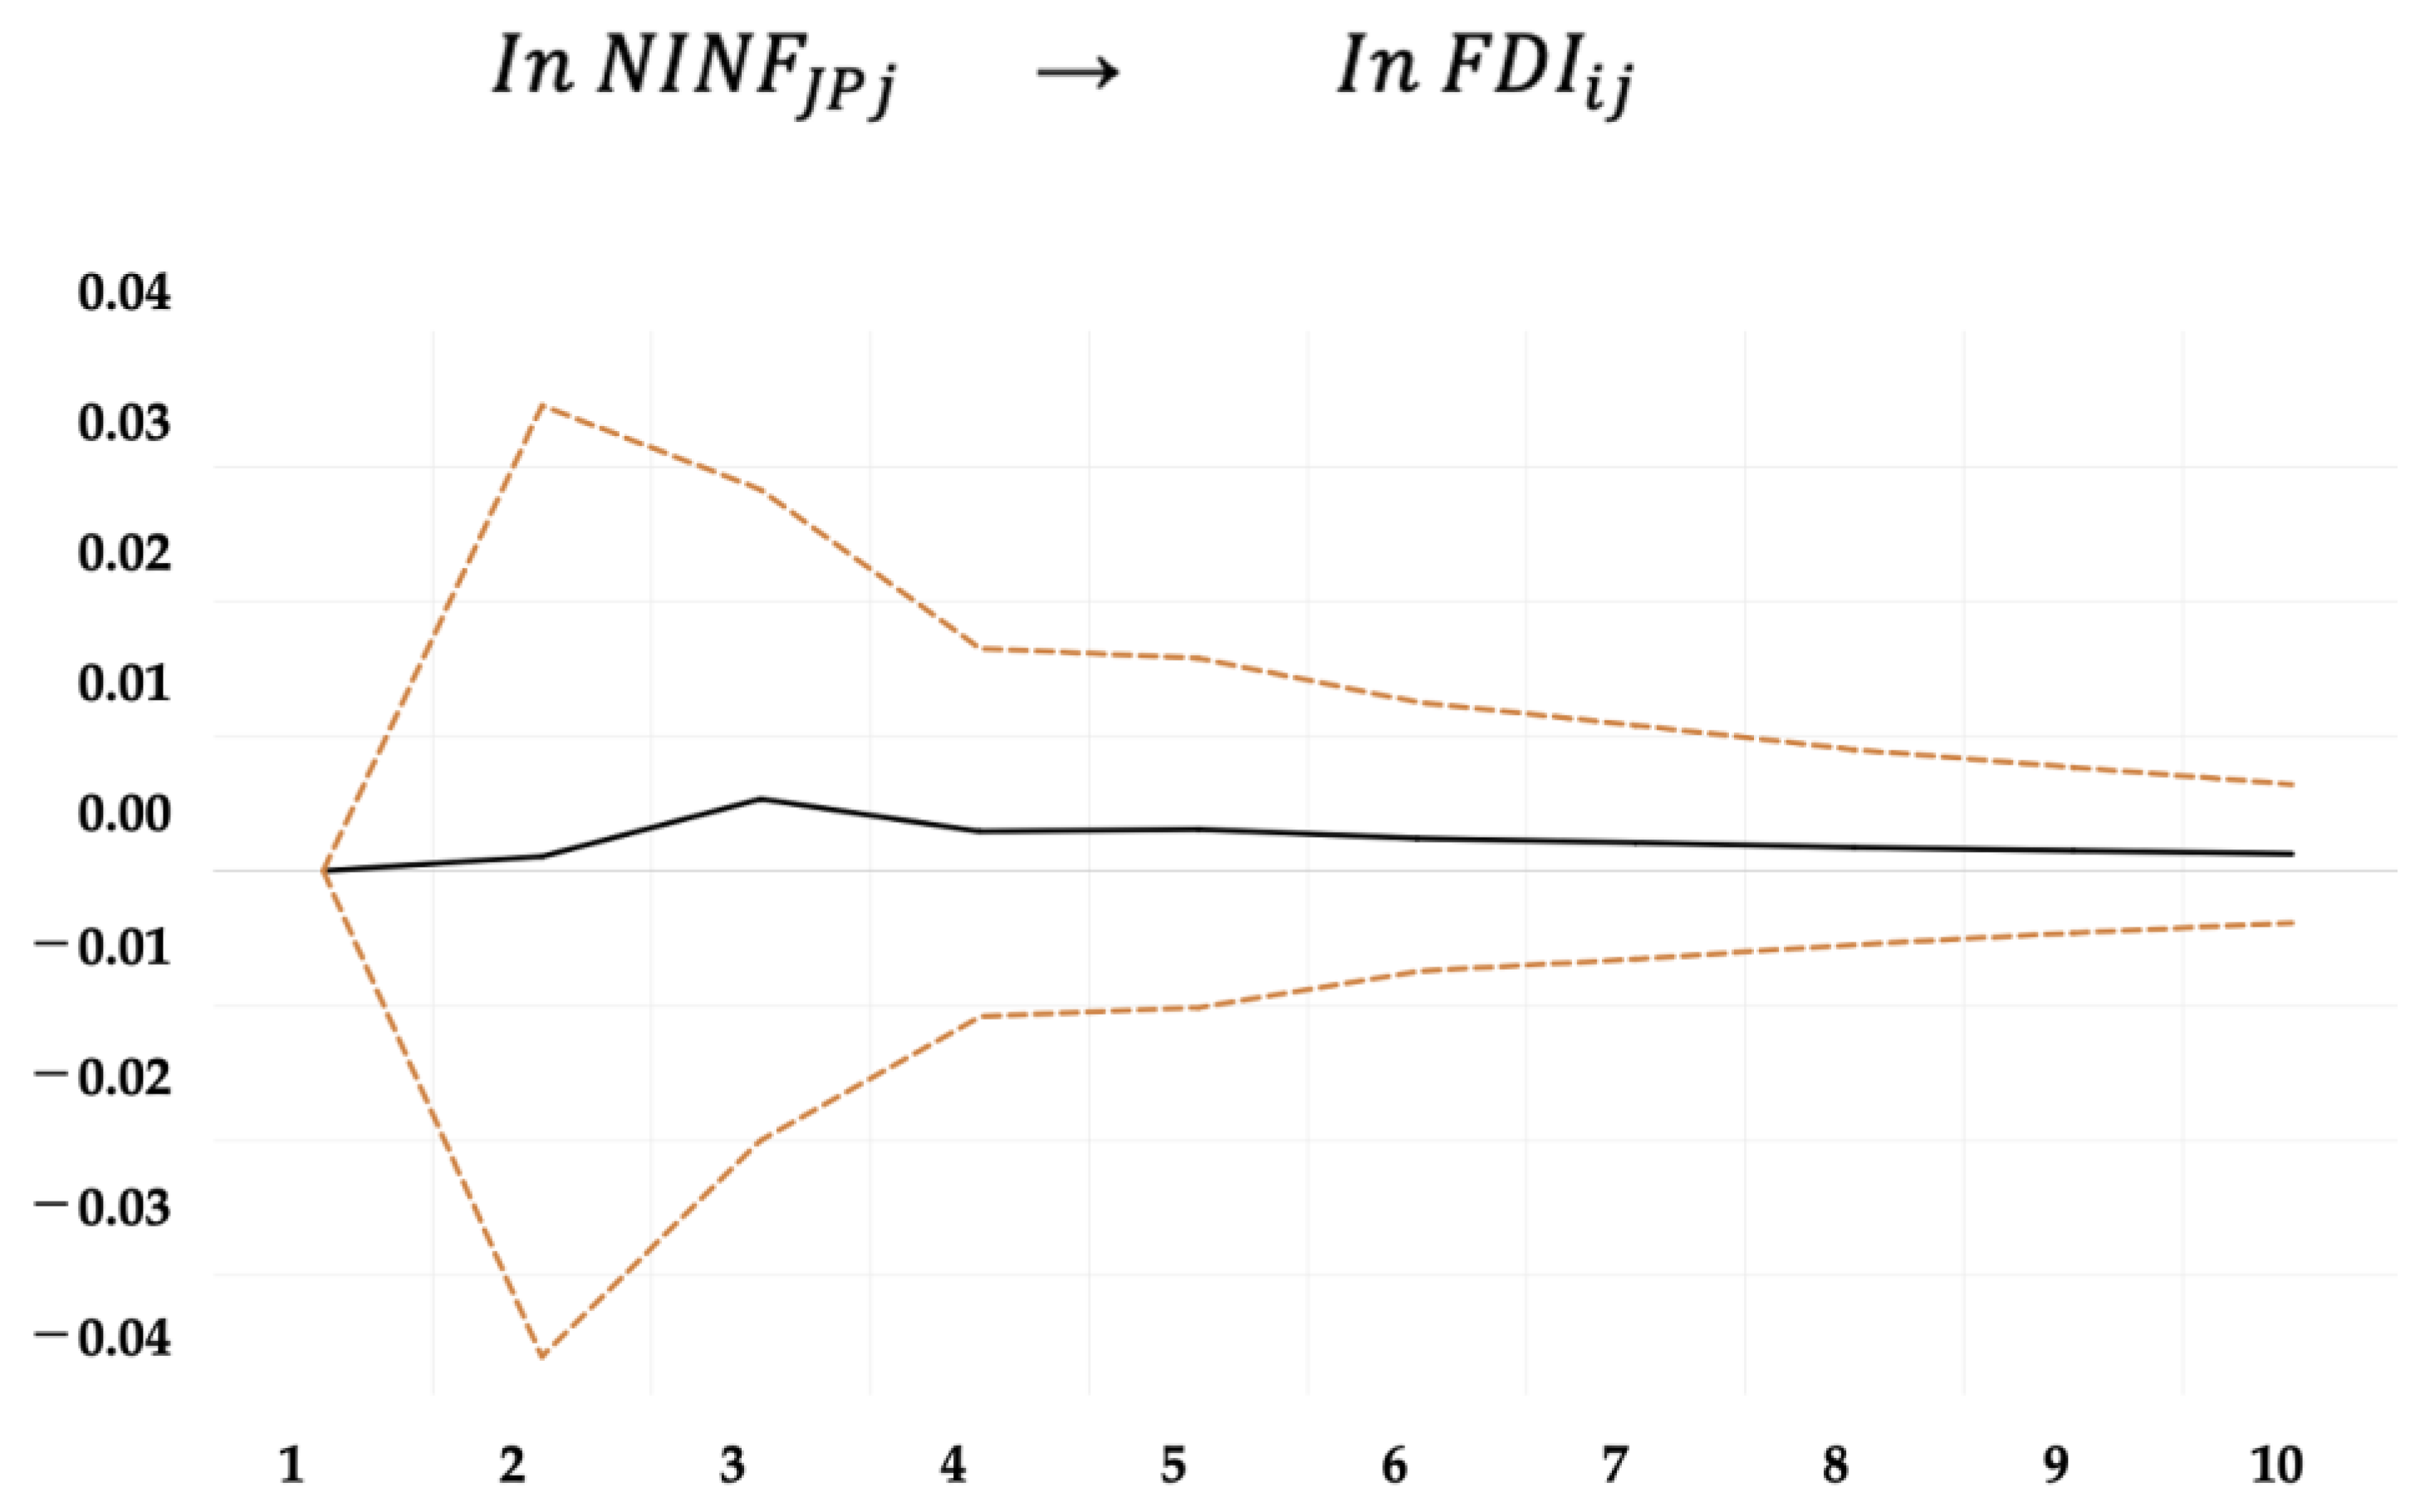
4.2.4. Results of Impulse Response Analysis

Figure 1 presents the result of the impulse response analysis. In Figure 1, when the error term (innovation) of the variable x was subjected to a shock with a standard deviation of 1, the variation in variable y was shown on the vertical axis, and the time (years) elapsed since the shock, on the horizontal axis. In the impulse response analysis, y = l n   F D I i j and x = l n   N I N F J P j .
According to Figure 1, the result of impulse response analysis on the impact of Japanese ODA for non-infrastructure sectors ( l n   N I N F J P j ) on FDI ( l n   F D I i j ) was not significant.

5. Discussion

Using data for the period 2003–2020, the impact of ODA on FDI from donor countries to recipient countries was examined, and the GMM estimations showed that the only negative effect of Japanese ODA for non-infrastructure sectors on FDI from major donor countries to recipient countries was significant. Furthermore, the effect of Japanese ODA for non-infrastructure sectors on FDI was verified using a panel VAR model, and it was not significant in both the Granger causality test and the impulse response analysis. This section discusses the results of this study.

5.1. Negative Effect of Japanese ODA for Non-Infrastructure Sectors on FDI from Major Donor Countries

The results of GMM estimation were significant regarding the impact of Japan’s ODA for non-infrastructure sectors on FDI between 2003 and 2013, whereas that of the Granger causality test and the impulse response analysis were not.
One reason for this may be the timing of the downward trend in Japan’s ODA for non-infrastructure sectors coinciding with the timing of the upward trend in FDI from major donor countries to recipient countries. Figure 2 shows the flow of the total amount of FDI from the five major donor countries to recipient country j used in this estimation and the flow of Japan’s ODA for non-infrastructure sectors. From Figure 2, FDI from major donor countries to recipient countries is on an upward trend, whereas Japan’s ODA for non-infrastructure sectors increased sharply only in 2005 but is on a downward trend as a whole. Therefore, it is possible that GMM estimation and the Granger causality test were significant because the estimation period in this study happened to be a period with trends in the opposite direction.
Did Japanese ODA for non-infrastructure sectors really have no negative effect on FDI from major donor countries to recipient countries? Figure 3 shows the breakdown of Japanese ODA for non-infrastructure sectors and Figure 4 shows Japan’s ODA flows for non-infrastructure sectors. Figure 3 indicates that “Action Relating to Debt” accounts for about 70% of Japan’s ODA for non-infrastructure sectors. However, China and other East Asian countries that have attracted a lot of FDI since the 2000s are not subject to Japanese action relating to debt (Ministry of Foreign Affairs of Japan 2016), and there may not be a direct causal relationship between Japanese ODA for non-infrastructure sectors and FDI from major donor countries to recipient countries. By contrast, if Commodity Assistance had a negative effect on FDI, it would be consistent with Selaya and Sunesen (2012) and Liao et al. (2020), who pointed out that physical capital assistance that directly contributes to the productive sector crowds out FDI. However, if Japan’s ODA for non-infrastructure sectors was indeed crowding out FDI, the Granger causality test and the impulse response analysis should also be significant. Therefore, it cannot be concluded from the results of this study that Japan’s ODA for non-infrastructure sectors had a negative impact on FDI.

5.2. Vanguard Effect of Japanese ODA

In this study, the vanguard effect of Japanese ODA, as indicated by some previous studies (Kang et al. 2011; Kimura and Todo 2010), was not significant. Kimura and Todo (2010) reported (i) the Japanese government’s deliberate use of ODA to promote FDI in recipient countries and (ii) the close collaboration between the public and private sectors as reasons why Japanese ODA has promoted FDI. However, looking at all versions of the ODA Charter (formulated in 1992 and revised in 2003 and 2015), which established Japan’s ODA policy, Asia—a major investment destination for Japan—was consistently identified as a priority region, and the policy of public–private partnerships was also consistent (Ministry of Foreign Affairs of Japan 1992, 2004c, 2015). The reasons for the change in ODA strategy and the public–private split, as suggested by Kimura and Todo (2010), cannot explain why this study could not find the vanguard effect of Japanese ODA. In other words, there may be reasons other than ODA strategies and public–private partnerships that Japanese ODA has the effect of promoting its FDI. This section discusses possible hypotheses.
The first hypothesis is that the results of this study do not deny the vanguard effect of Japan’s ODA, but show that ODA is effective in promoting FDI only in the early stages of investment in recipient countries. Japan experienced a surge in FDI as a result of the Plaza Accord in 1985, which led to a significant appreciation of the yen (Mihut 2014). The period analyzed by Kimura and Todo (2010), 1990–2002, can be referred to as the initial stage of the expansion of Japanese FDI. Kimura and Todo (2010) suggested the following reasons for the vanguard effect: (i) through ODA from a donor country, information about the recipient country’s business environment is exclusively communicated to private enterprises of the donor country, (ii) the ODA reduces the subjective perception of investment risk in the recipient country by private enterprises of the donor country, and (iii) the ODA may bring the donor country-specific business practices, rules, and systems to the recipient countries. In each case, the vanguard effect of ODA is more likely to be realized in the early stages when private enterprise has not yet fully established a relationship with the recipient countries.
The second hypothesis is that external factors coincidentally produced similar trends in Japanese FDI and ODA during the period analyzed in previous studies, but such trends disappeared during the period estimated in this study, and thus the FDI-promoting effects of Japanese ODA could not be found. Figure 5 shows the flow of Japan’s ODA and FDI to the countries covered in this paper. In Figure 5, FDI data were obtained in nominal value from BMD3 and BMD4 of OECD.Stat and ODA data were derived in nominal value from the CRS of OECD.Stat. The nominal value was converted to real value by dividing them by the ratio of nominal GDP to real GDP of the recipient countries taken from the WDI.
Figure 5 shows an upward trend in both Japanese FDI and ODA from 1985 to the mid-1990s. The Plaza Accord in 1985 led to a significant appreciation of the yen, which caused Japan to increase its FDI rapidly (Mihut 2014). On the contrary, domestic and international calls to increase Japanese ODA were growing because Japan was the world’s second-largest economy and was experiencing economic growth (Ministry of Foreign Affairs of Japan 2004b). In other words, the increase in Japan’s FDI and ODA from 1985 to the mid-1990s was largely due to external factors.
The collapse of the bubble economy in the early 1990s left Japan in a difficult situation of long-term budget deficits and economic stagnation. Owing to this (Ministry of Foreign Affairs of Japan 2004a), the amount of ODA peaked in 1997 and subsequently declined (Ministry of Foreign Affairs of Japan 2021) when viewed in terms of the budgeted amount in yen. In addition, FDI in non-manufacturing sectors, such as finance and insurance, services, and real estate, declined significantly after the burst of the bubble economy, and FDI in Asia also declined because of the 1997 Asian currency crisis (Japan External Trade Organization 2014). In other words, Japan’s FDI and ODA peaked in the late 1990s owing to external factors.
Furthermore, it is important to note that the trends of Japan’s FDI and ODA were sharply divergent after the early 2000s due to external factors. Regarding FDI, there was a rapid expansion of FDI into Asian countries, led by China. Iida (2010) asserted that the reason for the surge in FDI from Japan to Asia during this period was the attempt to respond to the increase in consumption and imports associated with the US economic expansion through the Asian network of “world factories.” In contrast, Japanese ODA budgets continued to shrink in the 2000s, affected by the stagnation of the Japanese economy.
As described above, external factors, such as the strong yen and economy, created similar trends in Japan’s FDI and ODA from the late 1980s to 2000. Therefore, it is possible that a spurious correlation was found only during this specific period as if ODA was promoting FDI. Moreover, it is significant that the analysis in this study indicates that the vanguard effect of Japanese ODA, as found by some previous studies, may have appeared only during a limited period, mainly in the 1990s.

6. Conclusions

Previous studies reported negative results regarding the ODA’s effects on promoting FDI (Harms and Lutz 2006; Kang et al. 2011; Kimura and Todo 2010; Liao et al. 2020). However, some studies indicated the Japanese ODA’s effects on promoting FDI (Kang et al. 2011; Kimura and Todo 2010). Therefore, this study re-examined the effect of ODA of five major donor countries on FDI using panel data from 2003 to 2020, more recent data than previous studies. Moreover, in addition to the GMM estimation, Granger causality tests and impulse response analysis with panel VAR models were conducted to identify causal relationships from ODA to FDI and to identify dynamic effects from ODA to FDI.
The analyses in this study showed the following results:
  • Since only the GMM estimation result was significant and the results of the Granger causality test and impulse response analysis were not significant, it cannot be concluded that Japan’s ODA to non-infrastructure sectors had a negative impact on FDI.
  • The vanguard effect of Japan’s ODA that previous studies (Kang et al. 2011; Kimura and Todo 2010) have pointed to was not significant since the 2000s.
Based on the above results, this study concludes the following:
  • Since the 2000s, there have been no robust results showing that “ODA has affected on FDI”.
  • It is suggested that the vanguard effect of Japanese ODA pointed out by previous studies appeared mainly in the 1990s and may not be sustainable.
The results of this paper are integrated with a number of previous studies (Harms and Lutz 2006; Kang et al. 2011; Kimura and Todo 2010; Liao et al. 2020) that have rejected the effectiveness of ODA in promoting FDI. Moreover, the results implied that even Japanese ODA has not promoted its FDI so far as discussed in Section 5. The novelty of this study is to verify the effects of ODA of major donors on FDI using new data from the 2000s onward, especially to reveal that the vanguard effect of Japanese ODA which has not been observed since the 2000s. The results of this study would contribute to policy making.
A limitation of this study is that the analyses only determine the presence or absence of a general trend at a statistically significant level. Therefore, further research on individual cases through questionnaire surveys and other means is expected to determine how ODA has affected the investment decisions of individual companies.

Author Contributions

S.O. conceived the idea of the study. S.O. developed the statistical analysis plan and conducted statistical analyses. All authors contributed to the interpretation of the results. S.O. drafted the original manuscript. T.S. supervised the conduct of this study. All authors reviewed the manuscript draft and revised it. All authors have read and agreed to the published version of the manuscript.

Funding

This work was supported by JST SPRING, Grant Number JPMJSP2110, and JSPS KAKENHI, Grant Number 20K01501.

Data Availability Statement

Publicly available datasets were analyzed in this study. These datasets can be found here: [dataset] OECD. 2022. Creditor Reporting System (CRS); OECD.Stat. https://stats.oecd.org/. [dataset] OECD. n.d. FDI statistics according to Benchmark Definition 3rd Edition (BMD3); OECD.Stat. https://stats.oecd.org/. [dataset] OECD. 2022. FDI statistics according to Benchmark Definition 4th Edition (BMD4); OECD.Stat. https://stats.oecd.org/. [dataset] World Bank. 2022. GDP per capita (constant 2015 US$); World Development Indicators. https://data.worldbank.org/indicator/NY.GDP.PCAP.KD. [dataset] World Bank. 2022. GNI per capita (constant 2015 US$); World Development Indicators. https://data.worldbank.org/indicator/NY.GNP.PCAP.KD. [dataset] World Bank. 2021. Worldwide Governance Indicators. https://info.worldbank.org/governance/wgi/.

Conflicts of Interest

The authors declare no conflict of interest.

Appendix A

Table A1. List of countries.
1Argentina17Mozambique
2Brazil18Nigeria
3Cambodia19Oman
4Chile20Pakistan
5China21Panama
6Colombia22Peru
7Egypt23Philippines
8India24Saudi Arabia
9Indonesia25South Africa
10Iran26Thailand
11Iraq27Trinidad Tobago
12Kazakhstan28Tunisia
13Malaysia29Turkey
14Mauritius30Ukraine
15Mexico31Uruguay
16Morocco32Viet Nam

References

  1. Akaike, Hirotogu. 1998. Information Theory and an Extension of the Maximum Likelihood Principle. In Selected Papers of Hirotugu Akaike. Edited by Emanuel Parzen, Kunio Tanabe and Genshiro Kitagawa. Springer Series in Statistics; New York: Springer, pp. 199–213. [Google Scholar] [CrossRef]
  2. Ali, Minhaj, Shujahat H. Hashmi, Muhammad R. Nazir, Ahmer Bilal, and Muhammad I. Nazir. 2021. Does Financial Inclusion Enhance Economic Growth? Empirical Evidence from the IsDB Member Countries. International Journal of Finance & Economics 26: 5235–58. [Google Scholar] [CrossRef]
  3. Arellano, Manuel, and Olympia Bover. 1995. Another Look at the Instrumental Variable Estimation of Error-Components Models. Journal of Econometrics 68: 29–51. [Google Scholar] [CrossRef]
  4. Aslan, Alper, Oguz Ocal, Baki Ozsolak, and Ilhan Ozturk. 2022. Renewable Energy and Economic Growth Relationship under the Oil Reserve Ownership: Evidence from Panel VAR Approach. Renewable Energy 188: 402–10. [Google Scholar] [CrossRef]
  5. Beladi, Hamid, and Reza Oladi. 2006. Does Foreign Aid Impede Foreign Investment? Economics Research Institute Study Paper 19: 1–31. [Google Scholar]
  6. Blonigen, Bruce A., and Jeremy Piger. 2014. Determinants of foreign direct investment. Canadian Journal of Economics/Revue canadienne d’économique 47: 775–812. [Google Scholar] [CrossRef]
  7. Blundell, Richard, and Stephen Bond. 1998. Initial Conditions and Moment Restrictions in Dynamic Panel Data Models. Journal of Econometrics 87: 115–43. [Google Scholar] [CrossRef]
  8. Cheng, Si, and Shaozhou Qi. 2021. The Potential for China’s Outward Foreign Direct Investment and Its Determinants: A Comparative Study of Carbon-Intensive and Non-Carbon-Intensive Sectors along the Belt and Road. Journal of Environmental Management 282: 111960. [Google Scholar] [CrossRef] [PubMed]
  9. Cipollina, Maria, Giorgia Giovannetti, Filomena Pietrovito, and Alberto F. Pozzolo. 2012. FDI and Growth: What Cross-Country Industry Data Say. The World Economy 35: 1599–1629. [Google Scholar] [CrossRef]
  10. Eaton, Jonathan, and Akiko Tamura. 1994. Bilateralism and Regionalism in Japanese and U.S. Trade and Direct Foreign Investment Patterns. Journal of the Japanese and International Economies 8: 478–510. [Google Scholar] [CrossRef]
  11. Efron, Bradley, and Robert J. Tibshirani. 1993. An Introduction to the Bootstrap. Monographs on Statistics and Applied Probability 57. New York: Chapman & Hall. Available online: https://m.kulib.kyoto-u.ac.jp/webopac/TY86157429 (accessed on 22 August 2022).
  12. Erdil, Erkan, and I. Hakan Yetkiner. 2009. The Granger-Causality between Health Care Expenditure and Output: A Panel Data Approach. Applied Economics 41: 511–18. [Google Scholar] [CrossRef]
  13. Garriga, Ana Carolina, and Brian J. Phillips. 2014. Foreign Aid as a Signal to Investors: Predicting FDI in Post-Conflict Countries. Journal of Conflict Resolution 58: 280–306. [Google Scholar] [CrossRef]
  14. Haini, Hazwan, and Pauline Tan. 2022. Re-Examining the Impact of Sectoral- and Industrial-Level FDI on Growth: Does Institutional Quality, Education Levels and Trade Openness Matter? Australian Economic Papers. n/a (n/a). Available online: https://doi.org/10.1111/1467-8454.12253 (accessed on 22 August 2022). [CrossRef]
  15. Harms, Philipp, and Matthias Lutz. 2006. Aid, Governance and Private Foreign Investment: Some Puzzling Findings for the 1990s*. The Economic Journal 116: 773–90. [Google Scholar] [CrossRef]
  16. Hsiao, Frank S. T., and Mei-Chu W. Hsiao. 2006. FDI, Exports, and GDP in East and Southeast Asia—Panel Data versus Time-Series Causality Analyses. Journal of Asian Economics 17: 1082–106. [Google Scholar] [CrossRef]
  17. Iamsiraroj, Sasi. 2016. The Foreign Direct Investment–Economic Growth Nexus. International Review of Economics & Finance 42: 116–33. [Google Scholar] [CrossRef]
  18. Iida, Kazuto. 2010. Development of Foreign Direct Investment and Establishment of Global Capital in Japan. Wagakoku ni okeru kaigai chokusetsu toushi no tenkai to global shihon no kakuritsu. Seikeironso 78: 1–39. (In Japanese). [Google Scholar]
  19. Irshad, Mohd, and Syed Hasan Qayed. 2022. Casual Nexus between Economic Growth, FDI and Employment: An Inquiry into BRICS and ASEAN. Theoretical and Applied Economics XXIX: 107–24. [Google Scholar]
  20. Japan External Trade Organization. 2014. FDI Flow (Based on Reports and Notifications, Gross). JETRO. Available online: https://www.jetro.go.jp/en/reports/statistics.html (accessed on 19 June 2022).
  21. Juodis, Artūras, Yiannis Karavias, and Vasilis Sarafidis. 2021. A Homogeneous Approach to Testing for Granger Non-Causality in Heterogeneous Panels. Empirical Economics 60: 93–112. [Google Scholar] [CrossRef]
  22. Kang, Sung Jin, Hongshik Lee, and Bokyeong Park. 2011. Does Korea Follow Japan in Foreign Aid? Relationships between Aid and Foreign Investment. Japan and the World Economy 23: 19–27. [Google Scholar] [CrossRef]
  23. Karakaplan, Ugur, Bilin Neyapti, and Selin Sayek. 2005. Aid and Foreign Direct Investment: International Evidence. Working Paper 2005/12. Discussion Paper. Available online: https://www.econstor.eu/handle/10419/83262 (accessed on 4 May 2021).
  24. Kaufmann, Daniel, Aart Kraay, and Massimo Mastruzzi. 2010. The Worldwide Governance Indicators: Methodology and Analytical Issues. SSRN Scholarly Paper ID 1682130. Rochester: Social Science Research Network. Available online: https://papers.ssrn.com/abstract=1682130 (accessed on 9 February 2022).
  25. Kim, Dai-Won, Jung-Suk Yu, and M. Kabir Hassan. 2018. Financial Inclusion and Economic Growth in OIC Countries. Research in International Business and Finance 43: 1–14. [Google Scholar] [CrossRef]
  26. Kimura, Hidemi, and Yasuyuki Todo. 2010. Is Foreign Aid a Vanguard of Foreign Direct Investment? A Gravity-Equation Approach. World Development 38: 482–97. [Google Scholar] [CrossRef]
  27. Levin, Andrew, Chien-Fu Lin, and Chia-Shang James Chu. 2002. Unit Root Tests in Panel Data: Asymptotic and Finite-Sample Properties. Journal of Econometrics 108: 1–24. [Google Scholar] [CrossRef]
  28. Liao, Hongwei, Yedi Chi, and Jiarui Zhang. 2020. Impact of International Development Aid on FDI along the Belt and Road. China Economic Review 61: 101448. [Google Scholar] [CrossRef]
  29. Ly-My, Dung, and Hyun-Hoon Lee. 2019. Effects of Aid for Trade on Extensive and Intensive Margins of Greenfield FDI. The World Economy 42: 2120–43. [Google Scholar] [CrossRef]
  30. Markusen, James R. 1984. Multinationals, Multi-Plant Economies, and the Gains from Trade. Journal of International Economics 16: 205–26. [Google Scholar] [CrossRef]
  31. Mihut, Marius Ioan. 2014. Plazza Acord and the ‘Explosion’ of the Japanese FDI. Procedia Economics and Finance 15: 721–29. [Google Scholar] [CrossRef]
  32. Ministry of Foreign Affairs of Japan. 1992. Japan’s Official Development Assistance Charter. June 30. Available online: https://www.mofa.go.jp/policy/oda/summary/1999/ref1.html (accessed on 19 June 2022).
  33. Ministry of Foreign Affairs of Japan. 2004a. Chapter 1 The Situation Surrounding Japan’s ODA and Revision of the ODA Charter. In Japan’s Official Development Assistance White Paper 2003 “Goals of the Revised ODA Charter”; Vol. Part I. The Revision of the “ODA Charter” and Japan’s New Approach. Available online: https://www.mofa.go.jp/policy/oda/white/2003/index03.html (accessed on 19 June 2022).
  34. Ministry of Foreign Affairs of Japan. 2004b. Chapter 2. Progress of 50 Years of ODA. In Japan’s Official Development Assistance White Paper 2004 “Accomplishments and Progress of 50 Years”; Part I. Accomplishments and Progress of 50 Years:37. Available online: https://www.mofa.go.jp/policy/oda/white/2004/index.html (accessed on 19 June 2022).
  35. Ministry of Foreign Affairs of Japan. 2004c. Japan’s Official Development Assistance Charter. Ministry of Foreign Affairs of Japan, November 30. Available online: https://www.mofa.go.jp/policy/oda/reform/charter.html (accessed on 19 June 2022).
  36. Ministry of Foreign Affairs of Japan. 2015. Cabinet Decision on the Development Cooperation Charter. Available online: https://www.mofa.go.jp/policy/oda/page_000138.html (accessed on 21 December 2020).
  37. Ministry of Foreign Affairs of Japan. 2016. Japanese Debt Relief Measures (Amount of Public Debt Forgiven) (Approximate Value). Wagakuni no saimu kyusai sochi (koteki saimu menjo-gaku) (gaisan-chi). Ministry of Foreign Affairs of Japan. Available online: https://www.mofa.go.jp/mofaj/gaiko/oda/seisaku/keitai/enshakan/saimuhouki.html (accessed on 12 February 2022). (In Japanese)
  38. Ministry of Foreign Affairs of Japan. 2021. ODA Budget. ODA yosan. Ministry of Foreign Affairs of Japan. Available online: https://www.mofa.go.jp/mofaj/gaiko/oda/shiryo/yosan.html (accessed on 21 September 2021). (In Japanese)
  39. Mishra, Bikash Ranjan, and Pabitra Kumar Jena. 2019. Bilateral FDI Flows in Four Major Asian Economies: A Gravity Model Analysis. Journal of Economic Studies 46: 71–89. [Google Scholar] [CrossRef]
  40. Morshed, Niaz, and Mohammad Razib Hossain. 2022. Causality Analysis of the Determinants of FDI in Bangladesh: Fresh Evidence from VAR, VECM and Granger Causality Approach. SN Business & Economics 2: 64. [Google Scholar] [CrossRef]
  41. Organisation for Economic Co-operation and Development (OECD). 2002. Foreign Direct Investment for Development: Maximising Benefits, Minimising. Available online: https://www.oecd.org/investment/investmentfordevelopment/foreigndirectinvestmentfordevelopmentmaximisingbenefitsminimisingcosts.htm (accessed on 20 December 2021).
  42. Organisation for Economic Co-operation and Development (OECD). 2020. “What Is ODA?” OECD. Available online: http://www.oecd.org/dac/financing-sustainable-development/development-finance-standards/What-is-ODA.pdf (accessed on 23 November 2020).
  43. Ouyang, Yaofu, and Peng Li. 2018. On the Nexus of Financial Development, Economic Growth, and Energy Consumption in China: New Perspective from a GMM Panel VAR Approach. Energy Economics 71: 238–52. [Google Scholar] [CrossRef]
  44. Pradhan, Rudra P., Mak B. Arvin, Neville R. Norman, and Samadhan K. Bele. 2014. Economic Growth and the Development of Telecommunications Infrastructure in the G-20 Countries: A Panel-VAR Approach. Telecommunications Policy 38: 634–49. [Google Scholar] [CrossRef]
  45. Razzaq, Asif, Hui An, and Sarath Delpachitra. 2021. Does Technology Gap Increase FDI Spillovers on Productivity Growth? Evidence from Chinese Outward FDI in Belt and Road Host Countries. Technological Forecasting and Social Change 172: 121050. [Google Scholar] [CrossRef]
  46. Rezitis, Anthony N. 2015. The Relationship between Agricultural Commodity Prices, Crude Oil Prices and US Dollar Exchange Rates: A Panel VAR Approach and Causality Analysis. International Review of Applied Economics 29: 403–34. [Google Scholar] [CrossRef]
  47. Rossi, Barbara, and Yiru Wang. 2019. VAR-Based Granger-Causality Test in the Presence of Instabilities. Economic Working Paper Series 1642: 15. [Google Scholar]
  48. Selaya, Pablo, and Eva Rytter Sunesen. 2012. Does Foreign Aid Increase Foreign Direct Investment? World Development 40: 2155–76. [Google Scholar] [CrossRef]
  49. Stock, James H., and Mark W. Watson. 2001. Vector Autoregressions. Journal of Economic Perspectives 15: 101–15. [Google Scholar] [CrossRef]
  50. Wang, Haijun, Hu Yang, Fengya Li, and Min Zhang. 2022. Does Foreign Aid Reduce the Country’s Risk of OFDI? The Chinese Experience. International Studies of Economics. July. Available online: https://doi.org/10.1002/ise3.20 (accessed on 31 July 2022). [CrossRef]
  51. Windmeijer, Frank. 2005. A Finite Sample Correction for the Variance of Linear Efficient Two-Step GMM Estimators. Journal of Econometrics 126: 25–51. [Google Scholar] [CrossRef]
  52. Wooldridge, Jeffrey M. 2012. Introductory Econometrics: A Modern Approach, 5th ed. Mason: Cengage Learning, p. 642. [Google Scholar]
Figure 1. Response of y to x Cholesky One S.D. Innovation (xy) 95% CI. Sources: authors’ own compilation based on impulse response analysis in Section 4.2.4.
Economies 10 00236 g001
Figure 2. Flows of total FDI and Japan’s ODA for non-infrastructure sector (constant million USD based on 2015). Sources: authors’ own compilation based on OECD.Stat and WDI.
Economies 10 00236 g002
Figure 3. Flow breakdown of Japan’s ODA for non-infrastructure sector 2003–2013. Sources: authors’ own compilation based on OECD.Stat and WDI.
Economies 10 00236 g003
Figure 4. Flow breakdown of Japanese ODA for non-infrastructure sector (constant million USD based on 2015). Sources: authors’ own compilation based on OECD.Stat and WDI.
Economies 10 00236 g004
Figure 5. Flow of Japan’s ODA and FDI (million USD). Sources: authors’ own compilation based on OECD.Stat and WDI.
Economies 10 00236 g005
Table 1. Description of variables.
VariableDescription
ln FDIijLog of real Foreign Direct Investment (FDI) flow from country i to j (BMD3: 2003–2013, BMD4: 2014–2020) from OECD.Stat
ln AID_AlljLog of total real Official Development Assistance (ODA) gross disbursement flow from all DAC countries to j (CRS code 1000s − code 900s) from OECD.Stat
ln INF_AlljLog of total real ODA for infrastructure gross disbursement flow from all DAC countries to j (CRS code 200s + 300s + 400s) from OECD.Stat
ln NINF_AlljLog of total real ODA for non-infrastructure gross disbursement flow from all DAC countries to j (CRS code 500s + 600s + 700s) from OECD.Stat
ln AIDijLog of total real ODA gross disbursement flow from country i to j (CRS code 1000s − code 900s) from OECD.Stat
ln INFijLog of total real ODA gross for infrastructure disbursement flow from country i to j (CRS code 200s + 300s + 400s) from OECD.Stat
ln NINFijLog of total real ODA for non-infrastructure gross disbursement flow from country i to j (CRS code 500s + 600s + 700s) from OECD.Stat
ln GDPiLog of real GDP of donor country i from WDI
ln GDPjLog of real GDP of recipient country j from WDI
ln GOVjLog of Sum of 6 indicators of governance (level of voice and accountability, political stability, government effectiveness, regulatory quality, rule of law, and level of accountability) of country j from WGI
ln GNIpjLog of real GNI per capita of country j from WDI
ln DISTijLog of distance between country i and j from CASIO
BMD3: Benchmark Definition 3rd Edition; BMD4: Benchmark Definition 4th Edition; CRS: Creditor Reporting System. Sources: Authors’ own compilation based on CASIO, World Development Indicators (WDI), Worldwide Governance Indica-tors (WGI), and OECD.Stat.
Table 2. Results of GMM estimation (1): impact of ODA from all donor countries on FDI.
(1)(2)(3)(4)(5)(6)(7)(8)
Year2003–20132003–20132003–20132003–20132014–20202014–20202014–20202014–2020
Dependent Variableln FDIijln FDIijln FDIijln FDIijln FDIijln FDIijln FDIijln FDIij
ln FDIij0.802 ***0.797 ***0.797 ***0.797 ***0.991 ***0.982 ***0.995 ***1.012 ***
(0.0806)(0.0820)(0.0819)(0.0818)(0.101)(0.0864)(0.0756)(0.0666)
ln AID_Allj1.89 × 10−5 0.000957
(0.000286) (0.000875)
ln INF_Allj −5.92 × 10⁻⁵−7.93 × 10⁻⁵ 0.002700.00112 *
(0.000380)(0.000281) (0.00193)(0.000672)
ln NINF_Allj −2.38 × 10⁻⁵ −4.34 × 10⁻⁵ −0.00186 0.000850
(0.000469) (0.000362) (0.00208) (0.000690)
ln GDPi0.004810.005280.005290.00527−0.0104−0.0100−0.00869−0.00840
(0.00469)(0.00463)(0.00462)(0.00470)(0.00828)(0.00713)(0.00707)(0.00719)
ln GDPj0.00803 ***0.00697 **0.00698 **0.00697 **−0.00517 *−0.00409 *−0.00456 **−0.00414 *
(0.00274)(0.00285)(0.00279)(0.00283)(0.00281)(0.00243)(0.00227)(0.00227)
ln GOVj0.00182 ***0.00201 **0.00201 **0.00200 **0.00342−0.00613−0.002200.00286
(0.000651)(0.000859)(0.000847)(0.000842)(0.0114)(0.0109)(0.00987)(0.00952)
ln GNIpj−0.00825 **−0.00859 **−0.00856 **−0.00856 ***0.0002790.003210.003250.000901
(0.00369)(0.00338)(0.00344)(0.00324)(0.00640)(0.00552)(0.00533)(0.00529)
ln DISTij−0.00649−0.00737−0.00738−0.00729−0.0008270.000103−0.000891−0.000873
(0.00467)(0.00510)(0.00507)(0.00505)(0.00427)(0.00321)(0.00313)(0.00302)
Lag option1413131311111111
Arellano–Bond test0.1190.1190.1190.1190.2460.2440.2420.242
Hansen J test0.7520.7870.8010.7960.1030.1690.1680.130
VIF less than 10×
Observations1170 1170 1170 1170 600600600600
Note: Standard errors in parentheses, *** p < 0.01, ** p < 0.05, * p < 0.1. Year dummies are included in all specification. All regressors are first lagged. Sources: authors’ own compilation based on the GMM estimation in Section 4.1.1. ○ indicates that the VIF is less than 10, and × indicates that the VIF is 10 or more.
Table 3. Results of GMM estimation (2): impact of ODA from major donor countries on their own FDI.
(1)(2)(3)(4)(5)(6)(7)(8)
Year2003–20132003–20132003–20132003–20132014–20202014–20202014–20202014–2020
Dependent Variableln FDIijln FDIijln FDIijln FDIijln FDIijln FDIijln FDIijln FDIij
ln FDIij0.797 ***0.797 ***0.793 ***0.795 ***1.031 ***0.973 ***0.964 ***1.051 ***
(0.0854)(0.0895)(0.0883)(0.0889)(0.0282)(0.0964)(0.106)(0.0668)
ln AIDij5.15 × 10−5 0.00170
(0.000351) (0.00206)
ln INFij 0.0001500.000142 0.005460.00662
(0.000333)(0.000335) (0.00558)(0.00550)
ln NINFij 0.000105 9.23 × 10⁻⁵ 0.000105 0.00107
(0.000256) (0.000276) (0.00184) (0.00251)
ln GDPi0.006010.006030.006060.00640−0.0116 **−0.00440−0.00793−0.00483
(0.00552)(0.00526)(0.00617)(0.00510)(0.00549)(0.00710)(0.00826)(0.00745)
ln GDPj0.00676 **0.00581 **0.00544 **0.00616 **−0.00223−0.00467−0.00509−0.00342
(0.00282)(0.00260)(0.00265)(0.00282)(0.00221)(0.00364)(0.00388)(0.00302)
ln GOVj0.00204 ***0.00216 **0.00176 **0.00227 **0.01040.006630.008090.0111
(0.000787)(0.000937)(0.000845)(0.000923)(0.00922)(0.0156)(0.0165)(0.0145)
ln GNIpj−0.00941 **−0.00906 **−0.00937 **−0.0100 **−0.002370.005380.00606−0.000899
(0.00445)(0.00457)(0.00467)(0.00465)(0.00559)(0.0134)(0.0124)(0.00848)
ln DISTij−0.00711−0.00791−0.00696−0.007480.00130−0.00207−0.000404−0.00253
(0.00490)(0.00516)(0.00541)(0.00500)(0.00265)(0.00391)(0.00412)(0.00392)
Lag option1413131312111111
Arellano–Bond test0.1190.1180.1190.1190.2390.2560.2530.265
Hansen J test0.7620.8250.3390.4430.2240.1430.1440.125
VIF less than 10
Observations1170 1170 1170 1170 600600600600
Note: Standard errors in parentheses, *** p < 0.01, ** p < 0.05, * p < 0.1. Year dummies are included in all specification. All regressors are first lagged. Sources: authors’ own compilation based on the GMM estimation in Section 4.1.2. ○ indicates that the VIF is less than 10.
Table 4. Results of GMM estimation (3): impact of ODA from each major donor country on FDI.
(1)(2)(3)(4)(5)(6)(7)(8)
Year2003–20132003–20132003–20132003–20132014–20202014–20202014–20202014–2020
Dependent Variableln FDIijln FDIijln FDIijln FDIijln FDIijln FDIijln FDIijln FDIij
ln FDIij0.790 ***0.704 ***0.778 ***0.808 ***1.002 ***0.989 ***1.002 ***1.005 ***
(0.0856)(0.137)(0.0880)(0.0915)(0.0413)(0.0598)(0.0622)(0.0411)
ln AIDFRj0.000701 0.000215
(0.00124) (0.00177)
ln AIDGMj−0.000723 0.000431
(0.00231) (0.00212)
ln AIDJPj0.00171 0.000752
(0.00138) (0.00156)
ln AIDUKj−0.000230 0.00174
(0.000440) (0.00305)
ln AIDUSj−0.000989 0.00108
(0.00138) (0.00318)
ln INFFRj −4.26 × 10−60.000643 0.001670.00163
(0.00252)(0.00136) (0.00156)(0.00282)
ln INFGMj −0.00692 *−0.000802 0.00210−4.18 × 10⁻⁵
(0.00377)(0.00273) (0.00173)(0.00255)
ln INFJPj 0.00534 *0.00155 0.001060.00117
(0.00315)(0.00162) (0.00114)(0.00184)
ln INFUKj −0.000241−0.000218 −0.0009200.00133
(0.000474)(0.000457) (0.00209)(0.00263)
ln INFUSj 0.00166−0.000723 −0.000364−0.00121
(0.00209)(0.00138) (0.00152)(0.00288)
ln NINFFRj 0.000302 0.000601 −0.000387 0.000864
(0.000458) (0.000383) (0.000653) (0.000641)
ln NINFGMj 0.000179 0.000221 −0.000746 −0.000468
(0.000346) (0.000466) (0.000829) (0.000810)
ln NINFJPj −0.000562 −0.000746 ** 0.000714 0.000885
(0.000450) (0.000339) (0.000710) (0.000770)
ln NINFUKj 0.000350 0.000356 0.00145 * −0.000178
(0.000356) (0.000363) (0.000785) (0.000896)
ln NINFUSj 0.000531 9.65 × 10⁻⁵ −0.000580 −0.000117
(0.000547) (0.000491) (0.000644) (0.00103)
Lag option11collapse111111111111
Arellano–Bond test0.1190.120.1190.1170.2360.1920.2410.243
Hansen J test0.2560.0930.130.1060.3130.5070.3660.245
VIF less than 10×××
Observations1170 1170 1170 1170 600600600600
Note: Standard errors in parentheses, *** p < 0.01, ** p < 0.05, * p < 0.1. Year dummies are included in all specification. All regressors are first lagged. Sources: authors’ own compilation based on the GMM estimation in Section 4.1.3. ○ indicates that the VIF is less than 10, and × indicates that the VIF is 10 or more.
Table 5. Results of GMM estimation (4): impact of ODA from France on its FDI.
(1)(2)(3)(4)(5)(6)(7)(8)
Year2003–20132003–20132003–20132003–20132014–20202014–20202014–20202014–2020
Dependent Variableln FDIFRjln FDIFRjln FDIFRjln FDIFRjln FDIFRjln FDIFRjln FDIFRjln FDIFRj
ln AIDFRj0.000204 0.00951
(0.00327) (0.00630)
ln INFFRj −0.00132−0.00199 0.01640.0118
(0.00238)(0.00252) (0.0148)(0.00742)
ln NINFFRj 0.000556 0.000414 −0.00294 0.00167
(0.000764) (0.000749) (0.00388) (0.00235)
Lag optioncollapsecollapsecollapsecollapse11111111
Arellano–Bond test0.2960.3130.3070.3060.5330.5380.5070.552
Hansen J test0.9971.0001.0001.0000.5990.9850.5370.778
VIF less than 10
Observations234234234234120120120120
Note: Standard errors in parentheses. Year dummies are included in all specification. All regressors are first lagged. Sources: authors’ own compilation based on the GMM estimation in Section 4.1.4. ○ indicates that the VIF is less than 10.
Table 6. Results of GMM estimation (4): impact of ODA from Germany on its FDI.
(1)(2)(3)(4)(5)(6)(7)(8)
Year2003–20132003–20132003–20132003–20132014–20202014–20202014–20202014–2020
Dependent Variableln FDIGMjln FDIGMjln FDIGMjln FDIGMjln FDIGMjln FDIGMjln FDIGMjln FDIGMj
ln AIDGMj−0.000835 0.00169
(0.00202) (0.00588)
ln INFGMj −0.00193−0.00139 0.002060.00473
(0.00266)(0.00214) (0.00483)(0.00425)
ln NINFGMj −0.000144 −9.17 × 10⁻⁵ 0.000665 0.000226
(0.000527) (0.000510) (0.00133) (0.00165)
Lag optioncollapsecollapsecollapsecollapse11111111
Arellano–Bond test0.4540.7180.4780.6450.6850.6920.7070.661
Hansen J test0.9401.0000.9851.0000.8510.8270.5780.200
VIF less than 10
Observations234234234234120120120120
Note: Standard errors in parentheses. Year dummies are included in all specification. All regressors are first lagged. Sources: authors’ own compilation based on the GMM estimation in Section 4.1.4. ○ indicates that the VIF is less than 10.
Table 7. Results of GMM estimation (4): impact of ODA from Japan on its FDI.
(1)(2)(3)(4)(5)(6)(7)(8)
Year2003–20132003–20132003–20132003–20132014–20202014–20202014–20202014–2020
Dependent Variableln FDIJPjln FDIJPjln FDIJPjln FDIJPjln FDIJPjln FDIJPjln FDIJPjln FDIJPj
ln AIDJPj−0.00252 0.00291
(0.00428) (0.00309)
ln INFJPj −0.00294−0.00563 −0.001110.00381
(0.00332)(0.00525) (0.00679)(0.00418)
ln NINFJPj 0.000147 −6.90 × 10⁻⁶ 0.00270 0.00234
(0.000341) (0.000340) (0.00450) (0.00229)
Lag optioncollapsecollapsecollapsecollapse11111111
Arellano–Bond test0.7610.7160.7920.7630.6210.6160.6070.622
Hansen J test0.9441.0000.9810.9920.1950.4500.3080.327
VIF less than 10
Observations234234234234120120120120
Note: Standard errors in parentheses. Year dummies are included in all specification. All regressors are first lagged. Sources: authors’ own compilation based on the GMM estimation in Section 4.1.4. ○ indicates that the VIF is less than 10.
Table 8. Results of GMM estimation (4): impact of ODA from the United Kingdom on its FDI.
(1)(2)(3)(4)(5)(6)(7)(8)
Year2003–20132003–20132003–20132003–20132014–20202014–20202014–20202014–2020
Dependent Variableln FDIUKjln FDIUKjln FDIUKjln FDIUKjln FDIUKjln FDIUKjln FDIUKjln FDIUKj
ln AIDUKj0.000381 0.00511
(0.00105) (0.00467)
ln INFUKj 4.17 × 10−50.000337 0.001880.00648 *
(0.00110)(0.00108) (0.00373)(0.00372)
ln NINFUKj 0.000180 0.000595 0.000872 0.000708
(0.000844) (0.000838) (0.00175) (0.00133)
Lag optioncollapsecollapsecollapsecollapse11111111
Arellano–Bond test0.1060.1090.1060.0910.2500.2490.2660.248
Hansen J test0.8760.9920.8920.9450.4350.5810.3390.257
VIF less than 10
Observations234234234234120120120120
Note: Standard errors in parentheses, *** p < 0.01, ** p < 0.05, * p < 0.1. Year dummies are included in all specification. All regressors are first lagged. Sources: authors’ own compilation based on the GMM estimation in Section 4.1.4. ○ indicates that the VIF is less than 10.
Table 9. Results of GMM estimation (4): impact of ODA from the United States on its FDI.
(1)(2)(3)(4)(5)(6)(7)(8)
Year2003–20132003–20132003–20132003–20132014–20202014–20202014–20202014–2020
Dependent Variableln FDIUSjln FDIUSjln FDIUSjln FDIUSjln FDIUSjln FDIUSjln FDIUSjln FDIUSj
ln AIDUSj−0.00334 0.0110
(0.00694) (0.0177)
ln INFUSj 0.000596−0.00271 −0.007570.00744
(0.00472)(0.00802) (0.0144)(0.0192)
ln NINFUSj −0.00151 −0.00190 0.00343 0.00659
(0.00125) (0.00138) (0.00392) (0.00449)
Lag optioncollapsecollapsecollapsecollapse1 11 11 11 1
Arellano–Bond test0.2730.2890.2730.2860.2950.3940.3080.414
Hansen J test0.9920.9990.9890.9910.3380.4810.5090.570
VIF less than 10
Observations234234234234120120120120
Note: Standard errors in parentheses. Year dummies are included in all specification. All regressors are first lagged. Sources: authors’ own compilation based on the GMM estimation in Section 4.1.4. ○ indicates that the VIF is less than 10.
Table 10. Results of panel unit root tests.
2003–2013
VariableStatisticProb.
ln FDIij−27.180 0.000
ln NINFJPj−10.876 0.000
Sources: authors’ own compilation based on LLC in Section 4.2.1.
Table 11. Results of lag length selection.
2003–2013
Variables012
ln FDIijln NINFJPj8.8287548.1508258.061585 *
Sources: authors’ own compilation based on AIC in Section 4.2.2. * shows the lowest AIC value.
Table 12. Results of panel Granger causality test.
2003–2013
Null Hypothesis:F-StatisticProb.
ln NINFJPj does not Granger Cause ln FDIij0.1262 0.8815
Sources: authors’ own compilation based on panel Granger causality test in Section 4.2.3.
Publisher’s Note: MDPI stays neutral with regard to jurisdictional claims in published maps and institutional affiliations.

