Abstract
This study explores the asymmetric impact of oil supply and demand shocks on the sectoral stock market returns of Pakistan. For this purpose, the study uses the non-linear autoregressive distributed lag (ARDL) approach based on monthly time series data for four sectors in the Pakistan Stock Exchange over the period 2005–2018. First, the findings of the unit root tests identified that all data series are stationary at first difference. Second, the F-bound test explored that oil supply and demand shocks have a cointegration relationship with sectoral stock market returns. Third, the study explored the asymmetric impact of oil supply shocks (OSS) and oil-specific demand shocks (OSDS) on sectoral returns of commercial banking and the symmetric impact of oil demand shocks (ODS) on sectoral returns of commercial banking. In addition, the asymmetric impact of oil supply shocks (OSS) and oil demand shocks (ODS) on sectoral returns of the power generation, chemical and fertilizer sectors was found. Moreover, the symmetric impact of oil-specific demand shocks (OSDS) on sectoral returns of the power generation, chemical and fertilizer sectors was explored. The study suggests important policy implications for policymakers and investors.
1. Introduction
It is generally contended that the stock market is a barometer of any country’s economic condition. The economic performance of any country scales up the behavior of that country’s stock market. Most importantly the smooth performance of the stock market is an essential element for developed and emerging economies (Jebran et al. 2017). Moreover, oil is considered as one of the biggest economic drivers and most of the economies heavily depend on oil for its day-to-day operations, transportation and other economic activities. It is a pressing reality of today’s world that oil is the backbone of the world’s industrialization and is used to produce output. Therefore, the understanding of links of oil price shocks with that of the stock market is more critical because any variation in oil price can bring uncertainty in economic instability and the economic sector for both oil-importing and exporting nations (Al-hajj et al. 2018). Unluckily, Pakistan’s domestic production is 15% less than its total consumption. Therefore, oil price fluctuation, both negative and positive, affects the stock performance of Pakistan (Jebran et al. 2017).
Being a developing economy, oil is one of the major elements of Pakistan’s import (Siddiqui 2004). Therefore, the economy is depending heavily on oil and is used as input in industrial, transport and power generation. Since many of the developing nations depend heavily on the import of oil, any change in the price of oil will cause many structural and policy shocks in the economy. Specifically, the return of stocks in developing economies has more fluctuations and the change in oil prices makes them more fluctuating. There is a fact that the changes in oil prices have the potential to affect the real economy, showing that they may also have repercussions on the financial markets, and there is an interaction that exists between the performance of the stock exchange and that of oil prices. Usually, the given interaction of oil prices and stock returns depends on the dependency level of the affected economy on oil, and this is shown as the changes occurring in the economic parameters (Syzdykova 2018).
The dynamic impact of oil price shocks and their volatility on every individual sector as well as the total stock market has attracted global concerns and is widely reported in recent literature (Caporale et al. 2015). The time span between 1996 and 2009 is the so-called stable period and soon after this period, the oil prices have shown fluctuations. Between 2007 and 2009, the oil price was $60 and $145 and then abruptly fell and now stands at $30. There were many factors that exist in the system and were responsible for the minimization of oil price. For Example, the Middle Eastern countries produced oil in an excess amount and the supply of crude oil was rapidly increased due to shale gas. Moreover, the countries like Iraq and Libya kept the production of oil beyond the limit regardless of their political situation, which was not reliable. On the other hand, some political and economic reasons existed that forced Saudi Arabia to not reduce the production of crude oil. Some countries such as China observed that their growth rate improved while Japan was in recession, and European countries such as Germany saw that their economic growth was declining, these being the main reasons that are considered responsible for the reduction in oil prices. Along with the movements in the supply and demand of oil price, the whole world has also opened up to the position of environmental friendliness and efficient lifestyle because crude oil has been substituted with biofuel (Atiq et al. 2018).
Change in oil price lets the economy suffer the heat of the cost of production that confines the corporation and business sector to earning lesser profit margins, reduces the consumer demand because of higher inflation as an effect of the increase in oil prices (Ansar and Asghar 2013). Whereas the oil price shocks amend the uncertainty of investment, create demand for a higher rate of returns from investors and the business sector, which leads to constraints in the level of investment in the already suffering stock market and inhibits the level of investment in financial and real asset sectors. This leads to a plummet in the share prices in the stock market due to nosediving profits and higher discount rates (Arshad and Bashir 2015; Meyer and Meyer 2019). Despite these facts, evidence proposes that the origin of the oil price shocks triggers different responses from the stock market and most of the literature does not consider them when examining the effect. Hence, through this study, we will try to capture the impact of oil price shock on stock market volatility in Pakistan. Developing nations highly rely on oil imports; as a result, they are encountered by socio and macro-economic problems. Pakistan has been facing these problems for decades due to this dependency on oil and other energy sources. This increase in oil price will further enhance the cost of production, which decreases the profit margins of corporations, reduces consumer demand because of the increase in inflation as an effect of the increase in oil prices. Whereas oil price shocks amend the uncertainty for investment create a demand for higher rate of returns by investors which will lead to constraining the level of investment at stock market and inhibiting the level of investment in financial and real assets. This will lead to plummet the share prices in market due to nosedive in profits and higher discount rates.
In the past, several studies have been carried out to examine the impact of oil price shocks on sectoral returns, using different methodologies. Hadhri (2021) explored the asymmetric dynamic relationship between the oil price and Islamic stock prices over the period May 2002 to February 2018 based on a non-linear autoregressive distributed lag (ARDL) model and using global and domestic oil prices. The study found that negative oil price shocks positively and significantly affect stock prices. Hassan et al. (2019) investigated the dynamic conditional correlation and the volatility correlation between Islamic indices and oil for BRIC countries. They found that correlations between these assets increased during the global financial crisis. Hassan et al. (2020) employed the GARCH threshold (TGARCH) and the generalized forecast error variance decomposition approach. They explored that the total volatility spillover is mainly driven by a long-term component. Lin and Su (2020) explored the correlation between oil market uncertainty and Islamic stock markets. The study applied the quantile-on-quantile (QQ) approach and found negative links between OVX and Islamic stocks. Similar studies were also conducted by Mishra et al. (2019); Narayan et al. (2019); Narayan and Sharma (2015).
Keeping in view the above discussion, the contribution of this study is threefold: first, this study will identify the causes of the change in the global oil price, that is, supply or demand shocks, most of the previous studies explored the impact of oil prices on sectoral returns, considering aggregated financial markets. In contrast to the previous studies, this study explored the impact of supply and demand shocks on sectoral returns, considering disaggregated financial markets including commercial banking, power generation, chemical and fertilizers sectors. Second, most previous studies examined the symmetric impact of oil price shocks on stock market returns; this study explores the asymmetric impact of oil supply and demand shocks on sectoral returns. Third, this study will prescribe some policy measures to address the issues of oil supply and demand shocks on sectoral returns in Pakistan.
The rest of the paper is structured as follows. Section 2 elaborates the methodologies used in this study. Section 3 discusses the empirical findings of the stationarity tests, the cointegration test and the results of the non-linear autoregressive distributed lag (ARDL) model. Finally, conclusions and policy implications are presented in Section 4.
2. Data and Methodology
This study investigates the asymmetric impact of oil price shocks on stock market sectoral returns using a monthly dataset of stock prices, real oil prices, real economic activities index and crude oil production over the period 2005–2018. The series of stock prices is based on the Pakistan stock exchange 100 index (PSX-100), while crude oil production and real oil prices series were obtained from US Energy Information Administration (EIA). Furthermore, this study utilized the real economic activities index obtained from the homepage of Kilian (2009). Detailed discussions of the data series are given in Table 1.

Table 1.
Description of the data series.
First, this study uses a stock valuation transmission mechanism. This channel refers to how the change in oil price affects the performance of sectoral stock market returns. There is a direct influence of oil prices on the sectoral stock market. Consider the following equation (Khan et al. 2020):
where the stock price of the sector is denoted by () in the time interval of “t”. Likewise, the discounted future cash flow of a given stock is reflected by current stock prices advocated by economic theory (Huang 1995). This can be shown as under:
where denotes cash flow; shows time and specifies the discount rate. Equations (1) and (2) illustrate that some factors impact the returns of that stock, which in turn leads to modification in the expected cash flow and/or the discount rate that includes the price of oil. Change in the oil price can also bring two kinds of change in the future cash flows of the firm; this modification depends on whether the firm consumes oil or produce it (see Oberndorfer 2009; Mohanty et al. 2011).
Second, this study explored the response of stock market sectoral returns to structural oil price shocks using the following linear function:
where is the stock market sectoral returns, while , , represent oil supply shocks, oil specific demand shocks and oil demand shocks, respectively. The following equations from (4)–(9) are the partial sums of positive and negative changes in oil supply shocks, oil specific demand shocks and oil demand shocks:
In the subsequent stage, we incorporate the positive and negative shocks in Equation (3). Hence Equation (3) becomes:
Third, this study used unit root tests to examine the unit root problem of each data series. Therefore, the Augmented Dickey–Fuller (Dickey and Fuller 1981) and Phillips–Perron (Phillips and Perron 1988) tests were applied to explore the presence of a unit root and verify the order of integration of each data series used in the study.
Fourth, the study applied the non-linear ARDL bound test approach to examine the co-integration relation of oil supply shocks (OSS), oil specific demand shocks (OSDS) and oil demand shocks with stock market sectoral returns. Furthermore, this study employed the non-linear ARDL model developed by Shin et al. (2014) to explore the asymmetric impact of oil supply and demand shocks on sectoral returns both in the short run and long run. This study considered the following econometric model:
where represents long-run parameters. Nonlinear impact of oil price shocks has been incorporated in the model by decomposing the structural oil price shocks into the partial sum of positive changes in and the partial sum of negative changes in . Moreover, to explore the short run and long-run asymmetric impact of oil supply and demand shocks on sectoral returns, the following non-linear ARDL model was specified:
Finally, the study employed different diagnostic tests to check the non-linear ARDL model for autocorrelation, heteroskedasticity, normality issue of the residual and functional form of the model. These tests include the Breusch–Godfrey Serial Correlation LM Test, Breusch–Pagan Godfrey Heteroskedasticity Test, Jarque–Bera test for Normality Test and Ramsey Reset test for functional form of the model. The parameters stability was confirmed with the help of Cusum and Cusum of square tests.
3. Results and Discussion
This study explores the asymmetric impact of oil supply and demand shocks on sectoral returns in Pakistan, using monthly data over the period 2005–2018. The first section summarizes the descriptive statistics of the data series. Findings of the unit root tests are given in section two. Results of the non-linear ARDL bound test to explore the co-integration relation of oil supply and demand shocks with sectoral returns are given in section three. Results of the non-linear ARDL model to examine the asymmetric impact of oil supply and demand shocks on sectoral returns are explained in section four.
Descriptive statistics illustrate the basic features and characteristics of the data series. Table 2 presents descriptive statistics of the data series used in this study. The table shows that the average returns of commercial banking (SRCB), power generation (SRPG), chemical (SRCM) and fertilizer (SRFR) sectors were 3.66, 3.43, 3.21 and 3.46 percent during the study period, respectively. In addition, the crude oil production used as a proxy for oil supply shocks (OSS) was 73,094 thousand barrels per day while the average real price of crude oil used as a proxy for oil specific demand shocks (OSDS) was 74.85 US dollars per barrel, and real economic activities index used as a proxy for oil demand shocks (ODS) was 14.71. In addition, the maximum crude oil production was 77,972 thousand barrels per day in December 2005, followed by real prices whose maximum price was US dollars 133.8 in July 2008. The maximum return of commercial banking (SRCB) was 3.98 percent followed by power generation (SRPG) and fertilizers (SRFR) sectors each 3.95 percent, and chemical (SRCM) sector 3.56 percent.
Table 2.
Descriptive Statistics of the data series.
The methodology of this study is fourfold: first, the study applied unit root tests to investigate the unit root problem in each data series. The Augmented Dickey–Fuller (Dickey and Fuller 1981) and Phillips–Perron (Phillips and Perron 1988) tests were applied to investigate the presence of unit root and to check the order of integration of each data series used in this study. The result of both the tests, that is, the ADF and PP tests, are reported in Table 3. Findings of these tests show that all data series are stationary at the first difference, that is, I(1).
Table 3.
Findings of Unit Root Tests.
Second, the study employed the non-linear ARDL bound test to explore the cointegration relationship of oil supply and demand shocks with sectoral returns. The results of the non-linear ARDL bound test are given in Table 4. The non-linear bound test provides the critical values for the lower bound and the upper bound at different levels of significance. The findings of the non-linear ARDL bound test show that, in the case of commercial banking, the F-statistical value (4.06) is greater than the F-critical value (3.61) for the upper bound at a significance level of 5% and concludes that oil supply and demand shocks are co-integrated with sectoral returns of commercial banking. The F-statistical value (3.43) in the case of power generation is greater than the F-critical value (3.28) for the upper bound at a significance level of 5% and finds that oil supply and demand shocks are also co-integrated with sectoral returns of power generation. Furthermore, in the case of chemical and fertilizers sectors, the F-statistical value (15.99, 22.36) is greater than the F-critical value (4.43) for the upper bound at a significance level of 1% and explores that oil supply and demand shocks have co-integration with sectoral returns of chemical and fertilizers sectors.
Table 4.
Findings of the non-linear ARDL Bound Test.
Third, this study explored the long-run symmetric/asymmetric effect of supply and demand shocks on sectoral returns in the commercial banking, power generation, chemical, and fertilizer sectors using the Wald test (Wald 1945). Table 5 presents the results of the symmetry test; here, the null hypothesis is that the supply and demand shocks in the runs are symmetric with respect to the alternative hypothesis that their impact is asymmetric. We accept the alternative hypothesis and confirm that, in the long run, the positive and negative partial sum of squares are significantly different from each other and support the asymmetric behavior of both oil supply shocks (OSS) and oil-specific demand shocks (OSDS) in commercial banking. Furthermore, we accept the null hypothesis and confirm that, in the long run, the positive and negative partial sum of squares are not significantly different from each other and support the symmetric behavior of oil demand shocks (ODS) in commercial banking. We also accept the alternative hypothesis and confirm that, in the long run, the positive and negative partial sum of squares are significantly different from each other and support the asymmetric behavior of both oil supply shocks (OSS) and oil demand shocks (ODS) in the power generation, chemical, and fertilizers sectors. Furthermore, we accept the null hypothesis and confirm that, in the long run, the positive and negative partial sum of squares are not significantly different from each other and support the symmetric behavior of oil-specific demand shocks (OSDS) in the power generation, chemical and fertilizers sectors.
Table 5.
Results of asymmetry tests.
Fourth, this study employed the non-linear ARDL approach to explore the short- and long-run symmetric/asymmetric impact of the supply and demand shocks on sectoral returns in the commercial banking, power generation, chemical and fertilizers sectors. The findings of the non-linear ARDL model in the commercial banking, power generation, chemical and fertilizers sectors are reported in Table 6, Table 7, Table 8 and Table 9. The results of the non-linear ARDL model for the commercial banking sector are given in Table 6. The findings suggest that the partial sum of positive oil supply shocks (OSS) positively and significantly influences the stock returns of commercial banking in Pakistan, both in the short and in the long run. This result implies that the increase in the supply of oil to the international market leverages economic activities, launching new projects, which increase bank revenue in terms of fee income, processing fees and access to cheap liquidity via the wholesale financing market and, consequently, returns for the banking sector. This result is in line with previous studies (Hesse and Poghosyan 2016; Hajdu et al. 2014). Furthermore, the partial sum of negative oil supply shocks (OSS) negatively and significantly influences the stock returns of commercial banking, both in the short and in the long run. Insignificant lags were automatically dropped from the model because the presence of insignificant variables in the model creates an error in the dynamic multiplier (Katrakilidis and Trachanas 2012). The findings also explored that the partial sum of positive oil specific demand shocks (OSDS) negatively and significantly influence the stock returns of commercial banking, both in the short and long run. In addition, the partial sum of negative oil specific demand shocks (OSDS) at a lag negatively and significantly influences the stock returns of commercial banking in the short run. The results also confirm that the partial sum of negative oil demand shocks (ODS) at a lag positively and significantly influences the stock returns of commercial banking in the short run. It is also concluded that the partial sum of negative oil demand shocks (ODS) at a lag negatively and significantly influences the stock returns of commercial banking in the long run. Finally, we employed the Breusch–Godfrey serial correlation LM test, the Breusch–Pagan–Godfrey test, the Jarque–Bera test for normality, the Ramsey Reset tests to verify the estimated model for serial correlation, heteroskedasticity, normality issue in the residuals and functional form of the model. The findings of diagnostic statistics conclude that the estimated non-linear ARDL model is free from different econometric problems.
Table 6.
Results of the non-linear ARDL model for commercial banking.
Table 7.
Results of the non-linear ARDL model for power generation.
Table 8.
Results of the non-linear ARDL model for chemical Sector.
Table 9.
Results of the non-linear ARDL model for fertilizers sector.
The results of the non-linear ARDL model for the power generation are presented in Table 7. The findings suggest that the partial sum of positive oil supply shocks (OSS) positively and significantly influences the stock returns of power generation in Pakistan, both in the short and long run. In addition, the partial sum of negative oil supply shocks (OSS) positively and significantly influences the stock returns of power generation in the short and negatively in the long run. The partial sum of positive oil specific demand shocks (OSDS) negatively and significantly influences the stock returns of power generation, both in the short and long run. Furthermore, the partial sum of negative oil specific demand shocks (OSDS) negatively and significantly influences the stock returns of power generation in the short and positively and significantly in the long run. The results also confirm that the partial sum of positive oil demand shocks (ODS) positively and significantly influences the stock returns of power generation in the short run. It is also concluded that the partial sum of negative oil demand shocks (ODS) positively and significantly influences the stock returns of power generation in the short run. The findings of diagnostic statistics conclude that the estimated non-linear ARDL model is free from different econometric problems.
The results of the non-linear ARDL model for the chemical sector are presented in Table 8. The findings suggest that the partial sum of positive oil supply shocks (OSS) positively and significantly influences the stock returns of the chemical sector in Pakistan, both in the short and long run. The partial sum of positive oil specific demand shocks (OSDS) negatively and significantly influences the stock returns of the chemical sector, both in the short and long run. The results also confirm that the partial sum of positive oil demand shocks (ODS) positively and significantly influences the stock returns of the chemical sector, both in the short run and long run. The results of diagnostic tests confirmed that the estimated non-linear ARDL model is free from different econometric problems.
The results of the non-linear ARDL model for the fertilizers sector are presented in Table 9. The findings suggest that the partial sum of positive oil supply shocks (OSS) negatively and significantly influences the stock returns of the fertilizer sector in Pakistan in the short-run and positively and significantly in the long run. In addition, the partial sum of negative oil supply shocks (OSS) at a lag positively and significantly influences the stock returns of the fertilizers sector in the short-run and positively and significantly in the long run. The positive long-term oil supply shock causes a positive return for the fertilizer sector because the increase in oil supply lowers the price of domestic oil and significantly reduces the cost of producing fertilizers. Reductions in production costs increase the fertilizer firm’s revenue and therefore the stock market’s return. The partial sum of positive oil specific demand shocks (OSDS) negatively and significantly influences the stock returns of the fertilizers sector, both in the short and long run. The results also confirm that the partial sum of negative oil demand shocks (ODS) negatively and significantly influences the stock returns of the fertilizers sector, both in the short run and long run. The results of diagnostic tests confirmed that the estimated non-linear ARDL model is free from different econometric problems.
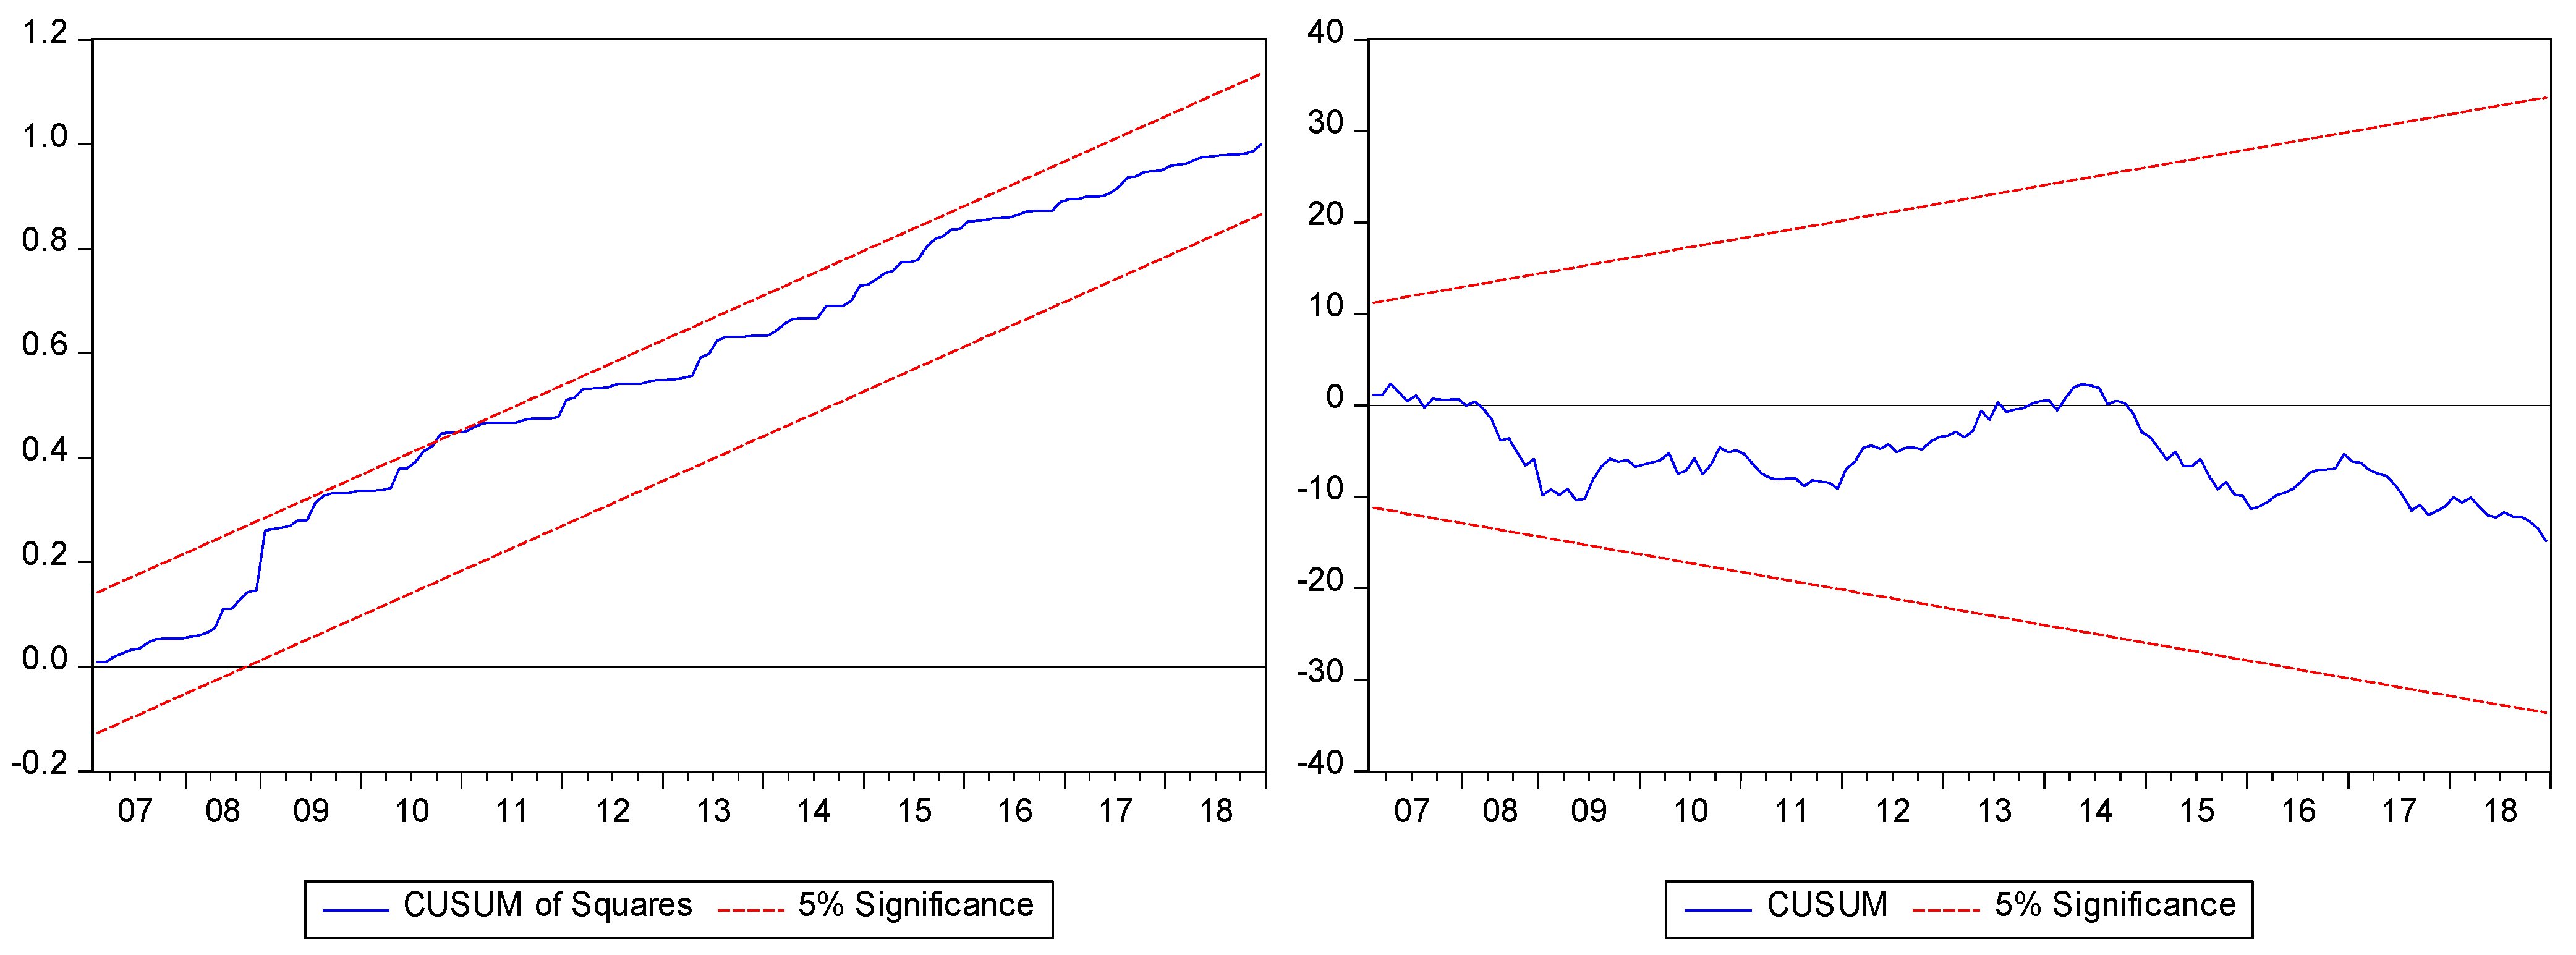
Finally, we applied the Cusum and Cusum squares tests to verify the stability and strength of the parameters of the non-linear ARDL models (Brown et al. 1975). It is of immense importance to verify the stability and strength of the parameters (Brown et al. 1975). The blue line represents the Cusum and Cusum squares line while the red line represents 5% upper and lower critical bounds. When the blue lines enter the 5% upper and lower critical bounds, it means that our estimated parameters are stable. Findings of the Cusum and Cusum of squares tests verified that the blue lines are within the critical region for the four sectors. Thus, it is concluded that the parameters of the non-linear ARDL models for four sectors are stable. The graphical representation of Cusum and Cusum of square tests are shown in Figure 1, Figure 2, Figure 3 and Figure 4.
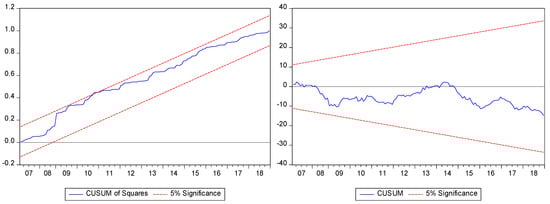
Figure 1.
Plot of Cusum and Cusum of square test for the Commercial banking.
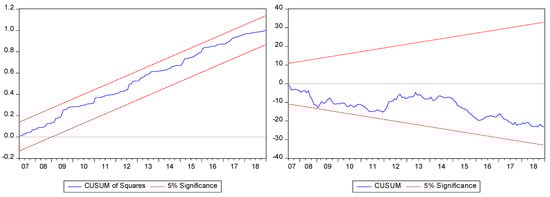
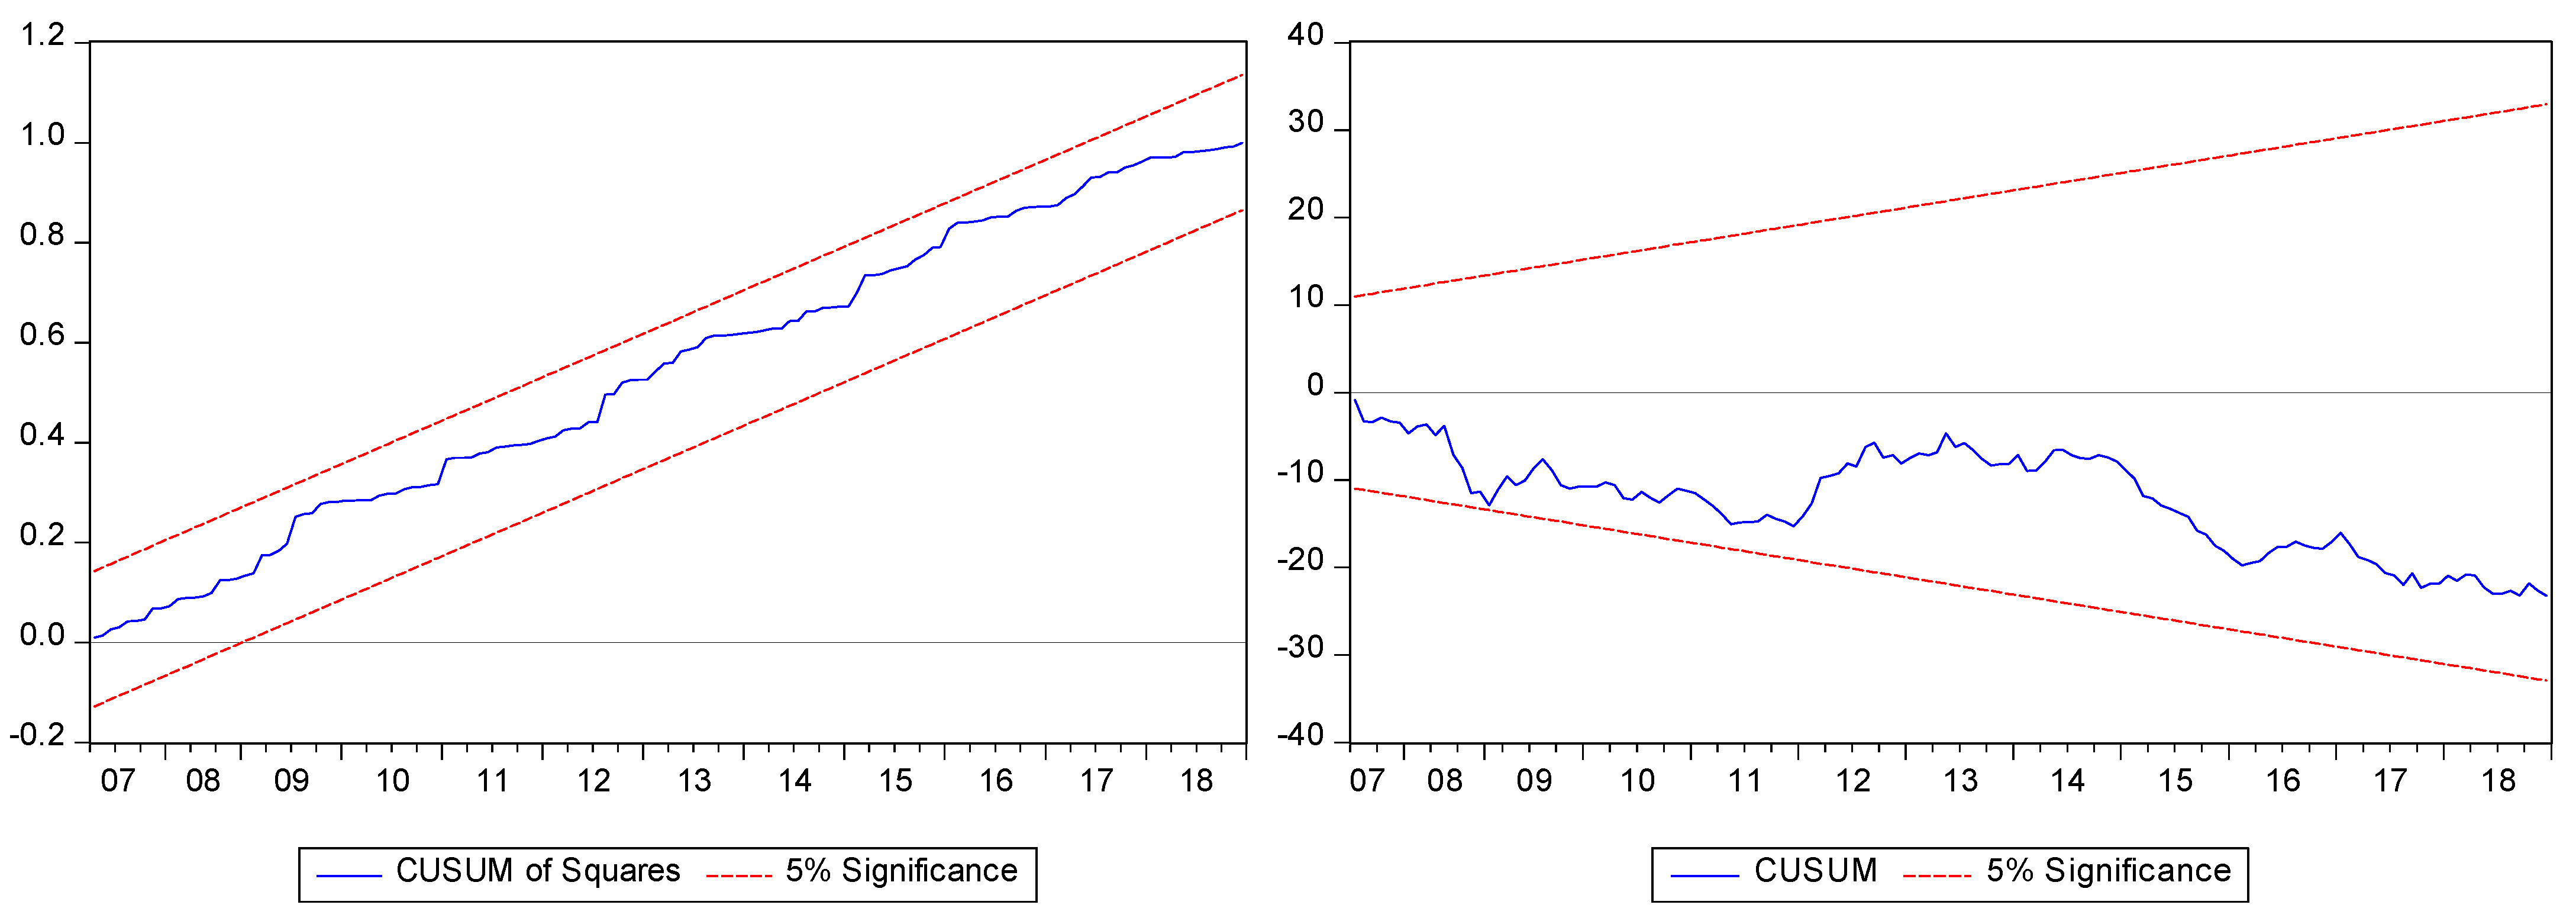
Figure 2.
Plot of Cusum and Cusum of Square tests for the Fertilizer Sector.
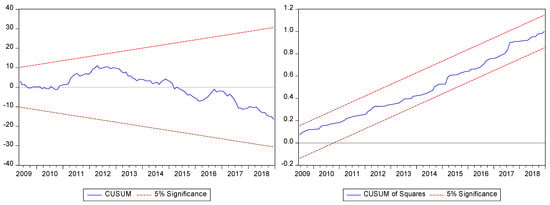
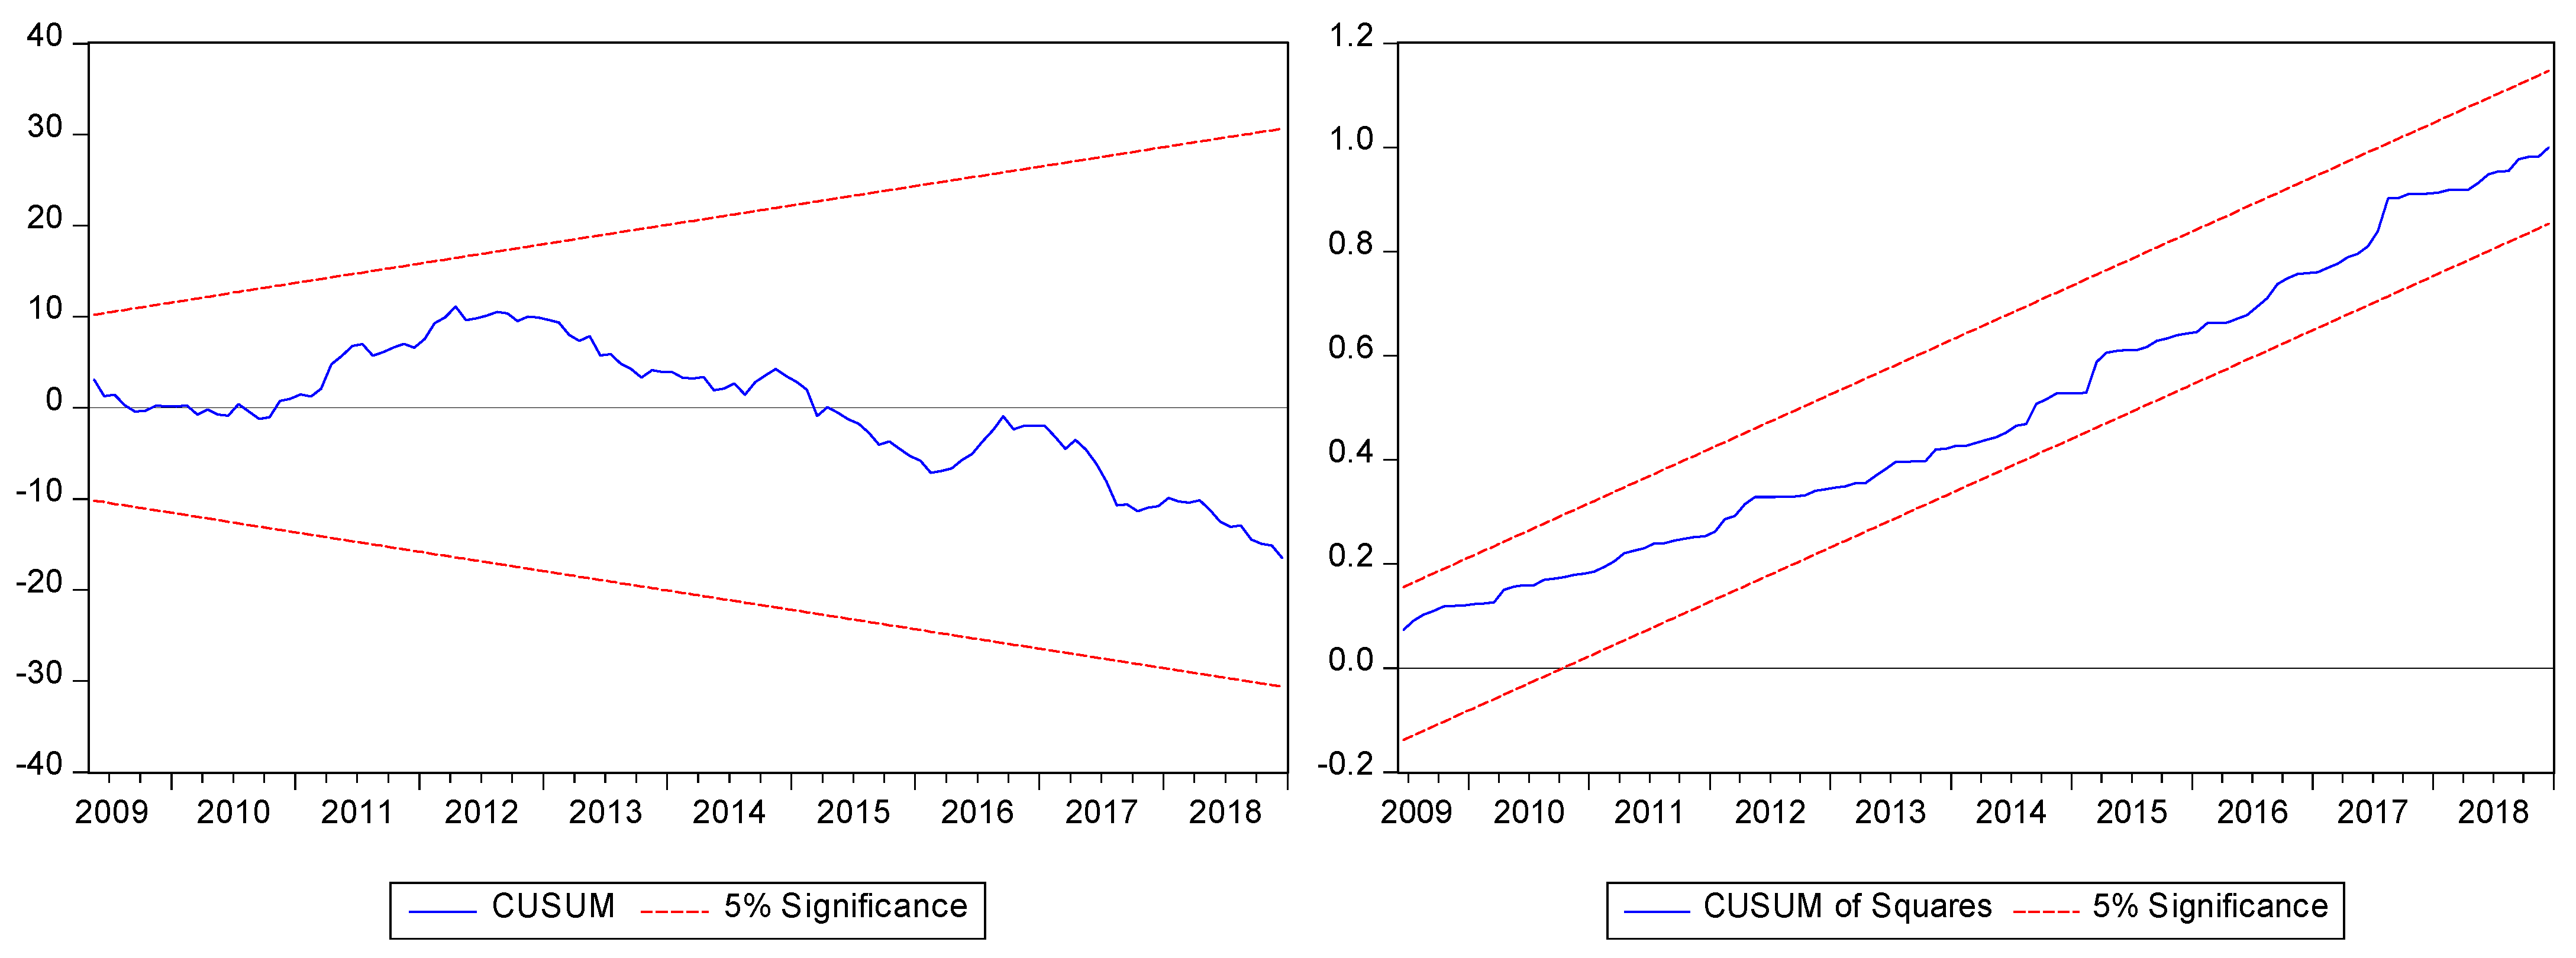
Figure 3.
Plot of Cusum and Cusum of square tests for the Power Generation.
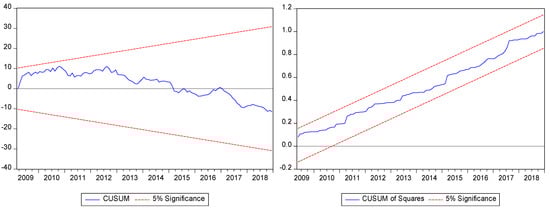
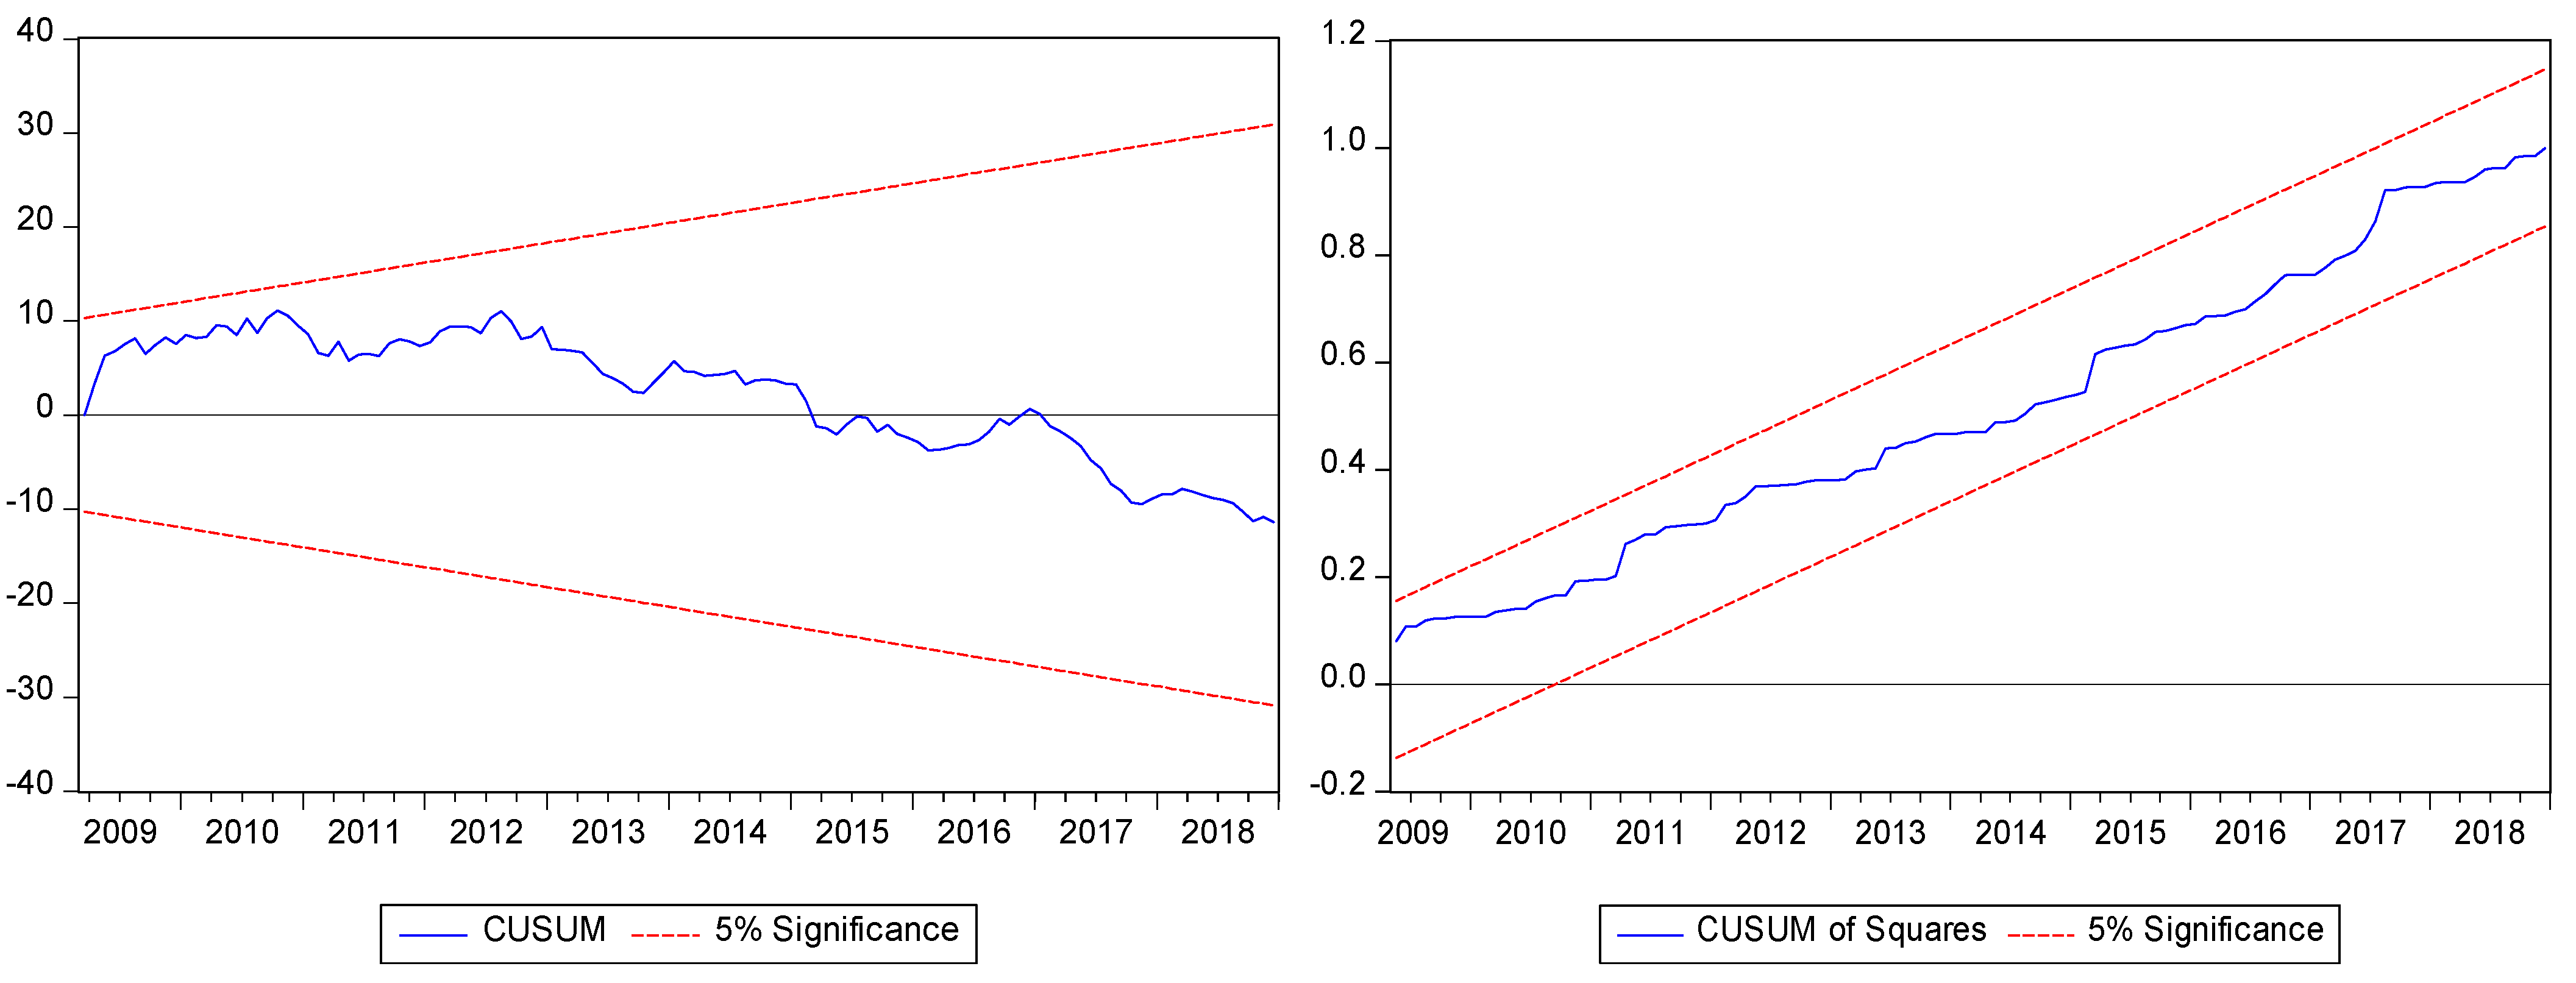
Figure 4.
Plot of Cusum and Cusum of Square tests for the Chemical Sector.
4. Conclusions and Policy Implications
Stock market returns are highly sensitive to oil supply and demand shocks. Therefore, it is significant to explore the impact of oil supply and demand shocks on sectoral stock market returns. This study explores the asymmetric impact of oil supply and demand shocks on sectoral returns of Pakistan. For this, first, we apply stationarity tests to examine each data series for unit root, and the findings of these tests show that each data series is stationary at first difference. Second, results of the F-bound tests show that oil supply and demand shocks have a cointegration relationship with sectoral returns. Third, the study found an asymmetric effect of oil supply shocks (OSS) and oil-specific demand shocks (OSDS) on sectoral returns of the banking sector, while a symmetric effect of oil demand shocks (ODS) on sectoral returns of the banking sector was found. Furthermore, oil supply shocks (OSS) and oil demand shocks (ODS) asymmetrically influence the sectoral returns of the power generation, chemical and fertilizer sectors. Moreover, oil-specific demand shocks (OSDS) symmetrically influence the returns of the power generation, chemical and fertilizer sectors. Fourth, the study employed the non-linear ARDL approach to explore the short- and long-run symmetric/asymmetric effect of the supply and demand shocks on sectoral returns. The results of the non-linear ARDL model show that the partial sum of positive/negative oil supply shocks (OSS) positively/negatively and significantly influences the stock returns of commercial banking in Pakistan, both in the short and long run. In addition, the partial sum of positive oil specific demand shocks (OSDS) negatively and significantly influences the stock returns of commercial banking, both in the short and long run. In power generation, the partial sum of positive/negative oil supply shocks (OSS) positively and significantly influences the stock returns. In addition, the partial sum of positive oil specific demand shocks (OSDS) negatively and significantly influences the stock returns, both in the short and long run. In the chemical sector, the partial sum of positive oil supply shocks (OSS) positively and significantly influences the stock returns, both in the short and long run. The partial sum of positive oil specific demand shocks (OSDS) negatively and significantly influences the stock returns, both in the short and long run. In addition, the partial sum of positive oil demand shocks (ODS) positively and significantly influences the stock returns, both in the short-run and long run. In the fertilizers sector, the partial sum of positive oil supply shocks (OSS) positively and significantly influences the stock returns in the long run. Moreover, the partial sum of positive oil specific demand shocks (OSDS) negatively and significantly influences the stock returns, both in the short and long run. The partial sum of negative oil demand shocks (ODS) negatively and significantly influences the stock returns, both in the short run and long run.
Based on the findings of the study, the policy implications are threefold: first, it is suggested to identify the causes of the change in the global oil price, that is, supply or demand shocks. Second, it is critical that policymakers adopt an integrated approach to risk management. Third, it is also recommended to raise the policy rate in case of oil-specific demand shocks. Finally, measures such as reducing the share of fossil fuel in the national energy portfolio, increasing efficiency and developing structural and technological alternatives are recommended to make production processes less intensive in terms of fossil fuels.
Author Contributions
Conceptualization, B.A. and D.K.; methodology, B.A. and D.K.; software, B.A. and D.K.; validation, B.A., D.K., M.S., R.M. and J.O.; formal analysis, B.A. and D.K.; investigation, B.A., D.K., M.S., R.M. and J.O.; resources, B.A. D.K. and M.S.; data curation, B.A. and D.K.; writing—original draft preparation, B.A. and D.K.; writing—review and editing, B.A., D.K., R.M. and J.O.; visualization, B.A. and D.K.; supervision, D.K., M.S., R.M. and J.O.; project administration, D.K. and M.S.; funding acquisition, R.M. and J.O. All authors have read and agreed to the published version of the manuscript.
Funding
This research received no external funding.
Institutional Review Board Statement
Not applicable.
Informed Consent Statement
Not applicable.
Data Availability Statement
The datasets used and analyzed during the current study are available from the corresponding author on reasonable request.
Conflicts of Interest
The authors declare no conflict of interest.
References
- Al-hajj, Ekhlas, Usama Al-Mulali, and Sakiru Adebola Solarin. 2018. Oil price shocks and stock returns nexus for Malaysia: Fresh evidence from nonlinear ARDL test. Energy Reports 4: 624–37. [Google Scholar] [CrossRef]
- Ansar, Ibraheem, and Nabila Asghar. 2013. The impact of oil prices on stock exchange and CPI in Pakistan. IOSR Journal of Business and Management 7: 5. [Google Scholar]
- Arshad, Rabia, and Adnan Bashir. 2015. Impact of oil and gas prices on stock returns: Evidence from Pakistan’s energy intensive industries. International Review of Social Sciences 3: 156–68. [Google Scholar]
- Atiq, Zeeshan, Muhammad Farhan, and Farah Iqbal Iqbal. 2018. Impact of oil prices on stock returns: Evidence from Pakistan’s stock market. Journal of Social Sciences and Humanities 57: 47–63. [Google Scholar] [CrossRef]
- Brown, Robert L., James Durbin, and James M. Evans. 1975. Techniques for testing the constancy of Regression relationships over time. Journal of the Royal Statistical Society: Series B (Methodological) 37: 149–63. [Google Scholar] [CrossRef]
- Caporale, Guglielmo Maria, Faek Menla Ali, and Nicola Spagnolo. 2015. Oil price uncertainty and sectoral stock returns in China: A time-varying approach. China Economic Review 34: 311–21. [Google Scholar] [CrossRef] [Green Version]
- Dickey, David A., and Wayne A. Fuller. 1981. Likelihood ratio statistics for autoregressive time series with a unit root. Econometrica 49: 1057–72. [Google Scholar] [CrossRef]
- Hadhri, Sinda. 2021. The nexus, downside risk and asset allocation between oil and Islamic stock markets: A cross-country analysis. Energy Economics 101: 105448. [Google Scholar] [CrossRef]
- Hajdu, Zuzana, Marek Andrejkovič, and Ladislav Mura. 2014. Utilizing experiments designed results during error identification and improvement of business processes. Acta Polytechnica Hungarica 11: 149–66. [Google Scholar]
- Hassan, Kamrul, Ariful Hoque, and Dominic Gasbarro. 2019. Separating BRIC using Islamic stocks and crude oil: Dynamic conditional correlation and volatility spillover analysis. Energy Economics 80: 950–69. [Google Scholar] [CrossRef]
- Hassan, Kamrul, Ariful Hoque, Muammer Wali, and Dominic Gasbarro. 2020. Islamic stocks, conventional stocks, and crude oil: Directional volatility spillover analysis in BRICS. Energy Economics 92: 104985. [Google Scholar] [CrossRef]
- Hesse, Heiko, and Tigran Poghosyan. 2016. Oil prices and bank profitability: Evidence from major oil-exporting countries in the Middle East and North Africa. In Financial Deepening and Post-Crisis Development in Emerging Markets. New York: Palgrave Macmillan, pp. 247–70. [Google Scholar]
- Huang, Bwo-Nung. 1995. Do Asian stock market prices follow random walks? Evidence from the variance ratio test. Applied Financial Economics 5: 251–56. [Google Scholar] [CrossRef]
- Jebran, Khalil, Shihua Chen, Gohar Saeed, and Alam Zeb. 2017. Dynamics of oil price shocks and stock market behavior in Pakistan: Evidence from the 2007 financial crisis period. Financial Innovation 3: 1–12. [Google Scholar] [CrossRef] [Green Version]
- Katrakilidis, Constantinos, and Emmanouil Trachanas. 2012. What drives housing price dynamics in Greece: New evidence from asymmetric ARDL cointegration. Economic Modelling 29: 1064–69. [Google Scholar] [CrossRef]
- Khan, Dilawar, Arif Ullah, Wajid Alim, and Ihtisham ul Haq. 2020. Does terrorism affect the stock market returns and volatility? Evidence from Pakistan’s stock exchange. Journal of Public Affairs 22: e2304. [Google Scholar] [CrossRef]
- Kilian, Lutz. 2009. Not all oil price shocks are alike: Disentangling demand and supply shocks in the crude oil market. American Economic Review 99: 1053–69. [Google Scholar] [CrossRef] [Green Version]
- Lin, Boqiang, and Tong Su. 2020. The linkages between oil market uncertainty and Islamic stock markets: Evidence from quantile-on-quantile approach. Energy Economics 88: 104759. [Google Scholar] [CrossRef]
- Meyer, Daniel Francois, and Natanya Meyer. 2019. Assessment of Inclusive Growth performance: A comparative analysis of the BRICS countries. Acta Universitatis Danubius. Œconomica 15: 191–207. [Google Scholar]
- Mishra, Shekhar, Arshian Sharif, Sashikanta Khuntia, Muhammad Saeed Meo, and Syed Abdul Rehman Khan. 2019. Does oil prices impede Islamic stock indices? Fresh insights from wavelet-based quantile-on-quantile approach. Resources Policy 62: 292–304. [Google Scholar] [CrossRef]
- Mohanty, Sunil K., Mohan Nandha, Abdullah Q. Turkistani, and Muhammed Y. Alaitani. 2011. Oil price movements and stock market returns: Evidence from Gulf Cooperation Council (GCC) countries. Global Finance Journal 22: 42–55. [Google Scholar] [CrossRef]
- Narayan, Paresh Kumar, and Susan Sunila Sharma. 2015. Does data frequency matter for the impact of forward premium on spot exchange rate? International Review of Financial Analysis 39: 45–53. [Google Scholar] [CrossRef]
- Narayan, Paresh Kumar, Dinh Hoang Bach Phan, and Susan Sunila Sharma. 2019. Does Islamic stock sensitivity to oil prices have economic significance? Pacific-Basin Finance Journal 53: 497–512. [Google Scholar] [CrossRef]
- Oberndorfer, Ulrich. 2009. Energy prices, volatility, and the stock market: Evidence from the Eurozone. Energy Policy 37: 5787–95. [Google Scholar] [CrossRef]
- Phillips, Peter C., and Pierre Perron. 1988. Testing for a unit root in time series regression. Biometrika 75: 335–46. [Google Scholar] [CrossRef]
- Shin, Yongcheol, Byungchul Yu, and Matthew Greenwood-Nimmo. 2014. Modelling asymmetric cointegration and dynamic Multipliers in a nonlinear ARDL framework. In Festschrift in Honor of Peter Schmidt. New York: Springer, pp. 281–314. [Google Scholar]
- Siddiqui, Rehana. 2004. Energy and Economic Growth in Pakistan. Pakistan Development Review 43: 175–200. [Google Scholar] [CrossRef] [Green Version]
- Syzdykova, Aziza. 2018. The Relationship between the Oil Price Shocks and the Stock Markets: The Example of Commonwealth of Independent States Countries. International Journal of Energy Economics and Policy 8: 161–66. [Google Scholar]
- Wald, Abraham. 1945. Sequential tests of statistical hypotheses. The Annals of Mathematical Statistics 16: 117–86. [Google Scholar] [CrossRef]
Publisher’s Note: MDPI stays neutral with regard to jurisdictional claims in published maps and institutional affiliations. |
© 2022 by the authors. Licensee MDPI, Basel, Switzerland. This article is an open access article distributed under the terms and conditions of the Creative Commons Attribution (CC BY) license (https://creativecommons.org/licenses/by/4.0/).