Article

Global Value Chains Participation during the COVID-19 Pandemic: A Dynamic Panel Approach

1
Faculty of Economics and Business, Gadjah Mada University, Yogyakarta 55281, Indonesia
2
Faculty of Economics, Sanata Dharma University, Yogyakarta 55281, Indonesia
3
Small and Medium Enterprise Development Center (SMEDC), Gadjah Mada University, Yogyakarta 55281, Indonesia
*
Author to whom correspondence should be addressed.
Economies 2022, 10(5), 121; https://doi.org/10.3390/economies10050121
Submission received: 5 April 2022 / Revised: 6 May 2022 / Accepted: 18 May 2022 / Published: 23 May 2022

Abstract

:
In recent decades, the emergence of global value chains (GVCs) has changed international trade patterns. Today, the production of goods involves international production sharing, which allows countries to trace the value-added distribution to international trade. However, the COVID-19 pandemic has lowered the trade intensity between countries and can disrupt many sectors. This study uses a dynamic panel approach with the generalized method of moments estimator to investigate the pandemic’s impact on GVC participation. We also investigate whether gross domestic product (GDP) per capita may influence GVC participation, and use institutional quality as control variables. We used the Asian Development Bank Multi-Regional Input-Output (ADB MRIO) data for the 2010–2020 period. We employ backward and forward linkage approaches based on value-added exports to address the overvaluation problems in gross exports. The empirical results illustrate that the COVID-19 pandemic led to a decrease in GVC participation, on average. Furthermore, GDP per capita plays a significant role in GVC participation in backward and forward linkages with higher-quality institutions.

1. Introduction

The COVID-19 pandemic has caused uncertainties in the international trade among countries connected by global value chains (GVCs). Declining global demand has reduced certain industrial exports to major export markets (Baldwin and di Mauro 2020; Ivanov 2020; Kazunobu and Hiroshi 2021; Vidya and Prabheesh 2020). Moreover, negative trade balances and capital outflows will most likely be further challenges for countries (Gereffi et al. 2005).
The supply chain in Asia has a significant regional dimension, making the East Asian countries of China, Japan, and Korea the most vulnerable to supply chain shocks. In the Association for Southeast Asian Nations (ASEAN) region as well as in Europe and America, these shocks are the primary source of economic transmission (Baldwin and di Mauro 2020; Kazunobu and Hiroshi 2021; Vidya and Prabheesh 2020). According to Guan et al. (2020), supply chain losses associated with early COVID-19 lockdowns were primarily determined by the number of nations implementing restrictions; in particular, losses were more sensitive to the duration of a lockdown than to its strictness. This policy resulted in lower output and lower final demand for countries’ products. In addition, the pandemic has significantly affected public health, and by extension, GVCs. For example, a health shock may cause abrupt disruption of GVCs owing to numerous deaths, and physical and mental health problems. Furthermore, due to a large number of positive coronavirus cases, particularly with the emergence of new strains, governments worldwide have imposed restrictions on the international movement of capital, products, and services, thereby disrupting economic activity (see also Danielle et al. 2020; Ivanov 2020; Vidya and Prabheesh 2020).
Importantly, GVCs capture the interrelation of trade, specialization, and growth among countries, and determine how a country participates in global production networks (Hummels et al. 2001). GVCs allow countries to specialize in improving their exports’ quality and, consequently, increase their trade balance, current accounts, and economic growth (Ge et al. 2020). The GVC concept involves the various activities required to deliver goods to final consumers (Prete et al. 2018; Hummels et al. 2001).
Meanwhile, researchers are still discussing ways to measure ASEAN countries’ participation in value-added trade. With international fragmentation, accurately measuring a country’s participation in GVCs requires information on the quantity of domestic and foreign value-added in exporting intermediate goods. Therefore, the calculation of the gross value is no longer feasible. Instead, participation in GVCs can be measured by decomposing gross exports based on backward and forward linkages (Hummels et al. 2001; Los et al. 2015; Asian Development Bank 2019; Borin and Mancini 2019). However, not all researchers have calculated the backward and forward linkage terms simultaneously; therefore, the assessment of ASEAN countries’ participation in GVCs is not comprehensive.
Furthermore, the measurement of GVC participation has received limited attention since it requires input-output data; accessing these data and an updated input-output database remains challenging (Athukorala and Yamashita 2006; Inomata 2017; Qin et al. 2020; Mandras and Salotti 2020). Compared with these studies, our study covered trade in value-added by using recently released Asian Development Bank Multi-Regional Input-Output (ADB MRIO) data, which allows us to trace the value-added in producing specific goods during the COVID-19 pandemic period. This study investigates the impact of the COVID-19 pandemic on GVC participation using a dynamic panel model. This model aims to capture dynamic adjustments in value-added trade, yet it has not been widely used in previous studies.
GVC participation is also directly proportional to a country’s GDP per capita. Thus, GDP per capita, which measures a country’s economic well-being or living standards, significantly impacts GVC participation. For example, to alleviate trade imbalances and sharp trade volatility, governments in high-income countries can finance intermediate export product production (see also Koch 2020; Felice and Tajoli 2021). Furthermore, GVC participation prospects attract foreign investment, which provides opportunities for profit-sharing as well as economic, technological, and industrial upgrading (Gereffi and Lee 2016).
In addition, the role of institutional quality in international production sharing has received increasing attention in the last two decades. Higher institutional quality, such as government effectiveness and the rule of law, is associated with higher GVC participation and economic growth (Acemoglu et al. 2005; Levchenko 2007; Ge et al. 2020; Zergawu et al. 2020; Francois and Manchin 2013; Kaufmann et al. 2010).
This study comprehensively assesses the COVID-19 pandemic’s impact on GVC participation under institutional quality, which differs for each country. We use the system generalized method of moments (SYS-GMM), a dynamic panel approach in the GVC framework, to estimate dynamic adjustment and address potential endogeneity issues. Using this approach, more exciting results have been discovered than the existing ones. The study also develops an analysis theory of trade in value-added by measuring worldwide countries’ GVC participation using the recently released ADB MRIO database. The empirical findings illustrate that the COVID-19 pandemic led to an average decrease in GVC participation. Furthermore, the GDP per capita plays a significant role in GVC participation in backward and forward linkages with higher quality institutions. Also, the government’s policy contribution is required in the economic recovery following the COVID-19 pandemic. Governments should promote value-added exports, particularly in high-value-added sectors. Government effectiveness and the rule of law must be realized to implement resilient GVCs.
The remainder of this study is organized as follows. Section 2 discusses the theoretical background and undertakes the literature review. Section 3 introduces our methodology. Section 4 outlines the empirical results and undertakes the discussion. Finally, Section 5 presents our concluding remarks and policy recommendations.

2. Theoretical Background and Literature Review

Analysis of trade-in value-added has been widely discussed since the development of the new international trade theory, which traces value-added distribution in international trade (Gereffi et al. 2005; Athukorala and Yamashita 2006; Inomata 2017). Today, a country no longer needs to proceed to all stages of good production. Instead, a series of production stages are captured in the GVCs. GVCs are a network of goods and services production stages manufactured and assembled in different countries or across international borders (Hummels et al. 2001; Gereffi et al. 2005; Inomata 2017; Prete et al. 2018).
Studies on GVC participation are more effective when they consider the impact of the latest developments in cross-border production sharing. However, traditional trade theory calculates trade flows between countries using gross value, not reflecting each production chain’s value distribution. These traditional measurements result in overvaluations of international trade statistics, which rely heavily on imported intermediates. Moreover, this bias has increased (Athukorala and Yamashita 2006; Wang et al. 2018; Borin and Mancini 2019). Hence, academics have begun to calculate each chain’s value-added contribution to represent real value. This is possible due to the fact that goods’ production is fragmented internationally (Wang et al. 2018; Inomata 2017; Hummels et al. 2001; Widodo 2008).
Here, we employ both backward and forward linkage approaches to generate a comprehensive measure of GVC participation. This method measures the domestic and foreign value-added content of gross exports originating from economic sectors worldwide (Koopman et al. 2014; Wang et al. 2018; Kersan-Škabic and Belullo 2021). Studies show that if forward GVC participation is higher than backward participation, then the country’s economy or sector is significantly involved in upstream activities, and vice versa (Prete et al. 2018; Asian Development Bank 2019).
Importantly, international fragmentation activities have been severely affected by the trade disruption caused to the COVID-19 pandemic, which has also induced consumer and producer behavior changes; together, these have affected production and distribution networks (Baldwin and di Mauro 2020; Vidya and Prabheesh 2020). Furthermore, a new wave of infections is possible due to the emergence of a new variant, which would necessitate another protracted lockdown. For example, China is a major trading partner for many countries worldwide. Therefore, the pandemic’s impact on China directly risks value-added trade in several sectors of numerous countries. Researchers also note that COVID-19 most likely disrupts industries that are more dependent on GVCs, especially those with robust integration with the global supply chains (Qin et al. 2020; Kazunobu and Hiroshi 2021; Ivanov 2020). For example, when COVID-19 was confined to China by a strict 2-month lockdown, the global value-added related to China’s electronics sector dropped by 27.3%. Meanwhile, the effects on China’s electronics sector lead to significant upstream production reductions of approximately 21% in the South Korean and Japanese electronics, and Australian metals industries (Guan et al. 2020). Thus, governments worldwide have sought to control the spread of COVID-19 by administering vaccines and adhering to health protocols. Notably, a vaccination program is required to establish herd immunity in society, just as fiscal and monetary stimulus policies are needed to restore economic conditions (see also Danielle et al. 2020; Strange 2020).
Note that GDP per capita significantly impacts a country’s participation in GVCs and international trade. The higher the real GDP growth rate, the greater a country’s ability to generate expected future income to finance expenditures, such as imports of intermediate goods to produce intermediate exports (Felice and Tajoli 2021; Kazunobu and Hiroshi 2021). This measure is essential to sustainable development’s economic and developmental aspects (Koch 2020).
Institutions are also critical to GVCs’ sustainability. In some industries, reliance on institutions is a technological aspect of the manufacturing process. Contracts are incomplete in countries with poor institutions (Acemoglu et al. 2005; Levchenko 2007). Then, the economy also suffers from inefficiencies. Evidence suggests that lack of appropriate contract enforcement leads to severe distortions. The institutional quality of trade partners has a substantial impact on bilateral trade, with better institutions leading to higher trade volumes. In this paper, we analyze the drivers of GVC participation using institutional data with the following two drivers: government effectiveness (bureaucratic competence and the quality of public service delivery) and the rule of law (the quality of contract enforcement).

3. Methodology

3.1. Data Description

We evaluate the influence of the COVID-19 pandemic on GVC participation using the recently released ADB MRIO database. This database covers 62 nations, with another 132 countries aggregated as the rest of the world, and has a disaggregation level of 35 industries (Asian Development Bank 2019). We use annual data from 41 nations in the ASEAN, East Asia, European Union (EU), and North America (NA) groups from 2010 to 2020 (Appendix A Table A1). In addition, we use data on GDP per capita and several institutional indicators (Kaufmann et al. 2010). These data are taken from the ADB MRIO, and the World Bank’s WGI and World Development Indicators (WDI). Details are presented in Table 1.
We extend the fundamental input-output framework for a single economy to a MRIO model to trace links between countries and sectors (Leontief 1936; Hummels et al. 2001; Mandras and Salotti 2020). In addition, the input-output model assists in understanding the effects of various government policies on a specific industry or the entire economy (Kee and Tang 2016).

3.2. Decomposing Gross Exports into Value-Added Terms

We calculate a country’s participation in the GVC using the GVC participation ratio based on the export decomposition equation. This study relies on the forward and backward industrial linkages approach. Here, the export decomposition equation follows Leontief’s insight (Leontief 1936). All countries’ gross outputs must be used as intermediate or final products in their own countries or other countries (Koopman et al. 2014; Los et al. 2015; Asian Development Bank 2019; Wang et al. 2018; Mandras and Salotti 2020):
X s = A s s X s + Y s s + A s r X r + Y s r           r , s = 1 , 2
where X s is the N × 1 matrix of the gross outputs of country s, A s r is the N × N input- output matrix coefficient for the intermediate use of intermediate goods and services in country r produced in the country s, Y s r is the N × 1 matrix of the final demands of country r for the final products produced in-country s. The following matrix notation represents the production and trade systems of two countries:
[ X s X r ] = [ 1 A s s A s r A r s 1 A r r ] 1 [ Y s s Y s r Y r s Y r r ] = [ B s s B s r B r s B r r ] [ Y s Y r ]
where B s r shows the inverse Leontief N × N matrix as the total requirement matrix representing the number of gross outputs needed by country s to produce a unit of final demand increase in-country r. Y s is the N × 1 vector that refers to the global use of final products in country s, including final domestic sales of Y s s and exports of final products Y s r .
As suggested by the definition of input-output coefficients, A s s and A r s units of domestic and imported intermediate goods, respectively, are used to produce one unit of goods in country s. Therefore, the fraction of domestic outputs that represent the domestic value-added in country s is represented by the following:
V s = 1 A s s A r s
Similarly, the share of domestic value-added in gross output by country r is represented by the following:
V r = 1 A r r A s r
The decomposition of the value-added of the country-sector and final products production level as a direct application of the standard Leontief decomposition can be stated as follows:
V ^ B Y ^ = [ V ^ s 0 0 V ^ r ] [ B s s B s r B r s B r r ] [ Y ^ s 0 0 Y ^ r ] = [ V ^ s B s s Y ^ s V ^ s B s r Y ^ r V ^ r B r s Y ^ s V ^ r B s s Y ^ s ]
For N (sector) = 2, we define:
V ^ B Y ^ = [ V 1 s 0 0 0 0 V 2 s 0 0 0 0 V 1 r 0 0 0 0 V 2 r ] [ b 11 ss b 12 ss b 11 sr b 12 sr b 21 ss b 22 ss b 21 sr b 22 sr b 11 rs b 12 rs b 11 rr b 12 rr b 21 rs b 22 rs b 21 rr b 22 rr ] [ y 1 s 0 0 0 0 y 2 s 0 0 0 0 y 1 r 0 0 0 0 y 2 r ] = [ v 1 s b 11 ss y 1 s v 1 s b 12 ss y 2 s v 1 s b 11 sr y 1 r v 1 s b 12 sr y 2 r v 2 s b 21 ss y 1 s v 2 s b 22 ss y 2 s v 2 s b 21 sr y 1 r v 2 s b 22 sr y 2 r v 1 r b 11 rs y 1 s v 1 r b 12 rs y 2 s v 1 r b 11 rr y 1 r v 1 r b 12 rr y 2 r v 2 r b 21 rs y 1 s v 2 r b 22 rs y 2 s v 2 r b 21 rr y 1 r v 1 r b 22 rr y 2 r ]
The sum of the V ^ B Y ^ matrix along a row indicates the domestic value-added (DVA) contributions of each country’s specific sector used by that sector as well as all other countries’ sectors. This sum traces the forward industrial linkages across all countries. The sum of the V ^ B Y ^ matrix down the column accounts for the value-added contributions of all countries’ sectors (FVA) to the final products of a specific country’s sector. This sum represents backward industrial linkages between countries. Gross exports can be decomposed into two main categories, DVA and vertical specialization (Los et al. 2015; Wang et al. 2018).

3.3. Measuring Global Value Chains’ Participation

We estimate the country’s participation in GVC by using the GVC participation ratio based on the forward and backward industrial linkages approach. On the one hand, the backward linked perspective reveals that final goods and services use intermediary inputs from other countries, or that the share of FVA is used to produce a country’s export goods to total world exports. Table 2 shows the export decomposition equation.
For each economy, s with sector k that exports to all other economies r, the following measures the backward GVC participation ratio ( GVCB ) is as follows (Asian Development Bank 2015; Wang et al. 2018):
G V C B = k r D D C s r k + F V A _ F I N s r k + F V A _ I N T s r k + F D C s r k k r E X P s r k
On the other hand, the forward linkage perspective states that an economy can supply DVA by exporting intermediate products to other countries or the share of DVA embedded in intermediate exports to total world exports. Table 3 presents the export decomposition equation. The forward GVC participation ratio of the economy s ( GVCF ) is as follows (Asian Development Bank 2015; Wang et al. 2018):
G V C F = k r D V A _ I N T s r k + D V A _ I N T r e x s r k + R D V _ G s r k k r E X P s r k

3.4. Econometrics Model Specification

We investigate the impact of the COVID-19 pandemic on GVC participation using dynamic panel data estimations. This provides the advantage of examining dynamic adjustment observations by assuming that export behavior is stochastic. However, the process could be dynamic, with incompletely exogenous regressors presumably connected with earlier and possibly current error term realizations. Here, we use a GMM dynamic panel. This technique has the advantage of controlling unobserved individual heterogeneity and provides more information on data variations to minimize the occurrence of multicollinearity (Baltagi 2005).
Within the GMM framework, econometric analyses employ two estimation procedures: first-difference GMM (FD-GMM) and system GMM (SYS-GMM). Here, we use SYS-GMM. FD-GMM estimator has a major limitation, specifically the weak instrument (Blundell and Bond 1998).
The SYS-GMM estimator was developed by Blundell and Bond (1998) to minimize the bias in FD-GMM, and overcome this weakness (Arellano and Bover 1995; Blundell and Bond 1998; Baltagi 2005). This estimator employs a lagged variable as an instrument, assuming that white noise errors lose consistency if they are serially correlated. Consequently, the Hansen, and Arellano and Bond (AB) tests are required. First, the Hansen test is used to isolate over-identifying restrictions, that is, to determine the validity of an exogenous instrument. For this test, the null hypothesis is that the instrument is valid since it is not correlated with the error term. If the Hansen test rejects the null hypothesis, it indicates a relationship between the instrument and the error term, and that the estimator is biased and inconsistent. Second, the AB test determines whether there is a residual serial correlation. The null hypothesis is that there will be no second-order serial correlation or autocorrelation in idiosyncratic errors. Thus, based on the SYS-GMM model, the empirical model for GVC participation is as follows:
G V C i t = α + j = 1 p β j G V C i , t j + ω   C O V I D 19 i t + δ 1   G D P i , t + + δ p   G D P i , t p + τ X i t + μ i + v i t
where the subscript t = 1, …, T denotes years; i = 1, …, N indicates countries; μ i is unobserved individual heterogeneity; and v i t represents idiosyncratic error. μ i and v i t are assumed ~   I I D   ( 0 , σ v 2 ) . Moreover, G V C i t is the GVC participation of country i during period t in terms of backward and forward linkages. In the model, we consider the impact of the COVID-19 pandemic by including a COVID-19 dummy variable in the GVC participation model since the COVID-19 pandemic is expected to have caused a shock in countries’ economies. In addition, variables that affect GVC are included, namely, GDP per capita ( G D P i t ). X it is a row vector that includes a series of control variables and τ denotes a column vector comprising the corresponding coefficients of these control variables. Our control variables include government effectiveness ( G O V i t ) and rule-of-law ( R U L E i t ) . α is a constant, while β , ω ,   δ , and τ are the estimated regression parameters. The study period spans 2010–2020. We also consider the impact of the COVID-19 pandemic shock in the GVC participation model. These techniques are used as robustness checks to assess the consistency of the relationships between the variables of interest. In summary, we essentially employ a dynamic panel model based on panel data from 41 countries (N) over ten years (T) to achieve our research objectives.
It is critical to evaluate whether the variables of interest are stationary before proceeding with the empirical estimation. The Levin, Lin, and Chu (LLC) tests, as recommended by Hao et al. (2015), assume a unit root process for each individual. This analysis is widely used to avoid potentially biased results for panel data with structural breaks and is attracting increasing attention in international trade network analyses. Here, we also use the LLC test.

4. Empirical Results and Discussion

This section discusses the estimation results from the GVC participation model, where the COVID-19 pandemic and GDP per capita are our variables of interest, with institutional quality as a control variable. Table 4 presents the descriptive statistics.

4.1. Descriptive Statistics

Table 4 shows summary statistics for the variables of interest by country group. The list of country group members is shown in Table A1. The sample average for forward GVC participation for the ASEAN countries is 0.46, with Laos having the lowest forward GVC participation at 0.21 in 2011. Conversely, Brunei had the highest forward GVC participation at 0.85 in 2015. The standard deviation of 0.16 reveals a minimal dispersion of the sample means. Similarly, the sample average for backward GVC participation for the ASEAN countries is 0.29, with Brunei having the lowest at 0.08 in 2010 and Singapore the highest at 0.56 in 2012. Again, the standard deviation of 0.13 reveals a minimal dispersion of the sample means.
The sample mean for GDP for ASEAN countries is 8.62, with Cambodia having the lowest at 6.79 in 2010, while Singapore has the highest at 11.02 in 2019. The standard deviation of 1.24 reveals a large dispersion among countries from the sample average of 6.79%. In these countries, the sample averages for the institutional variables of government effectiveness and the rule of law are 0.35 and −0.02, respectively.
Comparatively, NA has the highest average forward GVC participation of 0.56, while the EU has the highest average backward GVC participation of 0.39. High GDP per capita in developed countries drove high GVC participation, which had an average of 10.12 in the EU and the highest in Luxembourg at 11.56 in 2019. In general, NA has the highest average values for government effectiveness and rule of law, whereas ASEAN has the lowest. The rule of law has the lowest institutional score in ASEAN (−0.02), while NA has the highest (1.67).

4.2. Panel Unit Root Test

Next, we perform the unit root test for the variables of interest using LLC tests. As shown in Table 5, all variables are stationary since the LLC test’s p-value is less than 5%, which means that the null hypothesis (Ho)–all panels containing a unit root–is rejected.

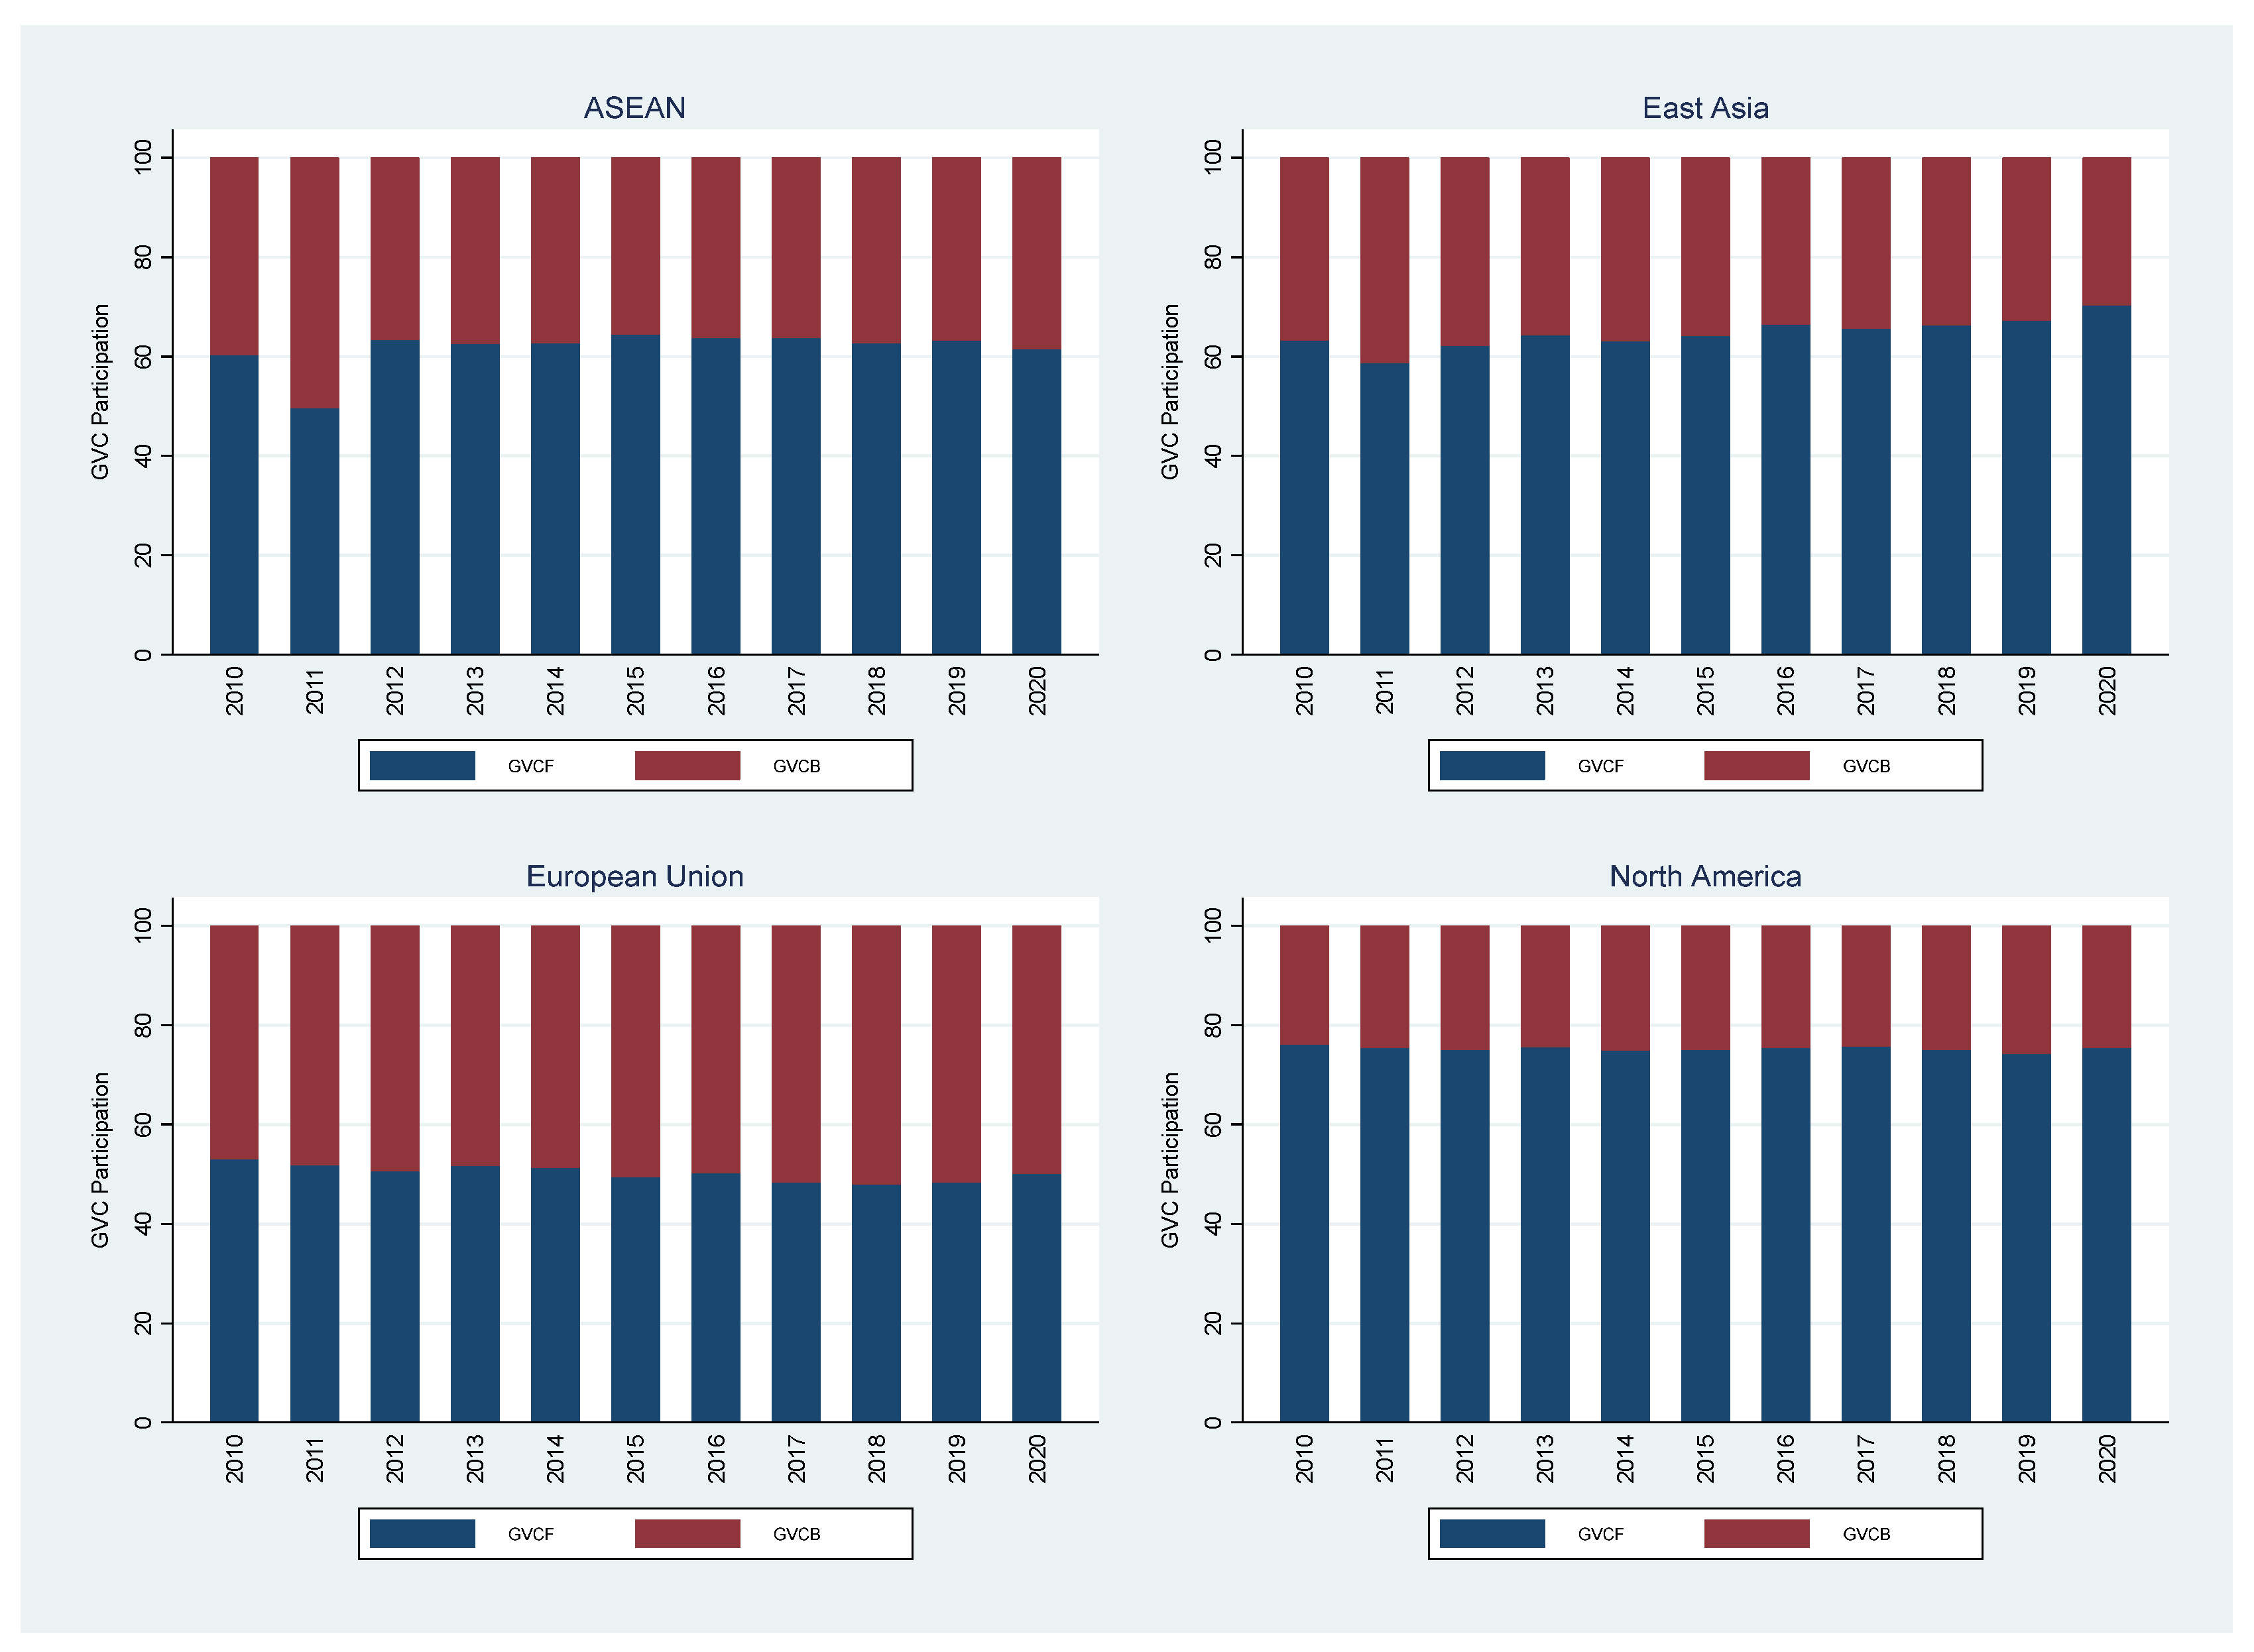
4.3. Backward and Forward Linkage Global Value Chains Participation

Figure 1 demonstrates that NA had the highest average GVCF participation over the observation period (0.64). Meanwhile, the East Asian countries group had the lowest score (0.46). In terms of backward linkage, the EU has the highest average GVCB participation of 0.44, while NA has the lowest of 0.21. Furthermore, Figure 1 reveals that forward GVC participation by major countries dominates backward linkages.
In ASEAN, based on backward linkage, Singapore has the highest GVC participation rate, with a GVCB value of 0.56 in 2012. Notably, Singapore’s GVCB participation remained high until the pandemic outbreak. However, in 2020, it dropped to 0.457. The substantial contribution of FVA to value-added exports suggests that a greater downstream area may be integrated into the higher value-added production stage. In terms of exports, Singapore has a high level of vertical specialization, particularly in the manufacturing sector (González and Kowalski 2017). Furthermore, according to Prete et al. (2018), comparatively developed countries have made major contributions to the creation of FVA.
A forward linkage perspective reveals that most ASEAN countries best use their local resources (González and Kowalski 2017). Notably, the pandemic interrupted the international production network, on average. Figure 2 illustrates that during the introduction of the lockdown restriction, the DVA embedded in intermediate inputs provided to the first importer and subsequently re-exported to a third country (DVA_INTrex) of all ASEAN countries exhibited a downward trend. Consequently, the pandemic hampered ASEAN countries’ efforts to increase GVCF participation: ASEAN GVCF participation decreased, on average, from 0.482 in 2019 to 0.478 in 2020.
South Korea (hereafter Korea) has the highest GVC participation rate based on backward linkages in East Asia, with a GVCB participation value of 0.40 in 2012. GVCB participation in Korea remained relatively high until the emergence of the pandemic in 2020, it dropped to 0.286. In the early stages of the COVID-19 pandemic, GVCB participation in China and Japan decreased by 4.44% and 6.02%, respectively. This was mainly due to restrictions that resulted in a 5.87% decline in FVA from the importer, who was embedded in intermediate exports to manufacture its exports (FVA_INT). According to the forward linkage perspective, China’s GVCF participation decreased significantly to 13.54%, reflecting China’s exports’ high domestic value-added content (Kee and Tang 2016). During the early stages of the COVID-19 pandemic, the DVA_INTrex of East Asian countries decreased by 6.89% (Figure 2).
Luxembourg, with a GVCB participation value of 0.73 in 2011, has the highest GVC participation rate based on backward linkages in the EU. Still, the GVCB value decreased due to the pandemic to 0.66 in 2020. Malta was another European country with a high GVCB score of 0.58 in 2018, also 0.55 during the pandemic. According to the forward linkage perspective, Romania experienced a considerable drop in GVCF of 8.94%. During the early stages of the COVID-19 pandemic, Romania’s DVA_INTrex declined by approximately 2.21%.
Canada has the highest GVC participation rate in NA based on backward linkage, with a GVCB score of 0.26 in 2019. However, due to the pandemic, this score declined by 3.52% to 0.247 in 2020. A forward linkage perspective shows that the United States and Canada consistently have high GVCF participation rates. In 2020, the projected value of GVC participation in the United States was 0.59. However, during the pandemic, the United States experienced a decline in DVA_INTrex of approximately 20.53% compared to 2018 (Figure 2).

4.4. The SYS-GMM Dynamic Panel Estimation

Table 6 presents the results of the SYS-GMM estimation. This study uses the SYS-GMM dynamic panel approach to avoid cross-sectional regressions, as in previous studies, leading to potential bias (Zergawu et al. 2020). Furthermore, it provides more reliable results by addressing the endogeneity problem through the system-GMM estimator (Arellano and Bover 1995; Blundell and Bond 1998).
For GMM-type instruments, this model uses the first and higher lags of the predetermined variable, and the second and higher lags of the endogenous variable. The first lag-dependent variable, GVCF or GVCB, is chosen as the predetermined variable. The COVID-19 pandemic dummy is treated as an independent variable to examine the pandemic’s effect on GVC participation. Furthermore, we incorporate GDP per capita, which influences GVC participation, as an independent variable and institutional variables as control variables (see also Mouanda and Gong 2019; Koch 2020; Zergawu et al. 2020). The preliminary assessment suggests that our variable of interest is not completely exogenous, and that robustness checks with a two-step system GMM are required to address endogeneity issues in the model (Arellano and Bond 1991; Arellano and Bover 1995; Blundell and Bond 1998).
The analysis was performed using STATA version 17. Arellano and Bond (1991) tests for autocorrelation in differences are AR (1) and AR (2). As previously stated, Hansen’s test is used for over-identification constraints (Zergawu et al. 2020). Since GVC is a process, the lagged form of the variable was included in the models to allow for partial adjustment of the GVC to its long-run equilibrium value. Consequently, previous levels of GVC influence the current levels.
As shown in Table 6, the coefficient of the lagged GVC variable was positive and significant in all regressions estimated using the Arellano and Bond (1991). The positive sign of the coefficient indicates that the GVC of global countries in previous periods contributed positively to that of the current period as a result of raw material imports in the previous period. Notably, approximately 35.3% of domestic value-added exports reflect the previous period’s exports. Furthermore, the results of the SYS-GMM regression show that GDP per capita has a positive and significant effect on GVC participation, consistent with previous research (González and Kowalski 2017; Amendolagine et al. 2019; Felice and Tajoli 2021). These findings indicate that GDP per capita affects both forward- and backward-linkage GVC participation with coefficients of 0.178 and 0.050, respectively. This difference between the coefficients may be due to the performance of developing countries, which have lower levels of GDP per capita than developed countries. In addition, for most of the world’s countries, GVCF dominates GVCB.
Furthermore, we find that COVID-19 has a significant negative (−0.006) impact on international trade in value-added, and forward and backward linkages (Kazunobu and Hiroshi 2021). Due to the COVID-19 pandemic, policies such as border closures and quarantine-related restrictions limited trading activity, and reduced the use of domestic and foreign resources. A longer lockdown should cause more significant losses and potentially suffer inoperability sectors over time (Guan et al. 2020; Danielle et al. 2020; Strange 2020).
Consequently, the supply of intermediate inputs from other countries is restricted, resulting in decreased current aggregate demand and aggregate supply (Baldwin and di Mauro 2020; Ivanov 2020; Strange 2020). Restrictive policies during the pandemic seems to cause shocks in supply and demand. These shocks are the reasons behind economic transmission which limits international sharing distribution activity and reduced the use of domestic and foreign resources. The further impacts are lower output gap and final demand for the countries’ products. This implies that the COVID-19 pandemic will negatively impact global trade (Qin et al. 2020; Vidya and Prabheesh 2020; Kazunobu and Hiroshi 2021). However, despite the recent recovery in health and economic conditions, it is still too early to declare it an epidemic due to the possible emergence of new strains.
The control variable coefficients reveal several interesting findings. We use quality institutional variables as the control variables. Despite the large differences in regional institutions and high political volatility among countries, institutions play an important role in GVC participation (Ge et al. 2020). Institutions play a role in contract enforcement, property rights, and shareholder protection, among other aspects. This role is critical since contracting imperfections between private parties affect production relationships (Levchenko 2007). Inefficiencies and substantial distortions occur in this situation. This situation may be due to segmented factor markets (Acemoglu et al. 2005; Levchenko 2007). Larger trade volumes are associated with countries with better institutions, which are usually developed countries. Gereffi and Lee (2016) have emphasized the importance of synergistic governance as a strategy for simultaneously achieving economic and social upgrading among GVC and industrial cluster actors. Further, Levchenko (2007) argues that differences in institutional quality can be a source of comparative advantage and an essential determinant of trading patterns.
Our findings imply that institutional quality has a positive and significant impact on GVC participation in countries worldwide. Furthermore, local institutions may significantly impact the location of production chains, resulting in the spread of GVCs throughout the region. Our findings show countries may participate more in GVCs when they have higher government effectiveness; better bureaucracy competence and quality of public service delivery; the better rule of law; higher quality of contract enforcement, the police, and the courts; and a lower likelihood of crime and violence. These findings are consistent with previous studies (González and Kowalski 2017; Amendolagine et al. 2019; Mouanda and Gong 2019; Ge et al. 2020; Zergawu et al. 2020).

4.5. Robustness Test

To ensure the validity of our findings, we modeled the regressions using other COVID-19 variables, such as COVID shocks, which indicate economic fluctuations (Zergawu et al. 2020). COVID shocks are based on the gross export gap (hereafter, the export gap), the difference between real and potential exports (Hubbard et al. 2014). We chose the export gap since it directly impacts trade fluctuations. Further, identifying this gap can help a country achieve its best export performance (González and Kowalski 2017). A recession occurs when the potential value exceeds the real value and vice versa. As potential exports are difficult to observe in the real world, they are frequently proxied by their expected value. We used the Hodrick-Prescott (HP) filter to determine the expected export value (Hubbard et al. 2014; Gordon 2014). Indeed, COVID shocks reveal changes in exports over time. Furthermore, this method helps examine whether other aspects of COVID-19 affected countries’ GVC participation.
The robustness test results reveal that the COVID shock harms GVC participation, forward (−0.059) and backward (−0.082) linkages. The increasing fragmentation of production makes countries that are mostly domestically oriented vulnerable to global shocks. Furthermore, the regression results in Table 7 show that GDP per capita has the expected sign and magnitude. The two index measures have positive and significant coefficients when controlling institutional quality. This indicates that institutional factors in the exporting country, such as government effectiveness and the rule of law, have a critical and significant effect on export performance. Notably, the export performance is enhanced by market-oriented institutional systems in the exporting country. In both backward and forward GVC participation models, all factors proxying institutional quality are positive and significant. Thus, our findings support and emphasize the role of institutional quality in trade performance (Acemoglu et al. 2005; Levchenko 2007; Francois and Manchin 2013; Ge et al. 2020; Zergawu et al. 2020). Moreover, the estimation results from these alternate measures are consistent with the preliminary results.
Finally, our specification tests supported our instrument’s validity. The over-identification and AR (2) test statistics at the 95% confidence level revealed no evidence of poor instrument selection or inadequate model specification in any regressions. Consequently, the findings of the dynamic panel are relatively reliable, indicating that the COVID-19 pandemic has a significant impact on GVC participation. Similarly, with the quality of institutions as a control variable, GDP per capita tended to significantly increase GVC participation. Finally, our estimation results show that even after addressing possible omitted variables and endogeneity issues by employing SYS-GMM-based panel data estimators, the COVID-19 pandemic is crucial for GVC participation (Baldwin and di Mauro 2020; Qin et al. 2020; Guan et al. 2020).

5. Concluding Remarks

The COVID-19 pandemic’s fluctuating economic conditions can destabilize global output and lead to possible negative trade growth. Moreover, shocks in world manufacturing centers of a country can spread to other countries since each country is currently connected to GVCs. This study examines the influence of the COVID-19 pandemic on GVC participation using the ADB MRIO database from 2010 to 2020. We employ backward and forward linkage approaches based on value-added exports to address the overvaluation problems in gross exports. We also investigate potential GDP per capita determinants affecting GVC participation and use institutional quality as a control variable. In addition to assessing dynamic adjustment observations, we use the system generalized method of moments estimator to address potential endogeneity concerns.
The empirical results illustrate that the COVID-19 pandemic led to an average decrease in GVC participation. Furthermore, GDP per capita plays a significant role in GVC participation in backward and forward linkages with higher-quality institutions. We discovered that forward GVC participation dominated backward linkage in most countries, indicating that these countries’ economies or sectors are heavily involved in upstream activities. North American countries had the highest average GVC participation from the forward linkage perspective. Meanwhile, EU countries have the highest backward linkage values.
This study demonstrates the importance of government assistance in recovering economic and health conditions following the COVID-19 pandemic. Furthermore, governments worldwide should expand value-added exports to increase GVC participation, particularly in leading sectors. High-quality institutions must also be realized to implement resilient GVCs. Finally, more research is needed to determine a country’s position in GVCs so that each government can improve its comparative advantage.

Author Contributions

Conceptualization, J.W. and T.W., and A.S.H.; Methodology, J.W., and T.W.; Software, J.W.; Validation, J.W., T.W., and A.S.H.; Formal Analysis, J.W., T.W., and A.S.H.; Investigation, T.W., A.S.H.; Resources, J.W.; Data Curation, J.W.; Writing—Original Draft Preparation, J.W.; Writing—Review & Editing, T.W., and A.S.H.; Visualization, J.W.; Supervision, T.W., A.S.H.; Project Administration, J.W., A.S.H.; Funding Acquisition, J.W. All authors have read and agreed to the published version of the manuscript.

Funding

This research received no external funding.

Institutional Review Board Statement

Not applicable.

Informed Consent Statement

Not applicable.

Data Availability Statement

The data presented in this study are available on request from the corresponding authors.

Acknowledgments

The authors are thankful to the ADB team for providing the required data. We also would like to thank anonymous reviewers for their valuable comments and suggestions.

Conflicts of Interest

The authors have no conflict of interest to declare.

Appendix A

Table A1. List of Countries in the ADB Multi-Regional Input-Output.
No.GroupCountries
1ASEANIndonesia, Malaysia, Philippines, Singapore, Thailand, Viet Nam, Brunei Darussalam, Lao PDR, Cambodia
2East AsiaPeople’s Republic of China, Japan, Republic of Korea
3EUAustria, Belgium, Bulgaria, Cyprus, Czech Republic, Germany, Denmark, Spain, Estonia, Finland, France, Greece, Croatia, Hungary, Ireland, Italy, Lithuania, Luxembourg, Latvia, Malta, Netherlands, Poland, Portugal, Romania, Slovak Republic, Slovenia, Sweden
4NAUnited States, Canada
Source: Authors’ Compilations.

References

  1. Acemoglu, Daron, Simon Johnson, and James A. Robinson. 2005. Institutions as a Fundamental Cause of Long-Run Growth. Handbook of Economic Growth 1: 385–472. [Google Scholar] [CrossRef]
  2. Amendolagine, Vito, Andrea F. Presbitero, Roberta Rabellotti, and Marco Sanfilippo. 2019. Local Sourcing in Developing Countries: The Role of Foreign Direct Investments and Global Value Chains. World Development 113: 73–88. [Google Scholar] [CrossRef]
  3. Arellano, Manuel, and Olympia Bover. 1995. Another Look at the Instrumental Variables Estimation of Error Component Models. Journal of Econometrics 68: 29–51. [Google Scholar] [CrossRef] [Green Version]
  4. Arellano, Manuel, and Stephen Bond. 1991. Some Tests of Specification for Panel Data:Monte Carlo Evidence and an Application to Employment Equations. The Review of Economic Studies 58: 277–97. [Google Scholar] [CrossRef] [Green Version]
  5. Asian Development Bank. 2015. Global Value Chains Indicators for International Production Sharing. Key Indicators for Asia and the Pacific 2015. Manila: Asian Development Bank, Available online: https://www.adb.org/sites/default/files/publication/175162/gvc.pdf (accessed on 9 March 2021).
  6. Asian Development Bank. 2019. The Evolution of Indonesia’s Participation in Global Value Chains. Manila: Asian Development Bank. [Google Scholar] [CrossRef] [Green Version]
  7. Athukorala, P. Chandra, and Nobuaki Yamashita. 2006. Production Fragmentation and Trade Integration: East Asia in Global Context. North American Journal of Economics and Finance 17: 233–56. [Google Scholar] [CrossRef] [Green Version]
  8. Baldwin, Richard, and Beatrice W. di Mauro. 2020. Economics in the Time of COVID-19. Edited by Baldwin and Beatrice Weder Di Mauro. A VoxEU.org eBook. London: CEPR Press, Available online: https://voxeu.org/article/economics-time-covid-19-new-ebook (accessed on 2 April 2021).
  9. Baltagi, Badi H. 2005. Econometric Analysis of Panel Data. Hoboken: John Wiley & Sons Ltd. [Google Scholar]
  10. Blundell, Richard, and Stephen Bond. 1998. Initial Conditions and Moment Restrictions in Dynamic Panel Data Models. Journal of Econometrics 87: 115–43. Available online: https://www.ucl.ac.uk/~uctp39a/Blundell-Bond-1998.pdf (accessed on 10 June 2021). [CrossRef] [Green Version]
  11. Borin, Alessandro, and Michele Mancini. 2019. Measuring What Matters in Global Value Chains and Value-Added Trade. WPS 8804. Available online: http://hdl.handle.net/10986/31533 (accessed on 25 November 2021).
  12. Danielle, S. Yu Krista, Kathleen B. Aviso, Joost R. Santos, and Raymond R. Tan. 2020. The Economic Impact of Lockdowns: A Persistent Inoperability Input-Output Approach. Economies 9: 109. [Google Scholar] [CrossRef]
  13. Felice, Giulia, and Lucia Tajoli. 2021. Trade Balances and Global Value Chains: Is There a Link? Structural Change and Economic Dynamics 59: 228–46. [Google Scholar] [CrossRef]
  14. Francois, Joseph, and Miriam Manchin. 2013. Institutions, Infrastructure, and Trade. World Development 46: 165–75. [Google Scholar] [CrossRef] [Green Version]
  15. Ge, Ying, David Dollar, and Xinding Yu. 2020. Institutions and Participation in Global Value Chains: Evidence from Belt and Road Initiative. China Economic Review 61: 101447. [Google Scholar] [CrossRef]
  16. Gereffi, Gary, and Joonkoo Lee. 2016. Economic and Social Upgrading in Global Value Chains and Industrial Clusters: Why Governance Matters. Journal of Business Ethics 133: 25–38. [Google Scholar] [CrossRef]
  17. Gereffi, Gary, John Humphrey, and Timothy Sturgeon. 2005. The Governance of Global Value Chains. Review of International Political Economy 12: 78–104. [Google Scholar] [CrossRef]
  18. González, Javier, and Przemyslaw Kowalski. 2017. Global Value Chain Participation in Southeast Asia: Trade and Related Policy Implications. In Production Networks in Southeast Asia. Edited by Lili Yan Ing and Fukunari Kimura. New York: Routledge. [Google Scholar]
  19. Gordon, Robert J. 2014. Macroeconomics. London: Pearson Education Limited. [Google Scholar]
  20. Guan, Dabo, Daoping Wang, Stephane Hallegatte, Steven J. Davis, Jingwen Huo, Shuping Li, Yangchun Bai, Tianyang Lei, Qianyu Xue, D’Maris Coffman, and et al. 2020. Global Supply-Chain Effects of COVID-19 Control Measures. Nature Human Behaviour 4: 577–87. Available online: https://www.nature.com/articles/s41562-020-0896-8 (accessed on 22 November 2021). [CrossRef] [PubMed]
  21. Hao, Yu, Hua Liao, and Yi-Ming Wei. 2015. Is China’s Carbon Reduction Target Allocation Reasonable? An Analysis Based on Carbon Intensity Convergence. Applied Energy 142: 229–39. [Google Scholar] [CrossRef]
  22. Hubbard, R. Glenn, Anthony P. O’Brien, and Matthew Rafferty. 2014. Macroeconomics. Harlow: Pearson Education, Inc. [Google Scholar]
  23. Hummels, David, Jun Ishii, and Kei-Mu Yi. 2001. The Nature and Growth of Vertical Specialization in World Trade. Journal of International Economics 54: 75–96. [Google Scholar] [CrossRef]
  24. Inomata, Sitoshi. 2017. Analytical Frameworks for Global Value Chains: An Overview. In Global Value Chain Development Report 2017: Measuring and Analyzing the Impact of GVCs on Economic Development. Washington, DC: The World Bank Group, pp. 15–35. [Google Scholar]
  25. Ivanov, Dmitry. 2020. Predicting the Impacts of Epidemic Outbreaks on Global Supply Chains: A Simulation-Based Analysis on the Coronavirus Outbreak (COVID-19/SARS-CoV-2) Case. Transportation Research Part E: Logistics and Transportation Review 136: 101922. [Google Scholar] [CrossRef]
  26. Kaufmann, Daniel, Aart Kraay, and Massimo Mastruzzi. 2010. The Worldwide Governance Indicators: Methodology and Analytical Issues 5430. Washington, DC: The World Bank. [Google Scholar]
  27. Kazunobu, Hayakawa, and Mukunoki Hiroshi. 2021. The Impact of COVID-19 on International Trade: Evidence from the First Shock. Journal of the Japanese and International Economies 60: 101135. [Google Scholar] [CrossRef]
  28. Kee, Hiau Looi, and Heiwai Tang. 2016. Domestic Value Added in Exports: Theory and Firm Evidence from China. American Economic Review 106: 1402–36. [Google Scholar] [CrossRef] [Green Version]
  29. Kersan-Škabic, Ines, and Alen Belullo. 2021. The Characteristics of Regional Value Chains in the Sector of Chemicals and Pharmaceutical Products in the EU. Economies 9: 167. [Google Scholar] [CrossRef]
  30. Koch, Philipp. 2020. Economic Complexity and Growth: Can Value-Added Exports Better Explain the Link? Economics Letters 198: 109682. [Google Scholar] [CrossRef]
  31. Koopman, Robert, Zhi Wang, and Shang-Jin Wei. 2014. Tracing Value-Added and Double Counting in Gross Exports. American Economic Review 104: 459–94. [Google Scholar] [CrossRef] [Green Version]
  32. Leontief, Wassily W. 1936. Quantitative Input and Output Relations in the Economic System of the United States. Review of Economics and Statistics 18: 105–25. Available online: https://orion.math.iastate.edu/driessel/15Models/1936_Input_Output.pdf (accessed on 21 November 2020). [CrossRef] [Green Version]
  33. Levchenko, Andrei A. 2007. Institutional Quality and International Trade. Review of Economic Studies 74: 791–819. [Google Scholar] [CrossRef]
  34. Los, Bart, Marcel P. Timmer, and Gaaitzen J. de Vries. 2015. How Global Are Global Value Chains? A New Approach to Measure International Fragmentation. Journal of Regional Science 55: 66–92. [Google Scholar] [CrossRef]
  35. Mandras, Giovanni, and Simone Salotti. 2020. An Input–Output Analysis of Sectoral Specialization and Trade Integration of the Western Balkans Economies. Economies 8: 93. [Google Scholar] [CrossRef]
  36. Mouanda, Gilhaimé M., and Jiong Gong. 2019. Determinants of Global Value Chains Participation for Landlocked Countries. International Journal of Social Science and Economic Research 4: 3265–93. [Google Scholar]
  37. Prete, D. Del, Giorgia Giovannetti, and Enrico Marvasi. 2018. Global Value Chains: New Evidence for North Africa. International Economics 153: 42–54. [Google Scholar] [CrossRef] [Green Version]
  38. Qin, Meng, Xiuyan Liu, and Xiaoxue Zhou. 2020. COVID-19 Shock and Global Value Chains: Is There a Substitute for China? Emerging Markets Finance and Trade 56: 3588–98. [Google Scholar] [CrossRef]
  39. Strange, Roger. 2020. The 2020 COVID 19 Pandemic and Global Value Chains. Journal of Industrial and Business Economics 47: 455–65. [Google Scholar] [CrossRef]
  40. Vidya, C. T., and K. P. Prabheesh. 2020. Implications of COVID-19 Pandemic on the Global Trade Networks. Emerging Markets Finance and Trade 56: 2408–21. [Google Scholar] [CrossRef]
  41. Wang, Zhi, Shang-jin Wei, and Kunfu Zhu. 2018. Quantifying International Production Sharing at the Bilateral and Sector Levels. NBER Working Paper. Cambridge: National Bureau of Economic Research 19677, Revised February 2018. Available online: https://www.nber.org/papers/w19677 (accessed on 5 March 2020).
  42. Widodo, Tri. 2008. Dynamic Changes in Comparative Advantage: Japan’s ‘Flying Geese’ Model and Its Implications for China. Journal of Chinese Economic and Foreign Trade Studies 1: 200–13. [Google Scholar] [CrossRef]
  43. Zergawu, Y. Zewdu, Yabibal M. Walle, and José M. G. Gómez. 2020. The Joint Impact of Infrastructure and Institutions on Economic Growth. Journal of Institutional Economics 16: 481–502. [Google Scholar] [CrossRef] [Green Version]
Figure 1. Forward and Backward Global Value Chains Participation, 2010–2020.
Economies 10 00121 g001
Figure 2. Gross Export Decomposition, 2010–2020.
Economies 10 00121 g002
Table 1. Description of Variables and Sources of Data.
VariablesDescriptionMeasurementExpectationSource
GVCBBackward Linkage Global Value Chains ParticipationShare of Foreign Value Added (FVA) to gross export (ratio)-MRIO, Computed by Authors, 2010–2020
GVCFForward Linkage Global Value Chains ParticipationShare of Domestic Value Added (DVA) to gross export (ratio)-MRIO, Computed by Authors, 2010–2020
COVIDCOVID-19 pandemicDummy COVID-19 pandemic (1 = 2019–2020, 0 = otherwise)Negative-
GDPGross Domestic Product per capita (Log)GDP divided by population (constant 2015 US dollars)PositiveWorld Development Indicators World Bank, 2010–2020
GOVGovernment EffectivenessIndex lies between
−2.5 and 2.5
PositiveWorld Governance Indicators (WGI), 2010–2020
RULERule of LawIndex lies between
−2.5 and 2.5
PositiveWGI, 2010–2020
Table 2. The export decomposition equation is based on backward linkage.
No.CategoryFormulaTerm Description
1DDC ( V s L s s ) T # ( A s r t s G B r s Y s t ) + ( V s B s s V s L s s ) T #   ( A s r X r ) Double-counted DVA is used to produce final use and intermediate commodity exports.
2FVA_FIN ( V r B r s ) T # Y s r + ( t s , r G V t B t s ) # Y s r FVA from the importer (r) and third country (t) embodied in final exports.
3FVA_INT ( V r B r s ) T # ( A s r L r r Y r r ) + ( t s , r G V t B t s ) # ( A s r L r r Y r r ) FVA from the importer (r) and a third country (t) contained in intermediate exports, which are then used by r to produce its consumption.
4FDC ( V r B r s ) T # ( A s r L r r E r * ) + ( t s , r G V t B t s ) # ( A s r L r r E r * ) Double-counted FVA in home economy’s exports production.
Note: Pure Double Counted (PDC) = DDC + FDC. Total value of gross exports (EXP): DVA_FIN + DVA_INT + DVA_INTrex + RDV_G + DDC + FVA_FIN + FVA_INT + FDC. Source: Asian Development Bank (2015); Wang et al. (2018).
Table 3. The export decomposition equation is based on forward linkage.
No.CategoryFormulaTerm Description
1DVA_INT ( V s L s s ) T # ( A s r B r r Y r r ) DVA in intermediate exports used by the direct importer (r) to produce local final products.
2DVA_INTrex ( V s L s s ) T # ( A s r t s , r G B r t Y t t ) + ( V s L s s ) T # ( A s r B r r t s , r G Y r t ) + ( V s L s s ) T # ( A s r t s , r G u s , t G B r t Y t u ) DVA embedded in its intermediate exports used by the direct importer r to produce exports and ultimately absorbed by other countries except for the source country s.
3RDV_G ( V s L s s ) T # ( A s r B r r Y r s ) +
( V s L s s ) T # ( A s r t s , r G B r t Y t s ) + ( V s L s s ) T #
( A s r B r r Y s s )
Returned DVA from the direct importer (r) and third country (t), and produced final products.
Note: Total value of gross exports (EXP): DVA_FIN + DVA_INT + DVA_INTrex + RDV_G + DDC + FVA_FIN + FVA_INT + FDC. DVA_FIN = ( V s B s s ) T # Y s r . Source: Asian Development Bank (2015); Wang et al. (2018).
Table 4. Descriptive Statistics.
GroupStatisticsGVCFGVCBGDPGOVRULE
ASEANMean0.460.298.620.35−0.02
SD0.160.131.240.890.84
Maximum0.850.5611.022.341.88
Minimum0.210.086.79−0.94−1.12
East AsiaMean0.430.249.901.040.73
SD0.050.090.680.580.80
Maximum0.520.4010.501.821.60
Minimum0.350.138.640.004−0.54
EUMean0.400.3910.121.091.10
SD0.080.110.640.560.60
Maximum0.720.7311.562.052.10
Minimum0.160.168.740.15−0.11
NAMean0.560.1810.811.631.67
SD0.040.060.140.150.13
Maximum0.700.2611.021.851.89
Minimum0.510.1110.631.321.37
Full SampleMean0.420.359.810.950.86
SD0.110.131.030.720.83
Maximum0.850.7311.562.342.10
Minimum0.160.086.79−0.94−1.12
Note: GVCF, forward GVC participation; GVCB, backward GVC participation; GDP, GDP per capita; GOV, government effectiveness; RULE, the rule of law.
Table 5. Levin, Lin, and Chu panel unit root test results.
VariablesT Statisticsp-Value
GVCF−39.59260.0000
GVCB−39.23650.0000
GDP−2.14740.0159
GOV−6.06230.0000
RULE−6.70040.0000
Note: LLC, Levin-Lin-Cu; GVCF, forward GVC participation; GVCB, backward GVC participation; GDP, GDP per capita; GOV, government effectiveness; RULE, the rule of law.
Table 6. The SYS-GMM results for GVC participation, 2010–2020.
VariablesGVCFGVCB
(1)(2)
Dep Var (−1)0.353 ***0.068 ***
(0.010)(0.114)
COVID-19−0.006 ***−0.011 ***
(0.0008)(0.001)
GDP0.178 ***0.050 ***
(0.037)(0.006)
GOV0.089 ***0.041 ***
(0.002)(0.006)
RULE0.040 ***0.024 ***
(0.006)(0.003)
Constant0.361 ***−0.242 ***
(0.089)(0.051)
No. of observations 328369
No. of countries4141
Hansen test, p-value36.33; 0.13434.00; 0.325
AB–AR(1); p-value−1.33; 0.184−2.00; 0.045
AB–AR(2); p-value0.63; 0.530−1.02; 0.307
Note: SYS-GMM = system GMM estimator; in the forward linkage, the dependent variable is GVCF, and in the backward linkage, the dependent variable is GVCB. Statistical Significance: *** p < 0.01. Standard errors are in parentheses. Source: Calculated by the authors using Stata 17.
Table 7. Empirical results for robustness tests, GVC participation with COVID shocks, 2010–2020.
VariablesGVCFGVCB
(3)(4)
Dep Var (−1)0.355 ***0.057 ***
(0.012)(0.008)
COVID shocks−0.059 ***−0.082 ***
(0.006)(0.005)
GDP0.223 ***0.216 ***
(0.046)(0.038)
GOV0.084 ***0.070 ***
(0.003)(0.008)
RULE0.030 ***0.028 ***
(0.006)(0.005)
Constant0.367 ***0.276 ***
(0.099)(0.060)
No. of observations 328410
No. of countries4141
Hansen test, p-value35.10; 0.16737.15; 0.244
AB–AR(1); p-value−1.27; 0.203−2.43; 0.015
AB–AR(2); p-value0.61; 0.545−1.69; 0.092
Note: SYS-GMM = system GMM estimator; in the forward linkage, the dependent variable is GVCF, and in the backward linkage, the dependent variable is GVCB. Statistical Significance: *** p < 0.01. Standard errors are in parentheses. Source: Calculated by the authors using Stata 17.
Publisher’s Note: MDPI stays neutral with regard to jurisdictional claims in published maps and institutional affiliations.

