
Does Country Risk Influence Foreign Direct Investment Inflows? A Case of the Visegrád Four


College of Business and Economics, University of Johannesburg, Auckland Park Kingsway Campus, Auckland Park, Johannesburg P.O. Box 524, South Africa
Economies 2022, 10(9), 221; https://doi.org/10.3390/economies10090221
Submission received: 5 July 2022
/
Revised: 29 August 2022
/
Accepted: 2 September 2022
/
Published: 9 September 2022
Abstract
:The determinants of FDI inflows have been a subject of unremitting debate in the economic literature over the years. However, the role of country risk has received inadequate attention, especially in the context of the Visegrád countries, which comprise the Czech Republic, Hungary, Poland and Slovakia. Hence, this study examined whether country risk matters for FDI inflows into the Visegrád Four for the period 1991–2020. This study accounted for cross-sectional dependency, structural breaks and heterogeneous slopes in the panel of the four countries by employing the dynamic common correlated effect estimator. Additionally, country-wise fully modified least-squares regression was conducted for each country to test the robustness of the estimates. The empirical results revealed that country risk matters for the FDI inflows into the Visegrád countries, as it has a negative effect on the FDI inflows. Furthermore, both the overall panel and country-wise regressions established that economic and political risks are essential determinants of the FDI inflows, as both have a negative relationship with the FDI inflows. However, financial risk had weak and mixed impacts on the FDI inflows in the overall panel and country-wise regressions, respectively. These research outcomes highlight the need for appropriate macroeconomic and government authorities in the Visegrád economies to enhance the market capabilities of their economies by improving and upholding the social, institutional, corporate and macroeconomic structures, and as a way of achieving better country risk attributes.
1. Introduction
The attainment of long-run economic growth remains a fundamental objective of every economy, and a critical vehicle of growth that many countries rely on to achieve this objective is foreign direct investment (FDI). This is due to the unique and essential role of FDI in driving industrialisation and boosting the manufacturing sector, which were identified as principal drivers of growth and development (Akinlo 2004). Furthermore, globalisation has dramatically increased capital flexibility and mobility across the globe, with FDI regarded mainly as the safest and most advantageous form of capital flow. Empirically, studies identified the crucial role that FDI plays in boosting productivity and general macroeconomic performance through the promotion of technology transfer, managerial talent and financial capital, which would otherwise be unavailable or provided only at a much greater cost (Akinlo 2003; Khan 2007; Ugwuegbe et al. 2014). This role of FDI could engender a “spill-over” effect on different aspects of the economy that are not direct beneficiaries of FDI, with a concomitant positive impact on the overall economy (Rappaport 2000).
This corroborates the position of the neoclassical and endogenous growth theorists. They stressed the crucial role of innovation, technology transfer, knowledge spill-over, and managerial and technical skills that arise from capital flows in the economic growth process (Grossman and Helpman 1991; Mankiw et al. 1992). Since the early 1990s, when communism and the central planning system crumbled, the four Central European states, known as the Visegrád Four (V4), which comprise the Czech Republic, Hungary, Poland and Slovakia, have advanced several strategies aimed at enhancing FDI inflow as a way of driving sustained economic growth (Chen et al. 2018; Chidlow et al. 2009; Qi and Li 2017). According to UNCTAD (2007), FDI inflow refers to the capital or finance provided for an enterprise in a host country by a foreign direct investor either directly or through other related enterprises.
Many studies investigated the determinants of FDI in the V4, most of which have focused on the two theoretically fundamental factors: the size/growth of the economy and the cost competitiveness (for example, Altomonte 2000; Bobenic Hintosova et al. 2018; Demirhan and Masca 2008; Galego et al. 2004; Gauselmann et al. 2011; Gorbunova et al. 2012; Janicki and Wunnava 2004; Wach and Wojciechowski 2016). Besides the fact that there is not yet a consensus on the shared economic factors that drive FDI in the V4 (Bobenic Hintosova et al. 2018), factors relating to country risk are rarely explored by researchers. This raises the question of whether non-economic considerations are considered by overseas investors. Specifically, this study aimed to determine whether the V4’s extra-economic traits on the major elements of country risk are significant for FDI inflow.
According to White and Fan (2006), country risk can be sub-divided into economic, financial, cultural and political risks, while Moosa (2002) refers to it as exposure to a financial loss in international business activities that is brought on by circumstances in a certain nation that are, at least in part, under the government’s authority. Intuitively, country risk should rate high among the most important determinants of FDI considering that how external bodies relate to a country is highly influenced by its economic, financial and political environments. Moreover, investors are generally averse to systematic risks that are mainly external and out of their control. Since all the components of country risk are systematic, foreign investors are bound to be wary of them, which could ultimately influence FDI flows. Root (1987) opined that any foreign investment project must be assessed from the perspectives of its economic, social, political and cultural environments. Therefore, it is not surprising that multinational companies (MNCs) are often more favourably disposed to countries where they may encounter low risk and generate high returns on their investment in making their offshore investment decisions.
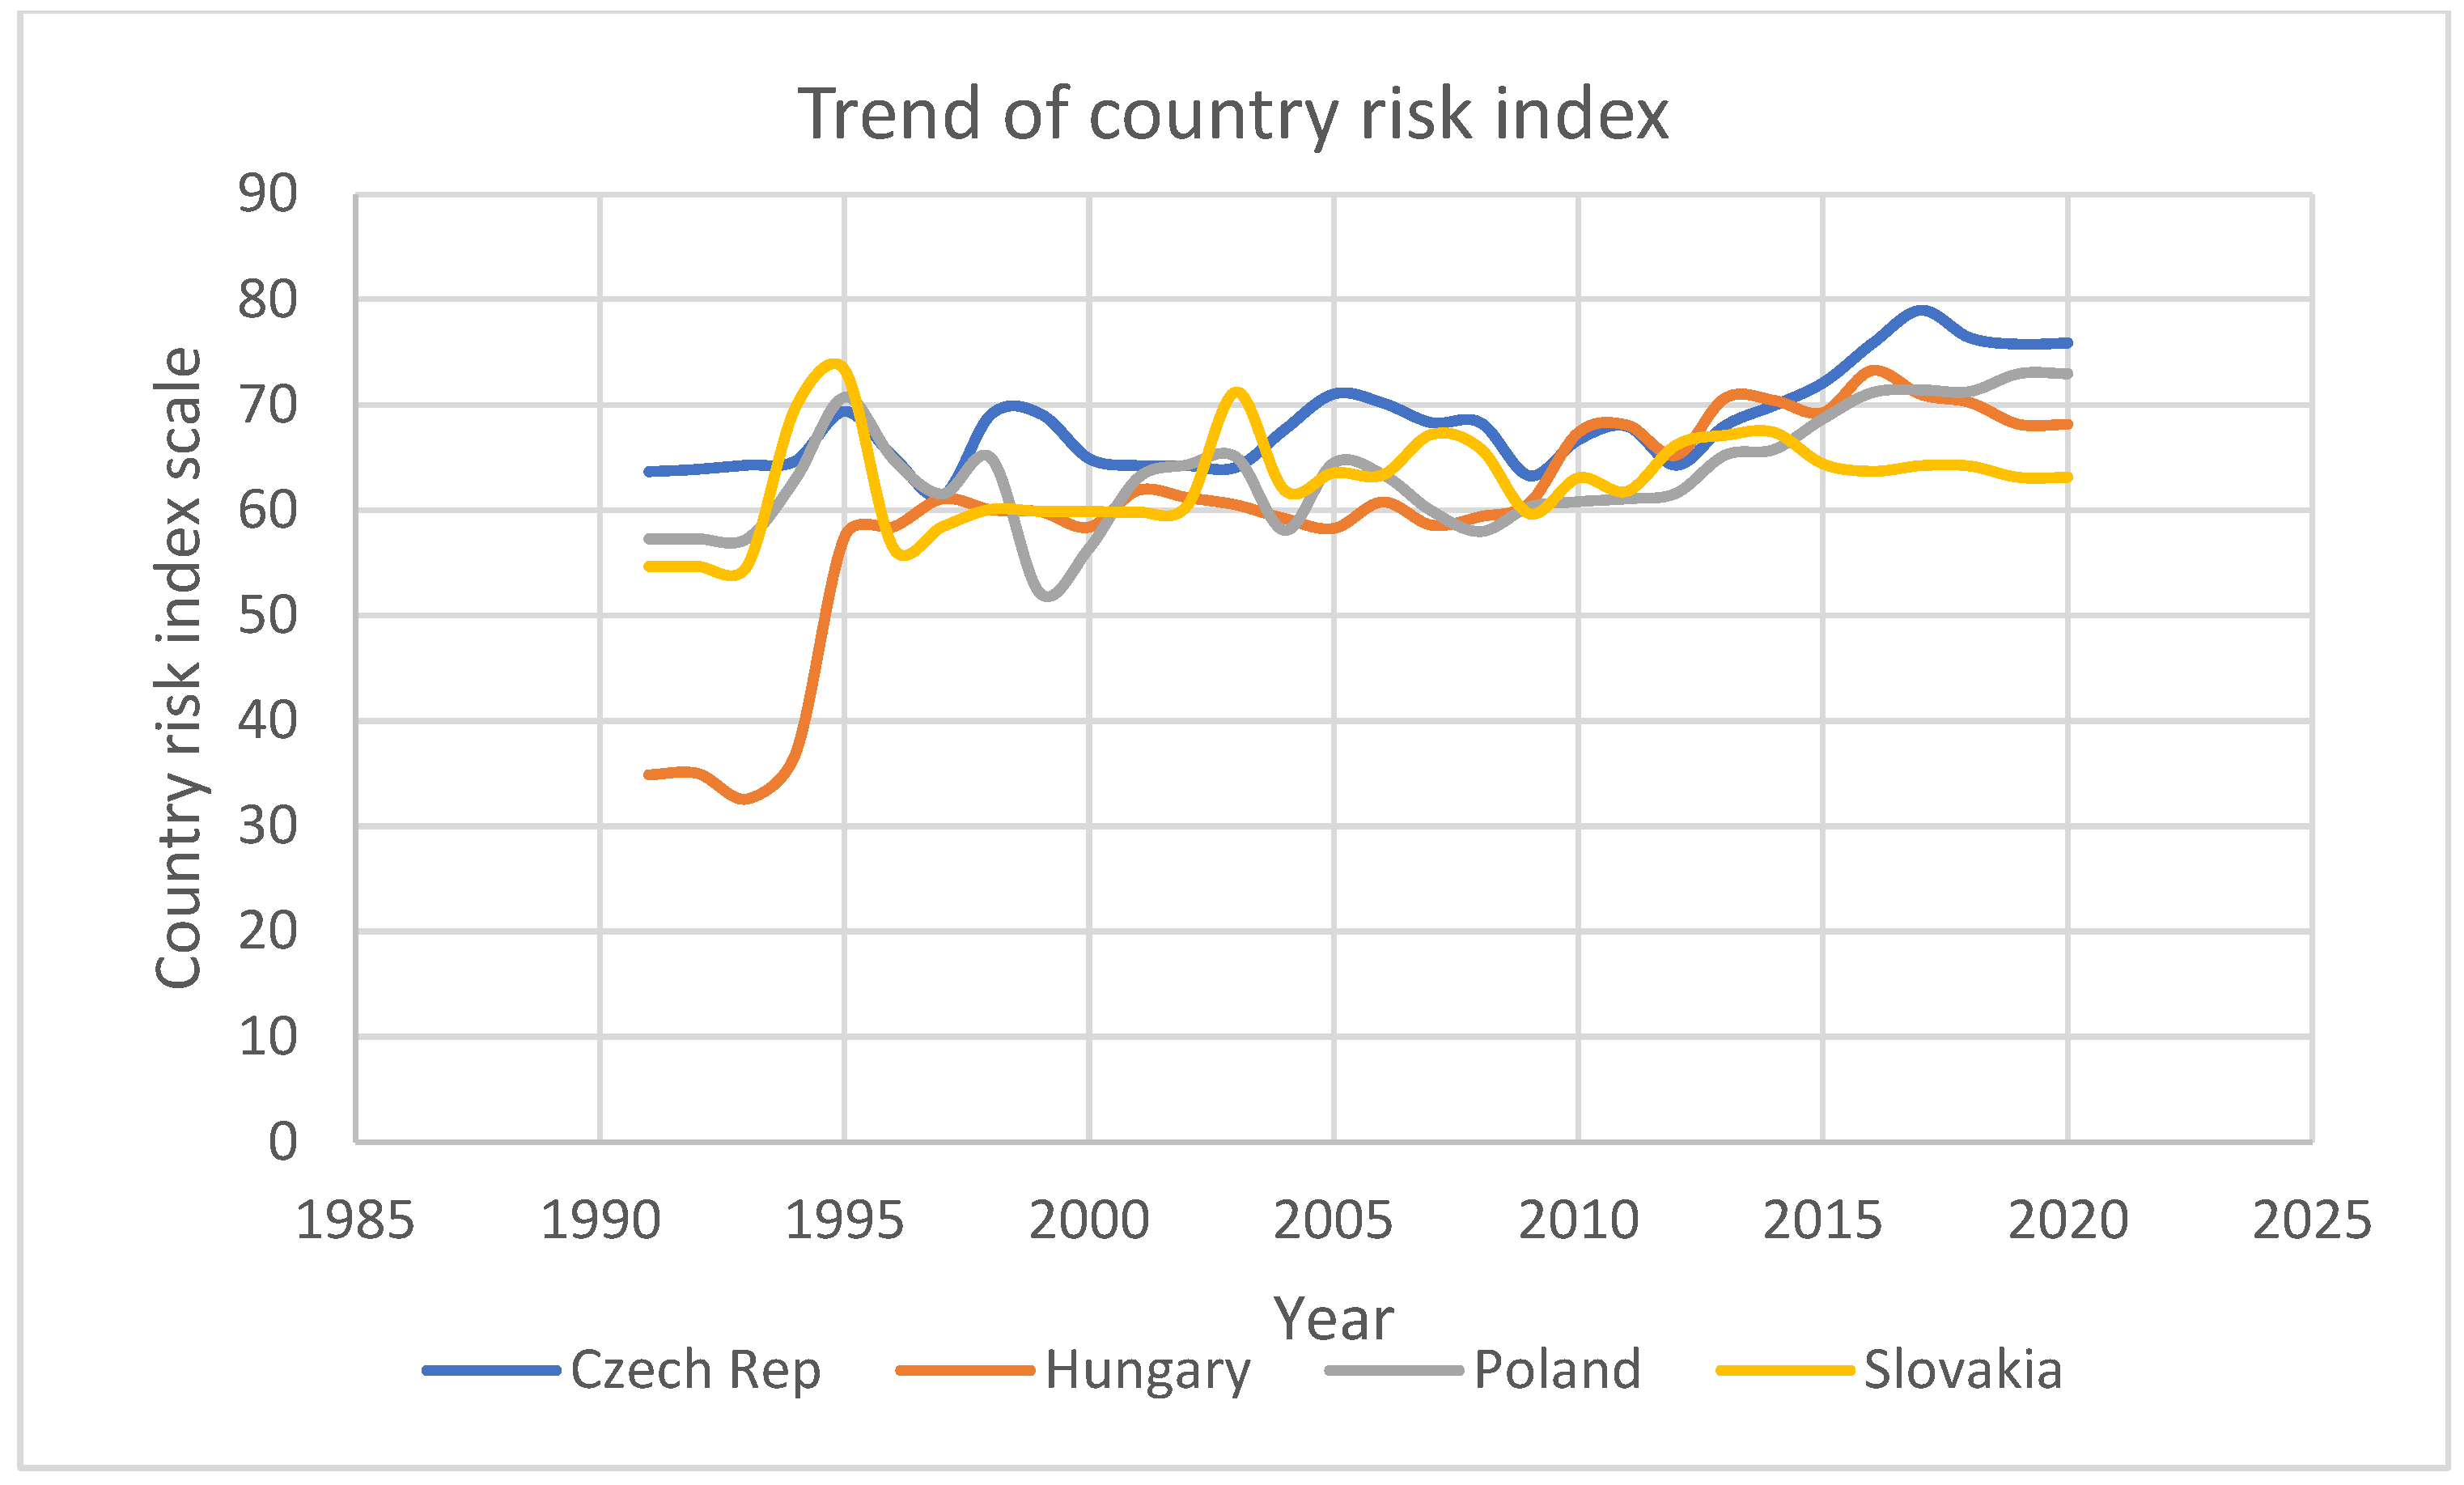
The focus on the V4 is essential because of certain peculiarities that pertain to this group of countries. First, following their emergence from communism, the V4 were deemed unattractive locations by foreign investors (Gauselmann et al. 2011) and often labelled “catching-up” countries (Tendera-Właszczuk and Szymański 2015). This prompted them to devise various strategies to attract FDI, after which they became prime targets of FDI, especially after exiting the transition recession and acceding to the European Union (EU). Some of the policy measures put in place to drive FDI inflow included lessening the obstacles to FDI (which, according to Koyama and Golub (2006), culminated in maintaining a very low regulatory restrictiveness index relative to the average index in the OECD countries) and developing and deepening financial markets (Vojtovic 2019). As depicted in Figure 1, the country risk scores of the four countries have continually fluctuated since 1995 and have never reached the 80/100 mark (indicating a very low-risk status). Thus, there is a need to investigate how these country risk attributes influence FDI inflow.
The 2008–2009 financial crisis, which hit the V4 economies very hard because of their massive exposure to international business cycles, resulted in increased government intervention and measures that could lead to a decline in the share of foreign investment in specific sectors (Hunya 2017; Sallai and Schnyder 2018; Sass 2017). More likely than not, this mixed bag of policy interventions has implications for various components of the country risks of the V4. Yet, to the best of our knowledge, no study has addressed the question of the growth impact of country risk on FDI inflows in the context of the V4 despite the impact that the policy measures and reversals could have on the country risk ratings and the extent to which country risk could impact the investment decision of foreign investors in an economy.
Second, the V4 have a lot of social and economic interaction/financial integration and share common historical roots and cultural traditions, having emerged from communism, which held sway in Central and Eastern European countries (CEECs) until 1989. Consequently, the process of FDI flows to the four countries has several shared characteristics: the first years of FDI inflows witnessed a predominance of brownfield investments, the following years saw more significant emphasis on greenfield investment, the period after the EU accession (especially, 2004–2007) experienced increased and dynamic FDI inflows, a disproportionately large percentage of FDI inflow to the V4 came from the EU and FDI inflow to the V4 has witnessed noticeable structural changes towards the services sector over the years (Ambroziak 2013; Zielińska-Głębocka 2013).
Despite these common features and consequent interdependence between the V4 countries, all existing panel studies on the determinants of FDI in the V4 assumed cross-sectional independence in the disturbances of their panel models, thereby failing to account for the likely cross-sectional dependence (CD) between the countries. Eberhardt and Teal (2010) and Pesaran (2006) intensely faulted this assumption on the grounds that it could result in biased estimates, and consequently, inappropriate policy proposals. To this end, they propounded panel regressions with robust standard errors that can account for CD between the countries. The need to account for CD is key because a shock to an economy could be transmitted to other economies that are macroeconomically interdependent (Olaoye and Aderajo 2020; Olaoye et al. 2020). This is because common features and interdependence between economies can engender CD due to globalisation (De Hoyos and Sarafidis 2006). As shown in Figure 1, beyond 1995, the trend of country risk in all four Visegrád countries appeared to move in the same direction and around similar scores for each year. This reflects a tendency for CD between the four countries. Therefore, by using the xtdcce2 programs provided by Ditzen (2018), which are designed to produce estimates for the dynamic common-correlated effects (DCCE) estimator proposed by Chudik and Pesaran (2015), this work departed from earlier research efforts by accounting for CD and heterogeneous slopes in the panel of the V4.
Third, while the preponderance of findings from studies on the determinants of FDI in the V4 has identified several variables that portray the size/growth and the cost competitiveness of the economies, few other studies stressed that other factors such as corruption, national risk, reforms in the banking sector, economic reforms, political risk and liberalisation influence the inflow of FDI in the V4 and the CEECs in general (Avioutskii and Tensaout 2016; Bevan and Estrin 2000; Brada et al. 2006; Cieślik 2020; Su et al. 2018). Each of these factors is either a component of country risk or is somewhat connected to it. Meanwhile, it is noteworthy that none of the previous studies on the impact of country risk on FDI inflows (Hammache and Chebini 2017; Khan and Akbar 2013; Nassour et al. 2020; Rodríguez 2016; Salem and Younis 2021; Topal and Gul 2016) focussed on the V4. Thus, the V4 deserves a separate study to determine the impact of country risk and each of its components on the FDI inflows into their economies. This is crucial, as it tends to help the countries set a realistic target of country risk rating, which would potentially increase the V4’s appeal as a preferred FDI location.
2. Literature Review
2.1. Theoretical Perspective
While it is difficult to find a definition of country risk that is generally agreed upon, the definitions and evaluations of the concept in the literature generally point to it as a phenomenon of uncertainties created by financial, economic and political structures (Elleuch et al. 2015; Hoti and McAleer 2002; James 2004; Lee and Naknoi 2014; Moosa 2002; Topal and Gul 2016; White and Fan 2006). This implies that country risk can be broadly classified into economic, financial and political risks. According to Topal and Gul (2016), economic risk refers to unanticipated and unforeseen changes in the economy’s general structure, which could compel adjustments in investors’ projects. Hence, it is measured by variables such as economic growth and GDP per capita because FDI investors always look out for large markets to profit from economies of large-scale production (Anyanwu 2012; Busse and Hefeker 2007; Wach and Wojciechowski 2016). Other variables such as inflation, current account balance and budget deficit are also important indicators of economic risk. Inflation is a crucial measure because galloping inflation could easily erode the real value of the investment, lead to poor returns and aggravate the balance of payment deficits (Arik et al. 2014). Furthermore, a budget deficit could alter the savings–investment balance of an economy in such a way that is deleterious to the current account balance, inflation and international trade (Altunöz 2014). FDI investors usually meticulously monitor developments around these variables to assess the economic risk of their investment.
White and Fan (2006) defined financial risk as the increase in a country’s tendency to default on its financial obligation to a foreign body. Therefore, it is measured by variables such as external debt stock, exchange rate stability, current account deficit and foreign exchange earnings. FDI investors are often wary of countries with high and accumulating external debt stock. It could exacerbate the current account deficit and dampen growth (Dey and Tareque 2019; Qureshi and Liaqat 2020), thereby aggravating its financial risk. Exchange rate instability also creates immense uncertainty around investment, as it could depress investment profitability and make forecasts regarding investments complicated (Lee and Naknoi 2014). Foreign exchange earnings are also crucial for moderating both exchange rate volatilities and balance of payments deficits. Poor foreign exchange earnings would therefore increase the financial risk from the perspective of FDI investors.
Political risk was also evaluated in the context of FDI for developing countries. It was defined by Haendel (1979) as “the risk or probability of occurrence of some political event(s) that will change the prospects for the probability of a given investment”. Eng et al. (1998) identified the indicators of political risk in the context of FDI to include political willingness/ability to implement structural reforms, cases of arbitrary and changing government regulation, ease/difficulty in repatriating profits by international investors, and how fair and equal the host government treats investors. Other indicators of political risk that are relevant to FDI are bureaucracy, democracy, the rule of law, social compliance and the level of corruption. According to Busse and Hefeker (2007), the deterioration of these indicators could lead to a decline in investors’ profitability. It was also claimed that the poor rating of an economy regarding the indicators could lead to a sharp increase in the cost of production for FDI investors (Elleuch et al. 2015; Khan and Akbar 2013).
Against this background, the theoretical framework for this study was founded on an eclectic paradigm theory based on Dunning’s (1979) internalisation theory, otherwise called the OLI model or the OLI framework, as it rests on a three-tiered framework: ownership, location and internalisation (OLI). It is an important framework for evaluating the suitability/profitability or otherwise of prospective FDI projects. The theory holds that for any FDI to benefit the investor, it must possess ownership advantage, locational advantage and internalisation advantage. The concept of locational advantage was extended by Dunning (1998) with the addition of institutional factors to the existing economic factors. He argued that the higher the quality of institutions end economic facilities in an economy, the more attractive the economy to the foreign investors because the investors consider their profitability to be positively related to institutional quality and sound macroeconomic indicators. His position is in line with North (1990) and Lucas (1993), who claim that institutional factors, alongside purely economic factors, are crucial for attracting FDI. Therefore, the motivation for FDI, based on Dunning’s (1998) propositions, comprise market-seeking, resource-seeking, efficiency-seeking, asset-seeking and the quality of institutions of the investment destination. This can be expressed as follows:
where FDI is the foreign direct investment. Market-seeking motivation is represented by the market size, which is a key determinant of FDI and is measured by real GDP. Resource-seeking motivation is measured by the availability of natural resources. Efficiency-seeking is denoted by macroeconomic stability, which refers to the country’s economic situation and it is proxied by economic risk and financial risk, as both risks are measured by variables that determine macroeconomic stability. Asset-seeking motivation is measured by the availability of infrastructure. Institutions are proxied by political risk, as indicators of political risk include variables such as the level of corruption, democracy, level of bureaucracy and political willingness/ability to implement structural reforms, which also measure the quality of institutions. Since country risk was classified into economic, financial and political risks, Equation (1) became:
FDI = f(efficiency-seeking, market-seeking, resource-seeking, asset-seeking, institutions)
FDI = f(country risk, real GDP, natural resources, infrastructure)
2.2. Empirical Literature
The attraction of FDI in an economy was identified as an important way of bridging the savings–investment gap, which characterises most developing countries (Sabir and Khan 2018). This is very important for raising capital accumulation, which the traditional neoclassical growth model considers critical to enhancing the per capita income (Koopmans 1965). Therefore, this section is dedicated to the empirical literature on the impact of country risk on FDI inflow. Bevan and Estrin (2000) investigated FDI inflows into transition CEECs by employing a panel dataset. The results from their study established the determinants of FDI as comprising country risk, market size, gravity factors and labour cost. These findings were corroborated by a different study on CEECs by Brada et al. (2006), who concluded that transitional factors such as national risk, privatisation progress, banking sector reforms and trade liberalisation influenced FDI inflows. Similarly, Avioutskii and Tensaout (2016) investigated whether politics influence FDI inflow into CEECs and found that political risk, economic reforms and political liberalisation are critical influencers of FDI inflow.
In another study of the factors that affect FDI inflow into the V4 for the post-accession period by Su et al. (2018), results from the generalised ridge regressions employed identified perceived corruption as an influencer of FDI inflows. This finding was supported by another study by Cieślik and Goczek (2018), who investigated 142 countries for the period 1994–2014. Estimates from their GMM estimation suggested that corruption in the host country constitutes a drain on its stock of foreign investment. Still, in the V4, Bobenic Hintosova et al. (2018) investigated country-level data for the period 1989–2016 and found that gross wages and an educated labour force positively influence FDI, while trade openness, spending on research and development, and corporate income tax deter FDI. In a related study of five CEECs—the Czech Republic, Hungary, Poland, Romania and Slovakia—Gauselmann et al. (2011) found that access to markets and the price of factors of production mostly affect FDI. Similarly, Wach and Wojciechowski (2016) established that the V4 receive more FDI allocation from EU-15 countries because of each V4 economy’s market potential, as measured using GDP.
Using the two-stage least-squares method, the effect of national risk on FDI in Iran was investigated by Rafat and Farahani (2019) for 1985–2016. Their results suggested that indicators of national risk, including religious and ethnic tension, external conflicts, socioeconomic status and military tension, are significant factors that impact the FDI in the economy. Similarly, the impact of economic, political and financial risks was investigated for 10 MENA countries between 2000 and 2017 by Salehnia et al. (2019). The empirical results from their estimation showed that all three types of risk negatively affect the FDI, with the economic risk being the most influential of the three. This result was corroborated by a recent study of a MENA country, namely, Egypt, for the period 2005–2015 by Salem and Younis (2021). They found both economic and political risks as determinants of FDI in the country, with economic risk being the more influential of the pair. It was, however, found that financial risk has no impact on FDI. Meanwhile, in an earlier similar study for MENA countries, Bouyahiaoui and Hammache (2017) identified political risk as the dominant determinant of FDI in the region.
An investigation of the impact of political and financial risks on FDI inflows into 90 countries from 1985 to 2007 was conducted by Hayakawa et al. (2013) using the generalised method of moments (GMM) estimator. Their results, which concentrated mainly on developing countries, indicated that of all the estimated components of political risk, the following are closely associated with FDI flows: religious tension, democratic accountability, corruption, ethnic tension, socioeconomic condition, investment profile and government stability. Regarding financial risk components, only exchange rate stability was found to impact the FDI positively, while the remaining components were either insignificant or negative. Sissani and Belkacem (2014) investigated the effect of political and financial risks on FDI in Algeria from 1990–2012; they concluded that political and financial risks are critical to FDI inflows, with financial risk being a strong determinant. In a related study, Krifa-Schneider and Matei (2010) examined the effect of political risk and business climate on FDI in 33 developing and transition economies by using both a fixed-effects model and a GMM estimator over the period 1996–2008. Estimates from their analysis revealed that reducing political risk increases FDI inflow, while the business climate constitutes a key driver of FDI flows.
The impact of political risk and economic growth on FDI in South Africa was investigated by Meyer and Habanabakize (2018) for 1995–2016. The findings from their analysis revealed that the impact of political risk on FDI is higher relative to that of GDP. In the same vein, the effect of political risk in Lebanon was investigated for 2008–2018 by Bitar et al. (2020), who reclassified ICRG political risk variables into three components: cohesion, institutional quality and governance. Their results revealed that all three components are significantly associated with FDI inflows into Lebanon. They, therefore, concluded that political stability is a critical determinant of FDI.
In a related study, the link between political, economic and financial components of Saudi Arabia’s country risk rating and its stock market movements was examined using the autoregressive distributed lag (ARDL) estimation technique on monthly data between 2005 and 2012 by Almahmoud (2014). Results from the analysis showed that country risk ratings are closely associated with stock market movements in the country, with financial risk exhibiting the most robust sensitivity among the three components. The study concluded that prospective FDI investors should seriously consider financial risk indicators, such as external debt servicing, exchange rate stability and the current account balance, before embarking on any strategic investment in Saudi Arabia. Similarly, Hammoudeh et al. (2011) examined the individual BRICS countries’ country risk ratings related to their respective national stock markets. Their findings expressly pointed to China as being sensitive to all components of country risk.
Meanwhile, in developing a behavioural framework for decision-making at the management level, Yasuda and Kotabe (2021) proffered that the mental map of perceived political risk in host nations where MNCs operate and the political risk of the MNCs’ origin country serve as the political risk reference points. Subsequently, their research outcome revealed that if political risks are below (above) their reference points, MNCs perceive them as opportunities (threats) in the host countries. This finding was corroborated by Gonchar and Greve (2022), who alluded to the volatility of FDI in economies with high political risk. By employing the Cox proportional hazard model on Russia’s multinational plant-level data from 2000 to 2016, the authors set out to investigate whether MNCs’ withdrawal decisions are influenced by political risks. The research outcome revealed significant impacts from heightened host-country political risk when the year of arrival was compared with the year of withdrawal. They further established that MNCs are especially sensitive to issues relating to law, order and socioeconomic conditions in Russia, as well as the involvement of the military in domestic politics in the originating country.
A synopsis of the findings of extant research is reported in Table 1.
3. Methodology
3.1. Data Description
Annual data on the four Visegrád countries—the Czech Republic, Hungary, Poland and Slovakia—were used for the period 1991–2020. The dependent variable was FDI inflows, which was defined as the capital or finance provided for an enterprise in a host country by a foreign direct investor either directly or through other related enterprises (UNCTAD 2007). It was measured using FDI net inflows (current USD). The study employed the International Country Risk Guide (ICRG) rating system provided by the Political Risk Services (PRS) to capture the country risk. The ICRG consists of 22 variables that measure economic, financial and political components of country risk. While five variables measure each of economic and financial risks, the remaining twelve variables measure the political component of country risk. The economic risk index, which evaluates the current economic strengths and weaknesses of an economy, is allotted a total of 50 points, covering 25% of the composite country risk. To arrive at a country’s economic risk index, the following range of scores are allotted to the five economic risk variables as follows: GDP per head of population (0–5), real annual GDP growth (0–10), annual inflation rate (0–10), budget balance/GDP (0–10) and current account/GDP (0–15).
The financial risk index is also allotted 50 points and constitutes 25% of the composite country risk index. It focuses on evaluating a country’s financial environment from the standpoint of its ability to fulfil its financial obligations. As such, the following range of scores is assigned to the five financial risk variables: foreign debt/GDP (0–10), foreign debt service/export (0–10), current account/export (0–15), net liquidity as months of imports cover (0–5) and exchange rate stability (0–10). The political stability of a country is evaluated by the political risk index based on the following 12 political risk variables and their corresponding score ranges: government stability (0–12), socioeconomic conditions (0–12), investment profile (0–12), internal conflict (0–12), external conflict (0–12), corruption (0–6), military in politics (0–6), religious tensions (0–6), law and order (0–6), ethnic tensions (0–6), democratic accountability (0–6) and bureaucracy quality (0–4). It is allotted a total of 100 points, and it represents 50% of the composite country risk index.
To obtain the composite country risk index, the sum of economic, financial and political risk indexes is divided by 2. The 22 variables that measure country risk are essentially risk-free measures. Therefore, the higher the computed score a country achieves for the economic, financial, political or composite country risk indexes, the lower the risk, and vice versa. The market size was extensively investigated in the literature as a driver of FDI and most of the studies agreed on the adoption of real GDP as the measure of the variable (see Ahmad et al. 2015; Demirhan and Masca 2008; Galego et al. 2004; Bobenic Hintosova et al. 2018; Wach and Wojciechowski 2016). Furthermore, the host country’s GDP is seen as an important indicator of the availability of a potential market for FDI-oriented products. Therefore, in line with extant literature, this study employed real GDP as the measure of market size. To measure the availability of natural resources, natural resource rents as a percentage of GDP were employed. While several variables were used to measure infrastructural investment, we followed extant studies on the determinants of FDI, which employed the number of telephone lines (Ahmad et al. 2015; Demirhan and Masca 2008; Gorbunova et al. 2012). Therefore, infrastructure was measured by mobile telephone subscribers per 100 people. Finally, trade openness was included as a control variable and it was measured by the addition of imports and exports as a percentage of GDP. Apart from the country risk variables, all the datasets used in this study were obtained from the World Development Indicators of the World Bank.
3.2. Estimation Technique
Following the theoretical framework as summed up in Equation (2), a baseline model for achieving the objective of the study is expressed as follows:
where is the foreign direct investment inflows; is the country risk/economic risk/financial risk/political risk; is the real gross domestic product measuring market size; is the natural resource availability; is the investment in infrastructure measured by the number of mobile telephone subscribers; is the trade openness/GDP ratio; and denote cross-sectional and time indexes, respectively; is the intercept; and are parameters to be estimated; and is the error term. All variables were converted to their natural logarithm forms before estimation to reduce the likelihood of heteroskedasticity and enable elasticity relationships.
To estimate Equation (3), this study employed the dynamic common correlated effect (DCCE) estimator introduced by Chudik and Pesaran (2015). This was to avoid a major pitfall of most previous studies that used traditional estimation methods, such as OLS, fixed-effects and random-effects models, and GMM, which only engender changes in the intercept of cross-sectional units in panel data estimation, thereby operating under the assumption of high homogeneity among cross-sectional units. This assumption has been criticised by Turkay (2017) as being unrealistic and capable of producing misleading estimates because of the likelihood of cross-sectional dependence (CD) in the panel data. Indeed, the attention of researchers was recently aroused towards the need for panel data estimation that control for CD and account for heterogeneous coefficients among the cross sections (Chudik and Pesaran 2015; Pesaran et al. 1999; Pesaran 2006). The DCCE approach produces robust estimates by employing the principles of the common correlated effects method (Pesaran 2006), the mean group estimator (Pesaran and Smith 1995) and the pooled mean group estimator (Pesaran et al. 1999).
The DCCE estimator accounts for CD and heterogeneous slopes by incorporating the means and lags of the cross sections in estimation. Another important feature of DCCE is its ability to produce reliable results even when a structural break is present in the data (Kapetanios et al. 2011). This is especially useful in this study of the Visegrad group, which went through a transition recession and acceded to the European Union in 2004 (Koyama and Golub 2006). During these economic and political events, significant changes took place in the countries that could have brought about structural breaks in the datasets. Therefore, the application of DCCE as the estimation technique allays the suspicion of misleading estimates due to a structural break in data. Moreover, the DCCE approach provides robust estimates despite an unbalanced panel (Ditzen 2018) or a small sample size (Chudik and Pesaran 2015).
The DCCE estimator also deals with the problem of endogeneity in a few ways. First, the recently introduced xtdcce2 syntax for executing DCCE estimation by Ditzen (2018) does not use maximum likelihood estimations, thereby accommodating the fitting of models with endogenous independent variables (Ditzen 2018). Second, the DCCE approach accounts for endogenous variables in the model through the xtdcce2 program, which supports instrumental variable (IV) regressions by specifying endogenous variables and utilising the ivreg2 command developed by Baum et al. (2003, 2007) to specify exogenous variables from IV regression. By doing so, the DCCE approach takes advantage of the possible applications for an IV regression that include endogenous spatial lags that are instrumented by exogenous measures, such as distance, other variables or higher-order spatial lags. Furthermore, Chudik and Pesaran (2015) applied the techniques of “half-panel” jackknife and recursive mean-adjustment bias correction to deal with the problem of endogeneity. The “half-panel” jackknife bias-corrected CCE estimator’s MG estimate is
where indicates the MG estimate of the panel’s first half (, while indicates that of the second half .
With the recursive mean adjustment, all the variables’ partial means are eliminated. This implies that
where or any other variable apart from the constant. Consistent with Chudik and Pesaran (2015), the partial mean is lagged by one period to guard against the model being affected by endogenous observations.
Following Chudik and Pesaran (2015), the DCCE specification of Equation (3) is expressed as follows:
where ln is the logarithm of FDI and its lag is a dependent variable, is a set of independent variables and is the lag of the cross-sectional averages.
The DCCE estimation was preceded by tests for CD in the panel data by means of Pesaran’s (2004), Frees’s (1995) and Friedman’s (1937) CD tests, in line with De Hoyos and Sarafidis (2006). This study also adopted Pesaran’s (2007) cross-sectionally augmented IPS (CIPS) unit root test to account for CD. After confirming the stationarity attributes of the variables, the panel cointegration approach of Westerlund (2007) was used to assess the long-run relationships. This approach deals with the shortcomings of the older panel cointegration methods by formulating four new structural-based tests that are not affected by any common-factor restrictions. Therefore, the technique is reputed for being robust to CD, unit-specific short-run dynamics, slope parameters and unit-specific trends (Persyn and Westerlund 2008).
Furthermore, to test the robustness of estimates and to determine how the coefficients of explanatory variables vary across the countries, country-wise FMOLS regressions were also estimated for each country. The FMOLS technique was introduced by Phillips and Hansen (1990), and it is equipped with the ability to produce good results in the presence of endogeneity, simultaneity and serial correlation (Ozcan 2013). The nature of the model being estimated raises the possibility of omitted variable bias, which could lead to the problem of endogeneity (Brückner 2013). In particular, the omission of other variables that are possible determinants of FDI could cause bias. Moreover, the explanatory variables tend to suffer from the problem of endogeneity, which could engender simultaneity in the model. Therefore, the application of FMOLS is appropriate for time-series analysis because the technique can effectively overcome the problem of endogeneity and serial correlation by accommodating nuisance parameters (Adusei 2012; Phillips and Hansen 1990; Yildirim and Orman 2018).
4. Results and Discussion
4.1. Descriptive Statistics
A summary of the descriptive statistics of the variables is presented in Table 2. The mean FDI net inflow into the V4 over the study period was $16.31 billion. This was higher than its median value of $4.99 billion, indicating that the distribution of the data was skewed to the right. Hungary received the highest FDI net inflow of $171.37 billion in 2020, while the same country recorded the lowest net inflow of −$64.37 billion in 2018. This bespeaks the volatile nature of FDI inflows into Hungary. The mean composite country risk index score was 63.92/100, which implied that, on average, the V4 posed a moderate risk to foreign investors. The highest country risk index score (lowest risk) of 78.98/100 was attained by the Czech Republic in 2017, while Hungary recorded the lowest score (highest risk) of 32.59/100 in 1993. The mean score of the economic risk index was 36.37/50, which portrayed the V4 as low risk from an economic perspective. The Czech Republic recorded the highest economic risk index score of 44.44/50 in 2017, while the lowest economic risk index score of 19.44/50 was recorded by Hungary in 1993. From the financial perspective, the V4 was found to present very high risk on average, with a mean financial risk index score of 14.93/50. At the same time, it was designated as being of low political risk with an average political risk index score of 77.56/100. Going by the mean and median values, the composite, economic and financial risks were skewed to the left, while the political risk was skewed to the right. The mean real GDP and investment in infrastructure were $186 billion and 73.78 mobile phone subscribers (per 100 persons), while the mean trade was 117.63% of GDP.
4.2. Cross-Sectional Dependence Tests
Tests for cross-sectional dependence (CD) in the panel data were first conducted to ensure the application of appropriate estimation techniques, and the results are presented in Table 3. Three different in-regression CD tests were conducted, namely, Pesaran’s (2004), Frees’s (1995) and Friedman’s (1937) CD tests, in line with De Hoyos and Sarafidis (2006). While both Pesaran’s and Friedman’s tests established strong CD in all the models, Frees’s test only established strong CD for the financial risk model. Considering that two out of the three tests confirmed CD and the superiority of Pesaran’s (2004) test to the other two, it can therefore be concluded that CD existed in the panel data under study.
4.3. Panel Unit Root Test
The confirmation of CD implied that traditional panel unit root tests were inadequate for conducting stationarity tests for the panel data. When CD is present in panel data, they are primarily inconsistent and upwards-biased (Bai and Kao 2006). As such, Pesaran’s (2007) cross-sectionally augmented IPS (CIPS), which overcomes these drawbacks, was conducted, and the results are displayed in Table 4. The results showed that all the variables contained unit roots at level, but they all become stationary after the first difference. With all the variables being I(1) processes, the next step was to conduct a cointegration test.
4.4. Panel Cointegration Test Results
In order to determine whether the variables had long-run relationships, cointegration tests were conducted for all four models, with models 1, 2, 3 and 4 representing the models with the country risk index, economic risk index, financial risk index and economic risk index, respectively, as the country risk variable. The results are displayed in Table 5. Pedroni’s test for cointegration was first conducted, and the results showed that four out of seven test statistics rejected the null hypothesis of no cointegration in all four models, thereby confirming long-run relationships between the variables. Furthermore, consequent upon the confirmation of CD in the panel data, the error-correction-based test of Westerlund (2007) was also conducted because of its robustness in the presence of CD in panel data. The test outcome indicated that both the group statistics (Gt and Ga) and panel statistics (Pt and Pa) confirmed the existence of long-run relationships between the variables in all four models, as they all rejected the null of no cointegration in all the models.
5. Panel Regression Results
Table 6 presents the results of the DCCE regression conducted to determine long-run elasticity relationships. The table contains four models, with each displaying the estimates of an equation with each of the four country risk indexes as the country risk variable. Specifically, model 1, model 2, model 3 and model 4 represent the results of regressions for equations with the composite country risk index, economic risk index, financial risk index and political risk index, respectively, as the country risk variable. For model 1, the results from the DCCE regression indicated that the composite country risk index was positive and strongly significant at the 1% level. This indicated that country risk had a strong negative effect on FDI inflows into the Visegrád countries. Specifically, the result suggested that a 1% increase in composite country risk index score (which suggests a reduction in the overall country risk) led to an increase in FDI inflow by 0.835%, and vice versa.
This finding suggested that, when holding other factors constant, reducing country risk gave impetus to the inflow of FDI into the V4. The result could also suggest that FDI inflows into the V4 were influenced by the relationship between the levels of country risk in the FDI origin countries and those of the V4. It was argued by Yasuda and Kotabe (2021) that multinational companies set origin countries’ level of risk as the reference point and that they adjudge FDI host countries as investment opportunities (or threats) if their level of risk is lower than (or higher than) that of the origin country. Thus, this research output implied that to improve FDI inflows into the V4, the countries should work towards attaining higher country risk index scores by gaining improvement in the ICRG variables that indicate a reduction in country risk. The result is congruent with the position of extant studies on the FDI–country risk nexus (Almahmoud 2014; Bevan and Estrin 2000; Brada et al. 2006; Hammoudeh et al. 2011; Salehnia et al. 2019; Sissani and Belkacem 2014), which consider country risk as an important influencer of FDI inflows.
For model 2, the DCCE regression results showed that the economic risk index had a positive and strongly significant coefficient at the 1% level. This indicated that the economic risk negatively affected the FDI inflows. In particular, the result suggested that a 1% increase in the economic risk index score (which implies a decrease in economic risk) enhanced the FDI inflows by 0.919%, and vice versa. This result corroborated previous findings by Salehnia et al. (2019) and Salem and Younis (2021), which showed that economic risk has a powerful effect on FDI inflows. The result further stressed the importance of maintaining high GDP levels, as well as optimal levels of the inflation rate, budget balance and current account for investment inflows to be enhanced in the V4. Turning to model 3, the coefficient of financial risk was positive and significant at the 10% level. This suggested that although financial risk negatively affected the FDI inflows, the effect was somewhat weak. As shown in Table 1, the average financial risk rating score for the V4 over the study period was 15.25/50, while the lowest score was −26.49/50. This below-par performance of the V4 regarding the financial risk rating did not inhibit the growth of the FDI inflows over the years examined. Therefore, compared with the economic and political risk components, the financial risk appeared to be less important in influencing the FDI inflows into the Visegrád countries.
The result for political risk was captured by model 4, and the DCCE regression revealed that it exerted a negative impact on the FDI inflows, as the coefficient of the political risk index was positive and significant at the 5% level. This implied that improvement in the political risk index score (which indicates a decline in political risk) engendered rising FDI inflows. Specifically, holding other variables constant, a 1% increase in the political risk index score (or a 1% decrease in political risk) accounted for a 0.307% increase in the FDI inflows into the V4. This research outcome was in line with a preponderance of extant studies (Avioutskii and Tensaout 2016; Cieślik and Goczek 2018; Hayakawa et al. 2013; Rafat and Farahani 2019; Salehnia et al. 2019; Bouyahiaoui and Hammache 2017; Su et al. 2018), which established political risk as a major influencer of the FDI inflows. As indicated in Table 1, the average political risk index score for the V4 over the study period was 77.63, while the lowest score was 70.58. Both scores fell within the ICRG score classification of low risk, which implied that all the countries were doing very well in this regard. Therefore, this finding indicated the need for the Visegrád countries to continue to maintain their high political risk rating, which was found to be important for attracting FDI.
For the covariates in all four models, the DCCE results demonstrated that real GDP, which represents the market size, was a strong determinant of the FDI inflows, as the coefficient of GDP was positive and strongly significant across the four models. The magnitudes of real GDP in the models suggested that it exerted a strong positive elastic impact on FDI in the V4. This research outcome is consistent with several studies that identified market size as a strong driver of FDI (Demirhan and Masca 2008; Khan and Akbar 2013; Meyer and Habanabakize 2018; Salem and Younis 2021; Wach and Wojciechowski 2016). The coefficient of natural resources was insignificant across the four models. This result suggested that natural resource availability did not influence the inflow of FDI into the V4. For infrastructure, the coefficient was positive and significant throughout. This implied that improvement in the level of infrastructure was associated with an increase in FDI inflow. This result is consistent with the findings of Demirhan and Masca (2008) for 38 developing countries and Gorbunova et al. (2012) for 26 transition countries, which included the V4, who stated that infrastructure in the host country positively influences FDI inflows. The DCCE results further showed that the coefficient of trade openness was positive and significant in all four models, which suggested that increased openness to international trade enhanced the FDI inflows into the V4. This result supports findings by Anyanwu (2012) and Liargovas and Skandalis (2012), who concluded that trade openness is positively linked to FDI.
The long-run elasticity results of the V4 panel were already presented and discussed. However, in order to facilitate more robust policy formulation, there is a need to also explore the linkage between the FDI inflow, country risk, real GDP, natural resources, infrastructure and trade openness on a country-wise basis. To this end, FMOLS regressions were conducted for each of the Visegrád countries, and the results are presented in Table 7. The table contains four compartments, with each consisting of an equation with each of the country risk variables. As such, for each of the four countries, models 1–4 represent the results of regressions for the composite country risk, economic risk, financial risk and political risk, respectively, as the country risk variable. The model 1 results revealed that the composite country risk had a negative and significant impact on the FDI inflows into the Visegrád countries. Specifically, a 1% increase in the country risk index score (which implies a decline in country risk) led to an increase in the FDI inflows in the case of the Czech Republic, Hungary, Poland and Slovakia by 0.25%, 0.17%, 0.77% and 0.52%, respectively, though the impact was rather weak with a 10% significance in the case of Hungary. Generally, a healthier country risk rating raises the confidence of overseas investors regarding the safety of their investment in the host country, which, in turn, enhances their tendency to bring in their investment. These results are in line with the findings of Almahmoud (2014) and Sissani and Belkacem (2014) for Saudi Arabia and Algeria, respectively.
Concerning the coefficient of the economic risk index, as shown in model 2, it had a significantly positive coefficient, which suggested that the economic risk negatively affected the FDI inflows into the Visegrád countries. In particular, a 1% increase in the economic risk index score (which implies a reduction in economic risk) enhanced the FDI inflows by 0.62%, 0.46%, 0.37% and 0.59% into the Czech Republic, Hungary, Poland and Slovakia, respectively. The strong significance and high coefficients of economic risk in all the countries suggested the cruciality of economic risk in driving the FDI inflows into the V4. Therefore, this research outcome indicated the need for both monetary and fiscal authorities in the Visegrád countries to put appropriate policies in place towards maintaining optimal levels of the inflation rate, GDP growth, budget and current account.
The estimates of financial risk that are displayed for model 3 show that financial risk had mixed impacts on the FDI inflows across the Visegrád economies. It had a negative and strongly significant impact on the FDI inflows into Hungary. According to the estimates, a 1% increase in the financial risk index score (which suggests a reduction in financial risk) led to an increase in the FDI inflows by 0.31% into Hungary. However, the impacts of financial risk on the FDI inflows into the Czech Republic, Poland and Slovakia were also negative but weak, as the coefficients of the financial risk index score were only significant at the 10% level for these three countries. This mixed country-wise result of the financial risk variable was congruent with the overall panel finding of the weak impact of financial risk on the FDI inflows into the V4. In the case of Hungary with a strong negative impact of financial risk on the FDI inflows, it suggested a consequence of injudicious fiscal policies of the country’s socialist administration in the 2000s, which led to a budget deficit that far exceeded the EU criteria1. This led to increased foreign debt at levels far above their V4 counterparts over the years (see Appendix A), which increased the economy’s financial risk and in turn led to fluctuations in the FDI inflows. Therefore, the case of Hungary suggested that for individual V4 countries, financial risk can be a key influencer of FDI inflow, depending on how it is managed. Regarding the coefficient of the political risk index displayed for model 4, it was positive and strongly significant across the four countries. This implied that political risk had a negative effect on the FDI inflow. Particularly, a 1% increase in the political risk index score (which suggests a decrease in political risk) enhanced the FDI inflows by 0.26%, 0.54%, 0.17% and 0.48% into the Czech Republic, Hungary, Poland and Slovakia, respectively.
Finally, the estimates of the covariates in all four models for the four countries were generally consistent with those of the overall panel discussed earlier with only a few exceptions. The trio of market size, infrastructure and trade openness bore positive and strongly significant coefficients throughout. This implied that the three variables positively influenced the FDI inflows into each of the Visegrád countries. However, while natural resources were found to be insignificant for the Czech Republic, Hungary and Slovakia, it was weakly significant in the case of Poland in all the models, which implied that natural resource availability somewhat influenced the inflows of FDI to Poland.
6. Conclusions
Investigation of FDI determinants has grown significantly over the years due to the vital role that FDI plays in the economic growth process across countries. While several variables were identified as determinants of FDI in different regions of the world, vigorous debate continues as research results have remained predominantly mixed and inconclusive. Meanwhile, studies that considered the peculiarities and heterogeneities of the V4 group in the investigation of country risk as a determinant of FDI inflows are scarce. Hence, this study filled the literature gap by examining whether country risk influenced foreign investors’ decision to invest in the V4. To achieve this objective, this study employed the DCCE estimator, which accounts for CD, structural breaks and heterogenous slopes in panel data estimation. A survey of literature on the subject showed that no previous study accounted for CD despite the increased predominance of globalisation interdependence between countries. To ensure the robustness of results and explore how the coefficients varied across the countries, country-wise FMOLS regressions were also conducted on annual data for the V4 over the period 1991–2020.
The empirical results showed that country risk mattered for the FDI inflows, as it negatively impacted the FDI inflows. It was also found that economic and political risks were essential determinants of the FDI inflows, as both had negative effects on the FDI. However, it was found that changes in financial risk had weak and mixed impacts on the FDI inflows in the overall panel and country-wise regressions, respectively. The research outcome also demonstrated that market size, infrastructure and trade openness positively influenced the FDI, while natural resource availability had no impact and a mixed impact in the overall panel and country-wise regressions, respectively.
Based on these research outcomes, there is a need for the appropriate macroeconomic and government authorities in the V4 to enhance the market potentials of their economies by improving and upholding the corporate and macroeconomic structures in order to enhance their country risk attributes. Furthermore, appropriate policy should be formulated by the governments in these countries towards increasing the market potential, quality of infrastructure and optimal environment for FDI-inflow-enabling trade.
Funding
This research received no external funding.
Institutional Review Board Statement
Not applicable.
Informed Consent Statement
Not applicable.
Data Availability Statement
Not applicable.
Conflicts of Interest
The author declares no conflict of interest.
Appendix A
Figure A1.
Trend of foreign debt/GDP in the Visegrád countries. Source: Muddling through deficit troubles. https://www.euromoney.com/article/b1320xhhjpfb02/muddling-through-deficit-troubles (accessed on 22 July 2022).
Figure A1.
Trend of foreign debt/GDP in the Visegrád countries. Source: Muddling through deficit troubles. https://www.euromoney.com/article/b1320xhhjpfb02/muddling-through-deficit-troubles (accessed on 22 July 2022).

| 1 | Muddling through deficit troubles. Available online: https://www.euromoney.com/article/b1320xhhjpfb02/muddling-through-deficit-troubles (accessed on 22 July 2022). |
References
- Adusei, Michael. 2012. Financial development and economic growth: Is Schumpeter right? British Journal of Economics, Management and Trade 2: 265–78. [Google Scholar] [CrossRef]
- Ahmad, Nor Asma Binti, Normaz Wana Ismail, and Nurhaiza Nordin. 2015. The impact of infrastructure on foreign direct investment in Malaysia. International Journal of Management Excellence 5: 584–90. [Google Scholar] [CrossRef]
- Akinlo, Anthony Enisan. 2003. Globalisation, international investment and stock market growth in Sub-Saharan Africa. In Institute of Developing Economies VRF Monograph Series. Tokyo: Jetro, vol. 382. [Google Scholar]
- Akinlo, Anthony Enisan. 2004. Foreign direct investment and growth in Nigeria: An empirical investigation. Journal of Policy Modeling 26: 627–39. [Google Scholar] [CrossRef]
- Almahmoud, Abdulaziz Ibrahim. 2014. Country risk ratings and stock market movements: Evidence from emerging economy. International Journal of Economics and Finance 6: 88–96. [Google Scholar] [CrossRef]
- Altomonte, Carlo. 2000. Economic Determinants and Institutional Frameworks: FDI in Economies in Transition. Transnational Corporations 9: 75–106. [Google Scholar]
- Altunöz, Umut. 2014. İkiz açık hipotezinin geçerliliğinin sınır yöntemiyle sınanması: Türkiye örneği. Adıyaman Üniversitesi Sosyal Bilimler Enstitüsü Dergisi 2014: 425–46. [Google Scholar] [CrossRef]
- Ambroziak, Łeszek. 2013. Wpływ bezpośrednich inwestycji zagranicznych na handel wewnątrzgałęziowy państw Grupy Wyszehradzkiej. Warszawa: IBRKK. [Google Scholar]
- Anyanwu, John Chukwudi. 2012. Why Does Foreign Direct Investment Go Where It Goes? New evidence from African countries. Annals of Economics and Finance 13: 425–62. [Google Scholar]
- Arık, Şebnem, Beyhan Akay, and Mehmet Zanbak. 2014. Doğrudan yabancı yatırımları belirleyen faktörler: Yükselen piyasalar örneği. Anadolu University Journal of Social Sciences 14: 97–110. [Google Scholar] [CrossRef]
- Avioutskii, Viatcheslav, and Mouloud Tensaout. 2016. Does Politics Matter? Partisan FDI in Central and Eastern Europe. Multinational Business Review 24: 375–98. [Google Scholar] [CrossRef]
- Bai, Jushan, and Chihwa Kao. 2006. On the estimation and inference of a panel cointegration model with cross-sectional dependence. Contributions to Economic Analysis 274: 3–30. [Google Scholar]
- Baum, Christopher, Mark Schaffer, and Steven Stillman. 2003. Instrumental variables and GMM: Estimation and testing. Stata Journal 3: 1–31. [Google Scholar] [CrossRef]
- Baum, Christopher, Mark Schaffer, and Steven Stillman. 2007. Enhanced routines for instrumental variables/generalized method of moments estimation and testing. Stata Journal 7: 465–506. [Google Scholar] [CrossRef]
- Bevan, Alan, and Saul Estrin. 2000. The Determinants of Foreign Direct Investment in Transition Economies. London: Centre for New and Emerging Markets, London Business School. Available online: https://ssrn.com/abstract=258070 (accessed on 22 March 2022).
- Bitar, Nicholas, Mohamad Hamadeh, and Roy Khoueiri. 2020. Impact of political instability on foreign direct investment in Lebanon. Asian Social Science 16: 41–48. [Google Scholar] [CrossRef]
- Bobenic Hintosova, Aneta, Michaela Bruothova, Zuzana Kubikova, and Rastislav Rucinsky. 2018. Determinants of foreign direct investment inflows: A case of the Visegrad countries. Journal of International Studies 11: 222–35. [Google Scholar] [CrossRef]
- Bouyahiaoui, Nasser, and Souria Hammache. 2017. The Impact of Country Risk on FDI in the MENA Region: Panel Data Analysis on OPEC and Non-OPEC Countries. Available online: https://www.researchgate.net/publication/327069449_the_impact_of_country_risk_on_fdi_in_the_mena_region_panel_data_analysis__on_opec_and_non-opec_countries (accessed on 22 March 2022).
- Brada, Josef C., Ali M. Kutan, and Taner M. Yigit. 2006. The Effects of Transition and Political Instability on Foreign Direct Investment Inflows: Central Europe and the Balkans (November 2004). Available online: https://ssrn.com/abstract=665122 (accessed on 5 November 2021).
- Brückner, Markus. 2013. On the simultaneity problem in the aid and growth debate. Journal of Applied Econometrics 28: 126–50. [Google Scholar] [CrossRef]
- Busse, Matthias, and Carsten Hefeker. 2007. Political risk, institutions and foreign direct investment. European Journal of Political Economy 23: 397–415. [Google Scholar] [CrossRef]
- Chen, Jiandong, Shulei Cheng, Vinko Nikic, and Malin Song. 2018. Quo Vadis? Major players in global coal consumption and emissions reduction. Transformations in Business & Economics 17: 112–32. [Google Scholar]
- Chidlow, Agnieszka Aggie, Laura Salciuviene, and Stephen Young. 2009. Regional determinants of inward FDI distribution in Poland. International Business Review 18: 119–33. [Google Scholar] [CrossRef]
- Chudik, Alexander, and Mohammad Hashem Pesaran. 2015. Common correlated effects estimation of heterogeneous dynamic panel data models with weakly exogenous regressors. Journal of Econometrics 188: 393–420. [Google Scholar] [CrossRef]
- Cieślik, Andrzej. 2020. Determinants of foreign direct investment from OECD countries in Poland. Eurasian Economic Review 10: 9–25. [Google Scholar] [CrossRef]
- Cieślik, Andrzej, and Łucasz Goczek. 2018. Control of corruption, international investment, and economic growth—Evidence from panel data. World Development 103: 323–35. [Google Scholar] [CrossRef]
- De Hoyos, Rafael, and Vasilis Sarafidis. 2006. Testing for cross-sectional dependence in panel-data models. The Stata Journal 6: 482–96. [Google Scholar] [CrossRef]
- Demirhan, Erdal, and Mahmut Masca. 2008. Determinants of foreign direct investment flows to developing countries: A cross-sectional analysis. Prague Economic Papers 17: 356–69. [Google Scholar] [CrossRef]
- Dey, Sima Rani, and Mohammad Tareque. 2019. External debt and growth: Role of stable macroeconomic policies. Journal of Economics, Finance and Administrative Science 25: 185–204. [Google Scholar] [CrossRef]
- Ditzen, J. 2018. Estimating dynamic common-correlated effects in Stata. Stata Journal 18: 585–617. [Google Scholar] [CrossRef]
- Dunning, John Harry. 1979. Explaining changing patterns of international production: In defense of the eclectic theory. Oxford Bulletin of Economics and Statistics 41: 269–95. [Google Scholar] [CrossRef]
- Dunning, John Harry. 1998. Location and the multinational enterprise: A neglected factor? Journal of International Business Studies 29: 45–66. [Google Scholar] [CrossRef]
- Eberhardt, Markus, and Francis Teal. 2010. Productivity Analysis in Global Manufacturing Production. Discussion Paper 515. Oxford: Department of Economics, University of Oxford. Available online: http://www.economics.ox.ac.uk/research/WP/pdf/paper515.pdf (accessed on 22 March 2022).
- Elleuch, Nadia Mhiri, Ilhem Zorgui Jaouadi, and Said Jaouadi. 2015. Examination of impact of political and country risk on foreign direct investment inflows in Tunisia. European Academic Research 2: 14434–45. [Google Scholar]
- Eng, Maximo, Francis Lees, and Laurence Mauer. 1998. Global Finance, 2nd ed. Boston: Addison-Wesley. [Google Scholar]
- Frees, Edward. 1995. Assessing cross-sectional correlation in panel data. Journal of Econometrics 69: 393–414. [Google Scholar] [CrossRef]
- Friedman, Erika. 1937. The use of ranks to avoid the assumption of normality implicit in the analysis of variance. Journal of the American Statistical Association 32: 675–701. [Google Scholar] [CrossRef]
- Galego, Aurora, Carlos Vieira, and Isabel Vieira. 2004. The CEEC as FDI Attractors. A Menace to the EU Periphery? Emerging Markets Finance and Trade 40: 74–91. [Google Scholar] [CrossRef]
- Gauselmann, Andrea, Mark Knell, and Johannes Stephan. 2011. What drives FDI in Central—Eastern Europe? Evidence from the IWH-FDI-Micro database. Post-Communist Economies 23: 343–57. [Google Scholar] [CrossRef]
- Gonchar, Ksenia, and Maria Greve. 2022. The impact of political risk on FDI exit decisions. Economic Systems 46: 1–23. [Google Scholar] [CrossRef]
- Gorbunova, Yulia, Davide Infante, and Janna Smirnova. 2012. New evidence on FDI determinants: An appraisal over the transition period. Prague Economic Papers 21: 129–49. [Google Scholar] [CrossRef]
- Grossman, Gene, and Elhanan Helpman. 1991. Innovation and Growth in the Global Economy. Cambridge: MIT Press. [Google Scholar]
- Haendel, Dan. 1979. Foreign Investment and the Management of Political Risk. London: Routledge. [Google Scholar]
- Hammache, Souria, and Gani Chebini. 2017. The impact of country risk on FDI in the MENA region: Panel data analysis on OPEC and non-OPEC countries. In Annali del Dipartimento di Metodi e Modelli per L’economia il Territorio e la Finanza, October 2017. Roma: Sapienza University in Roma. Available online: Annali_2017_59-69_HammacheS_ChebiniG.pdf (accessed on 5 April 2022).
- Hammoudeh, Shawkat, Ramazan Sari, Mehmet Uzunkaya, and Tengdong Liu. 2011. The dynamics of BRICS’s country risk ratings and stock markets, US stock market and oil price. Mathematics and Computers in Simulation 94: 277–94. [Google Scholar] [CrossRef]
- Hayakawa, Kazunobu, Fukunari Kimura, and Hyun-Hoon Lee. 2013. How does country risk matter for foreign direct investment? The Developing Economies 51: 60–78. [Google Scholar] [CrossRef]
- Hoti, Suhejla, and Michael McAleer. 2002. Country Risk Ratings: An International Comparison. Seminar Series; Perth: Department of Economics, University of Western Australia. Available online: https://ideas.repec.org/e/pmc90.html (accessed on 2 June 2022).
- Hunya, Gabor. 2017. Conditions for an investment revival in Central and Eastern Europe. In Condemned to be Left Behind? Can Central and Eastern Europe Emerge from Its Low-Wage Model? Edited by Bela Galgóczi and Jan Drahokoupil. Brussels: European Trade Union Institute (ETUI), pp. 25–46. [Google Scholar]
- James, David. 2004. Political risk insurance after September 11 and the Argentine crisis: An underwriter’s view from London. In International Political Risk Management: The Brave New World. Edited by Theodore Moran. Washington, DC: Grupo Banco Mundial, MIGA. [Google Scholar]
- Janicki, Hubert, and Phanindra Wunnava. 2004. Determinants of foreign direct investment: Empirical evidence from EU accession candidates. Applied Economics 36: 505–9. [Google Scholar] [CrossRef]
- Kapetanios, George, Mohammad Hashem Pesaran, and Takashi Yamagata. 2011. Panels with nonstationary multifactor error structures. Journal of Econometrics 160: 326–48. [Google Scholar] [CrossRef]
- Khan, Muhammad Arshad. 2007. Foreign Direct Investment and Economic Growth: The Role of Domestic Financial Sector. Pakistan Institute of Development Economics (PIDE) Working Paper. Islamabad: PIDE. [Google Scholar]
- Khan, Mashrur Mustaque, and Mashfique Ibne Akbar. 2013. The impact of political risk on foreign direct investment. International Journal of Economics and Finance 5: 147–56. [Google Scholar] [CrossRef]
- Koopmans, Tjalling Charles. 1965. On the concept of optimal economic growth. In Study Week on the Econometric Approach to Development Planning. Amsterdam: North-Holland, pp. 225–300. [Google Scholar]
- Koyama, Takeshi, and Stephen Golub. 2006. OECD’s FDI Regulatory Restrictiveness Index: Revision and extension to more economies. In OECD Working Papers on International Investment. Issue 2006/04. Paris: OECD Publishing. [Google Scholar] [CrossRef]
- Krifa-Schneider, Hadjila, and Iuliana Matei. 2010. Business climate, political risk and FDI in developing countries: Evidence from panel data. International Journal of Economics and Finance 2: 54–65. [Google Scholar] [CrossRef]
- Lee, Kwan Yong, and Kanda Naknoi. 2014. Exchange rates, borrowing costs, and exports: Firm-level evidence. In University of Connecticut Department of Economics Working Paper, No. 2014–2018. Mansfield: University of Connecticut. [Google Scholar]
- Liargovas, Panagiotis, and Konstantinos Skandalis. 2012. Foreign direct investment and trade openness: The case of developing economies. Social Indicators Research 106: 323–31. [Google Scholar] [CrossRef]
- Lucas, E. Richard. 1993. On the determinants of direct foreign investment: Evidence from East and Southeast Asia. World Development 21: 391–406. [Google Scholar] [CrossRef]
- Mankiw, N. Gregory, David Romer, and David N. Weil. 1992. A contribution to the empirics of economic growth. The Quarterly Journal of Economics 107: 407–37. [Google Scholar] [CrossRef]
- Meyer, Daniel Francois, and Thomas Habanabakize. 2018. An analysis of the relationship between foreign direct investment (FDI), political risk and economic growth in South Africa. Business and Economic Horizons 14: 777–88. [Google Scholar] [CrossRef]
- Moosa, A. Imad. 2002. Foreign Direct Investment: Theory and Practice. New York: Palgrave Macmillan. [Google Scholar]
- Nassour, Abdelkader, Saliha Meftah, and Sajid Hussain Mirani. 2020. Does Political risk affect Foreign Direct Investment Inflows? Empirical Evidence from Selected MENA Economies. Estudios de Economia Aplicada 38: 6. [Google Scholar] [CrossRef]
- North, Douglass. 1990. Institutions, Institutional Change and Economic Performance. Cambridge: Cambridge University Press. [Google Scholar]
- Olaoye, Olumide, and Oluwatosin Aderajo. 2020. Institutions and economic growth in ECOWAS: An investigation into the hierarchy of institution hypothesis (HIH). International Journal of Social Econonomics 47: 1081–108. [Google Scholar] [CrossRef]
- Olaoye, O. Olumide, Oluwatosin O. Eluwole, Aziz Ayesha, and Olugbenga O. Afolabi. 2020. Government spending and economic growth in ECOWAS: An asymmetric analysis. The Journal of Econonomic Asymmetries 22: e00180. [Google Scholar] [CrossRef]
- Ozcan, Burcu. 2013. The nexus between carbon emissions, energy consumption and economic growth in Middle East countries: A panel data analysis. Energy Policy 62: 1138–47. [Google Scholar] [CrossRef]
- Pedroni, Peter. 2000. Fully modified OLS for heterogeneous cointegrated panels. In Nonstationary Panel Cointegration and Dynamic Panels. Advances in Econometrics. Edited by Badi Hani Baltagi. Bingley: Emerald Group Publishing Limited, vol. 15, pp. 93–30. [Google Scholar]
- Persyn, Damiaan, and Joakim Westerlund. 2008. Error-correction based cointegration tests for panel data. The Stata Journal 8: 232–41. [Google Scholar] [CrossRef]
- Pesaran, Mohammad Hashem. 2004. General Diagnostic Tests for Cross-Section Dependence in Panels. IZA Discussion Paper No. 1240. Bonn: Institute for the Study of Labour (IZA). [Google Scholar] [CrossRef]
- Pesaran, Mohammad Hashem. 2006. Estimation and inference in large heterogeneous panels with a multifactor error structure. Econometrica 74: 967–1012. [Google Scholar] [CrossRef]
- Pesaran, Mohammad Hashem. 2007. A simple panel unit root test in the presence of cross-section dependence. Journal of Applied Econometrics 22: 265–312. [Google Scholar] [CrossRef]
- Pesaran, Mohammad Hashem, and Ron P. Smith. 1995. Estimating long-run relationships from dynamic heterogeneous panels. Journal of Econometrics 68: 79–113. [Google Scholar] [CrossRef]
- Pesaran, Mohammad Hashem, Yongcheol Shin, and Ron P. Smith. 1999. Pooled mean group estimation of dynamic heterogeneous panels. Journal of the American Statistical Association 94: 621–34. [Google Scholar] [CrossRef]
- Phillips, C. B. Peter, and Bruce E. Hansen. 1990. Statistical inference in instrumental variable regression with I(1) processes. Review of Economic Studies 57: 99–125. [Google Scholar] [CrossRef]
- Qi, Shaozhou, and Yang Li. 2017. Threshold effects of renewable energy consumption on economic growth under energy transformation. Chinese Journal of Population, Resources and Environment 15: 312–21. [Google Scholar] [CrossRef]
- Qureshi, Irfan, and Zara Liaqat. 2020. The long-term consequences of external debt: Revisiting the evidence and inspecting the mechanism using panel VARs. Journal of Macroeconomics 63: 103184. [Google Scholar] [CrossRef]
- Rafat, Monireh, and Maryam Farahani. 2019. The country risks and foreign direct investment (FDI). Iranian Economic Review 23: 235–60. [Google Scholar]
- Rappaport, Jordan. 2000. How Does Openness to Capital Flows Affect Growth? Research Working Paper, RWP00-11. Kansas City: Federal Reserve Bank of Kansas City. [Google Scholar]
- Rodríguez, Noemi Dans. 2016. Country risk in foreign direct investment: Similarities and differences with country risk in exports. Mediterranean Perspectives 49: 18–32. [Google Scholar] [CrossRef]
- Root, Franklin. 1987. Entry Strategies for International Markets. Lexington: D.C. Heath & Co. [Google Scholar]
- Sabir, Samina, and Ahsan Khan. 2018. Impact of political stability and human capital on foreign direct investment in East Asia & Pacific and South Asian countries. Asian Journal of Economic Modelling 6: 245–56. [Google Scholar]
- Salehnia, Narges, Nooshin Karimi Alavijeh, and Mohammad Taher Ahmadi Shadmehri. 2019. The effect of economic, financial, and political risks on foreign direct investment in selected countries of the MENA region. Paper presented at the 3rd International Conference on Modern Developments in Management, Economics and Accounting, Tehran, Iran, July 11. [Google Scholar]
- Salem, Rania, and Reem Younis. 2021. The effect of country risk on foreign direct investment: Evidence from Egypt. Scientific Journal for Economic and Commerce 51: 276–43. [Google Scholar] [CrossRef]
- Sallai, Dorottya, and Gerhard Schnyder. 2018. The Transformation of Post-socialist Capitalism—From Developmental State to Clan State? Greenwich Papers in Political Economy No. 57. Available online: https://gala.gre.ac.uk/id/eprint/18535/ (accessed on 22 March 2022).
- Sass, Magdolna. 2017. Is a live dog better than a dead lion? Seeking alternative growth engines in the Visegrád countries. In Condemned to Be Left Behind? Can Central and Eastern Europe Emerge from Its Low-Wage Model? Edited by Bela Galgóczi and Jan Drahokoupil. Brussels: European Trade Union Institute (ETUI), pp. 47–79. [Google Scholar]
- Sissani, Midoun, and Zairi Belkacem. 2014. The effect of political risk on foreign direct investment: The case of Algeria. Hyperion Economic Journal 2: 29–35. [Google Scholar]
- Su, Weihua, Dongcai Zhang, Chonghui Zhang, Josef Abrham, Mihaela Simionescu, Natalya Yaroshevich, and Valentina Guseva. 2018. Determinants of foreign direct investment in the Visegrad group countries after the EU enlargement. Technological and Economic Development of Economy 24: 1955–78. [Google Scholar] [CrossRef]
- Tendera-Właszczuk, Helena, and Michal Szymański. 2015. Implementation of the welfare state in the Visegrád countries. Economics & Sociology 8: 126–42. [Google Scholar] [CrossRef]
- Topal, Mehmet Hanefi, and Özlem Sakine Gul. 2016. The Effect of Country Risk on Foreign Direct Investment: A Dynamic Panel Data Analysis for Developing Countries. Journal of Economics Library 3: 141–55. [Google Scholar]
- Turkay, Mesut. 2017. Heterogeneity across emerging market central bank reaction functions. Central Bank Review 17: 111–16. [Google Scholar] [CrossRef]
- Ugwuegbe, Sebastine Ugochukwu, Nwanneka Judith Modebe, and Edith Onyeanu. 2014. The impact of foreign direct investment on capital formation in Nigeria: A cointegration approach. International Journal of Economics, Finance and Management Science 2: 188–96. [Google Scholar]
- UNCTAD. 2007. World Investment Report 2007: Transnational Corporations, Extractive Industries and Development. Geneva: United Nations Conference on Trade and Development. [Google Scholar]
- Vojtovic, Sergej. 2019. The Linkages between Economic Growth and FDI in CEE Countries. Ekonomický Časopis 67: 264–79. [Google Scholar]
- Wach, Krzysztof, and Liwiusz Wojciechowski. 2016. Determinants of inward FDI into Visegrad countries: Empirical evidence based on panel data for the years 2000–2012. Economics and Business Review 2: 34–52. [Google Scholar] [CrossRef]
- Westerlund, Joakim. 2007. Testing for Error Correction in Panel Data. Oxford Bulletin of Economics and Statistics 69: 709–48. [Google Scholar] [CrossRef] [Green Version]
- White, Colin, and Miao Fan. 2006. Risk and Foreign Direct İnvestment. London: Palgrave Macmillan. [Google Scholar]
- Yasuda, Naoki, and Masaaki Kotabe. 2021. Political risks and foreign direct investments by multinational corporations: A reference point approach. Global Strategy Journal 11: 156–84. [Google Scholar] [CrossRef]
- Yildirim, Dilem, and Ethem Erdem Orman. 2018. The Feldstein-Horioka puzzle in the presence of structural breaks: Evidence from China. Journal of the Asia Pacific Economy 23: 374–92. [Google Scholar] [CrossRef]
- Zielińska-Głębocka, Anna. 2013. Sytuacja gospodarcza państw Grupy Wyszehradzkiej w procesie transformacji i integracji z Unią Europejską. In Konkurencyjność międzynarodowa i regionalna państw Grupy Wyszehradzkiej: Polski, Węgier, Czech i Słowacji. Edited by Anna Zielińska-Głębocka and Krystyna Gawlikowska-Heuckel. Gdańsk: Wyd. UG. [Google Scholar]
Figure 1.
Trend of the country risk index in the Visegrád countries.

Table 1.
Studies on the country risk–FDI nexus.
| Author(s) | Data Span | Variables | Method | Country(ies) | Findings |
|---|---|---|---|---|---|
| Salehnia et al. (2019) | 2000–2019 | FDI, ER, FR, PR, GDP, INF, TRADE | Fixed-effects model (FE) | 10 MENA countries | ER, FR and PR affect FDI negatively; ER is most influential |
| Bouyahiaoui and Hammache (2017) | 2000–2015 | FDI, PR variables | Qualitative analysis | MENA countries | Political risk influences FDI |
| Hayakawa et al. (2013) | 1985–2007 | FDI, PR, FR | GMM | 90 countries | PR negatively affects FDI, but FR has no effect |
| Sissani and Belkacem (2014) | 1990–2012 | FDI, PR, FR | Multiple regression | Algeria | PR and FR affect FDI, but FR is stronger |
| Krifa-Schneider and Matei (2010) | 1996–2008 | FDI, business climate, PR, GDP, INF, TRADE | FE, GMM | 33 developing and transition economies | Reducing PR increases FDI; business climate is key for FDI |
| Meyer and Habanabakize (2018) | 1995–2016 | FDI, PR, GDP | ARDL, Granger causality | South Africa | Impact of PR on FDI is higher than that of GDP |
| Bitar et al. (2020) | 2008–2018 | FDI, wage rate, INF, TRADE, infrastructure | OLS | Lebanon | There is causality between all PR factors and FDI |
| Almahmoud (2014) | 2005–2012 | All-Share Index, PR, ER, FR | ARDL | Saudi Arabia | CR factors are associated with stock market movements; FR is most sensitive |
| Hammoudeh et al. (2011) | 1992–2011 | Equity return, oil price, ER, FR, PR | ARDL | BRICS | Only the Chinese stock market responds to changes in all the factors; FR is more sensitive than ER and PR |
| Bevan and Estrin (2000) | 1994–1998 | FDI, GDP, labour cost, risk, TRADE | FE and random effects | 14 Central and Eastern European countries (CEECs) | Determinants of FDI comprise risk, market size, labour cost and gravity factors |
| Brada et al. (2006) | 1990–2002 | FDI, GDP, TRADE, POP, INF, number of telephone lines, school enrolment | GLS (FGLS) pooled-panel regression | Transition economies of Central Europe, the Baltics and the Balkans | Transitional factors like national risk, privatisation progress, banking sector reforms and trade liberalisation affect FDI negatively |
| Cieślik and Goczek (2018) | 1994–2014 | FDI, control of corruption, POP, EXR volatility, GDP | GMM | 142 countries | Corruption reduces stock of FDI |
| Avioutskii and Tensaout (2016) | 2002–2015 | FDI, GDP, PR, corruption index | FE, dynamic adjustment model | 5 CEECs | PR, economic reforms and political liberalisation influence FDI |
| Bobenic Hintosova et al. (2018) | 1989–2016 | FDI, GDP, TRADE, TAX, INF, R&D, EDUC | OLS, FE | V4 | Wages and educated labour force positively affect FDI; TRADE, R&D and TAX negatively affect FDI |
| Gauselmann et al. (2011) | 2000–2010 | FDI, GDP, technology, labour costs | Survey analysis | 5 CEECs | Access to markets and factor price mostly affect FDI |
| Wach and Wojciechowski (2016) | 2000–2010 | FDI, GDP, labour productivity, access to Baltic Sea, common border | Gravity model | V4 | Each V4 country received FDI from EU countries because of market potential |
| Rafat and Farahani (2019) | 1985–2016 | FDI, PR, TRADE, INF, GDP, EXR | Two-stage least-squares (2SLS) | Iran | National risk variables impact FDI |
| Salem and Younis (2021) | 2005–2015 | FDI, ER, FR, PR, | Multiple regression | Egypt | ER and PR influence FDI; FR has no impact on FDI |
| Yasuda and Kotabe (2021) | 1992–2007 | FDI, PR, MNC attributes, GDP, metal price | Zero-inflated negative binomial regression model | 444 MNCs from 35 countries; 703 mines from 53 countries | MNCs adjudge host countries as investment opportunities (or threats) if their level of risk is lower than (or higher than) that of the origin country |
| Gonchar and Greve (2022) | 2000–2016 | FDI, political risk variables | Cox proportional hazard model | Russia—MNCs plant-level data | MNCs are sensitive to issues of law, order, socioeconomic conditions and military involvement in politics |
Note: CR—country risk; ER—economic risk; FR—financial risk; PR—political risk.
Table 2.
Descriptive statistics.
| Mean | Median | Maximum | Minimum | Std. Dev. | |
|---|---|---|---|---|---|
| FDI (billion USD) | 16.31 | 4.99 | 171.37 | −64.37 | 16.9 |
| Country risk index | 63.92 | 64.26 | 78.98 | 32.59 | 7.82 |
| Economic risk index | 36.38 | 36.67 | 44.44 | 19.44 | 4.80 |
| Financial risk index | 15.25 | 15.56 | 35.73 | −26.49 | 8.72 |
| Political risk index | 77.63 | 77.5 | 86.58 | 70.58 | 3.09 |
| Real GDP (billion USD) | 186 | 118 | 661 | 41.6 | 147 |
| Natural resources | 0.83 | 0.54 | 5.69 | 0.23 | 0.90 |
| Infrastructure | 73.78 | 97.46 | 149.39 | 0.002 | 53.26 |
| Trade | 117.63 | 115.32 | 190.86 | 43.72 | 38.96 |
Table 3.
Cross-sectional dependence test results.
| Model | Pesaran’s (2004) CD Test | Frees’s (1995) CD Test | Friedman’s (1937) Test |
|---|---|---|---|
| Country risk | 3.118 *** (0.000) | 2.105 * (0.059) | 21.624 *** (0.000) |
| Economic risk | 4.103 ** (0.013) | 3.117 (0.746) | 18.558 ** (0.041) |
| Financial risk | 3.119 *** (0.008) | 2.741 *** (0.006) | 15.338 *** (0.000) |
| Political risk | 5.351 *** (0.000) | 3.419 (0.124) | 14.117 ** (0.010) |
Note: CD—cross-sectional dependence; ***, ** and * denote 1%, 5% and 10% levels of significance, respectively; values in parentheses in the body of the table are p-values.
Table 4.
Pesaran CIPS panel unit root test.
| Variable | Level | First Difference | Decision |
|---|---|---|---|
| FDI | 3.50 (0.38) | −6.13 ** (0.00) | I(1) |
| Country risk | 1.97 (0.20) | −3.65 *** (0.00) | I(1) |
| Economic risk | 0.87 (1.54) | −1.92 ** (0.02) | I(1) |
| Financial risk | 3.44 (0.21) | −2.55 ** (0.04) | I(1) |
| Political risk | 1.82 (0.42) | −3.16 *** (0.00) | I(1) |
| Real GDP | 3.84 (0.88) | −7.25 ** (0.03) | I(1) |
| Natural resources | 2.58 (0.15) | −5.61 ** (0.01) | I(1) |
| Infrastructure | 2.97 (0.59) | −4.27 *** (0.00) | I(1) |
| Trade | 1.12 (0.16) | −2.26 *** (0.00) | I(1) |
Note: *** and ** denote 1% and 5% levels of significance respectively; Values in parentheses are p-values.
Table 5.
Panel cointegration test results.
| Test Statistics | Model 1 | Model 2 | Model 3 | Model 4 |
|---|---|---|---|---|
| Country Risk | Economic Risk | Financial Risk | Political Risk | |
| Pedroni’s Cointegration Test | ||||
| Panel v-stat | 0.518 | 0.629 | 0.812 | 0.628 |
| Panel rho-stat | −0.622 | −0.391 | −0.471 | −0.672 |
| Panel pp-stat | −7.419 *** | −11.416 *** | −8.815 *** | −6.173 *** |
| Panel adf-stat | −8.335 *** | −9.037 *** | −8.712 *** | −6.210 *** |
| Group rho-stat | −0.471 | −0.193 | −0.162 | −0.059 |
| Group pp-stat | −5.515 *** | −6.323 *** | −4.841 *** | −4.172 *** |
| Group adf-stat | −2.931 ** | −5.031 *** | −4.227 *** | −2.183 *** |
| Westerlund’s Cointegration Test | ||||
| Gt | −12.291 *** | −8.916 ** | −6.172 *** | −9.422 ** |
| Ga | −8.110 *** | −7.190 ** | −11.180 ** | −9.131 ** |
| Pt | −2.716 ** | −4.107 *** | −7.223 *** | −6.924 *** |
| Pa | −6.558 *** | −10.682 ** | −2.192 ** | −5.972 *** |
Note: *** and ** represent statistical significance at the 1% and 5% levels, respectively.
Table 6.
DCCE regression results.
| Model 1 | Model 2 | Model 3 | Model 4 | |
|---|---|---|---|---|
| CRV—Composite Country Risk | CRV—Economic Risk | CRV—Financial Risk | CRV—Political Risk | |
| Country risk variable (CRV) | 0.835 ** | 0.919 *** | 0.082 * | 0.307 ** |
| (0.017) | (0.000) | (0.054) | (0.026) | |
| Real GDP | 0.549 *** | 0.521 *** | 0.602 ** | 0.215 *** |
| (0.000) | (0.000) | (0.037) | (0.000) | |
| Natural resources | 0.314 | 1.502 | 0.726 | 0.159 |
| (1.927) | (0.589) | (0.113) | (0.427) | |
| Infrastructure | 0.029 *** | 0.012 ** | 0.046 ** | 0.061 * |
| (0.001) | (0.041) | (0.033) | (0.052) | |
| Trade openness | 0.011 ** | 0.059 *** | 0.007 ** | 0.028 * |
| (0.046) | (0.004) | (0.015) | (0.068) |
Note: dependent variable was FDI inflows; all variables are in natural logarithm form; probability values are in brackets; ***, ** and * denote 1%, 5%, and 10% levels of significance, respectively.
Table 7.
Results of country-wise FMOLS regressions.
| Czech Republic | Hungary | Poland | Slovakia | |
|---|---|---|---|---|
| Model 1: CRV—Composite Country Risk Index | ||||
| Country risk | 0.25 ** (0.02) | 0.17 * (0.06) | 0.77 *** (0.00) | 0.52 ** (0.04) |
| Real GDP | 0.11 *** (0.00) | 0.52 ** (0.04) | 0.20 ** (0.02) | 0.19 *** (0.00) |
| Natural Resources | 0.91 (0.25) | 0.33 (1.02) | 0.28 * (0.06) | 1.42 (0.17) |
| Infrastructure | 0.26 ** (0.01) | 0.15 *** (0.00) | 0.42 * (0.05) | 0.31 *** (0.00) |
| Trade openness | 0.03 * (0.08) | 0.18 ** (0.01) | 0.02 *** (0.00) | 0.16 ** (0.02) |
| Model 2: CRV—Economic Risk Index | ||||
| Economic risk | 0.62 *** (0.00) | 0.46 *** (0.00) | 0.37 ** (0.04) | 0.59 *** (0.00) |
| Real GDP | 0.05 ** (0.01) | 0.22 ** (0.03) | 0.16 *** (0.00) | 0.35 ** (0.01) |
| Natural Resources | 0.17 (1.04) | 1.38 (1.70) | 0.31 * (0.05) | 0.62 (0.13) |
| Infrastructure | 0.29 * (0.08) | 0.19 ** (0.02) | 0.33 * (0.07) | 0.25 *** (0.00) |
| Trade openness | 0.06 *** (0.00) | 0.01 *** (0.00) | 0.11 ** (0.04) | 0.24 ** (0.01) |
| Model 3: CRV—Financial Risk Index | ||||
| Financial risk | 0.19 * (0.05) | 0.31 *** (0.03) | 0.15 * (0.07) | 0.36 * (0.06) |
| Real GDP | 0.17 *** (0.00) | 0.37 ** (0.01) | 0.10 *** (0.00) | 0.21 ** (0.02) |
| Natural Resources | 1.08 (0.13) | 0.09 (0.29) | 0.22 * (0.05) | 0.81 (1.13) |
| Infrastructure | 0.03 ** (0.01) | 0.26 ** (0.04) | 0.41 * (0.08) | 0.05 * (0.06) |
| Trade openness | 0.15 ** (0.01) | 0.21 *** (0.00) | 0.30 ** (0.02) | 0.04 ** (0.01) |
| Model 4: CRV—Political Risk Index | ||||
| Political risk | 0.26 ** (0.02) | 0.54 *** (0.00) | 0.17 *** (0.00) | 0.48 *** (0.00) |
| Real GDP | 0.15 *** (0.00) | 0.41 ** (0.03) | 0.15 * (0.05) | 0.32 ** (0.04) |
| Natural Resources | 1.33 (0.94) | 0.58 (0.43) | 0.40 * (0.07) | 0.55 (1.83) |
| Infrastructure | 0.01 *** (0.00) | 0.04 ** (0.04) | 0.12 *** (0.00) | 0.22 ** (0.03) |
| Trade openness | 0.11 *** (0.00) | 0.05 ** (0.01) | 0.10 *** (0.00) | 0.16 *** (0.00) |
Note: dependent variable—FDI inflows; CRV—country risk variable; all variables are in natural logarithm forms; probability values are in brackets; ***, ** and * denote 1%, 5% and 10% levels of significance, respectively.
Publisher’s Note: MDPI stays neutral with regard to jurisdictional claims in published maps and institutional affiliations. |
© 2022 by the author. Licensee MDPI, Basel, Switzerland. This article is an open access article distributed under the terms and conditions of the Creative Commons Attribution (CC BY) license (https://creativecommons.org/licenses/by/4.0/).
Share and Cite
MDPI and ACS Style
Hassan, A.S. Does Country Risk Influence Foreign Direct Investment Inflows? A Case of the Visegrád Four. Economies 2022, 10, 221. https://doi.org/10.3390/economies10090221
AMA Style
Hassan AS. Does Country Risk Influence Foreign Direct Investment Inflows? A Case of the Visegrád Four. Economies. 2022; 10(9):221. https://doi.org/10.3390/economies10090221
Chicago/Turabian StyleHassan, Adewale Samuel. 2022. "Does Country Risk Influence Foreign Direct Investment Inflows? A Case of the Visegrád Four" Economies 10, no. 9: 221. https://doi.org/10.3390/economies10090221
Note that from the first issue of 2016, this journal uses article numbers instead of page numbers. See further details here.