
The Economic Efficiency of Coffee Growers in the Department of Caldas, Colombia


Abstract
:1. Introduction
2. Methodology
2.1. Efficiency Measures
2.2. Stochastic Boundary Analysis of Panel Data
2.3. Location and Study Area
2.4. Study Population
2.5. Information Capture
2.6. Research Variables
3. Results
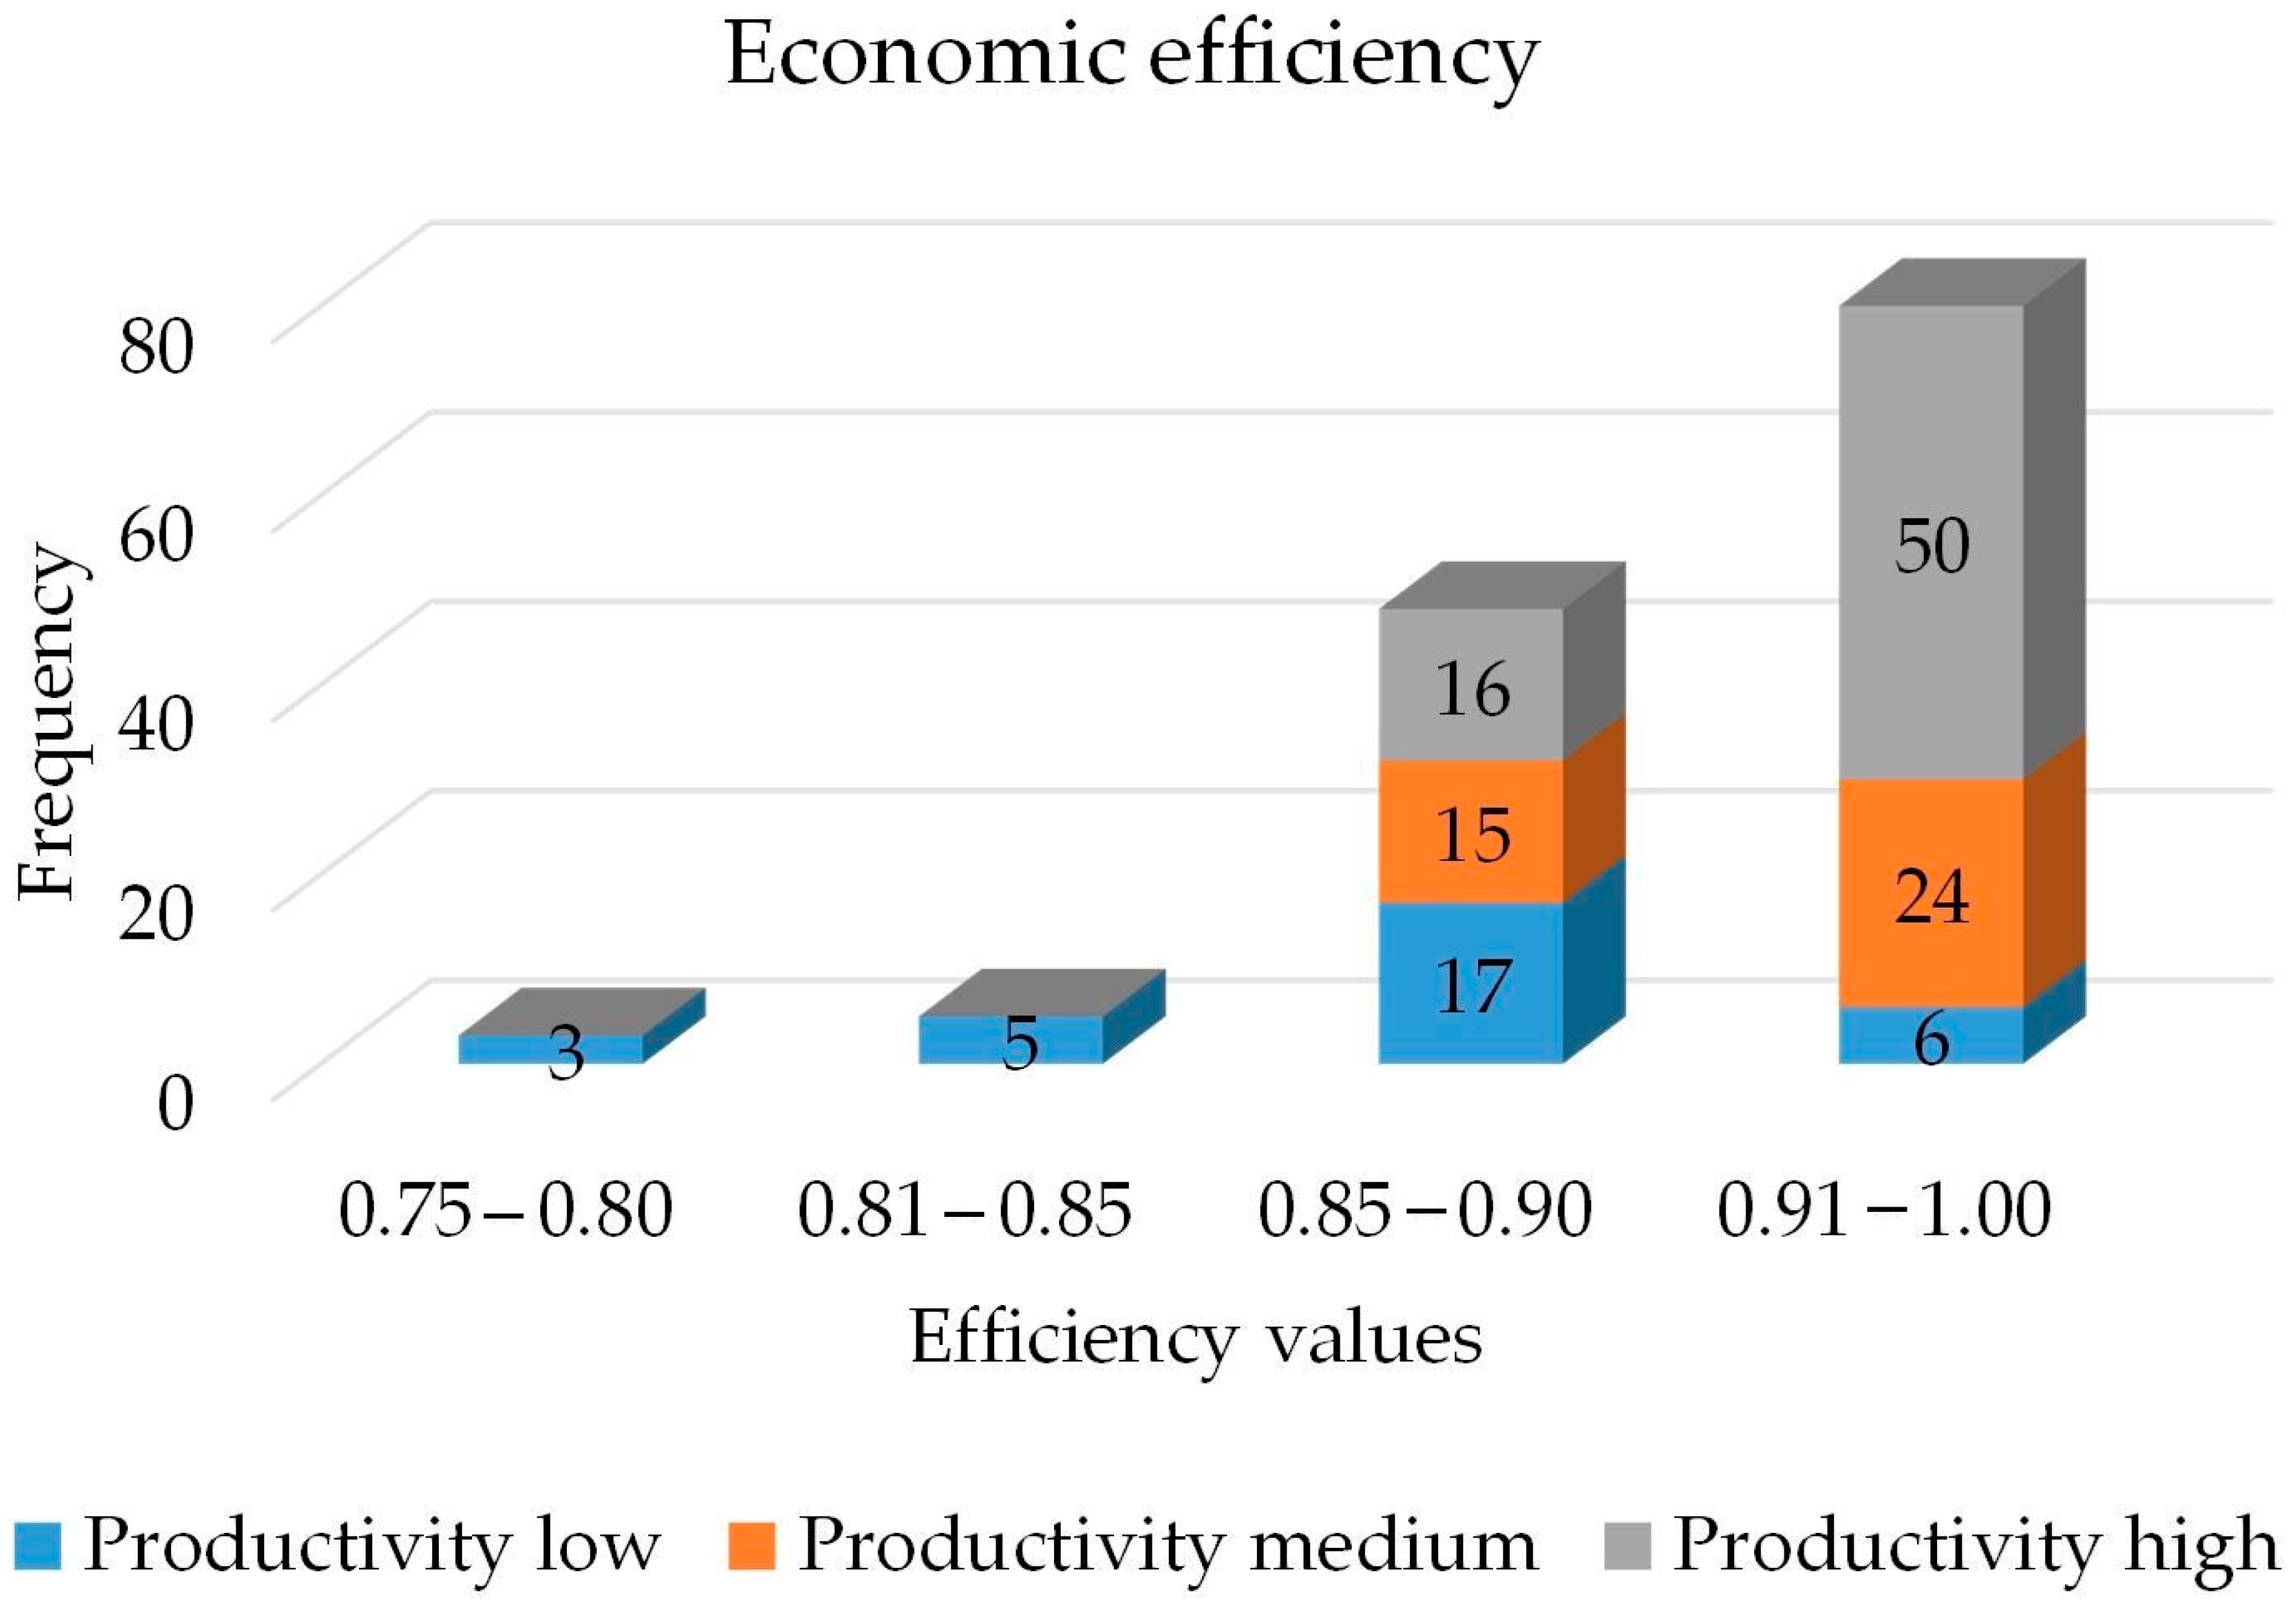
Economic Efficiency
4. Discussion
4.1. Classification of Producers by Level of Productivity
4.2. Efficiency Scores
4.3. Economic Efficiency and Productivity
4.3.1. Economic Efficiency Less Than 85%
- Characteristics of production systems. The average area of the farms established with resistant varieties was 82%, the average planting density was 5655 trees per hectare, the average age of the trees was 3.63 years, and the average percentage of area for renewed coffee (unproductive stage) was 16%.
- Resource allocation. The application of 807 kg of fertilizer per hectare per year stands out, an amount 32% lower than the application of the group of coffee growers with an efficiency greater than 90%, but at a cost greater than 21% due to their criteria for carrying out this work—mainly, the sources of fertilizer used and a greater fractionation (frequency) of application. The coffee growers grouped at this level of efficiency stated that they did not apply lime to adjust the acidity of the soil.
4.3.2. Economic Efficiency Greater Than 85% and Less Than 90%
- Characteristics of production systems. The average area sown with resistant varieties was 91%, the average planting density was 6615 trees per hectare, the average age of the trees was 3.65 years, and the average area for renewed coffee (vegetative growth) was 18%.
- Resource allocation. The coffee growers grouped at this level of economic efficiency applied 964 kg of fertilizer on average per hectare per year, mainly using fertilizers with a recommended grade for coffee cultivation and physical mixtures of urea, dap and KCl. They performed soil analysis every 2 years; based on these results, they corrected the acidity of the soils using dolomite lime. For renewal by sowing and replanting, they used plant material supplied by the Coffee Growers Committee (28%) and certified seed (72%) for the purpose of preparing the seedlings on their farms.
4.3.3. Economic Efficiency Greater Than 90%
- Characteristics of production systems. The following averages were found: established area with resistant varieties, 96%; average planting density, 6695 trees per hectare; average age of trees, 3.27 years; and average area for renewed coffee, 21%. These figures reflect production systems with a lower risk of coffee rust and greater productive potential due to their greater number of trees per hectare and the lower age of these trees, confirmed by production cycles defined in fifths due to their renovated area or in lift. In northern Rwanda (Ngango and Kim 2019), the use of resistant varieties mainly has a positive effect on the technical efficiency of coffee growers. The characteristics of this group with higher levels of productivity and efficiency coincide with the results of Araque Salazar and Duque (2019), i.e., maximum partial elasticities correspond to the variables coffee plantation density (trees/ha) and fertilization level (kg ha-year-1 of fertilizer). Likewise, crop age, the percentage of resistant varieties and the growing area are determinants of productivity for the group of coffee farms analyzed. The results for this group of efficient coffee growers coincide with the technical characteristics of small coffee growers in Vietnam who have developed sustainable coffee farming and for whom the renewal of crops and the use of resistant varieties and fertilization practices are fundamental in the productive performance and economic efficiency of their crops (Hung Anh et al. 2019).
- Resource allocation. This group presented the highest amounts of fertilizer (1067 kg), applied on average per hectare per year; however, its fertilization costs were 21% and 10% lower than those of the coffee growers with low and medium efficiencies, respectively. Fertilization decisions were based on the results of soil analysis and the recommendations of an extension service technician (79%). The application of fertilizer was divided into two applications during the year, and the sources used were mainly a mixture of urea, dap, KCl and formulas with degrees for the cultivation of coffee (78%). In the same sense, decisions on the execution of agronomic practices such as the renewal of coffee plantations, replanting, weed management, sanitary management, correction of soil acidity, and the opportunities to apply them, among this group of coffee growers were framed by technical recommendations.
4.4. Socioeconomic Characteristics and Resource Allocation
5. Conclusions
Supplementary Materials
Author Contributions
Funding
Informed Consent Statement
Data Availability Statement
Acknowledgments
Conflicts of Interest
References
- Ahearn, Mary Clare, Jet Yee, V. Eldon Bal, and Richard F. Nehring. 1998. Productividad Agrícola En Los Estados Unidos. Departamento de Agricultura de los Estados Unidos (USDA) > Servicio de Investigación Económica > Boletines de información agrícola. Available online: https://ageconsearch.umn.edu/record/33687/ (accessed on 5 June 2023).
- Aigner, Dennis, Lovell C. A. Knox, and Peter Schmidt. 1977. Formulation and Estimation of Stochastic Frontier Production Function Models. Journal of Econometrics 6: 21–37. [Google Scholar] [CrossRef]
- Araque Salazar, Humberto, and Hernando Duque. 2019. Variables agronómicas determinantes de la productividad del cultivo de café en fincas del departamento de Caldas. Revista Cenicafé 70: 81–92. [Google Scholar] [CrossRef]
- Battese, George E., and Tim J. Coelli. 1995. A Model for Technical Inefficiency Effects in a Stochastic Frontier Production Function for Panel Data. Empirical Economics 20: 325–32. [Google Scholar] [CrossRef]
- Belotti, Federico, Silvio Daidone, Giuseppe Ilardi, and Vincenzo Atella. 2013. Stochastic frontier analysis using Stata. The Stata Journal 13: 719–58. Available online: https://journals.sagepub.com/doi/abs/10.1177/1536867X1301300404 (accessed on 28 May 2023). [CrossRef]
- Bharathi, T., and Kripa Shanker Gupta. 2018. Job Stress and Productivity: A Conceptual Framework. International Journal of Emerging Research in Management and Technology 6: 393. [Google Scholar] [CrossRef]
- Charnes, Abraham, William W. Cooper, and Edwardo Rhodes. 1978. Measuring the Efficiency of Decision Making Units. European Journal of Operational Research 2: 429–44. [Google Scholar] [CrossRef]
- Coelli, Timothy J., D. S. Prasada Rao, Christopher J. O’Donell, and George E. Battese. 2005. An Introduction to Efficiency and Productivity Analysis, 2nd ed. New York: Springer. [Google Scholar] [CrossRef]
- Colman, David, and Trevor Young. 1989. Principles of Agricultural Economics: Markets and Prices in Less Developed Countries. Wye Studies in Agricultural and Rural Development. Cambridge and New York: Cambridge University Press. [Google Scholar]
- DANE, Departamento Administrativo Nacional de Estadística. 2023. IPC Actualización Metodológica 2019. May 2023. Available online: https://www.dane.gov.co/index.php/estadisticas-por-tema/precios-y-costos/indice-de-precios-al-consumidor-ipc/ipc-actualizacion-metodologica-2019 (accessed on 4 May 2023).
- De Janvry, Alain, Gregory Graff, Elisabeth Sadoulet, and David Zilberman. 2005. Technological Change in Agriculture and Poverty Reduction: The Potential Role of Biotechnology. In Agricultural Biodiversity and Biotechnology in Economic Development. Edited by Joseph Cooper, Leslie Marie Lipper and David Zilberman. Boston: Springer, pp. 361–86. [Google Scholar] [CrossRef]
- de Paula, Fabiana Aparecida, Dênis Cunha, Marcel Viana Pires, Thiago Costa, and A. L. R. Lima. 2014. Effect of Precipitation on the Technical Efficiency of Coffee Producers. Revista Espacios 35: 1–12. Available online: https://www.researchgate.net/publication/286153267_Effect_of_precipitation_on_the_technical_efficiency_of_coffee_producers (accessed on 30 May 2023).
- Doss, Cheryl R. 2018. Women and Agricultural Productivity: Reframing the Issues. Development Policy Review 36: 35–50. [Google Scholar] [CrossRef]
- Duque-Orrego, Hernando. 2018. La adopción de tecnologías agrícolas, bases para su comprensión. 1st ed. Vol. 1. 1 vols. Libros de los 80 años de Cenicafé. FNC-Cenicafé. Available online: https://www.cenicafe.org/es/index.php/nuestras_publicaciones/80_anos_cenicafe/P6 (accessed on 15 June 2023).
- Duque-Orrego, Hernando, Hugo Mauricio Salazar, Leonardo Alfonso Rojas-Sepúlveda, and Álvaro Gaitán. 2021. Análisis Económico de Tecnologías para la Producción de Café en Colombia. Cenicafé. Available online: https://www.cenicafe.org/es/index.php/nuestras_publicaciones/libros/publicaciones_analisis_economico_de_tecnologias_para_la_produccion_de_cafe (accessed on 7 May 2023).
- Ellis, Frank. 1993. Peasant Economics: Farm Households in Agrarian Development. New York: Cambridge University Press. [Google Scholar]
- Farrell, Michael James. 1957. The Measurement of Productive Efficiency. Journal of the Royal Statistical Society. Series A (General) 120: 253–90. [Google Scholar] [CrossRef]
- FNC, Federación Nacional de Cafeteros. 2023. Informe de Gestión Federación Nacional de Cafeteros 2022. Flipsnack. May 25. Available online: https://www.flipsnack.com/federaciondecafeteros/informe-de-gestion-2022.html (accessed on 20 June 2023).
- Freire, Adriano Higino, Renato Elias Fontes, Ricardo Pereira Reis, and Danielle Pedretti Morais Lima. 2012. Eficiência Econômica da Cafeicultura no sul de Minas Gerais: Uma Abordagem pela Análise Envoltória de Dados. Organizações Rurais & Agroindustriais 14: 60–75. [Google Scholar]
- Freire, Adriano Higino, Ricardo Pereira Reis, Renato Elias Fontes, and Ruben Delly Veiga. 2011. Economic Efficiency of Coffee in the South of Minas Gerais: One Application of Production Frontier. Coffee Science 6: 172–83. [Google Scholar]
- Green, William. 2005. Fixed and Random Effects in Stochastic Frontier Models. Journal of Productivity Analysis 23: 7–32. [Google Scholar] [CrossRef]
- Greene, William H. 2008. The Econometric Approach to Efficiency Analysis. In The Measurement of Productive Efficiency and Productivity Change. Edited by Harold O. Fried, C. A. Knox Lovell and Shelton S. Schmidt. Oxford: Oxford University Press. [Google Scholar] [CrossRef]
- Halunga, Andreea G., Chris D. Orme, and Takashi Yamagata. 2017. A heteroskedasticity robust Breusch–Pagan test for Contemporaneous correlation in dynamic panel data models. Journal of Econometrics 198: 209–30. [Google Scholar] [CrossRef]
- Ho, Thong, Viet-Ngu Hoang, and Clevo Wilson. 2022. Sustainability Certification and Water Efficiency in Coffee Farming: The Role of Irrigation Technologies. Resources Conservation and Recycling 180: 106175. [Google Scholar] [CrossRef]
- Hung Anh, Nguyen, Wolfgang Bokelmann, Do Thi Nga, and Nguyen Van Minh. 2019. Toward Sustainability or Efficiency: The Case of Smallholder Coffee Farmers in Vietnam. Economies 7: 66. [Google Scholar] [CrossRef]
- Leibenstein, Harvey. 1978. On the Basic Proposition of X-Efficiency Theory. The American Economic Review 68: 203–11. [Google Scholar]
- Meeusen, Wim, and Julien Van Den Broeck. 1977. Efficiency Estimation from Cobb-Douglas Production Functions with Composed Error. International Economic Review 18: 435. [Google Scholar] [CrossRef]
- Ngango, Jules, and Seung Gyu Kim. 2019. Assessment of Technical Efficiency and Its Potential Determinants among Small-Scale Coffee Farmers in Rwanda. Agriculture 9: 161. [Google Scholar] [CrossRef]
- Nurwantara, Ma’ruf Pambudi, Panji Deoranto, and Mas’ud Effendi. 2018. Productivity Analysis of Coffee Production Process with Objective Matrix (Omax) Method (The Case Study at PT. Perkebunan Kandangan, Pulosari Panggungsari, Madiun). SEAS (Sustainable Environment Agricultural Science) 2: 18–26. [Google Scholar] [CrossRef]
- Perdomo, Jorge Andrés, Darrell Hueth, and Juan Carlos Mendieta. 2007. Factores que afectan la eficiencia técnica en el Sector Cafetero Colombiano: Una aplicación con análisis envolvente de datos. Desarrollo y Sociedad 60: 1–45. Available online: https://federaciondecafeteros.org/static/files/4.Factoresafectaneficienciat%C3%A9cnicaSectorcafeterocolombiano.pdf (accessed on 5 October 2023).
- Poudel, Krishna Lal, Thomas G. Johnson, Naoyuki Yamamoto, Shriniwas Gautam, and Bhawani Mishra. 2015. Comparing Technical Efficiency of Organic and Conventional Coffee Farms in Rural Hill Region of Nepal Using Data Envelopment Analysis (DEA) Approach. Organic Agriculture 5: 263–75. [Google Scholar] [CrossRef]
- Siachoque, Ricardo Fabián, Claudia Liliana Cortés, Sebastian Polo, Gabriel Eduardo Páramo, Fabio Alexis Torres Angarita, Juan Antonio Gómez, and Luis Eduardo García. 2022. Cultivo Comercial de Café (Coffea Arábica L.), Identificación de Zonas Aptas En Colombia a Escala 1:100.000. Unidad de Planificación Rural Agropecuaria; Cenicafé. Available online: https://publicaciones.cenicafe.org/index.php/memorias/article/view/531/615 (accessed on 20 April 2023).
- Tingley, Diana, Sean Pascoe, and Louisa Coglan. 2005. Factors Affecting Technical Efficiency in Fisheries: Stochastic Production Frontier versus Data Envelopment Analysis Approaches. Fisheries Research 73: 363–76. [Google Scholar] [CrossRef]
- Tran, Duyen N., Tien D. Nguyen, Thuy T. Pham, Roberto F. Rañola, and Thinh A. Nguyen. 2021. Improving Irrigation Water Use Efficiency of Robusta Coffee (Coffea Canephora) Production in Lam Dong Province, Vietnam. Sustainability 13: 6603. [Google Scholar] [CrossRef]
- Villota, Washington Alfredo Camacho, Jennifer Mariel Barros Vera, Narcisa María Crespo Torres, and José Teodoro Mejía Viteri. 2020. Medición de la productividad en la actividad agrícola. Journal of Science and Research 5 (CICACI). Available online: https://revistas.utb.edu.ec/index.php/sr/article/view/1100 (accessed on 15 May 2023).

| Variable | Average | Standard Deviation | Maximum | Minimum |
|---|---|---|---|---|
| Unit cost | USD 1.44 | USD 0.22 | USD 2.32 | USD 1.17 |
| Productivity | 2585.75 kg cps | 1027.21 kg cps | 7785.63 kg cps | 438.5 kg cps |
| Crop renewal | USD 0.04 | USD 0.05 | USD 0.23 | USD 0.18 |
| Weed management | USD 0.10 | USD 0.05 | USD 0.56 | USD 0.01 |
| Fertilization | USD 0.20 | USD 0.09 | USD 0.82 | USD 0.05 |
| Pest control | USD 0.03 | USD 0.03 | USD 0.22 | USD 0.00 |
| Harvest | USD 0.69 | USD 0.10 | USD 1.27 | USD 0.47 |
| Postharvest | USD 0.08 | USD 0.04 | USD 0.58 | USD 0.00 |
| Administrative expenses | USD 0.16 | USD 0.12 | USD 0.66 | USD 0.01 |
| True Random-Effects Model (Half-Normal) Group Variable Farmer Code | Number of Obs = 952 Number of Groups = 136 | |||||
|---|---|---|---|---|---|---|
| Time variable: Year | Obs per group: | |||||
| Min = 7 | ||||||
| Avg = 7 | ||||||
| Max = 7 | ||||||
| Log-simulated likelihood = 1211.9535 | Prob > chi2 = 0.0000 | |||||
| Wald chi2(10) = 7295.21 | ||||||
| Number of Pseudo-Random Draws = 250 | ||||||
| LUnit cost | Coef. | Std. Err | z | P > |z| | [95% Conf. Interval] | |
| Frontier | ||||||
| LProductivity | −0.022411 | 0.0069812 | −3.21 | 0.001 | −0.0360939 | −0.0087282 |
| LCost harvest | 0.5777314 | 0.0169494 | 34.09 | 0.000 | 0.5445112 | 0.6109517 |
| LCost postharvest | 0.0271037 | 0.0038555 | 7.03 | 0.000 | 0.019547 | 0.0346604 |
| LCost fertilization | 0.1625467 | 0.0067318 | 24.15 | 0.000 | 0.1493526 | 0.1757409 |
| LCost pest control | 0.0016984 | 0.0004773 | 3.56 | 0.001 | 0.0007629 | 0.0026339 |
| LCost crop renewal | 0.0086642 | 0.0006207 | 13.96 | 0.000 | 0.0074477 | 0.0098808 |
| LCost weed management | 0.0816932 | 0.0052962 | 15.42 | 0.000 | 0.0713128 | 0.0920735 |
| LAdministrative expenses | 0.1159822 | 0.0047837 | 24.25 | 0.000 | 0.1066064 | 0.125358 |
| Aptitude | −0.0002715 | 0.0079998 | −0.03 | 0.973 | −0.0159508 | 0.0154078 |
| Scale | 0.0196376 | 0.0041571 | 4.72 | 0.000 | −0.0408214 | 0.0234594 |
| _cons | 1.636146 | 0.1867383 | 8.76 | 0.000 | 1.741275 | 2.726517 |
| Usigma _cons | −4.397366 | 0.0678828 | −64.78 | 0.000 | −4.530414 | −4.264318 |
| Vsigma _cons | −7.87959 | 0.3001687 | −26.25 | 0.000 | −8.46791 | −7.29127 |
| Theta _cons | 0.236709 | 0.002594 | 9.13 | 0.000 | 0.0185868 | 0.0287551 |
| Sigma_u | 0.1109492 | 0.0037658 | 29.46 | 0.000 | 0.1038086 | 0.118581 |
| Sigma_v | 0.0194522 | 0.0029195 | 6.66 | 0.000 | 0.014495 | 0.0261048 |
| lambda | 5.703683 | 0.0058315 | 978.09 | 0.000 | 5.692253 | 5.715112 |
| True Random-Effects Model (Exponential) Group Variable Farmer Code | Number of Obs = 952 Number of Groups = 136 | |||||
|---|---|---|---|---|---|---|
| Time variable: Year | Obs per group: | |||||
| Min = 7 | ||||||
| Avg = 7 | ||||||
| Max = 7 | ||||||
| Log-simulated likelihood = 1248.6408 | Prob > chi2 = 0.0000 | |||||
| Wald chi2(10) = 7982.28 | ||||||
| Number of Pseudo-Random Draws = 250 | ||||||
| LUnit cost | Coef. | Std. Err | z | P > |z| | [95% Conf. Interval] | |
| Frontier | ||||||
| LProductivity | −0.0240747 | 0.0063699 | −3.78 | 0.000 | −0.0365594 | −0.0115899 |
| LCost harvest | 0.5760682 | 0.0157167 | 36.65 | 0.000 | 0.5452641 | 0.6068724 |
| LCost postharvest | 0.055658 | 0.0052729 | 10.56 | 0.000 | 0.0453233 | 0.0659926 |
| LCost fertilization | 0.1639617 | 0.0062411 | 26.27 | 0.000 | 0.1517294 | 0.176194 |
| LCost pest control | 0.0018981 | 0.0004255 | 4.46 | 0.000 | 0.0010641 | 0.0027321 |
| LCost crop renewal | 0.0078804 | 0.0004956 | 15.90 | 0.000 | 0.006909 | 0.0088517 |
| LCost weed management | 0.0772404 | 0.0050419 | 15.32 | 0.000 | 0.0673585 | 0.0871223 |
| LAdministrative expenses | 0.1102238 | 0.0045316 | 24.32 | 0.000 | 0.101342 | 0.1191056 |
| Aptitude | −0.0006008 | 0.0074631 | −0.08 | 0.936 | −0.0152283 | 0.0140266 |
| Scale | 0.0168867 | 0.0037464 | 4.51 | 0.000 | 0.0095438 | 0.0242295 |
| _cons | 1.532464 | 0.1735522 | 8.83 | 0.000 | 1.192308 | 1.872621 |
| Usigma _cons | −5.36782 | 0.09581 | −56.03 | 0.000 | −5.555604 | −5.180036 |
| Vsigma _cons | −7.354975 | 0.1740003 | −42.27 | 0.000 | −7.696009 | −7.013941 |
| Theta _cons | −0.0222747 | 0.0023655 | −9.42 | 0.000 | −0.0269111 | −0.0176383 |
| Sigma_u | 0.0682956 | 0.0032717 | 20.87 | 0.000 | 0.062175 | 0.0750187 |
| Sigma_v | 0.0252864 | 0.0021999 | 11.49 | 0.000 | 0.0213222 | 0.0299876 |
| lambda | 2.700879 | 0.0047524 | 568.32 | 0.000 | 2.691565 | 2.710194 |
| Classes | Frequency | % | % Accumulated | |
|---|---|---|---|---|
| 0.75–0.80 | 3 | 2% | 2% | |
| 0.81–0.85 | 5 | 4% | 6% | |
| 0.85–0.90 | 48 | 35% | 41% | |
| 0.91–1.00 | 80 | 59% | 100% | |
| Average | Median | Standard deviation | Minimum | Maximum |
| 0.8969 | 0.9052 | 0.3036 | 0.7724 | 0.9464 |
Disclaimer/Publisher’s Note: The statements, opinions and data contained in all publications are solely those of the individual author(s) and contributor(s) and not of MDPI and/or the editor(s). MDPI and/or the editor(s) disclaim responsibility for any injury to people or property resulting from any ideas, methods, instructions or products referred to in the content. |
© 2023 by the authors. Licensee MDPI, Basel, Switzerland. This article is an open access article distributed under the terms and conditions of the Creative Commons Attribution (CC BY) license (https://creativecommons.org/licenses/by/4.0/).
Share and Cite
Salazar Echeverry, H.M.; Duque Orrego, H.; Granobles-Torres, J.C. The Economic Efficiency of Coffee Growers in the Department of Caldas, Colombia. Economies 2023, 11, 255. https://doi.org/10.3390/economies11100255
Salazar Echeverry HM, Duque Orrego H, Granobles-Torres JC. The Economic Efficiency of Coffee Growers in the Department of Caldas, Colombia. Economies. 2023; 11(10):255. https://doi.org/10.3390/economies11100255
Chicago/Turabian StyleSalazar Echeverry, Hugo Mauricio, Hernando Duque Orrego, and Juan Carlos Granobles-Torres. 2023. "The Economic Efficiency of Coffee Growers in the Department of Caldas, Colombia" Economies 11, no. 10: 255. https://doi.org/10.3390/economies11100255