Abstract
This study aims to investigate the influence of digital financial inclusion on China’s urban–rural income disparity. A comparative analysis on income differences between western and eastern regions in China was conducted in this paper. The study utilized a static panel approach as it consisted of 22 provinces in China that covered the period from 2011 to 2020. This paper employs Stata software for the data analysis. The dependent variable of this study is the urban–rural income gap. Meanwhile, the independent variables consist of the total index level, breadth of coverage, depth of use, degree of digitization, digital payment level, digital insurance level, and digital credit level. The control variables employed in this article are education level, financial support, economic transformation, technological progress, and trade openness. The empirical outcomes indicate that the seven independent variables potentially minimize the urban–rural income gap between the two regions. However, digital financial inclusion appears to have a more significant effect in lessening the urban–rural gap in the western region compared to the eastern region in China. The findings demonstrate that all the variables exhibit a higher degree of influence on the urban–rural income differences in the west than in the east, except for the credit index. The outcome reveals that the effect of the credit index in the western region (0.10%) is slightly lower than the eastern region (0.11%). In general, the present findings can provide valuable insights for policy makers in their efforts to address the urban–rural income gap in the two regions through the implementation of digital financial inclusion initiatives. The study should be conducted regularly to observe the trend of the income disparities between the western and eastern regions in China. Future studies can also focus on other regions or narrow the focus to provincial and city levels to capture more detailed information.
1. Introduction
As early as December 2003, the United Nations raised the concept of financial inclusion and proposed that financial services should benefit all groups, especially vulnerable groups, in a more just and distributive way. In 2005, China began to use the concept of financial inclusion (Asian Development Bank Institute 2014). In 2015, financial inclusion was officially included in China’s national development strategy.
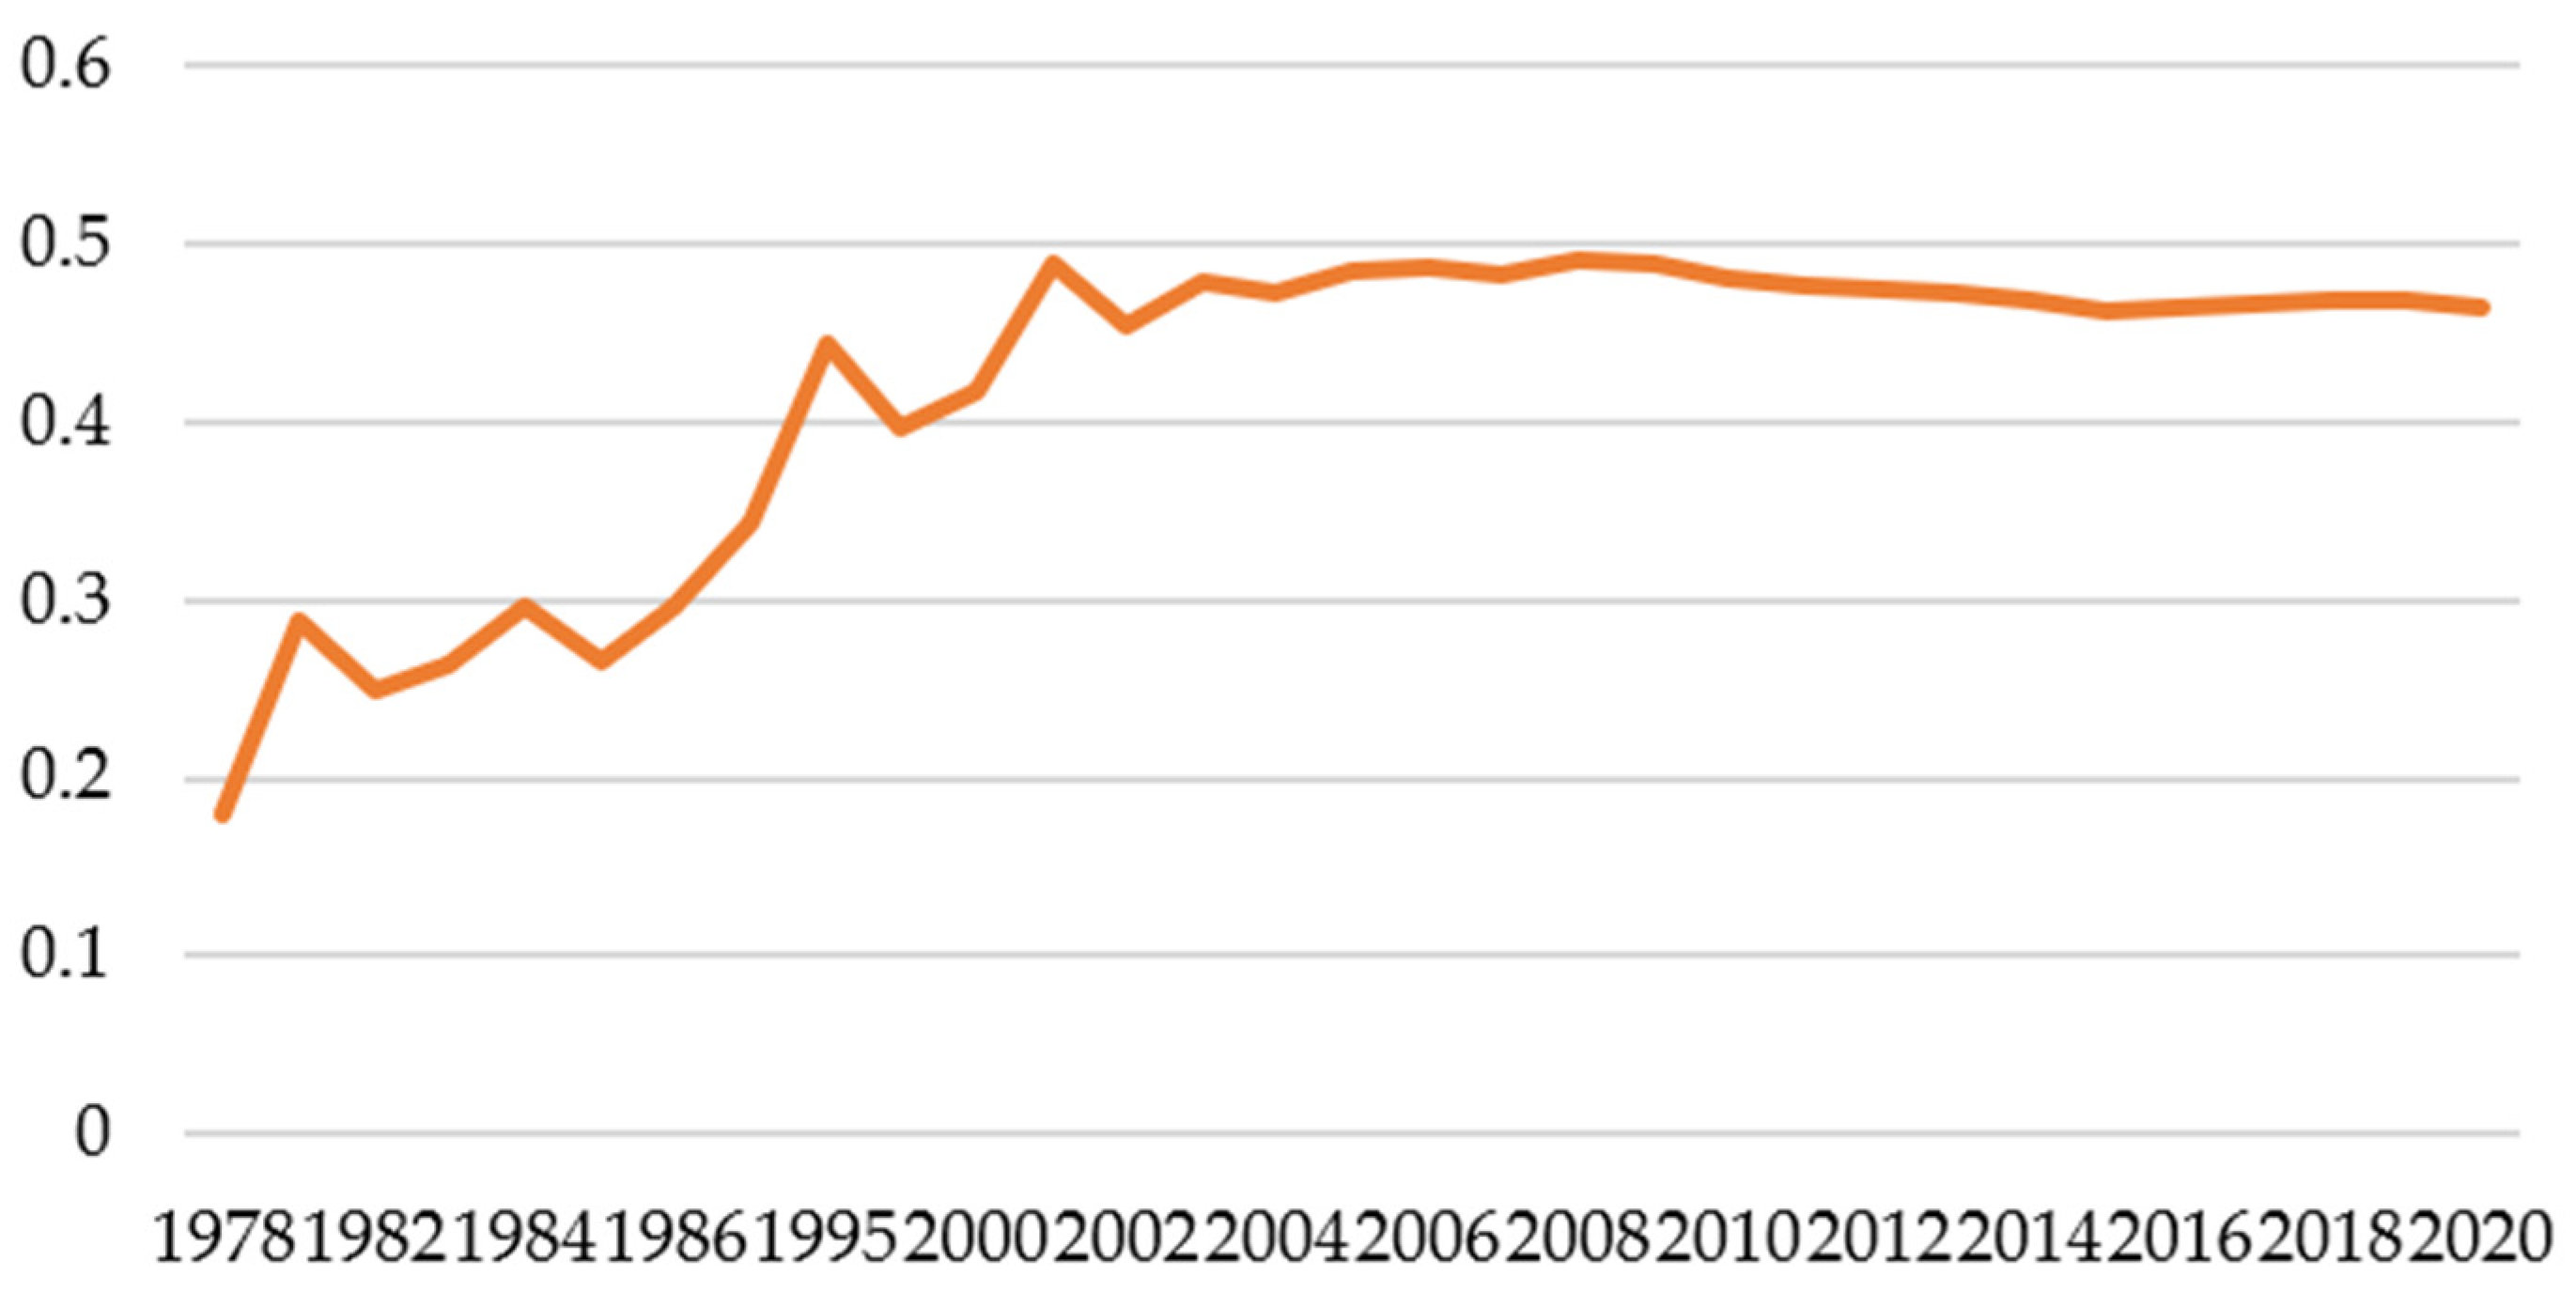
The Gini coefficient ranges from 0 to 1. A numerical value that approaches 1 expresses a wider income gap, and a numerical value that approaches 0 shows higher income equality. The United Nations Development Programme stated that if the Gini coefficient of a country exceeds 0.4, it indicates that the country’s income gap is serious, and the country needs to take urgent action to address this gap. Figure 1 shows the Gini coefficient in China from 1978 to 2020. In 1995, China’s Gini coefficient rose to 0.445 for the first time. Beyond the warning line of 0.4, the income gap starts to become a problem that must receive great attention in the evolution of China’s economic growth. Since the beginning of the 21st century, China’s economy has taken off, but income disparity still remains high. In 2008, it reached a peak of 0.491, which is close to the point where the income gap is particularly large. In 2020, the Gini coefficient scored as high as 0.465, indicating that income disparity in that year was very large. Therefore, China urgently needs to address this excessive income disparity.
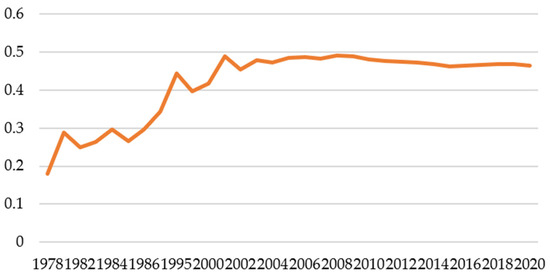
Figure 1.
Overview of Gini coefficient of China, 1978–2020.
The widening of the income gap between urban and rural areas poses a significant challenge to China’s sustainable economic development. The regional economic development imbalance is particularly pronounced, with a noticeable “dual structure” phenomenon in the financial system and a severe problem of financial exclusion. In China, there are four major economic parts: eastern, western, central, and northeastern. The eastern area consists of 10 provinces, while the western region comprises 12 provinces (as shown in Table 1). These two economic zones, the eastern and western parts, are the largest in the country. However, there is a considerable disparity in their levels of economic development, with the western region lagging behind the eastern region due to geographical factors. Generally, residents in the eastern areas have higher incomes as compared to those in the western areas, and the income disparity is relatively higher in the western region. Therefore, it is crucial to examine the differences and similarities in the influence of digital inclusive finance on income disparity among these two regions. This paper aims to address this key question and provides insights into the dynamics of income disparity and digital financial inclusion in the eastern and western regions of China. This study will contribute to the existing literature because there are a limited number of comparative studies examining the impacts of financial inclusion on the urban–rural income disparity by regions in China. Additionally, the results of the present study can serve as a guideline for the government to reduce the income gap and promote balanced economic growth in the long term.

Table 1.
China’s four major economic regions.
This paper is organized as follows. Section 2 reviews the existing literature that is related to present study. Section 3 discusses the methodology employed. The results and discussion are presented in Section 4 and Section 5, respectively. Lastly, the paper concludes with policy implications and suggestions for future research directions.
2. Literature Review
2.1. Theoretical Review
The theory of financial exclusion was first demonstrated by Leyshon and Thrift (1995) in the United States. This theory refers mainly to the situation in which socially vulnerable groups are excluded from financial institutions and cannot obtain financial services because they occupy a much lower level than the average level in society, and experience poverty in economy, life, body, or family (Leyshon and Thrift 1995). Kempson and Whyley (1999) proposed six dimensions of financial exclusion: physical access, assessing, condition, price, marketing, and self-exclusion. In China, there is a considerable overlap between appraisal exclusion and conditional exclusion. At the same time, the effect of self-exclusion is small. Therefore, China’s rural financial exclusion is condensed into four dimensions: physical access exclusion, conditional exclusion, price exclusion, and marketing exclusion (Tan 2021).
During the phases of industrialization and urbanization, the agricultural sector plays a crucial role in providing substantial resources for industrial development in China. However, development in rural areas has been hindered due to an overemphasis on the social development of urban areas. Additionally, the strict household registration system impedes the movement of people between the urban and rural areas and causes a dual economic structure, thus widening the income gap (Li et al. 2015; Liu et al. 2013). Sun (2012) strongly believed that the relaxation of the dual economic structure between rural and urban areas will narrow the income gap. The distribution of financial resources determines the income gap. When financial resources mainly flow into urban areas, the income gap expands, and vice versa. Banerjee and Newman (1993) believe that financial development enables more people to access financial services, providing rural residents with increased economic opportunities and, consequently, reducing the income gap between rural and urban areas.
The phenomenon of financial exclusion is particularly obvious in China’s rural areas, and financial exclusion in the central and western zones is more serious than that in the eastern zone (Wang et al. 2013; Zhang et al. 2014). Consistent with this finding, Panigyrakis et al. (2002) have stated that financial exclusion generally occurs in remote areas with low-income levels and underdeveloped economies. At the same time, Wang et al. (2013) found that farmers in China suffered more serious financial exclusion in credit than in savings. Through micro-data research, Su and Fang (2016) found that in China’s rural areas, banking and insurance exclusion are more serious in the central region, while Internet finance exclusion is more common in the western region. Zhang and Yin (2016) applied the data of the 2013 Chinese Household Finance Survey (CHFS) to conduct an empirical study. Their results show that an increase in household financial knowledge can effectively alleviate the problem of financial exclusion in the process of obtaining financial services.
Li (2020) believes that China should alleviate the issue of financial exclusion by developing inclusive finance in all regions. Ding and Zhou (2022) found that financial agglomeration can reduce the negative effect of financial exclusion on economic development to a definite level. Glendinning and Kemp (2006) highlighted several reasons for financial exclusion. Firstly, the lack of collateral in the majority of rural families makes it difficult for them to obtain loans from banks. Secondly, low-income groups generally have low credit ratings, and their minimal income levels also restrict them from obtaining bank loans. Thirdly, financial institutions tend to charge them higher interest rates due to their low credit profiles. Consequently, these factors make them more susceptible to falling into a “financial service trap”.
Digital financial inclusion plays a crucial part in dilating admittance to obtain capital by leveraging the Internet and information technology. By doing so, it can address the issue of financial exclusion and contribute to lessen the relative disparity of income between town and countryside areas. Sarma and Pais (2011) and Li and Ma (2021) claimed that digital financial inclusion has the potential to significantly reduce financial exclusion and stimulate economic growth in rural areas. Digital financial inclusion can lower transaction costs, save time, and reduce information expenses, which, in turn, enhances the trust of rural residents in financial institutions and expedites their income growth.
The Institute of Digital Finance, Peking University has developed the Digital Financial Inclusion Index, which includes three levels. The first level is the overall index, followed by the coverage breadth, use depth, and degree of digitalization in the second level. Within the degree of digitalization, this study focuses on three specific indexes: digital payment index, insurance index, and credit index. Additionally, considering the relatively weaker economic advance of the western compared to the eastern region, hypothesis 1 is formulated.
H1:
The impact of the total index of digital financial inclusion on urban–rural income disparity in the western is weaker than that in eastern part of China.
2.2. The Mechanism and Regional Differences of Digital Financial Inclusion Impacts on Earning Disparity
The existing literature has highlighted the potential of digital financial inclusion in China to address the significant earning gap among countryside and urban populations (Chen and Bai 2021; Tao et al. 2021; Yan 2022; Zhang 2022; Zhuang 2021). Numerous analyses have probed the impact of digital financial inclusion on earning disparity in various economic zones of China. For instance, a study conducted in the province of Shandong demonstrated that digital financial inclusion can effectively lessen income disparity between urban and rural areas (Liu and Wang 2019). These findings suggest that the implementation of digital financial inclusion measures have the potential to mitigate income inequality in specific regions like the province of Shandong. They further pointed out that this is possible only when financial inclusion development initiatives reach a certain level, based on the law of diminishing margins. Similarly, Li and Fan (2022) found that income disparity between rural and urban areas can be reduced by implementing digital financial inclusion measures in the province of Sichuan and Chongqing city, China. By analyzing panel data of China’s western economic zone, Tong and Cao (2018) found that the availability and usability of inclusive digital financial services can effectively narrow income disparity. Through an empirical study of the data of seven provinces in East China, Ye (2016) proposed that the better the standard of economic growth is, the greater the standard of income distance. He also suggested that the growth of digital inclusive finance can play a vital role in decreasing income disparity. In general, digital financial inclusion can minimize income disparity, but its effect differs for different regions.
Considering the second level indicators, it is necessary to prioritize the development of coverage and break the financial exclusion problem. Following this, it is important to further develop inclusive financial products that are more suitable for rural areas. Ji et al. (2021) stated that digital financial service coverage is proportionate to the level of development of digital financial inclusion. The greater the breadth of development, the more people will be included in the coverage. On this basis, digital business needs to rely on advanced Internet technology and the development of coverage breadth and use depth. Digital technology and the Internet make financial services more inclusive than traditional finance, extending its reach to a wider range of people. Unlike digital banking, traditional finance is relatively limited to specific business activities like deposits, loans, and settlements (Li et al. 2022). It is believed that reliable internet connectivity can promote economic growth and alleviate poverty in rural areas. We believe that coverage breadth, application depth, and digitalization degree can alleviate the problem of excessive urban–rural income disparity to a certain extent. However, due to the development of the Internet and information technology, the western part of China lags behind the eastern part. Therefore, this paper proposes hypotheses 2, 3, and 4.
H2:
The extent of the coverage in western China has a weaker impact on urban–rural income disparity than that in eastern China.
H3:
The impact of the depth of urban–rural earning disparity in western China is weaker than that in eastern China.
H4:
The degree of digitalization in western China has a weaker impact on urban–rural income disparity than that in eastern China.
Moreover, recent studies have indicated the positive function of digital financial inclusion on decreasing the disparity and enhancing residents’ consumption levels. For instance, Li and Cui (2022) observed that digital inclusive finance effectively improves residents’ consumption levels by decreasing the income disparity. Similarly, Chu and Sun (2022) suggested that digital financial inclusion enhances the consumption levels of rural areas in China. A significant income gap has been identified by observing residents’ consumption in Beijing, Tianjin, and Hebei, between families with access to inclusive finance and those without access (Yin et al. 2017). Furthermore, Zou and Wang (2020) discovered that the credit index, insurance index, and payment index within digital inclusive finance contribute to improving citizens’ consumption levels. Notably, they highlighted that the effect of digital financial inclusion on income disparity is more pronounced in the western zone as compared to the eastern zone. Similarly, Jiang and Jiang (2020) and Zhang and Cai (2021) established that digital financial inclusion plays a pivotal part in decreasing urban–rural earning disparity, and subsequently stimulates people’s consumption levels. This enhancement in consumption levels can further fuel economic development.
Due to the digital economy development level and consumption level of the western region being far behind the eastern region, the number of western residents using digital payment is less than the eastern region; insurance consciousness and the concept of online lending are also weaker among residents in the west as compared to that of the east. Digital pay levels, the number of insurance businesses, and the degree of digital credit business development are weaker in the west than in the east. Based on these findings, hypotheses 5, 6, and 7 are proposed.
H5:
The impact of the payment index on urban–rural income disparity in western China is weaker than that in eastern China.
H6:
The impact of the insurance index on urban–rural earning disparity in western China is weaker than that in eastern China.
H7:
The impact of the credit index on urban–rural income disparity in western China is weaker than that in eastern China.
To summarize, financial exclusion poses a significant challenge for rural residents in accessing financial services. This limitation hampers efforts to improve income levels and develop the rural economy, consequently contributing to a substantial urban–rural inequality in China. However, the expansion of digital inclusive finance offers a potential solution by addressing financial exclusion and providing rural residents with access to financial services. Through digital financial inclusion, rural residents can benefit from increased income, leading to a reduction in the urban–rural income disparity. As a result, financial inclusion not only enhances the consumption levels of rural areas but also stimulates economic growth within these regions.
3. Research Methodology
The aim of this article is to explore the influence of digital financial inclusion on the urban–rural income disparity between both the regions. Additionally, this study will conduct a comparative analysis to assess the differential effects of digital financial inclusion in these two regions. By doing so, a comprehensive understanding of the function of digital financial inclusion in addressing the urban–rural gap can be obtained, while also shedding light on potential regional variations in its effectiveness.
3.1. Variable Definition and Data Selection
In this study, the calculation of income disparity utilizes the Theil index. To ensure accuracy, all income data considered in the calculation process are adjusted for the effect of inflation, thereby reflecting the real income level. The measurement of the inflation rate is based on the Consumer Price Index (CPI).
Among them, Theil is the dependent variable, and stands for the urban–rural income disparity, is the urban area, is the rural area, P indicates real income, refers to nominal income, Z stands for population, t is time, and CPI refers to consumer price index. Therefore, is the real income level in the urban area during period t, and is the population of the town in period t. is the real income level in the rural district during period t, and is the population of rural residents in period t. is the total real income level of national residents in period t, and is the total population of the country in period t. The data of the dependent variable were gathered mainly from the China Statistical Yearbook.
In this study, seven independent variables have been selected for analysis: the total index, breadth of coverage, depth of usage, degree of digitalization, digital standard of the payment index, insurance index, and credit index. The data for these independent variables were obtained from the Digital Financial Inclusion Index, ensuring the reliability and consistency of the data used in the study.
There are five control variables. First, we use the average amount of students enrolled in higher education per 100,000 people in a region (logarithm) to measure residents’ education level. Second, the sum of regional expenditure on agriculture, forestry, and water resources divided by gross regional product is used to calculate the level of financial support. Third, the value-added of tertiary industry divided by GDP is used to measure economic transformation. Fourth, expenditure on research and development (R&D) divided by GDP is used to calculate technological progress. Fifth, the degree of opening-up is assessed by dividing the import and export volume by regional GDP. The data for the control variables, including the degree of opening-up, were primarily collected from the China Statistical Yearbook. By utilizing this comprehensive and reliable data source, the study ensures the accuracy and validity of the control variables used in the analysis.
3.2. Model Setting
To determine the influence of digital financial inclusion on urban–rural disparity in both regions, seven empirical models (Models 3–9) were developed. This study encompassed 22 provinces in China, consisting of 10 provinces from the eastern region and 12 provinces from the western region. The data covered the period from 2011 to 2020. Thus, balanced panel data are utilized in this study. To conduct the data analysis, Stata software was employed, ensuring robust and accurate results. Previous studies, which utilized panel data to analyze the urban–rural income gap using financial inclusion, were identified in Liu and Wang (2019), Tong and Cao (2018), and Zhang and Cai (2021).
where represents urban–rural income disparity, and and denote the region and time, respectively. denotes the total index level. is the breadth of coverage. refers to the depth of use. represents the degree of digitalization. represents the digital payment level. represents the digital insurance level. represents the digital credit level. are the control variables. is the random interference term. The others are constants.
4. Results
The empirical results of seven different models, as presented in Table 2, aim to identify the elements influencing the urban–rural income disparity in the eastern and western regions. The F-statistics indicate that all seven models are statistically significant at the 1% level, suggesting that pooling the data together is appropriate for this study. To determine the preferable estimation model between the POLS model and the RE model, the Breusch–Pagan LM test was employed. The empirical findings indicate that all the models are significant at the 1% level, leading to the rejection of the POLS null hypothesis. Furthermore, the Hausman test was conducted to determine the most suitable model for this study between the RE and FE models. The empirical results demonstrate that the FE model is the most appropriate, as the Hausman test is significant at the 1% level.
Table 2.
Empirical results of the eastern economic zone in China.
Diagnostic tests were carried out after the POLS, RE or FE model was determined. The empirical results show that there is no multicollinearity problem. However, the results reveal that there are heteroscedasticity and serial correlation problems. These problems were corrected using panel-corrected standard errors. After correcting these problems, the final FE model for the eastern data was generated, as shown in Table 2. Next, the relevant data for China’s western economic zone was imported into Stata software. The specific process and steps were the same as those used for the eastern data. The final FE model for the western data is shown in Table 3.
Table 3.
Empirical results of the western economic zone in China.
The empirical findings regarding the influence of digital financial inclusion in the eastern zone are presented in Table 2. The results reveal an inverse relationship between the total index and the urban–rural income gap. Specifically, a 1% increase in the total index leads to a reduction in income disparity by 0.09%. Among the second-dimension indicators within the total index, the breadth of coverage exhibits a negative correlation with income disparity, which is in line with the studies of Ji et al. (2021), Shen et al. (2023), and Liu et al. (2023). A rise of 1% in the breadth of coverage corresponds to a decrease in income disparity by 0.09%, while a decrease in coverage results in an increase in income disparity.
Second, the finding that the depth of use can effectively reduce income disparity was also reported in Shen et al. (2023) and Li et al. (2023). An increase in depth of use by 1% will decrease income disparity by 0.08%. However, this outcome is contrary to that reported by Ji et al. (2021), who found that the depth of use can increase the income gap, but it is insignificant. Third, the degree of digitalization has an adverse effect on urban and rural income disparity. This finding is similar to those reported by Ji et al. (2021), Shen et al. (2023), and Li et al. (2023). Every 1% increase in the degree of digitalization will reduce the disparity by 0.03%. Therefore, the degree of digitalization has a weaker effect on income disparity in eastern China than the extent of breadth of coverage and depth of use. These findings are in line with the study of Shen et al. (2023); they also figured out that the breadth of coverage and depth of use have more pronounced impacts than digitalization in reducing the income gaps between the rural and urban areas in China. In addition, Ji et al. (2021) found a contradictory finding with the present study; their results revealed that the degree of digitalization has no significant influence on the urban–rural income gap. Their outcomes indicated that expanding the coverage of digital financial inclusion services is one of the main indicators in minimizing the urban–rural income gap.
Among the three-dimensional indicators subordinate to the digitalization degree, first, the payment index can effectively minimize the income gap. A change in the payment index of 1% will shift the disparity by 0.09% in the opposite direction. Ji et al. (2021) found a similar finding for the case of China. In addition, the insurance index has a negative influence on the urban–rural income disparity. If the insurance index increases by 1%, the income disparity will be reduced by 0.04%. So, it is suggested to provide regulatory insurance for the development of digital financial inclusion initiatives. Furthermore, the credit index is negatively correlated with income disparity. If the credit index increases or decreases by 1%, the disparity will be adjusted in the opposite direction by 0.11%.
Notably, among the control variables, it is important to highlight that economic transformation and the degree of opening have the potential to alleviate income disparity in the eastern region of China. Additionally, education level is another significant control variable in minimizing the income gap, which is in line with the findings of Su and Fang (2016), Ji et al. (2021), and Liu et al. (2023). Education level, in particular, makes the most significant contribution towards decreasing the income disparity. Education is important to help people use digital financial services effectively and securely. In addition, Liu et al. (2023) reported that education level may change the attitudes of customers, and thus it has a significant impact on poverty reduction. Ji et al. (2021) also claim that education level can improve the skill level of citizens and thus increase their competitiveness and income levels. However, it is observed that the development of financial support for agricultural and technological progress has the opposite effect, widening income disparity. This outcome may be attributed to insufficient financial support for agriculture, which fails to adequately meet the needs of rural residents. Additionally, there is a lag in the construction of public infrastructure in rural areas compared to urban areas. Moreover, a significant portion of scientific research funds is predominantly invested in urban areas, resulting in a technological development gap between rural and urban regions. It is important to note that the influence of technological progress on income disparity may not consistently demonstrate significance across all cases.
Table 3 presents the outcomes on the effect of digital inclusive finance on urban–rural disparity in China’s western economic zone. For the western part of China, the first-, second-, and third-dimension variables have similar impacts with the eastern part of China. All variables in these three dimensions are significant, with adverse impacts in both regions. These outcomes indicate that all seven variables are crucial indicators for reducing the income gap between rural and urban areas in eastern and western parts of China. The empirical results reveal a negative relationship between the total index and urban–rural income gap. Specifically, a 1% rise in the total index generates a decrease in income disparity by 0.15%. Among the second-dimension indicators within the total index, the breadth of coverage exhibits an adverse influence on income disparity. The breadth of coverage increases or decreases by 1%, and the disparity is adjusted in the opposite direction by 0.12%.
In addition, the depth of use can effectively decrease income disparity. A 1% change in depth of use will shift the disparity by 0.14% in the opposite direction. Furthermore, the degree of digitalization is negatively correlated with income disparity. A 1% increase in the degree of digitalization will reduce the disparity by 0.11%. In a nutshell, similar findings are detected in both eastern and western regions; the outcomes evidenced that the impact of digitalization is weaker than the breadth and depth of use in both regions. Ji et al. (2021) also conducted a similar study for the case of China; their findings also revealed that breadth and depth of use have more profound implications in reducing the income gap than the degree of digitalization.
Among the three-dimensional indicators subordinate to the degree of digitalization, first, the payment index can effectively mitigate the income disparity. A change of 1% in the payment index will shift the disparity by 0.14% in the opposite direction. Additionally, both the insurance index and credit index have similar impacts on urban–rural income disparity in the western economic zone of China. Both variables are significant at the 1% level and negatively correlated with the income disparity. The outcomes revealed that a 1% increase in the insurance index and credit index will reduce the income gap by 0.10%, respectively.
It is worth noting that among the control variables, education level and economic transition have no significant effect on income disparity. One possible reason is that educational development in the western region is lagging and the establishment of strong digital financial inclusion requires high education levels. Only technological progress has a negative influence on the urban–rural income gap, which is in line with the findings of Li et al. (2023). These authors claim that the development of technology widens the urban–rural income gap, which is likely due to the fact that digital financial inclusion is currently only “spreading” among society but has yet to “benefit” communities. The level of financial support for agriculture and the degree of opening-up will widen the income gap. This is likely because rural construction in western China lags behind other areas in China, and the amount of funding and support for agriculture is insufficient. Older or less-educated people in some remote parts of the west cannot use electronic devices to access capital. The western district is located in the interior and lags behind other regions in terms of opening-up and development.
5. Discussion
A comprehensive comparative analysis reveals that the growth of digital inclusive finance in both economic zones contributes to the decrease of the urban–rural income gap in these regions. However, the influence of digital inclusive finance on decreasing disparity is more pronounced in the west than in the east. This disparity can be attributed to the lagging economic development and lower income levels in western China as compared to eastern China. As a result, there is a greater potential for decreasing income disparity in the west, and the progress of digital inclusive finance in western China plays a vital role in decreasing the urban–rural divide. The results from the seven models indicate that the influence of all the variables in the western region is higher than that in the eastern region in Models 1 to 6. Therefore, Hypotheses 1 to 6 are contradictory. However, in the case of the credit index, the effect of the western district (0.10%) is lesser than that of the eastern district (0.11%). This discrepancy can be attributed to the comparatively smaller growth of digital credit in the western area. Additionally, the degree of digital credit growth in western China is relatively lower as compared to the other variables of digital financial inclusion. Thus, Hypothesis 7 is supported by the empirical results.
In terms of the three second-level indicators, both the eastern and western economic zones exhibit a more effective convergence effect on the urban–rural income gap with regard to the breadth of coverage and depth of use. This observation fits with the fact that China is in an early stage of progress of digital inclusive finance. Initially, emphasis is placed on expanding the breadth of coverage to overcome the issue of financial exclusion and ensure comprehensive Internet accessibility. Subsequently, attention shifts towards the depth of use, with a focus on the rural areas for the in-depth development of inclusive financial products. Currently, China is experiencing rapid development in terms of breadth of coverage and depth of business. Building upon this progress, the further advancement of digital financial inclusion requires leveraging advanced Internet technology, alongside expanding the breadth of coverage, and enhancing the depth of use. Consequently, the influence of digital business within digital inclusive finance on decreasing the urban–rural gap is comparatively lower than that of the breadth of coverage and depth of use, given its reliance on advanced Internet technology and the existing level of breadth and depth in digital business development.
Among the control variables, residents’ education level can greatly reduce income disparity in eastern China. However, it does not have a significant effect on income disparity in western China. The reason may be that there is a greater allocation of educational resources in the urban areas in the east than in the west. That said, improving residents’ education level will further boost the income levels of rural and urban residents. However, thus far, increments in the income levels in the rural district have been lower than those in the urban district. For the two districts, the standard of financial support for agriculture will widen the income gap. Economic transformation will narrow the income disparity in the eastern zone, but it has no significant influence on income disparity in the western zone. Technological progress can obviously narrow the western region’s income disparity. But in eastern China, technological progress has had a significant effect in decreasing the urban–rural income disparity. However, this effect is not significant with the inclusion of depth, digitalization, insurance, or credit because the growth of these digital financial services requires a high level of technology. The degree of opening can obviously narrow income disparity in the eastern zone but will widen income disparity in the western zone.
6. Conclusions
6.1. Implications
This paper highlights the vital part of digital inclusive finance in mitigating the urban–rural divide between the two regions. Overall, the findings demonstrate that digital inclusive finance has a stronger influence on decreasing income disparity in the western region as compared to the eastern region. It is noteworthy that the credit index exhibits a smaller effect on decreasing income disparity in western China compared to eastern China. However, for the remaining six indicators, the convergence effect is more prominent in the western than in the eastern region. These results hold the potential to decrease the urban–rural gap as well as address the regional development disparity in China.
In the future, China needs to develop digital financial inclusion services from an all-around and multi-faceted perspective, and better integrate digital technology with financial inclusion. Meanwhile, China’s financial institutions should also create more financial products suitable for rural areas to further reduce income disparity. At the same time, in the process of development, we should highlight key areas. For example, the eastern economic zone should pay attention to developing the digital business of digital inclusive finance, especially the small insurance business. Although the convergence effect of the western economic zone is better than that of the eastern region on the whole, expanded digital business on the basis of the breadth of coverage and depth of use is needed.
6.2. Limitation and Future Research Directions
The major limitation of this paper is that the data for the digital financial inclusion index was collected and compiled from the Digital Finance Research Center of Peking University, and is based on the Ant Financial Group. Thus, detailed data on financial inclusion from traditional financial institutions is currently difficult to obtain. In addition, the imbalance in economic levels between China’s eastern and western economic zones has been a long-standing issue. As China has made efforts towards continuous development, there has been a strong commitment to promoting economic growth in the western zone. Narrowing the economic gap between the eastern and western regions has been identified as a pressing and crucial challenge. The emergence and subsequent development of digital inclusive finance has presented numerous opportunities for the western region. It not only contributes to the convergence of income disparity between the eastern and western zones but also accelerates economic growth in the western district. Consequently, the growth of digital inclusive finance plays a pivotal role in decreasing the disparity between the eastern and western zones, facilitating a more balanced economic landscape across China.
Author Contributions
Conceptualization, J.L., C.-H.P. and M.A.A.; methodology, J.L. and C.-H.P.; software, J.L. and C.-H.P.; validation, J.L., C.-H.P. and M.A.A.; formal analysis, J.L.; investigation, J.L., C.-H.P. and M.A.A.; resources, J.L.; data curation, J.L. and M.-C.J.; writing—original draft preparation, J.L.; writing—review and editing, J.L., C.-H.P., M.A.A. and M.-C.J.; supervision, C.-H.P. and M.A.A.; project administration, J.L. All authors have read and agreed to the published version of the manuscript.
Funding
This research received no external funding.
Informed Consent Statement
Not applicable.
Data Availability Statement
Our data were obtained from National Bureau of Statistics of China and Institute of Digital Finance, Peking University.
Acknowledgments
The authors gratefully acknowledge support from the Universiti Malaysia Sarawak (UNIMAS) and Weifang Institute of Technology (WFIT).
Conflicts of Interest
The authors declare no conflict of interest.
References
- Asian Development Bank Institute. 2014. Financial Inclusion in Asia: Country Surveys. Available online: https://www.adb.org/sites/default/files/publication/159308/adbi-financial-inclusion-asia.pdf (accessed on 7 October 2023).
- Banerjee, Abhijit V., and Andrew F. Newman. 1993. Occupational Choice and the Process of Development. Journal of Political Economy 101: 274–98. [Google Scholar] [CrossRef]
- Chen, Zhiguo, and Fengjiao Bai. 2021. The impact of digital inclusive finance on urban-rural income gap. Research of Finance and Education 5: 26–35. [Google Scholar]
- Chu, Zheng, and Yingjuan Sun. 2022. The impact of digital finance on rural residents’ consumption. Southern Rural Areas 2: 25–32. [Google Scholar]
- Ding, Xin, and Ye Zhou. 2022. Financial development: An analysis of asymmetric spatial spillover effects between financial agglomeration and financial exclusion. Journal of Economics and Management 1: 87–109. [Google Scholar]
- Glendinning, Caroline, and Peter A. Kemp. 2006. In Cash and Care Policy Challenges in the Welfare State. Edited by Caroline Glendinning and Peter A. Kemp. Bristol: Policy Press Scholarship Online, pp. 95–108. [Google Scholar]
- Ji, Xuanming, Kun Wang, He Xu, and Muchen Li. 2021. Has digital financial inclusion narrowed the urban-rural income gap: The role of entrepreneurship in China. Sustainability 13: 8292. [Google Scholar] [CrossRef]
- Jiang, Hongli, and Pengcheng Jiang. 2020. The effect of digital inclusive finance on residents’ consumption level and structure optimization. Financial Research 10: 18–32. [Google Scholar]
- Kempson, Elaine, and Claire Whyley. 1999. Kept Out or Opted Out? Understanding and Combating Financial Exclusion. Bristol: Policy Press, pp. 54–56. [Google Scholar]
- Leyshon, Andrew, and Nigel Thrift. 1995. Geographies of financial exclusion: Financial abandonment in Britain and the United States. Trans-Actions of the Institute of British Geographers 1: 312–41. [Google Scholar]
- Li, Jianwei, and Chuanho Cui. 2022. Digital inclusive finance and the improvement of household consumption level. Finance Theory and Teaching 3: 16–23. [Google Scholar]
- Li, Jun, Yanfeng Gu, and Chuncen Zhang. 2015. Hukou-Based Stratification in Urban China’s Segmented Economy. Chinese Sociological Review 47: 154–76. [Google Scholar] [CrossRef]
- Li, Mu-Chen, Si-Xian Feng, and Xing Xie. 2023. Spatial effect of digital financial inclusion on the urban–rural income gap in China-Analysis based on path dependence. Economic Research-Ekonomska Istraživanja 36: 2106279. [Google Scholar] [CrossRef]
- Li, Qin, and Dan Fan. 2022. The impact of Sichuan-Chongqing digital inclusive finance on urban-rural income gap. Digital Economy 2: 84–96. [Google Scholar]
- Li, Tinghui, and Jiehua Ma. 2021. Does digital finance benefit the income of rural residents? A case study on China. Quantitative Finance and Economics 5: 664–88. [Google Scholar] [CrossRef]
- Li, Wei. 2020. Analysis of regional differences in China’s financial sector from the perspective of financial exclusion. Credit Information 1: 89–92. [Google Scholar]
- Li, Yanling, Mengxin Wang, Gaoke Liao, and Junxia Wang. 2022. Spatial spillover effect and threshold effect of digital financial inclusion on farmers’ income growth—Based on provincial data of China. Sustainability 14: 1838. [Google Scholar] [CrossRef]
- Liu, Pengju, Yitong Zhang, and Shengqi Zhou. 2023. Has digital financial inclusion narrowed the urban–rural income gap? A study of the spatial influence mechanism based on data from China. Sustainability 15: 3548. [Google Scholar] [CrossRef]
- Liu, Tingting, and Zheyuan Wang. 2019. The impact of inclusive finance on the income gap between urban and rural residents—Based on the analysis of Shandong Province panel data. China Economic and Trade Guide 11: 98–100. [Google Scholar]
- Liu, Yansui, Shasha Lu, and Yufu Chen. 2013. Spatio-temporal change of urban–rural equalized development patterns in China and its driving factors. Journal of Rural Studies 32: 320–30. [Google Scholar] [CrossRef]
- Panigyrakis, George G., Prokopis K. Theodoridis, and Cleopatra A. Veloutsou. 2002. All customers are not treated equally: Financial exclusion in isolated Greek islands. Journal of Financial Services 7: 54–66. [Google Scholar] [CrossRef]
- Sarma, Mandira, and Jesim Pais. 2011. Financial inclusion and development. Journal of International Development 23: 613–28. [Google Scholar]
- Shen, Hongcheng, Ting Luo, Zhixiong Gao, Xia Zhang Weikun Zhang, and Yen Ching Chuang. 2023. Digital financial inclusion and the urban–rural income gap in China: Empirical research based on the Theil index. Economic Research-Ekonomska Istraživanja 36: 2156575. [Google Scholar] [CrossRef]
- Su, Fang, and Lei Fang. 2016. Regional differences in rural financial exclusion in China: Insufficien–supply or insufficient demand?—Comparative analysis of banking, insurance and internet finance. Management World 9: 70–83. [Google Scholar]
- Sun, Yongqiang. 2012. Financial development, urbanization and urban-rural income gap. Journal of Finance Resource 4: 98–109. [Google Scholar]
- Tan, Yanzhi. 2021. Credit Environment Construction and Sustainable Development of Rural Financial Institutions under the Background of Financial Exclusion. Beijing: People’s Publishing House, p. 5. [Google Scholar]
- Tao, Langping, Yujie Li, Gangzhen Wang, and Chengyue Jiang. 2021. Digital inclusive finance, urban-rural income gap and regional heterogeneity. Journal of Qinghai Normal University (Social Sciences) 1: 1–11. [Google Scholar]
- Tong, Jixin, and Yuemei Cao. 2018. The impact of inclusive financial development on urban-rural income gap: An empirical study based on panel data in western China. Journal of Harbin University of Commerce 5: 46–54. [Google Scholar]
- Wang, Xiuhua, Yong Fu, Xiaojin He, and Kaitong Tan. 2013. A study on the financial exclusion of rural households in China—Based on the survey data of 1,547 rural households in 29 counties of 8 provinces in China. Financial Research 7: 139–52. [Google Scholar]
- Yan, Yutan. 2022. The influence of digital inclusive finance on urban-rural income gap in China. Times Finance 1: 78–80. [Google Scholar]
- Ye, Weichao. 2016. The impact of inclusive finance on urban-rural income gap: A case study of seven provinces in east China. Journal of Harbin University of Commerce 4: 50–58. [Google Scholar]
- Yin, Zhichao, Yang Yang, and Haodong Zhang. 2017. Financial inclusion and households’ income inequality in Beijing-Tianjin-Hebei Region: Evidence from CHFS data. Journal of Beijing Technology and Business University (Social Science Edition) 32: 13–21. [Google Scholar]
- Zhang, Guojun, Chunshan Zhou, and Xueqiang Xu. 2014. Inter-provincial differences and influencing factors of financial exclusion in China. Geographical Research 12: 2299–311. [Google Scholar]
- Zhang, Haodong, and Zhichao Yin. 2016. Financial knowledge and household financial exclusion in China: An empirical study based on CHFS data. Journal of Financial Research 7: 80–95. [Google Scholar]
- Zhang, Qinqin. 2022. The impact of digital inclusive finance on urban-rural income gap under industrial adjustment. Rural Economics and Technology 4: 211–14. [Google Scholar]
- Zhang, Tongjin, and Kuanning Cai. 2021. Does digital inclusive finance narrow the consumption gap between urban and rural residents?—Empirical test based on China’s provincial panel data. Economic Issues 9: 31–39. [Google Scholar]
- Zhuang, Zhihao. 2021. An empirical study on the impact of digital inclusive finance development on urban-rural income gap in China. North China Finance 10: 26–37. [Google Scholar]
- Zou, Xinyue, and Wang Wang. 2020. The impact of digital inclusive finance on household consumption: An empirical analysis based on spatial econometric model. Financial Economics Research 4: 133–45. [Google Scholar]
Disclaimer/Publisher’s Note: The statements, opinions and data contained in all publications are solely those of the individual author(s) and contributor(s) and not of MDPI and/or the editor(s). MDPI and/or the editor(s) disclaim responsibility for any injury to people or property resulting from any ideas, methods, instructions or products referred to in the content. |
© 2023 by the authors. Licensee MDPI, Basel, Switzerland. This article is an open access article distributed under the terms and conditions of the Creative Commons Attribution (CC BY) license (https://creativecommons.org/licenses/by/4.0/).