Article

Impact of Patent Signal on Firm’s Performance at IPO: An Empirical Analysis of Japanese Firms

by
Le Thuy Ngoc An
1,*,
Yoshiyuki Matsuura
2,
Mohammad Ali Tareq
3,*,
Nurhayati Md Issa
1 and
Norliza Che-Yahya
4
1
Graduate School of Sciences and Technology for Innovation, Yamaguchi University, Tokiwadai 2-16-1, Ube 755-8611, Japan
2
Graduate School of Innovation and Technology Management, Yamaguchi University, Tokiwadai 2-16-1, Ube 755-8611, Japan
3
Department of Finance, Faculty of Business and Economics, University Malaya, Kuala Lumpur 50603, Malaysia
4
Faculty of Business and Management, Universiti Teknologi MARA, Kampus Puncak Alam, Puncak Alam 42300, Malaysia
*
Authors to whom correspondence should be addressed.
Economies 2023, 11(4), 101; https://doi.org/10.3390/economies11040101
Submission received: 2 February 2023 / Revised: 16 March 2023 / Accepted: 16 March 2023 / Published: 23 March 2023
(This article belongs to the Section Macroeconomics, Monetary Economics, and Financial Markets)

Abstract

:
This study investigates whether patents can be a useful signaling tool for the IPO performances among high- and low-tech firms. Literature has provided a wealth of evidence confirming a significant relationship between patent signal and capital-raising success for US and EU venture capital-backed firms and start-ups in specific industries. Therefore, this paper focuses on the IPO firms from a more risk-averse market, Japan, to fill in the gaps in the literature, examining the signaling effect of patent applications prior to initial public offering (IPO) to the amount raised at IPO. Moreover, we examine whether patent applications prior to IPO from high-tech have relatively weaker signaling effects to compare with low-tech IPOs. Using the OLS model for 338 Japanese IPOs listed between 2000 and 2015, the result shows a robust and positive association between the number of patents before an IPO and the amount of cash raised during the IPO. The finding confirms that patents are a reliable signal for IPOs in the Japanese context. Using OECD industry categorization to classify high-tech and low-tech IPOs, our OLS result found that the interaction impact between the high-tech dummy and the quantity of patent applications before IPO is significantly negative to the amount of cash generated at IPO. The findings hold for a new set of high-tech and low-tech firms when we used a new industrial categorization proposed by Thomson Reuters, leading us to conclude that for the Japanese companies that belong to the high-tech industry sector, patenting activities fail to have a positive signal for the IPO.

1. Introduction

Prior to producing consistent sales and profits from their goods or services, a company must obtain a sufficient amount of capital (Acharya and Xu 2017). As a result, firms issue an IPO following an innovative breakthrough in order to raise capital to assist their expansion and product development (Solow 1957; Pástor et al. 2009). A significant hurdle for firms pursuing IPOs lies in information asymmetry between them and investors (Wang et al. 2019). In contrast to listed companies, private firms often lack reliable information, such as firms’ specialized science and technology, operation records, and cash-flow report. This hinders the abilities of investors to properly value the company before going public (Nagata and Hachiya 2007; Wang et al. 2019). This may create an information asymmetry problem, which in turn, results in difficulty predicting the long-term potential of an IPO company due to inaccurate valuation. To make up for this, businesses provide signals of excellence to persuade outsiders of the firm’s quality and potential since investors are more willing to trade resources when they have a good image of the company. A variety of firm measures have been used as signals in the IPO market over the years, for example, investment bankers (Jain and Kini 1999; Daily et al. 2005; He 2007) and business partners (Stuart et al. 1999; LiPuma 2012; Peng et al. 2021) can be useful signals for outside investors. Moreover, companies signal the reputation of underwriters (Jelic et al. 2001; Dong et al. 2011; Su and Bangassa 2011), CEO (Certo et al. 2007; Yang et al. 2011), and the size and qualifications of the top management team (Higgins and Gulati 2006) during the IPO process to improve IPO success by reducing information asymmetry. Mousa and Reed (Mousa and Reed 2013) and Useche (2014) have argued that patents are a useful source of information to affect investors’ decisions. According to Czarnitzki and Lopes-Bento (2014), patents can be a reliable signal to reduce information asymmetry due to the fact that patent details are verifiable by others, easily observable, and costly to maintain. There is a considerable number of studies that examined the linkage between patents and firm growth, as patents signal the potential of a firm to external investors, and thus enable entrepreneurs to acquire financial capital. While previous research mainly focused on patent signaling in venture capital-backed firms and start-ups in certain business areas, such as semiconductors, software, and biotechnology (MacMillan et al. 1985; Baum and Silverman 2004; Mann and Sager 2007; Conti et al. 2013; Hsu and Ziedonis 2013; Haeussler et al. 2014; Ahlers et al. 2015), what has received relatively less attention in the literature is whether patents still act as a signal for companies in different industry sectors to attract capital from investors in the event of an IPO. Furthermore, earlier research paid more attention to the United States (US) and European (EU) markets, where investors are more inclined to compromise on risk. Surprisingly, to the best of our knowledge, no study has been carried out that investigates the significance of patent signals to IPO proceeds in the more risk-averse Japanese market (Taplin 2005). Therefore, in one of our research objectives, we broaden the scope of our research to include all Japanese IPO businesses across all industry sectors in order to reaffirm whether patents continue to be a useful signal to help companies in acquiring financial capital.
To predict IPO performance, patents can be a good signal to reduce information asymmetry; however, the value of the signal can be contingent on the industry the company belongs to. In the case of firms belonging to high-tech sectors (high-tech), the information asymmetry associated with R&D and patent activity disclosure is more severe than in the case of companies belonging to low-tech sectors (low-tech) (Prędkiewicz et al. 2021). The distinctions between the IPO performances of high-tech and low-tech companies have not been given sufficient attention in previous research, although there are certain differences in motivation, underlying technology, long-term performance, etc. between them (Carpenter et al. 2003; Kim et al. 2008; An et al. 2022). Those differences may influence the relationship between patent and IPO success. There are several situations in which high-tech diverges from low-tech. High-tech firms are more likely to participate in complicated innovation projects to strengthen their technical competitive edge, and the results of innovation activities are often protected by patents (Leone et al. 2007). Since the technology inherent in patents is highly technical and complex, and previous patent data provides little help in estimating the possibilities of their current patent operations, their patent portfolios are far less well understood by outside observers (Kim et al. 2008). In addition, high-tech devotes a significant proportion of its resources to innovation projects that, in the early years of their operation, generate very little or no profit (Gao and Hou 2019). The unpredictability of profiting from innovative activities indicates that it is significantly riskier to finance firms that carry innovative projects (Mazzucato 2013; Coad et al. 2016). Furthermore, high-tech companies often own substantial intangible assets in the form of patents and other intellectual property, while their low-tech counterparts allocate their resources more equitably (Kim et al. 2008). For assessing more technologically advanced projects, skilled experts are necessary, which can be a challenge for the majority of investors (Prędkiewicz et al. 2021). The aforementioned factors lead to a high asymmetry of information connected with more advanced technology and innovative projects carried out by high-tech enterprises, which therefore limits the possibilities of financing investments. In contrast, low-tech firms may have few patents with high value, which can be easily identifiable through product development and operational activities, providing positive signals to the prospective investors in an IPO. Therefore, our second research objective is to investigate whether high-tech firms are less successful than their low-tech counterparts throughout the IPO process in terms of the total capital collected at IPO.
We conducted empirical research from the assembled data about the financing and patenting of 338 Japanese IPOs, which include 242 high-tech firms and 96 low-tech firms listed between 2000 and 2015. The results are well validated. For the first research objective, our OLS analysis result confirms a strong and positive relationship between the number of patents prior to an IPO and the amount of capital a Japanese IPO may raise during its IPO. While the literature provides a wealth of evidence confirming a significant relationship between patenting and capital-raising success for mostly US and EU venture capital-backed firms and start-ups in specific industries, our results show that the findings in the literature hold true with our samples. Specifically, the finding contributes to the literature by confirming the role of patents as trustworthy signals for IPOs in the Japanese setting.
Using OECD industrial categorization to differentiate between high-tech and low-tech sectors, our OLS findings indicate that the interaction effect between the high-tech dummy and the number of patent applications prior to an IPO is considerably negative to the capital collected at IPO. When we applied an alternative industrial categorization given by Thomson Reuters to our sample, the findings held true for a new set of high-tech and low-tech firms, which leads us to conclude that, for the Japanese companies that belong to the high-tech industry sector, patenting activities fail to have a positive signal for the IPO. In contrast, Japanese companies that belong to the low-tech industry sector tend to have a better IPO performance.

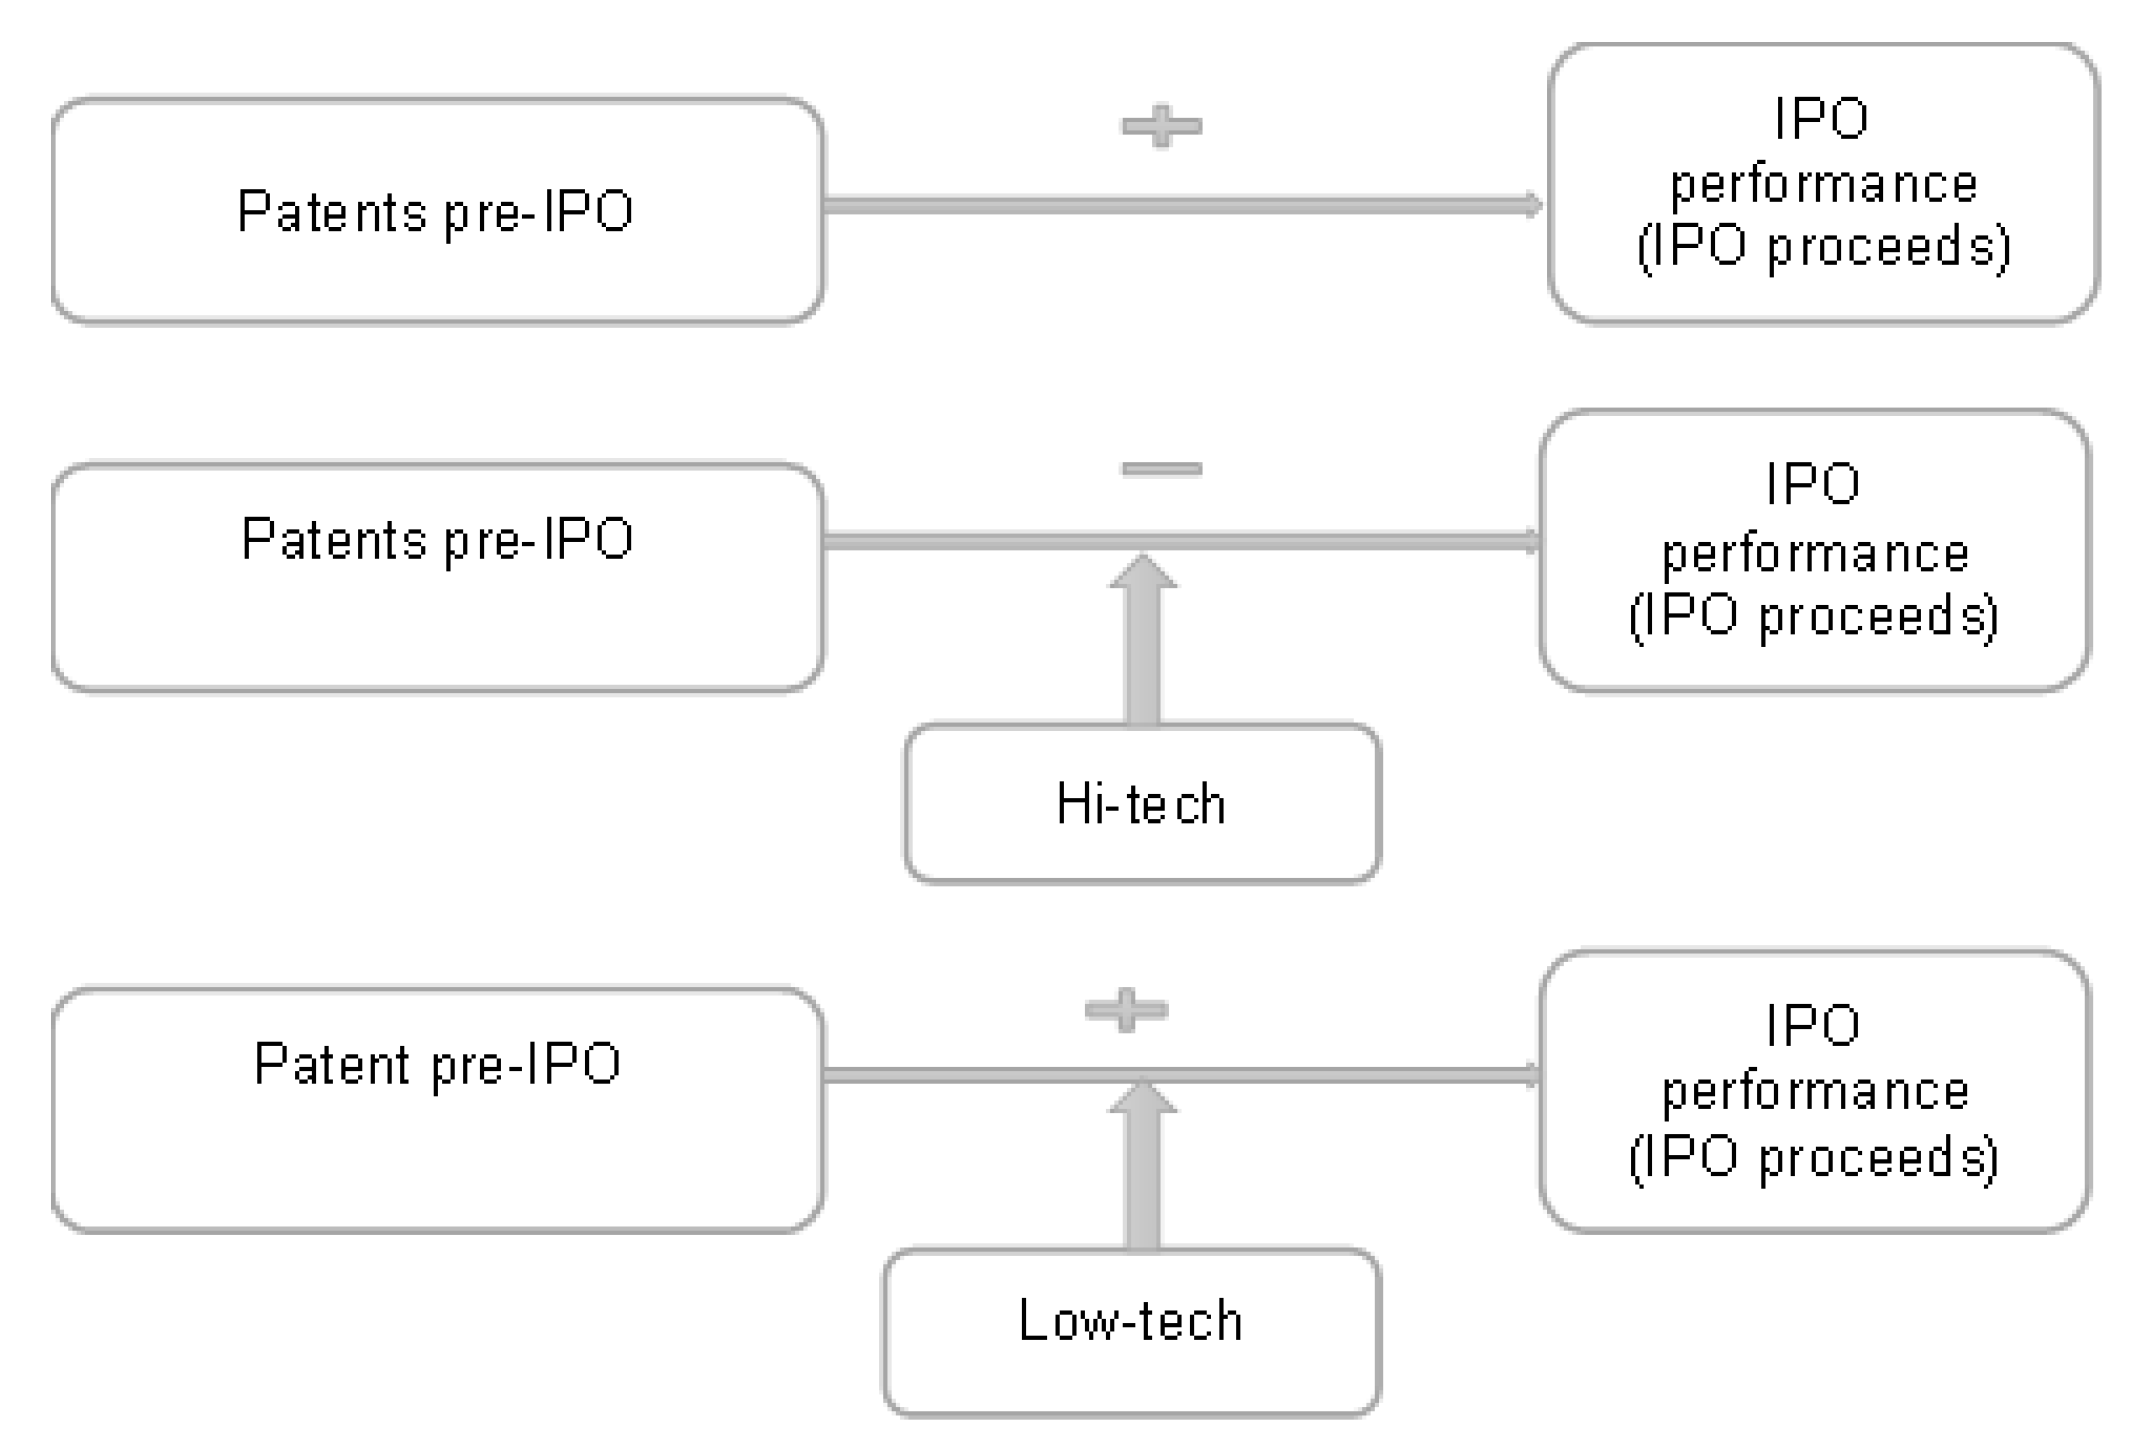
2. Literature Review and Hypothesis Development

2.1. IPO, Information Asymmetry, and Quality Signal

Information asymmetry between firms that are going public and potential investors in the stock market seems to be a significant obstacle for businesses pursuing IPOs. It is difficult for investors to understand the specialized technologies and cutting-edge knowledge of the firms. In addition, given that the majority of companies lack steady operations, earnings, and liquidity, it is challenging for external investors to determine their real value. Consequently, investors depend on a company’s quality signals, such as the company’s strategies and decisions, the specific characteristics of the firm, or behaviors that might indicate its future potential (Cohen and Dean 2005; Connelly et al. 2011; Bergh et al. 2014). IPO companies with stronger innovation skills are better able to respond to shifts in market demand, use resources inside the company wisely, and create new scientific and technological advancements. However, due to the potential adverse selection brought on by knowledge asymmetry, innovation can lower IPO valuation by external investors. Investors often find it difficult to identify the worth of organizations with this high information asymmetry; therefore, in order to decrease risk, they often rely on company quality signals to value these firms (Certo 2003).
The signaling theory, first put forth by Spence in 1973, suggests that IPO firms may affect investors’ perceptions by delivering reliable signals that have an impact on their degree of trust and anxiety (Spence 1973). Due to the fact that when partners have a positive view of a company, they are often more willing to share resources with that firm, Lange et al. argued that companies use signals of a firm’s excellence to convince third parties of its potential (Lange et al. 2001). Researchers have identified a number of indicators that act as pre-IPO signals for the firms, such as third-party affiliations, such as venture capital-backed companies (Gompers 1996; Kirkulak 2008; Ragozzino and Blevins 2016), investment bankers (Jain and Kini 1999; Daily et al. 2005; He 2007), and business partners (Stuart et al. 1999; LiPuma 2012; Peng et al. 2021), which can be useful signals for outside investors. Companies also signal their reputation using underwriters (Jelic et al. 2001; Dong et al. 2011; Su and Bangassa 2011), CEO background (Certo et al. 2007; Yang et al. 2011), and the size and qualifications of the top management team (Higgins and Gulati 2006) during the IPO process to improve IPO success by reducing information asymmetry.
Higgins et al. (2011) and Pisano (2006) observed that the nature of the signal evolves over time, and investors may delay investment decisions until enterprises reveal more visible outcomes. In this sense, revealing information about the company’s innovations and competencies via patents may assist companies in attracting investors; therefore, minimizing issues with asymmetric knowledge. As tangible results of the innovation process, patents serve as reliable indicators of how well a company’s innovative efforts and technical prowess have worked (Griliches 1998). Patents may convey to external investors a company’s potential by indicating future outcomes with commercial worth (Hagedoorn 2003). Moreover, patents are expensive to acquire and difficult to imitate, and they offer a selection process that enables observers to differentiate between various attributes (Long 2002; Hsu and Ziedonis 2013). In addition, since patent filings are publicly accessible, outside investors can use this information to determine the worth of the firm’s investment (Levitas and McFadyen 2009). Therefore, patents are regarded as sufficient indicators of a company’s innovation capabilities for these compelling reasons.

2.2. Patent Practices in the IPO Context

Businesses with a greater capacity for innovation are better able to adjust to changes in consumer demand, manage resources within the company in an effective manner, and produce new ideas and innovations. However, due mainly to the possibility of adverse selection brought on by information asymmetries, innovation may lower business value among outside investors. Investors typically find it difficult to judge the value of enterprises with unknown worth, and as a result, to reduce risk, they adopt reactionary methods, such as relying on indicators of company quality to value these firms (Certo 2003). When a company tries to raise money via an IPO, it may be able to shape investors’ opinions by giving indications of legitimacy and may increase their degree of trust (Certo 2003; Brau and Fawcett 2006). If ambiguity and information asymmetry can be reduced, patents, which are proof of invention and competence, may also function as a quality signal.
To date, mainstream literature has been paying attention to the property right function of patents. Businesses apply the patent in order to safeguard its technology (Schankerman 1998), to protect against infringing, and to secure a monopolistic right to profit from their distinct product offerings (Graham and Sichelman 2008), or to grant mutual rights to jointly use the patent for cross-licensing (Hall and Ziedonis 2001; Motohashi 2008). Moreover, the patent can act as a signal for firm’s quality to reduce the informational asymmetries between firms and outside investors. A company’s patents suggest that it possesses the ability to combine knowledge and the caliber of the entrepreneur’s technological advancements (Hall and Helmers 2019). Additionally, according to Motohashi (2009), patents provide information about a company’s distinctive product offerings, while Guo et al. (2012) confirmed that patents disclose the number of product lines and the firm’s product candidate stage (Deeds et al. 1997). In essence, patents are a powerful tool for signaling technical competency. A business with a strong patent portfolio may seem, in the view of outsiders, more capable of preserving, if not increasing, profits when compared to its rivals. As a result, in an effort to seem more reputable and valuable, some businesses incur tremendous pains to achieve patents, particularly in the lead up to an IPO.
According to Spence’s signaling theory, firms of higher quality choose to transmit the signal, while those of poorer quality may opt out due to the high cost of copying an effective signal. Patents are a high-quality signal due to those following conditions. First, a firm’s patent portfolio signifies its competency in terms of science and engineering expertise (Wang et al. 2019). Additionally, patents are expensive due to a number of costs incurred by firms in order to secure patent protection, including those associated with filing an initial application, validating the application, and renewing the protection (De Rassenfosse et al. 2013). Next, patents are only awarded for truly innovative technologies and to the first party that can prove they have legitimate legal rights to those technologies: Low-quality enterprises could struggle to compete (Levitas and McFadyen 2009). Accordingly, patents offer a sharp boundary between firms that can and cannot move effectively through the innovation process. Moreover, patent applications are open to the public: The information included within them may be utilized by external investors to gauge the company’s value (Hall et al. 2005). Investors receive reliable information from patents at a minimal cost.
The concept of using patents as a signal to financial markets has been the subject of a large number of empirical investigations. Table 1 provides an overview of patent signaling studies in the last 20 years. According to Baum and Silverman (2004), all three forms of firm resources—patents, partnerships, and team experience—are positively correlated with the amount of venture capital funding. Regarding software companies that are venture-backed, Mann and Sager (2007) found that patents had an impact on overall funding in these businesses. A fixed-effects regression was applied in the research by Cao and Hsu (2011) for 20,000 venture capital-backed enterprises in the United States, revealing that the number of patent filings in the pre-venture capital form are associated with a bigger investment and a reduced likelihood of failure. Even more pronounced are positive significant and robust correlations between the number of patent applications prior to IPO and the amount invested at IPO, which are validated for subsamples of 234 US IPOs and 242 EU IPOs in the software industry in the study by Useche (2014).
Looking across all the studies in Table 1, the most striking observation at first glance is the majority of research that focus on venture capital-backed companies in several relatively technology-intensive sectors, such as software, semiconductors, biotechnology, nanotechnology, and the Internet. Furthermore, previous papers give more attention to risk-tolerant markets—such as the US, UK, Germany, and Israel—in which investors are willing to accept a certain level of risk as a trade-off for higher returns. To the best of our knowledge, no paper written in English has investigated the significance of using IPO proceeds as a proxy in the context of Japan, which is a more risk-averse market. Therefore, this study adds to the literature by investigating a large sample of all Japanese IPO companies in a broad range of industries comprising both manufacturing and non-manufacturing sectors in order to determine whether patents reduce uncertainty and information asymmetry, send out encouraging signals to the market, and thus aid firms in going public effectively. Accordingly, the following hypothesis was formulated:
Hypothesis 1 (H1).
All other conditions being equal, the patents before IPO signal IPO performance among firms in Japan.

2.3. Patent Practice and Industry Characteristics

Industry classification serves as a fundamental aspect of economic research and business analysis. Grouping and categorizing corporations into high- and low-tech sectors based on their underlying technology helps business managers and academic researchers in monitoring economic activity, recognizing partners and rivals, determining market share, benchmarking corporate performance, and building sector indexes (Phillips and Ormsby 2016). Companies in high- and low-tech sectors are distinct from each other in terms of knowledge characteristics, such as complexity, implied communication, and rate of renovation; therefore, it is probable that the characteristics of innovation projects carried out by each peer are also distinct (Phillips and Ormsby 2016). Innovativeness is considered to be one of the main driving engines behind organizational success as well as a competitive advantage in engaging investors (Chatzoglou and Chatzoudes 2017). However, innovation practice in the more technologically advanced and innovative projects operated by high-tech firms often results in high information asymmetry since evaluating these projects is normally complicated, which significantly increases the risk for conventional finance providers, and the risk for a capital provider is substantially greater (Prędkiewicz et al. 2021). Firms that belong to the high-tech sector tend to create a significant amount of intangible assets, such as patents, research and development, and another intellectual property during the innovation process, which is very challenging to interpret and assess. In contrast, low-tech peers carry a large amount of physical assets in order to remain in business and expand (Zingales 2000). According to Detragiache et al. (2000), investors choose to safeguard their investment with projects that own more physical assets and are unwilling to lend when a project requires significant R&D spending.
High-tech companies are characterized by fast breakthroughs in science and technology, necessitating constant innovation projects to maintain technical superiority and introduce new goods and services to the marketplace, while low-tech firms enjoy a reasonably stable environment (De Carolis 2010; Buenechea-Elberdin et al. 2018). Innovative high-tech projects are generally conducted over a long period of time, and the returns are uncertain, making them significantly riskier to finance (Brown et al. 2012). High-tech companies’ patent portfolios may be extremely complex, indicating that non-expert investors find it difficult to understand them and impossible to provide accurate recommendations on how to evaluate their commercial possibilities (Guiso 1998).
High-tech firms are usually involved in more complex, knowledge-sharing interdependencies among different components, and are at a greater degree of tacit communication than low-tech firms (Schilling and Shankar 2019). Innovations within low-tech ventures are likely to be simpler and more focused. For high-tech companies, competitiveness among firms may lead to diversified innovation for a single product, which in turn, may make patent portfolios more complex and difficult to understand by investors. Although patents provide a good signal, their value as a signal is affected. Frequently, high-tech firms are undervalued due to the difficulties in interpreting information related to patents increasing when the companies’ innovation encompasses a wide variety of knowledge. Due to the interdependencies among different components, projects started by high-tech companies may entail more risks than those started by low-tech companies. When choosing to invest in a high-tech venture that has many risky projects and deferred positive cash flows, investors may exercise caution, especially pre-IPO (Levin et al. 1987).
As perceived, information asymmetry associated with innovation activities presented by the patents of high-tech companies is more extreme, which may cause unease among investors. Although the literature has shown disparities between high-tech and low-tech firms in terms of motivation, issuance tactics, and long-term success, few studies have examined the differential in IPO success between high-tech and low-tech companies. Bessler and Bittelmeyer (2008) used German firms to test the impact of innovation activities on respective IPOs. Although they argued the patent to be a signal during IPO, they used the quality of the patent as an indicator to measure its impact on IPO performances, rather than categorizing the firms into high- and low-tech industries. Useche (2014) argued how the patenting behavior impacts the way investors perceive growth potential before the IPO for US and European software firms. Using the IPOs of 356 internet-related firms from NASDAQ, Wagner and Cockburn (2010) also argued on the quality of the patents as a signal before IPO. Zhang and Zhang (2020) showed that technological innovation, measured by the granted patents, is the major contributing factor to the performance of VC-backed IPOs. For information technology-related companies, Feldman and Frondorf (2015) found a significant signaling impact of patenting activities on IPOs. Studies lacked investigating the impact of patenting activities on IPO by categorizing the firms into high- and low-tech industries, especially for Japanese firms. Studies have thrown all IPOs into one basket, or focused only on some industries, such as bio-technology, semiconductors, software, and the internet (Mann and Sager 2007; Hsu and Ziedonis 2008; Häussler et al. 2012; Munari and Toschi 2015; Morricone et al. 2017; Wang et al. 2019). Therefore, in the context of Japanese IPOs, this study attempts to contribute new insight to the entrepreneurship and innovation literature by emphasizing how the signaling effect of patents differs between high- and low-tech IPOs. Therefore, we hypothesize:
Hypothesis 2 (H2).
All other conditions being equal, the patents before IPOs from Japanese high-tech firms have relatively weaker signaling effects on IPO performance.
The conceptual framework of our study is demonstrated in Figure 1.

3. Methodology

3.1. Data

We built a dataset to identify IPO deals between 1 January 2000 and 31 December 2015 for all firms—including manufacturing and non-manufacturing firms—in Japan listed in the Japan Exchange Group (JPX) database. The sample time is chosen in consideration of market stability, the regulatory framework for signaling, and transparency. Patenting data, which are the main source of data collection, were hand-collected from the Japan Platform for Patent Information (JplatPat). Considering that only companies with active innovation output are our target, we excluded firms with no patent application at IPO. Moreover, firms pursuing “trade-secret” are removed since this is beyond the scope of our current work. IPO data including Proceed, Underwriter, and Stock Market are obtained from Thomson Reuters Eikon. The FinancialQuest database was used to extract pre-IPO performance characteristics, namely, the number of employees, debt-to-equity ratio, and firm age. Two distinct classifications of high-tech and low-tech firms used in our analysis are the international standard industrial classification proposed by OECD for main analysis and The Refinitiv industrial classification proposed by Thomson Reuters for robustness checks. Considering only companies with available information and dropping outlier data, our sample is comprised of 338 newly listed Japanese IPO firms, which include 242 high-tech firms and 96 low-tech firms (according to OECD classification).

3.2. Variables

3.2.1. Dependent Variables

IPO performance: To measure the success of an IPO from the company’s perspective, the key dependent variable in our research is defined as the amount of money raised by a firm via an IPO, which we refer to as Proceeds (PROCEED). Proceeds are a prominent proxy to capture the performance of IPO, which is often used in prior researches (Wang et al. (2019); Useche (2014); Khoury et al. (2013); Higgins et al. (2011); Aggarwal et al. (2009); Certo et al. (2009); (Li and Bruce (2004)). The proceeds are computed by multiplying the number of total issues by the firm’s issue price on the IPO day. The benefit of concentrating on proceeds is that it prevents allocation concerns that might possibly influence a pre-money value computation (Ritter and Welch 2002).

3.2.2. Independent Variables

Patent Stock: To measure for the patenting of a firm before an IPO, we use the total patent application at the date of the IPO. We followed Useche (2014) and Morricone et al. (2010) to create variables named PAT4 and PAT5 that measure the patents filed by the company in the last 4 years prior to the IPO and the patents filed by the company in the last 4 years prior to the IPO, respectively. Patents grant 20 years of protection from filing. Old patents may not represent the company’s current innovation performance (Heeley et al. 2007). Additionally, recent patent applications reveal organizations’ innovative capability at the time of an IPO (Useche 2014). Only recent patents will include up-to-date information on commercial innovation value, and thus we decided to use both PAT4 and PAT5 to conduct the same regression for our key independent variables.

3.2.3. Control Variables

  • Firm Size: Larger firms (in terms of size) generally perform better than smaller firms (Ritter and Welch 2002). We calculate the firm size (SIZE) as the natural logarithm of the total number of employees in the year preceding IPO (Welbourne and Andrews 1996).
  • Firm Age: In general, older businesses perform better than newer ones (Ritter 1998). The natural logarithm of the interval between the year of the IPO and the year of the business’s founding is used to determine the firm age (AGE).
  • Financial Ratio: To measure the stability of a firm, we choose the leverage ratio debt-to-equity ratio in the year preceding the IPO (D/E RATIO) (Herawati 2017). The more stable and less risky the financial structure, the smaller this ratio. We use a natural log transformation of D/ERATIO to account for the data’s skewedness.
  • High-tech Dummy: To distinguish high-tech from traditional firms, we have constructed two dummy variables using information drawn from the international standard industrial classification conducted by the OECD (Galindo-Rueda and Verger 2016). This categorizes industries by their R&D intensity (See Appendix B for the industrial classification). The sector is high-tech if the R&D intensity is above 5%, and low-tech if below 5%. The HILO_DUMMY variable is assessed as “1” for high-tech IPOs and “0” for low-tech IPOs.
  • Underwriter Reputation Dummy: High-ranking underwriters signal a high-quality offering, which may improve the success of an IPO (Loughran and Ritter 2004; Brau and Fawcett 2006). To measure the effect of underwriter reputation on IPO performance, we include UW_DUMMY to our model. UW_DUMMY variable is assessed as “1” if the underwriter belongs to one of top five Japanese underwriters: Mizuho, Nomura, Daiwa, Mitsubishi UFJ Morgan Stanley, or SMBC Nikko according to Statista and “0” otherwise.
  • Stock Exchange Dummy: Decisions made by investors may be influenced by the stock exchanges on which the IPO firm’s shares are listed (Corwin and Harris 2001). We add the STOCK_DUMMY variable to our model to represent the exchange in which the IPO firm is listed. The STOCK_DUMMY recorded a value of 1 for the firm that is listed on the Tokyo Stock Market (TSE), the largest stock exchange in Japan, and a value of 0 for all other companies.
  • Venture Capitalist Backing Dummy: We also accounted for the potential implications of venture capital backing (VC_DUMMY) (Certo et al. 2001). This factor has been demonstrated to have an impact on how well an IPO business can raise money (Brav and Gompers 2003; Gulati and Higgins 2003). We count a value of 1 for IPOs backed by venture capitalists and 0 otherwise.
  • Year Dummy: To account for IPO time-specific tendencies, we additionally append the whole set of year dummies as “Year2000” through “Year2015”.
The list of variables, relevant literature, and database are summarized in Table 2.

3.3. Econometric Model

To analyze whether patenting prior to the IPO impacts on the IPO performance, we first estimated the following OLS regression model in Equation (1) to test Hypothesis 1:
PROCEED i = β 0 + β 1 PATENT_STOCK i + β 2 CONTROL_VARIABLES i + ε i
We investigated the question of whether differences in the degree of information asymmetry between high-and low-tech firms are caused by difficulties in interpreting information related to patents and whether this moderates the effect of the patent on IPO performance (Hypothesis 2). Then, we generated a second model in which an interaction term is between Patent Stock and HILO_DUMMY. We estimated the following OLS equation in Equation (2) to test Hypothesis 2:
PROCEED i = α 0 + α 1 PATENT STOCK i + α 2 PATENT STOCK i HILO DUMMY i + α 3 CONTROL_VARIABLE i + ε i
where PROCEEDi is the amount of money that a company may raise on the day of its IPO; PATENT_STOCKi is the patent application by a firm prior to the IPO; PATENT_STOCK is equal to PAT4 and PAT5, respectively; HILO_DUMMY is the dummy variable, which is assessed as 1 for high-tech IPOs and 0 for low-tech IPOs; CONTROL_VARIABLES denotes the set of control variables; and ε denotes statistical errors.
Hypothesis 1 argues that patent activities before IPO reduce information asymmetry between corporate insiders and external investors, and thereby improve the IPO performance. This suggests that the coefficient of PATENT_STOCKi is greater than zero (β1 > 0).
Hypothesis 2 argues that information asymmetry associated with patent evaluation is more pronounced for high-tech firms than for low-tech firms, causing the IPO performance of high-tech firms to be less successful than their low-tech peers in terms of capital raised at IPO, and implying that the coefficient on the interaction term PATENT_STOCKi * HILO_DUMMYi is lower than zero (α2 < 0).

4. Result

4.1. Preliminary Analysis

Figure 2 explores the change in the number of IPO firms from 2000–2015. The number of IPO companies fluctuates greatly over time. The first half of the period experienced a strong growth in the number of IPOs, while the second half of the period, which began in 2008, experienced a sudden decline in the number of companies going public. Since 2013, the number of IPO companies has tended to recover, but has not yet regained its pre-2007 form. The world experienced the global economic crisis from 2007 to 2008, and the decline in the number of IPO companies in Japan since 2008 reflects the impact of the Great Recession. The fact that the IPO number slightly rebounded from 2013 is aligned with the recovery from the financial crisis in the Japanese and global economies.
Before estimating the main models, descriptive data are presented and discussed. As shown in Table 3, descriptive statistics are shown for the whole sample as well as for the high-tech and low-tech subsamples. The total number of IPO companies in our sample is 338, and the number of high-tech companies is 242, accounting for about 70% of the total sample. Low-tech IPOs represent approximately 30% of the total sample, with only 96 observations over the period from 2000 to 2015. About 22% of total IPO firms are listed in the biggest Japanese Stock Exchange (Tokyo Stock Exchange); the remaining firms are listed in the JASDAQ Exchange, Mother Exchange, Osaka Exchange, and other exchanges. Seventy-seven percent of Japanese IPOs in the current setting choose to work with the most prestigious underwriter to help the company in preparing for the IPO.
Regarding the money collected by a firm at IPO (Proceed), there are substantial differences between high-tech (JPY 5539.63 million) and low-tech sectors (JPY 3213.35 million). The number of patent applications before IPO is higher in high-tech sectors (66.75 for total patents filed in the 4 years prior to IPO and 82.21 for total patents filed in the 5 years prior to IPO) than in low-tech sectors (29.03 for total patents filed in the 4 years prior to IPO and 33.71 for total patents filed in the 5 years prior to IPO). High-tech firms, in general, are also bigger in size than low-tech firms before an IPO event, which is 1066.71 employees on average for high-tech firms and 742.65 employees on average for low-tech firms. This might be explained by the fact that high-tech firms with more employees and higher motivation for pushing cutting-edge technology to the market tend to file more patents in comparison with their counterparts. On the other hand, traditional companies generally have a longer operating history until IPO (31.28 years) than high-tech firms (19.74 years). Low-tech IPOs also receive a higher debt-to-equity ratio (3.08) than high-tech IPOs (2.03). These differences can be explained in part by the attributes of each industry sector. Capital-intensive businesses, such as traditional firms that routinely invest in property, plants, and equipment as part of their operations are more likely to have a high debt-to-equity ratio. On the other hand, technology-based businesses that allocate their resources to intangible assets, such as cutting-edge scientific and technological knowledge without a need for workspaces and heavy machinery, tend to have a low debt-to-equity ratio (Kim et al. 2008).
Table 4 presents correlation matrixes for all variables in our model, we include the two independent variables in the table: Patent Stock refers to total patents filed 4 years prior to IPO (PAT4) and total patents filed 5 years prior to IPO (PAT5). The correlation between PAT4 and PAT5 is high, which receives the value of 0.996 since they both capture the firm’s patent application prior to IPO. Most correlations in both tables are of low to medium significance. The highest correlation of 0.510 in both tables is reported between firm Size and Stock dummy, a result that is not surprising since the Tokyo Stock Exchange is the largest stock exchange in Japan, where large companies often choose to be listed. Correlations of all other independent variables are below the 0.900 cut-off point for any severe threat of multi-collinearity (Asteriou and Hall 2011).

4.2. Main Analysis

Regression results are presented in Table 5. We report regression results where PAT4 is used as an independent variable1.
To test Hypothesis 1 and look into the connection between IPO performance and the patent signaling effect, we first estimated Equation (1). The coefficient of PAT4 in Model 1 received the positive value of 0.0005 at the 5% significant level. We can interpret the result similar to those of each additional patent application a firm completes 4 years before the IPO increases the money that the firm collected at IPO (PROCEED) by 0.5%, with other factors remaining fixed. These findings support Hypothesis 12. Mainstream literature claims that the primary purpose of filing a patent is to protect an innovation from infringement and violation, and to increase a company’s competitive advantage (Cohen et al. 2000; Graham and Sichelman 2008; Motohashi 2008). Our finding adds to the literature by suggesting that patents may function as a signal to lenders and investors to make it simpler to obtain external finance.
To test Hypothesis 2, we carried out an OLS regression for Equation (2). We want to test whether the industry moderates the effect of patents on IPO performance. The interaction variable is included to account for the fact that the slope of the patent stock coefficient varies between high-tech and low-tech. In Model 2, note first the significant coefficients for PAT4 and the PAT4*high-tech dummy variable. Considered together, the patent stock of high-tech IPOs is significantly negatively associated at 10% (−0.0035) with the firm’s total proceeds at IPO, whereas the patent stock of low-tech IPOs is significantly positively associated with the firm’s total proceeds at IPO3. Therefore, we found strong support for Hypothesis 2. The result from our analysis suggests that the additional effect to reduce the information asymmetry of patent application prior to IPO in high-tech is relatively low, resulting in a low Proceed at IPO to compare with low-tech peers. Specifically, a higher number of patent applications before IPO provides fewer benefits and increases the disclosure of competitive information risk to a significantly larger extent for high-tech firms than for low-tech firms.
The control variable slope coefficients are broadly consistent with past studies. At the 1% significance level, all models show a positive relationship between the size of the firm and Total Proceed. It indicates that larger companies have higher IPO valuations, presumably since investors observe larger IPOs as less risky than smaller peers since they have a greater chance of successfully capitalizing on their public listing (Gu 2003; Chahine and Goergen 2013; Useche 2014). The Total Proceed is surprisingly negatively associated with the company’s age, in contrast to our expectations. Our possible explanation is that a firm’s age is associated with uncertainty. There is a negative association between the age of a business and its total proceeds since short-term returns are greater for younger companies (which are associated with high uncertainty). This finding is consistent with the study by Ahmad-Zaluki and Kect (2012) on different IPO markets. The impact of a business’s financial stability, as evaluated by its debt-to-equity ratio, is positive but not statistically significant, giving little evidence for the association between a firm’s stability and its IPO success. Consistent with Carter et al. (1998) and An and Chan (2008), we find that underwriter reputation is significantly positively associated with a successful IPO outcome. This study found Stock Dummy to be significant and positively affect IPO performance at a p-value of 0.010. The Tokyo Stock Exchange sector typically provides a trading market for businesses whose most well-known, established firms will be listed. Investors frequently invest substantial quantities of money in these firms since they believe that they will continue to perform well in the future. The effect of venture capital is not significant; therefore, we can conclude that a Japanese company being backed by venture capital has no impact on its listing success.

4.3. Robustness Test

The OECD industrial categorization has functioned as a pillar framework for identifying and segmenting companies (Vaidya et al. 2007; Mendonça 2009; Cozza et al. 2012; Buenechea-Elberdin et al. 2017). To date, our work has followed prior empirical research studies by employing the OECD industrial classification to categorize the sample into high-tech and low-tech firms. Despite the popularity of the OECD classification in scientific research, recent research has questioned the use of R&D intensity measures as a technique for selecting and categorizing samples. This classification may cast doubt on the validity of the result. R&D and patenting activities apparently show a highly intertwined, causal relationship. Therefore, one can claim both high-tech dummy and Patent Stock measures of R&D intensity, and thus argue that a patent has the least signaling value per se, after controlling for the signaling effect of R&D, although the correlation between these two variables is shown as quite low in our sample.
In the robustness check, we substitute the OECD industrial classification with the new industrial classification proposed by Thomson Reuter in order to form a new set of high-tech and low-tech enterprises. Thomson Reuter classification is a worldwide market-oriented industrial categorization sector designed for use by investment bankers, research analysts, and fund managers to compare and assess firms with comparable market characteristics. Rather than relying solely on the R&D intensity indicator, the classification techniques use comprehensive indicators, such as a firm’s business description; usage of firm’s products, assets and profitability; business strategy; and market perception, among others, to differentiate technological firms from conventional businesses (Reuters 2020).
Table 6 is a summary of the robustness test results for our hypotheses under the new categorization of high-tech and low-tech. We report regression results where PAT4 is used as an independent variable.
The coefficients of PAT4 in Model 1 received the positive value of 0.0004 at the 5% significant level4. These findings support Hypothesis 1. The results are also comparable with the result for H1 presented in Table 5.
In Model 2, the interaction variable PAT4*HILO_DUMMY is significantly negatively associated at 5% (−0.0013) with the firm’s total proceeds at IPO, whereas the Patent stock of low-tech IPOs is significantly positively associated with a firm’s total proceeds at IPO5. Therefore, we also found a strong support for Hypothesis 2 with the new set of high-tech and low-tech firms. The results of the robustness check are consistent with the results from the main analysis. As a result, we can generate that for Japanese high-tech firms, patents before IPO have relatively weaker signaling effects on IPO performance.

5. Discussion and Conclusions

Using comprehensive data of Japanese companies in all industry sectors, our results show that companies’ patenting prior to IPO is credible by leading to better IPO performance measured by the total proceeds at IPO. The results are in line with previous findings and also demonstrate the limitations of prior work in several aspects. For example, Cao and Hsu (2011) and Hoenen et al. (2014) found that patenting is a quality signal for venture capital-financing for VC in semiconductors, while Baum and Silverman (2004) focused on biotechnology firms, which confirms that all three forms of firm resources—patents, partnerships, and team experience—are positively correlated with the quantity of venture capital funding. Regarding the software venture-backed companies, Mann and Sager (2007) found that patents had an impact on the overall funding in these businesses. While previous research mainly focuses on patent signaling in venture capital-backed firms and start-ups in certain business areas, such as semiconductors, software, and biotechnology, our research extends its scope to all IPO events for all companies in the market, and it contributes to the innovation literature by demonstrating that patents work as a reliable signal to enable entrepreneurs to acquire financial capital from external investors. Moreover, while recent research in the same area pays more attention to patent signals for the US and EU markets, where investors tend to be risk-tolerant, by focusing on the Japanese market, our contribution to the big picture is that, for a risk-averse market, such as Japan, patents still work perfectly as a signal and reduce information asymmetry.
The prime contribution of this study is to examine whether the signaling effect of patents around IPO differs depending on the industry technological domain, after controlling for the positive signaling effect in general. For this purpose, we use Japanese IPO cases as the sample and find that the patent as a signal helps low-tech companies in succeeding at IPO significantly more than high-tech companies. Our robustness test further confirms that the results hold regardless of differences in classification strategy. Relevant literature mainly sheds light on high-tech industry groups and does not pay close attention to the low-tech industry. Our result fills this gap and calls for further investigation of the signaling effect for low-tech IPOs to understand the patent signaling mechanism in the IPO context.
Low-tech enterprises in general have simpler-to-understand innovation portfolios and a large number of physical assets, which investors favor since they can safeguard their investment with tangible assets (Detragiache et al. 2000; Zingales 2000). In contrast, advanced technology, intensive R&D activities, and innovative projects are the main engines for high-tech corporations. Innovative projects, however, generally entail extensive development cycles, unpredictable results, and difficult income forecasting (Brown et al. 2012). Furthermore, knowledge assets produced via innovation may be difficult to utilize as collateral since they are intangible assets, which also makes risk-averse investors uneasy. Innovative portfolios of high-tech businesses often compound a significant number of patents that might be quite tricky for ordinary investors to interpret and evaluate their commercial opportunities (Guiso 1998). These projects are often evaluated with sophistication, and the risk for a standard financing provider is substantially larger for high-tech firms. Although the patent is a good signal, the value as a signal may be discounted for high-tech firms since the interpretative difficulties increase when the innovation encompasses a wide variety of knowledge.
The results presented in the current work also have several potential implications in terms of management. Strategy managers for more technologically advanced companies should be cautious about using patents to fuel IPO success for this reason. As a result, the innovation projects used by high-tech companies, in general, are rather complicated, with a single innovation sometimes including a wide variety of different aspects that might potentially be patented. Investors need a thorough understanding of the technology, the patents related to the invention, and their relationships in order to properly assess the value of an innovation project and determine which projects are more likely to generate a profit in the future. In this case, a signaling patent to general investing community does not yield the best results in terms of IPO performance. High-tech firms should selectively promote patents’ signaling strategy to specialist investors, such as institutional investors and investment banks, which have an in-depth grasp of firm-specific information regarding technology, and have high risk tolerance. Another practical implication is that high-tech firms should make efforts to reduce the information asymmetry associated with R&D and patent activity disclosure. One way to achieve this is to provide investors with detailed information about the future of the project, in order that stakeholders can assess the risk involved in making a financial investment. Another strategy that high-tech companies might consider is to obtain only a modest amount of cash at the IPO, and then proceed with secondary offerings when the business has established a stronger presence in the marketplace.
There are certain limitations to this study that may potentially provide opportunities for future research. First, a potential bias result may occur since our sample selection focuses on the Japanese market, where investors tend to hesitate to take risks in investment; therefore, they may not prefer to invest in high-tech firms without physical substance. Then, to generalize our results, in future research, we should also explore the signaling effect of patents for high-tech and low-tech industries across different markets. Second, our current setting uses patent applications as a proxy for innovation and patent activities, and treats each patent equally in term of its value. However, in practice, the firm’s strategic managers hold private information about the core technology and the most competitive patents in terms of cutting-edge technology. Managers may weigh the patent according to its likely value and expected return. As a result, the company will prioritize signaling the patents that they perceive as likely to bring them more success at IPO. If we were able to predict the weighted value of each patent, our result could have delivered more intuitive results. Finally, our current study succesfully demonstrates a difference in patent signal to IPO performance across all-subclass industries under the low- and high-tech spectrums. Future studies can further examine the patent signaling aspect for each individual industry sector in more detail. By concentrating on the patent signaling effect among each sub-class industry and comparing them, future research may provide a better understanding of which industries patent signals are more effective, while in some other industries, the effect of patent signals to IPO performance is weaker or a signaling effect does not affect the success of IPO in some other industries. Therefore, future studies should consider addressing the limitations to deliver even more fruitful insights.

Author Contributions

Conceptualization, L.T.N.A. and Y.M.; methodology, L.T.N.A., Y.M. and N.C.-Y.; software, L.T.N.A.; validation, L.T.N.A., Y.M., M.A.T., N.M.I. and N.C.-Y.; formal analysis, L.T.N.A.; investigation, L.T.N.A. and Y.M.; resources, L.T.N.A. and Y.M.; data curation, L.T.N.A. and Y.M.; writing—original draft preparation, L.T.N.A. and N.M.I.; writing—review and editing, L.T.N.A., Y.M., M.A.T. and N.M.I.; visualization, L.T.N.A.; supervision, Y.M. and M.A.T.; project administration, L.T.N.A. All authors have read and agreed to the published version of the manuscript.

Funding

This research was funded by Grant-in-Aid for Scientific Research (C)19K01985.

Institutional Review Board Statement

Not applicable.

Informed Consent Statement

Not applicable.

Data Availability Statement

Not applicable.

Conflicts of Interest

The authors declare no conflict of interest.

Appendix A

Table A1. Regression analysis for STOCK_PATENT = PAT5.
Panel I (OECD Classification)
STOCK_PATENT = PAT5
Panel II (Thomson Reuter Classification)
STOCK_PATENT = PAT5
Model 1
(H1)
Model 2
(H2)
Model 3
(H1)
Model 4
(H2)
Intercept5.7679 ***
0.391
5.6627 ***
0.393
5.6594 ***
0.409
5.6253 ***
0.406
PAT50.0003 *
0.000
0.0035 ***
0.002
0.0004 **
0.000
0.0014 ***
0.000
PAT5*HILO_DUMMY −0.0032 *
0.002
−0.0012 **
0.000
SIZE0.3917 ***
0.058
0.3884 ***
0.058
0.3878 ***
0.058
0.3652 ***
0.058
AGE−0.3592 ***
0.093
−0.3496 ***
0.092
−0.3113 ***
0.097
−0.2884 ***
0.096
D/E RATIO−0.0569
0.063
−0.0548
0.062
−0.0624
0.062
−0.0595
0.061
HILO_DUMMY0.3221 **
0.152
0.4364 ***
0.162
0.3309 **
0.149
0.2132 ***
0.076
UW_DUMMY0.2750 *
0.166
0.2759 *
0.165
0.2753 *
0.166
0.3132 *
0.196
STOCK_DUMMY0.4982 **
0.193
0.4347 **
0.195
0.5224 ***
0.192
0.4891 **
0.191
VC_DUMMY−0.1470
0.147
−0.1588
0.146
−0.1573
0.147
−0.2067
0.147
YEAR_DUMMYYesYesYesYes
Adj_R_square0.2720.2780.2830.284
F-STATISTIC16.7215.4015.7915.88
PROB(F-STATISTIC)8.34 × 10−216.09 × 10−211.87 × 10−211.42 × 10⁻²¹
Observation338338338338
Note: Values are regression coefficients with t-statistic in parentheses; * p < 0.1, ** p < 0.05, *** p < 0.01.

Appendix B

Table A2. High-tech and low-tech classification: OECD industrial classification.
High-TechLow-Tech
ManufacturingAir and spacecraft and related machinery;
Pharmaceuticals;
Computer, electronic, and optical products;
Weapons and ammunition;
Motor vehicles, trailers, and semi-trailers;
Medical and dental instruments;
Machinery and equipment n.e.c;
Chemicals and chemical products;
Electrical equipment;
Railroad, military vehicles, and transport.
Rubber and plastic products;
Building of ships and boats;
Other manufacturing except medical and dental instruments;
Other non-metallic mineral products;
Basic metals;
Repair and installation of machinery and equipment;
Textiles;
Leather and related products;
Paper and paper products;
Food products, beverages, and tobacco
Wearing apparel;
Fabricated metal products except for weapons and ammunition;
Coke and refined petroleum products;
Furniture;
Wood and products of wood and cork;
Printing and reproduction of recorded media.
Non-ManufacturingScientific research and development;
Software publishing;
IT and other information services.
Professional, scientific, and technical activities, except for scientific R&D;
Telecommunications;
Mining and quarrying;
Publishing of books and periodicals;
Financial and insurance activities;
Electricity, gas and water supply, waste management, and remediation;
Audiovisual and broadcasting activities;
Wholesale and retail trade;
Agriculture, forestry, and fishing;
Construction;
Administrative and support service activities;
Arts, entertainment, repair of household goods, and other services;
Transportation and storage;
Accommodation and food service activities;
Real estate activities.

Notes

1
We report regression results where PAT5 is used as an independent variable in Model 1 and Model 2 in Appendix A.
2
The finding also holds true when we use PATENT_STOCK, which is equal to PAT5 as an independent variable. The coefficient of PAT5 in Model 1 received the positive value of 0.0003 at the 5% significant level (see Model 1 in Appendix A for details).
3
The result when we apply PATENT_STOCK is equal to PAT5, which also shows a consistent result with Model 2. Specifically, the sign of the interaction PAT5*HILO_DUMMY is negative (−0.0032*) and significant at 10% (see Model 2 in Appendix A for details).
4
The coefficients of PAT5 in Model 3 also receive the positive value of 0.0004 at the 5% significant level (see Model 3 in Appendix A for details).
5
The result when we apply PATENT_STOCK is equal to PAT5, which also shows a consistent result with Model 2. Specifically, the signs of the interaction PAT5*HILO_DUMMY are negative (−0.0012) and significant at 10% (see Model 4 in Appendix A for details).

References

  1. Acharya, Viral, and Zhaoxia Xu. 2017. Financial dependence and innovation: The case of public versus private firms. Journal of Financial Economics 124: 223–43. [Google Scholar] [CrossRef] [Green Version]
  2. Aggarwal, Rajesh, Sanjai Bhagat, and Srinivasan Rangan. 2009. The impact of fundamentals on IPO valuation. Financial Management 38: 253–84. [Google Scholar] [CrossRef] [Green Version]
  3. Ahlers, Gerrit K. C., Douglas Cumming, Christina Günther, and Denis Schweizer. 2015. Signaling in equity crowdfunding. Entrepreneurship Theory and Practice 39: 955–80. [Google Scholar] [CrossRef]
  4. Ahmad-Zaluki, Nurwati A., and Lim Boon Kect. 2012. The investment performance of mesdaq market initial public offerings (IPOs). Asian Academy of Management Journal of Accounting & Finance 8: 1–23. [Google Scholar]
  5. An, Heng Hunter, and Kam C. Chan. 2008. Credit ratings and IPO pricing. Journal of Corporate Finance 14: 584–95. [Google Scholar] [CrossRef]
  6. An, Le, Yoshiyuki Matsuura, and Norliza Yahya. 2022. Patent Signals of IPO Performance: Evidence from High- and Low-Tech Industries in Japan. The Asian Journal of Technology Management (AJTM) 15: 21–39. [Google Scholar] [CrossRef]
  7. Asteriou, Dimitros, and Stephen G. Hall. 2011. Applied Econometrics. London: Palgrave Macmillan. [Google Scholar]
  8. Baum, Joel A. C., and Brian S. Silverman. 2004. Picking winners or building them? Alliance, intellectual, and human capital as selection criteria in venture financing and performance of biotechnology startups. Journal of Business Venturing 19: 411–36. [Google Scholar] [CrossRef]
  9. Bergh, Donald D., Brian L. Connelly, David J. Ketchen Jr., and Lu M. Shannon. 2014. Signalling theory and equilibrium in strategic management research: An assessment and a research agenda. Journal of Management Studies 51: 1334–60. [Google Scholar] [CrossRef]
  10. Bessler, Wolfgang, and Claudia Bittelmeyer. 2008. Patents and the performance of technology firms: Evidence from initial public offerings in Germany. Financial Markets and Portfolio Management 22: 323–56. [Google Scholar] [CrossRef]
  11. Brau, James C., and Stanley E. Fawcett. 2006. Evidence on what CFOs think about the IPO process: Practice, theory, and managerial implications. Journal of Applied Corporate Finance 18: 107–17. [Google Scholar] [CrossRef]
  12. Brav, Alon, and Paul A. Gompers. 2003. The role of lockups in initial public offerings. The Review of Financial Studies 16: 1–29. [Google Scholar] [CrossRef]
  13. Brown, James R., Gustav Martinsson, and Bruce C. Petersen. 2012. Do financing constraints matter for R&D? European Economic Review 56: 1512–29. [Google Scholar]
  14. Buenechea-Elberdin, Marta, Aino Kianto, and Josune Sáenz. 2018. Intellectual capital drivers of product and managerial innovation in high-tech and low-tech firms. R&D Management 48: 290–307. [Google Scholar]
  15. Buenechea-Elberdin, Marta, Josune Sáenz, and Aino Kianto. 2017. Exploring the role of human capital, renewal capital and entrepreneurial capital in innovation performance in high-tech and low-tech firms. Knowledge Management Research & Practice 15: 369–79. [Google Scholar]
  16. Cao, Jerry, and Po-Hsuan Hsu. 2011. The informational role of patents in venture capital financing. SSRN Electronic Journal. [Google Scholar] [CrossRef]
  17. Cao, Zixia, Reo Song, Alina Sorescu, and Ansley Chua. 2022. Innovation Potential, Insider Sales, and IPO Performance: How Firms Can Mitigate the Negative Effect of Insider Selling. Journal of Marketing. [Google Scholar] [CrossRef]
  18. Carpenter, Mason A., Timothy G. Pollock, and Myleen M. Leary. 2003. Testing a model of reasoned risk-taking: Governance, the experience of principals and agents, and global strategy in high-technology IPO firms. Strategic Management Journal 24: 803–20. [Google Scholar] [CrossRef] [Green Version]
  19. Carter, Richard B., Frederick H. Dark, and Ajai K. Singh. 1998. Underwriter reputation, initial returns, and the long-run performance of IPO stocks. The Journal of Finance 53: 285–311. [Google Scholar] [CrossRef]
  20. Certo, S. Trevis. 2003. Influencing initial public offering investors with prestige: Signaling with board structures. Academy of Management Review 28: 432–46. [Google Scholar] [CrossRef]
  21. Certo, S. Trevis, Catherine M. Daily, and Dan R. Dalton. 2001. Signaling firm value through board structure: An investigation of initial public offerings. Entrepreneurship Theory and Practice 26: 33–50. [Google Scholar] [CrossRef]
  22. Certo, S. Trevis, R. Michael Holmes Jr., and Tim R. Holcomb. 2007. The influence of people on the performance of IPO firms. Business Horizons 50: 271–76. [Google Scholar] [CrossRef]
  23. Certo, S. Trevis, Tim R. Holcomb, and R. Michael Holmes Jr. 2009. IPO research in management and entrepreneurship: Moving the agenda forward. Journal of management 35: 1340–78. [Google Scholar] [CrossRef]
  24. Chahine, Salim, and Marc Goergen. 2013. The effects of management-board ties on IPO performance. Journal of Corporate Finance 21: 153–79. [Google Scholar] [CrossRef]
  25. Chatzoglou, Prodromos, and Dimitrios Chatzoudes. 2017. The role of innovation in building competitive advantages: An empirical investigation. European Journal of Innovation Management 21: 44–69. [Google Scholar] [CrossRef]
  26. Coad, Alex, Agustí Segarra, and Mercedes Teruel. 2016. Innovation and firm growth: Does firm age play a role? Research Policy 45: 387–400. [Google Scholar] [CrossRef] [Green Version]
  27. Cohen, Boyd D., and Thomas J. Dean. 2005. Information asymmetry and investor valuation of IPOs: Top management team legitimacy as a capital market signal. Strategic Management Journal 26: 683–90. [Google Scholar] [CrossRef]
  28. Cohen, Wesley M., Richard Nelson, and John P. Walsh. 2000. Protecting Their Intellectual Assets: Appropriability Conditions and Why US Manufacturing Firms Patent (Or Not). Cambridge: National Bureau of Economic Research. [Google Scholar]
  29. Connelly, Brian L., S. Trevis Certo, R. Duane Ireland, and Christopher R. Reutzel. 2011. Signaling theory: A review and assessment. Journal of Management 37: 39–67. [Google Scholar]
  30. Conti, Annamaria, Jerry Thursby, and Marie Thursby. 2013. Patents as signals for startup financing. The Journal of Industrial Economics 61: 592–622. [Google Scholar] [CrossRef] [Green Version]
  31. Corwin, Shane A., and Jeffrey H. Harris. 2001. The initial listing decisions of firms that go public. Financial Management, 35–55. [Google Scholar]
  32. Cozza, Claudio, Franco Malerba, Maria Luisa Mancusi, Giulio Perani, and Andrea Vezzulli. 2012. Innovation, profitability and growth in medium and high-tech manufacturing industries: Evidence from Italy. Applied Economics 44: 1963–76. [Google Scholar] [CrossRef]
  33. Czarnitzki, Dirk, and Cindy Lopes-Bento. 2014. Innovation subsidies: Does the funding source matter for innovation intensity and performance? Empirical evidence from Germany. Industry and Innovation 21: 380–409. [Google Scholar] [CrossRef] [Green Version]
  34. Daily, Catherine M., S. Trevis Certo, and Dan R. Dalton. 2005. Investment bankers and IPO pricing: Does prospectus information matter? Journal of Business Venturing 20: 93–111. [Google Scholar] [CrossRef]
  35. De Carolis, Donna Marie. 2010. Technological Characteristics of Industries. Chippenham: Wiley-Blackwell. [Google Scholar]
  36. De Rassenfosse, Gaètan, Helene Dernis, Dominique Guellec, Lucio Picci, and Bruno van Pottelsberghe de la Potterie. 2013. The worldwide count of priority patents: A new indicator of inventive activity. Research Policy 42: 720–37. [Google Scholar] [CrossRef] [Green Version]
  37. Deeds, David L., Dona Decarolis, and Joseph E. Coombs. 1997. The impact of firmspecific capabilities on the amount of capital raised in an initial public offering: Evidence from the biotechnology industry. Journal of Business Venturing 12: 31–46. [Google Scholar] [CrossRef]
  38. Detragiache, Enrica, Poonam Gupta, and Asli Demirgüç-Kunt. 2000. Inside the Crisis: An Empirical Analysis of Banking Systems in Distress. Washington, DC: World Bank. [Google Scholar]
  39. Dong, Ming, Jean-Sébastien Michel, and J. Ari Pandes. 2011. Underwriter quality and long-run IPO performance. Financial Management 40: 219–51. [Google Scholar] [CrossRef]
  40. Feldman, Robin, and Evan Frondorf. 2015. Patent demands and initial public offerings. Stanford Technology Law Review 19: 52. [Google Scholar]
  41. Galindo-Rueda, Fernando, and Fabien Verger. 2016. OECD Taxonomy of Economic Activities Based on R&D Intensity. Paris: OECD. [Google Scholar]
  42. Gao, Simon, and Tony Chieh-Tse Hou. 2019. An empirical examination of IPO underpricing between high-technology and non-high-technology firms in Taiwan. Journal of Emerging Market Finance 18: 23–51. [Google Scholar] [CrossRef] [Green Version]
  43. Gompers, Paul A. 1996. Grandstanding in the venture capital industry. Journal of Financial Economics 42: 133–56. [Google Scholar] [CrossRef]
  44. Graham, Stuart, and Ted Sichelman. 2008. Why Do Start-Ups Patent? Berkeley Technology Law Journal 23: 1063. [Google Scholar]
  45. Greenberg, Gili. 2013. Small firms, big patents? Estimating patent value using data on israeli start-ups’ financing rounds. European Management Review 10: 183–96. [Google Scholar] [CrossRef]
  46. Griliches, Zvi. 1998. Patent statistics as economic indicators: A survey. In R&D and Productivity: The Econometric Evidence. Chicago: University of Chicago Press, pp. 287–343. [Google Scholar]
  47. Gu, Anthony Yanxiang. 2003. State ownership, firm size, and IPO performance: Evidence from Chinese “A” share issues. American Business Review 21: 101. [Google Scholar]
  48. Guiso, Luigi. 1998. High-tech firms and credit rationing. Journal of Economic Behavior and Organization 35: 39–59. [Google Scholar] [CrossRef]
  49. Gulati, Ranjay, and Monica C. Higgins. 2003. Which ties matter when? The contingent effects of interorganizational partnerships on IPO success. Strategic Management Journal 24: 127–44. [Google Scholar] [CrossRef]
  50. Guo, Wen-Chung, Shin-Rong Shiah-Hou, and Wei-Jer Chien. 2012. A study on intellectual capital and firm performance in biotech companies. Applied Economics Letters 19: 1603–8. [Google Scholar] [CrossRef]
  51. Haeussler, Carolin, Dietmar Harhoff, and Elisabeth Mueller. 2014. How patenting informs VC investors—The case of biotechnology. Research Policy 43: 1286–98. [Google Scholar] [CrossRef]
  52. Hagedoorn, John. 2003. Sharing intellectual property rights—An exploratory study of joint patenting amongst companies. Industrial and Corporate Change 12: 1035–50. [Google Scholar] [CrossRef]
  53. Hall, Bronwyn H., Adam Jaffe, and Manuel Trajtenberg. 2005. Market value and patent citations. RAND Journal of Economics 36: 16–38. [Google Scholar]
  54. Hall, Bronwyn H., and Christian Helmers. 2019. The impact of international patent systems: Evidence from accession to the European Patent Convention. Research Policy 48: 103810. [Google Scholar] [CrossRef]
  55. Hall, Bronwyn H., and Rosemarie Ham Ziedonis. 2001. The patent paradox revisited: An empirical study of patenting in the US semiconductor industry, 1979–1995. Rand Journal of Economics, 101–28. [Google Scholar]
  56. Häussler, Carolin, Dietmar Harhoff, and Elisabeth Müller. 2012. To Be Financed or Not…-The Role of Patents for Venture Capital-Financing. ZEW-Centre for European Economic Research Discussion Paper. Mannheim: ZEW. [Google Scholar]
  57. He, Ping. 2007. A theory of IPO waves. The Review of Financial Studies 20: 983–1020. [Google Scholar] [CrossRef]
  58. Heeley, Michael B., Sharon F. Matusik, and Neelam Jain. 2007. Innovation, appropriability, and the underpricing of initial public offerings. Academy of Management Journal 50: 209–25. [Google Scholar] [CrossRef]
  59. Herawati, Aty. 2017. The Factors Affecting Initial Return on IPO Company in IDX 2007–2012. International Journal of Economic Perspectives 11: 1499–509. [Google Scholar]
  60. Higgins, Matthew J., Paula E. Stephan, and Jerry G. Thursby. 2011. Conveying quality and value in emerging industries: Star scientists and the role of signals in biotechnology. Research Policy 40: 605–17. [Google Scholar] [CrossRef]
  61. Higgins, Monica C., and Ranjay Gulati. 2006. Stacking the deck: The effects of top management backgrounds on investor decisions. Strategic Management Journal 27: 1–25. [Google Scholar] [CrossRef]
  62. Hoenen, Sebastian, Christos Kolympiris, Wilfred Schoenmakers, and Nicholas Kalaitzandonakes. 2014. The diminishing signaling value of patents between early rounds of venture capital financing. Research Policy 43: 956–89. [Google Scholar] [CrossRef] [Green Version]
  63. Hoenig, Daniel, and Joachim Henkel. 2015. Quality signals? the role of patents, alliances, and team experience in venture capital financing. Research Policy 44: 1049–64. [Google Scholar] [CrossRef]
  64. Hsu, David H., and Rosemarie H. Ziedonis. 2008. Patents as Quality Signals for Entrepreneurial Ventures. Briarcliff Manor: Academy of Management. [Google Scholar]
  65. Hsu, David H., and Rosemarie H. Ziedonis. 2013. Resources as dual sources of advantage: Implications for valuing entrepreneurial-firm patents. Strategic Management Journal 34: 761–81. [Google Scholar] [CrossRef]
  66. Jain, Bharat A., and Omesh Kini. 1999. The life cycle of initial public offering firms. Journal of Business Finance & Accounting 26: 1281–307. [Google Scholar]
  67. Jelic, Ranko, Brahim Saadouni, and Richard Briston. 2001. Performance of Malaysian IPOs: Underwriters reputation and management earnings forecasts. Pacific-Basin Finance Journal 9: 457–86. [Google Scholar] [CrossRef]
  68. Khoury, Theodore A., Marc Junkunc, and David L. Deeds. 2013. The social construction of legitimacy through signaling social capital: Exploring the conditional value of alliances and underwriters at IPO. Entrepreneurship Theory and Practice 37: 569–601. [Google Scholar] [CrossRef]
  69. Kim, Jaemin, Kuntara Pukthuanthong-Le, and Thomas Walker. 2008. Leverage and IPO under-pricing: High-tech versus low-tech IPOs. Management Decision 46: 106–30. [Google Scholar] [CrossRef]
  70. Kirkulak, Berna. 2008. The initial and long-run returns of Japanese venture capital-backed and non-venture capital-backed IPOs. International Journal of Managerial Finance 4: 112–35. [Google Scholar] [CrossRef]
  71. Lange, Julian E., William Bygrave, Sakura Nishimoto, James Roedel, and Walter Stock. 2001. Smart money? The impact of having top venture capital investors and underwriters backing a venture. Venture Capital: An International Journal of Entrepreneurial Finance 3: 309–26. [Google Scholar] [CrossRef]
  72. Leone, Andrew J., Steve Rock, and Michael Willenborg. 2007. Disclosure of intended use of proceeds and underpricing in initial public offerings. Journal of Accounting Research 45: 111–53. [Google Scholar] [CrossRef]
  73. Levin, Richard C., Alvin K. Klevorick, Richard R. Nelson, Sidney G. Winter, Richard Gilbert, and Zvi Griliches. 1987. Appropriating the returns from industrial research and development. Brookings Papers on Economic Activity 1987: 783–831. [Google Scholar] [CrossRef] [Green Version]
  74. Levitas, Edward, and M. Ann McFadyen. 2009. Managing liquidity in research-intensive firms: Signaling and cash flow effects of patents and alliance activities. Strategic Management Journal 30: 659–78. [Google Scholar] [CrossRef]
  75. Li, Yue, and Bruce J. McConomy. 2004. Simultaneous signaling in IPOs via management earnings forecasts and retained ownership: An empirical analysis of the substitution effect. Journal of Accounting, Auditing & Finance 19: 1–28. [Google Scholar]
  76. LiPuma, Joseph A. 2012. Internationalization and the IPO performance of new ventures. Journal of Business Research 65: 914–21. [Google Scholar] [CrossRef]
  77. Long, Clarisa. 2002. Patent signals. The University of Chicago Law Review 69: 625–79. [Google Scholar] [CrossRef]
  78. Loughran, Tim, and Jay Ritter. 2004. Why has IPO underpricing changed over time? Financial Management 33: 5–37. [Google Scholar] [CrossRef] [Green Version]
  79. MacMillan, Ian C., Robin Siegel, and P. N. Subba Narasimha. 1985. Criteria used by venture capitalists to evaluate new venture proposals. Journal of Business Venturing 1: 119–28. [Google Scholar] [CrossRef]
  80. Mann, Ronald J., and Thomas W. Sager. 2007. Patents, venture capital, and software start-ups. Research Policy 36: 193–208. [Google Scholar] [CrossRef] [Green Version]
  81. Mazzucato, Mariana. 2013. Financing innovation: Creative destruction vs. destructive creation. Industrial and Corporate Change 22: 851–67. [Google Scholar] [CrossRef] [Green Version]
  82. Mendonça, Sandro. 2009. Brave old world: Accounting for ‘high-tech’knowledge in ‘low-tech’industries. Research Policy 38: 470–82. [Google Scholar] [CrossRef]
  83. Morricone, Serena, Federico Munari, and Raffaele Oriani. 2010. Patent Commercialization Strategy and IPO Underpricing: Evidence from the US Semiconductor Industry. Available online: http://amsacta.unibo.it/2697/1/Morricone_paper_IPO_preprint.pdf (accessed on 18 January 2010).
  84. Morricone, Serena, Federico Munari, Raffaele Oriani, and Gaetan De Rassenfosse. 2017. Commercialization strategy and IPO underpricing. Research Policy 46: 1133–41. [Google Scholar] [CrossRef] [Green Version]
  85. Motohashi, Kazuyuki. 2008. Licensing or not licensing? An empirical analysis of the strategic use of patents by Japanese firms. Research Policy 37: 1548–55. [Google Scholar] [CrossRef]
  86. Motohashi, Kazuyuki. 2009. Catching up or lagging behind? Assessment of technological capacity of China by patent database. China Economic Journal 2: 1–24. [Google Scholar] [CrossRef]
  87. Mousa, Fariss–Terry, and Richard Reed. 2013. The impact of slack resources on high–tech IPOs. Entrepreneurship Theory and Practice 37: 1123–47. [Google Scholar] [CrossRef] [Green Version]
  88. Munari, Federico, and Laura Toschi. 2015. Do patents affect VC financing? Empirical evidence from the nanotechnology sector. International Entrepreneurship and Management Journal 11: 623–44. [Google Scholar] [CrossRef]
  89. Nagata, Kyoko, and Toyohiko Hachiya. 2007. Earnings management and the pricing of initial public offerings. Review of Pacific Basin Financial Markets and Policies 10: 541–59. [Google Scholar] [CrossRef]
  90. Pástor, Ľuboš, Lucian A. Taylor, and Pietro Veronesi. 2009. Entrepreneurial learning, the IPO decision, and the post-IPO drop in firm profitability. The Review of Financial Studies 22: 3005–46. [Google Scholar] [CrossRef] [Green Version]
  91. Peng, Xuan, Yibo Jia, Kam C. Chan, and Xiongyuan Wang. 2021. Let us work together: The impact of customer strategic alliances on IPO underpricing and post-IPO performance. Journal of Corporate Finance 67: 101899. [Google Scholar] [CrossRef]
  92. Phillips, Ryan L., and Rita Ormsby. 2016. Industry classification schemes: An analysis and review. Journal of Business & Finance Librarianship 21: 1–25. [Google Scholar]
  93. Pisano, Gary P. 2006. Can science be a business? Lessons from biotech. Harvard Business Review 84: 114–24. [Google Scholar] [PubMed]
  94. Prędkiewicz, Katarzyna, Marek Pauka, and Paweł Prędkiewicz. 2021. IPO Success of High-Technology Companies. European Research Studies Journal 24: 799–816. [Google Scholar] [CrossRef] [PubMed]
  95. Ragozzino, Roberto, and Dane P. Blevins. 2016. Venture–backed firms: How does venture Capital involvement affect their likelihood of going public or being acquired? Entrepreneurship Theory and Practice 40: 991–1016. [Google Scholar] [CrossRef]
  96. Ritter, Jay R. 1998. Initial public offerings. Contemporary Finance Digest 2: 5–30. [Google Scholar]
  97. Ritter, Jay R., and Ivo Welch. 2002. A review of IPO activity, pricing, and allocations. The Journal of Finance 57: 1795–828. [Google Scholar] [CrossRef] [Green Version]
  98. Schankerman, Mark. 1998. How valuable is patent protection? Estimates by technology field. The RAND Journal of Economics 29: 77–107. [Google Scholar] [CrossRef]
  99. Schilling, Melissa A., and Ravi Shankar. 2019. Strategic Management of Technological Innovation. New York: McGraw-Hill Irwin Publisher. [Google Scholar]
  100. Solow, Robert M. 1957. Technical change and the aggregate production function. The Review of Economics and Statistics 39: 312–20. [Google Scholar] [CrossRef] [Green Version]
  101. Spence, A. Michael. 1973. Time and communication in economic and social interaction. The Quarterly Journal of Economics 87: 651–60. [Google Scholar] [CrossRef]
  102. Stuart, Toby E., Ha Hoang, and Ralph C. Hybels. 1999. Interorganizational endorsements and the performance of entrepreneurial ventures. Administrative Science Quarterly 44: 315–49. [Google Scholar] [CrossRef] [Green Version]
  103. Su, Chen, and Kenbata Bangassa. 2011. The impact of underwriter reputation on initial returns and long-run performance of Chinese IPOs. Journal of International Financial Markets, Institutions and Money 21: 760–91. [Google Scholar] [CrossRef]
  104. Taplin, Ruth. 2005. Risk Management and Innovation in Japan, Britain, and the United States. London: Routledge. [Google Scholar]
  105. Reuters. 2020. THE REFINITIV BUSINESS CLASSIFICATION METHODOLOGY. Available online: https://www.refinitiv.com/content/dam/marketing/en_us/documents/methodology/trbc-business-classifcation-methodology.pdf (accessed on 24 September 2020).
  106. Useche, Diego. 2014. Are patents signals for the IPO market? An EU-US comparison for the software industry. Research Policy 43: 1299–311. [Google Scholar] [CrossRef]
  107. Vaidya, Kirit, David Bennett, and Xiaming Liu. 2007. Is China’s manufacturing sector becoming more high-tech? Evidence on shifts in comparative advantage, 1987–2005. Journal of Manufacturing Technology Management 18: 1000–21. [Google Scholar] [CrossRef]
  108. Wagner, Stefan, and Iain Cockburn. 2010. Patents and the survival of Internet-related IPOs. Research Policy 39: 214–28. [Google Scholar] [CrossRef] [Green Version]
  109. Wang, Taiyuan, Israr Qureshi, David Deeds, and Yi Ren. 2019. How do technology ventures signal IPO quality? A configurational approach. Journal of Business Research 99: 105–14. [Google Scholar] [CrossRef]
  110. Welbourne, Theresa M., and Alice O. Andrews. 1996. Predicting the performance of initial public offerings: Should human resource management be in the equation? Academy of Management Journal 39: 891–919. [Google Scholar] [CrossRef]
  111. Yang, Qin, Monica Zimmerman, and Crystal Jiang. 2011. An empirical study of the impact of CEO characteristics on new firms’ time to IPO. Journal of Small Business Management 49: 163–84. [Google Scholar] [CrossRef]
  112. Zhang, Yeqing, and Xueyong Zhang. 2020. Patent growth and the long-run performance of VC-backed IPOs. International Review of Economics & Finance 69: 33–47. [Google Scholar]
  113. Zimmerman, Barry J. 2008. Investigating self-regulation and motivation: Historical background, methodological developments, and future prospects. American Educational Research Journal 45: 166–83. [Google Scholar] [CrossRef]
  114. Zingales, Luigi. 2000. In search of new foundations. The Journal of Finance 55: 1623–53. [Google Scholar] [CrossRef]
Figure 1. Conceptual framework of study.
Economies 11 00101 g001
Figure 2. Distribution of Japanese IPOs across the years.
Economies 11 00101 g002
Table 1. Summary of studies on patenting signal.
PaperSampleSectorsSignal
Wang et al. (2019) IPO ventures in the USBiotechnologyPatent citation
Morricone et al. (2017) IPO companies in the USSemiconductor industryPatent granted
Munari and Toschi (2015)VC-backed companiesNanotechnology Patent application
Hoenig and Henkel (2015) German and US VCsHigh-technology Patent application
Patent granted
Häussler et al. (2012) United Kingdom and German VCs BiotechnologyPatent application
Useche (2014) US and EU IPO companiesSoftwarePatent application
Greenberg (2013) Israel start-upsSemiconductors, Communications, Life sciences, Cleantech, IT and enterprise software, and the internetPatent application
Patent citation
Cao and Hsu (2011)VC-backed start-up firmsComputer-relatedPatent application
Morricone et al. (2010)US IPO companiesSemiconductor Patent application
Häussler et al. (2012) German and British VCs Biotechnology Patent application
Hsu and Ziedonis (2008) US start-upsSemiconductor Patent application
patent citation
Mann and Sager (2007)US VC-backed companiesSoftwarePatent application
Patent granted
Baum and Silverman (2004)Canada startups BiotechnologyPatent application
Patent granted
Table 2. Variable definition.
VariableDefinitionPast StudiesDatabase
IPO performance *
(PROCEED)
The amount of money raised by a firm via an IPO (million yen) Useche (2014); Zimmerman (2008) Thomson Reuter Eikon
Patent stock
(PAT4)
(PAT5)
Patent application by the company in the last 4 years prior to the IPO
Patent application by the company in the last 5 years prior to the IPO
Useche (2014);
Morricone et al. (2010)
Jplatpat
Firm Size *
(SIZE)
Total number of employees at IPO Welbourne and Andrews (1996) FinancialQuest
Firm Age *
(AGE)
Age of firm at IPO Cao et al. (2022) FinancialQuest
Financial Ratio *
(D/E RATIO)
The ratio of debt to equity in the IPO yearHerawati (2017) FinancialQuest
Hi-tech Dummy
(HILO_DUMMY)
Dummy (1 if in high-tech industry and 0 if in low-tech industry) Guiso (1998); Galindo-Rueda and Verger (2016)OECD industrial classification
Thomson Reuter Eikon classification
Underwriter Dummy
(UW_DUMMY)
Dummy (1 if in the top 5 Japanese underwriters, 0 otherwise)Brau and Fawcett (2006) Thomson Reuter Eikon, Statista
Stock Exchange Dummy
(STOCK_DUMMY)
Dummy (1 if in TSE, 0 otherwise)Useche (2014) Thomson Reuter Eikon, Japan Exchange Group
Venture Capitalist backing Dummy
(VC_DUMMY)
Dummy (1 if the firm is backed by the venture capitalist sector, 0 otherwise)Certo et al. (2001) Thomson Reuter Eikon
Year Dummy
Year 2000 to Year 2015
Dummies (from Year 2000 to Year 2015)Morricone et al. (2010) FinanicalQuest
Note: * We use log natural for the variable in the regression.
Table 3. Descriptive statistic.
CovariateFull Sample (N = 338)High-Tech (N = 242)Low-Tech (N = 96)
MeanSDMeanSDMeanSD
PROCCED 4878.91612,479.6695539.63514,215.9863213.3515989.836
PAT4 69.160303.07766.752355.35129.03166.911
PAT556.038404.20083.219474.73833.71977.750
SIZE974.9563096.3941066.7113404.823742.6562127.505
AGE26.76020.56524.96719.74531.28121.961
D/E RATIO 2.3314.0382.0313.1423.0885.655
HILO_DUMMY0.7160.4521.0000.0000.0000.000
UW_DUMMY0.7720.4200.7810.4140.7500.435
STOCK_DUMMY 0.2220.4160.2400.4280.1770.384
VC_DUMMY0.3610.4810.3510.4780.3850.489
Table 4. Correlation matrix.
Variables(1)(2)(3)(4)(5)(6)(7)(8)(9)(10)
PROCEED (1)1
PAT4 (2)0.5291
PAT5 (3)0.4970.9961
SIZE (4)0.4720.3110.2941
AGE (5)(-)
0.051
(-)
0.117
(-)
0.119

0.370

1
D/E Ratio (6)0.0450.0410.0360.3150.3721
HILO_DUMMY (7)
0.084

0.056

0.055
(-)
0.063
(-)
0.114
(-)
0.125

1
UW_DUMMY (8)0.0660.0150.0180.0980.1710.0370.0331
STOCK_DUMMY (9)0.3800.2290.2110.5100.2410.1480.0670.1181
VC_BACKED (10)(-)
0.055
(-)
0.023
(-)
0.026
(-)
0.234
(-)
0.115
(-)
0.182
(-)
0.032

0.099
(-)
0.193

1
Table 5. Result of main analysis.
Model 1
(H1)
Model 2
(H2)
Intercept5.7756 ***
0.391
5.6705 ***
0.394
PAT40.0005 **
0.000
0.0040 **
0.002
PAT4*HILO_DUMMY −0.0035 *
0.002
SIZE0.3871 ***
0.058
0.3847 ***
0.058
AGE−0.3537 ***
0.093
−0.3442 ***
0.0093
D/E RATIO−0.0575
0.062
−0.0557
0.062
HILO_DUMMY0.3203 **
0.151
0.4288 ***
0.162
UW_DUMMY0.2776 *
0.166
0.2780 *
0.165
STOCK_DUMMY0.4890 **
0.193
0.4285 **
0.195
VC_DUMMY−0.1517
0.147
−0.1611
0.146
YEAR_DUMMYYesYes
Adj_R_square0.2730.278
F-STATISTIC16.8415.44
PROB(F-STATISTIC)5.96 × 10−215.29 × 10⁻²¹
Observation338338
Note: Values are regression coefficients with t-statistic in parentheses; * p < 0.1, ** p < 0.05, *** p < 0.01.
Table 6. Results of robustness check.
Model 1
(H1)
Model 2
(H2)
Intercept5.6641 ***
0.409
5.6265 ***
0.406
PAT40.0005 **
0.000
0.0016 ***
0.001
PAT4*HILO_DUMMY −0.0013 **
0.00
SIZE0.3830 ***
0.058
0.3640 ***
0.058
AGE−0.3053 ***
0.097
−0.2842 ***
0.096
D/E RATIO−0.0630
0.061
−0.0614
0.061
HILO_DUMMY0.3323 **
0.149
0.2085 ***
0.077
UW_DUMMY0.2780 *
0.166
0.3146 *
0.165
STOCK_DUMMY0.5121 ***
0.192
0.4818 **
0.192
VC_DUMMY−0.1622
0.146
−0.2084
0.147
YEAR_DUMMYYesYes
Adj_R_square0.2740.283
F-STATISTIC16.9215.79
PROB(F-STATISTIC)4.76 × 10−211.87 × 10⁻²¹
Observation338338
Note: Values are regression coefficients with t-statistic in parentheses; * p < 0.1, ** p < 0.05, *** p < 0.01.
Disclaimer/Publisher’s Note: The statements, opinions and data contained in all publications are solely those of the individual author(s) and contributor(s) and not of MDPI and/or the editor(s). MDPI and/or the editor(s) disclaim responsibility for any injury to people or property resulting from any ideas, methods, instructions or products referred to in the content.

